Morphological Response of Soybean (Glycine max (L.) Merr.) Cultivars to Light Intensity and Red to Far-Red Ratio


Abstract
:1. Introduction
2. Materials and Methods
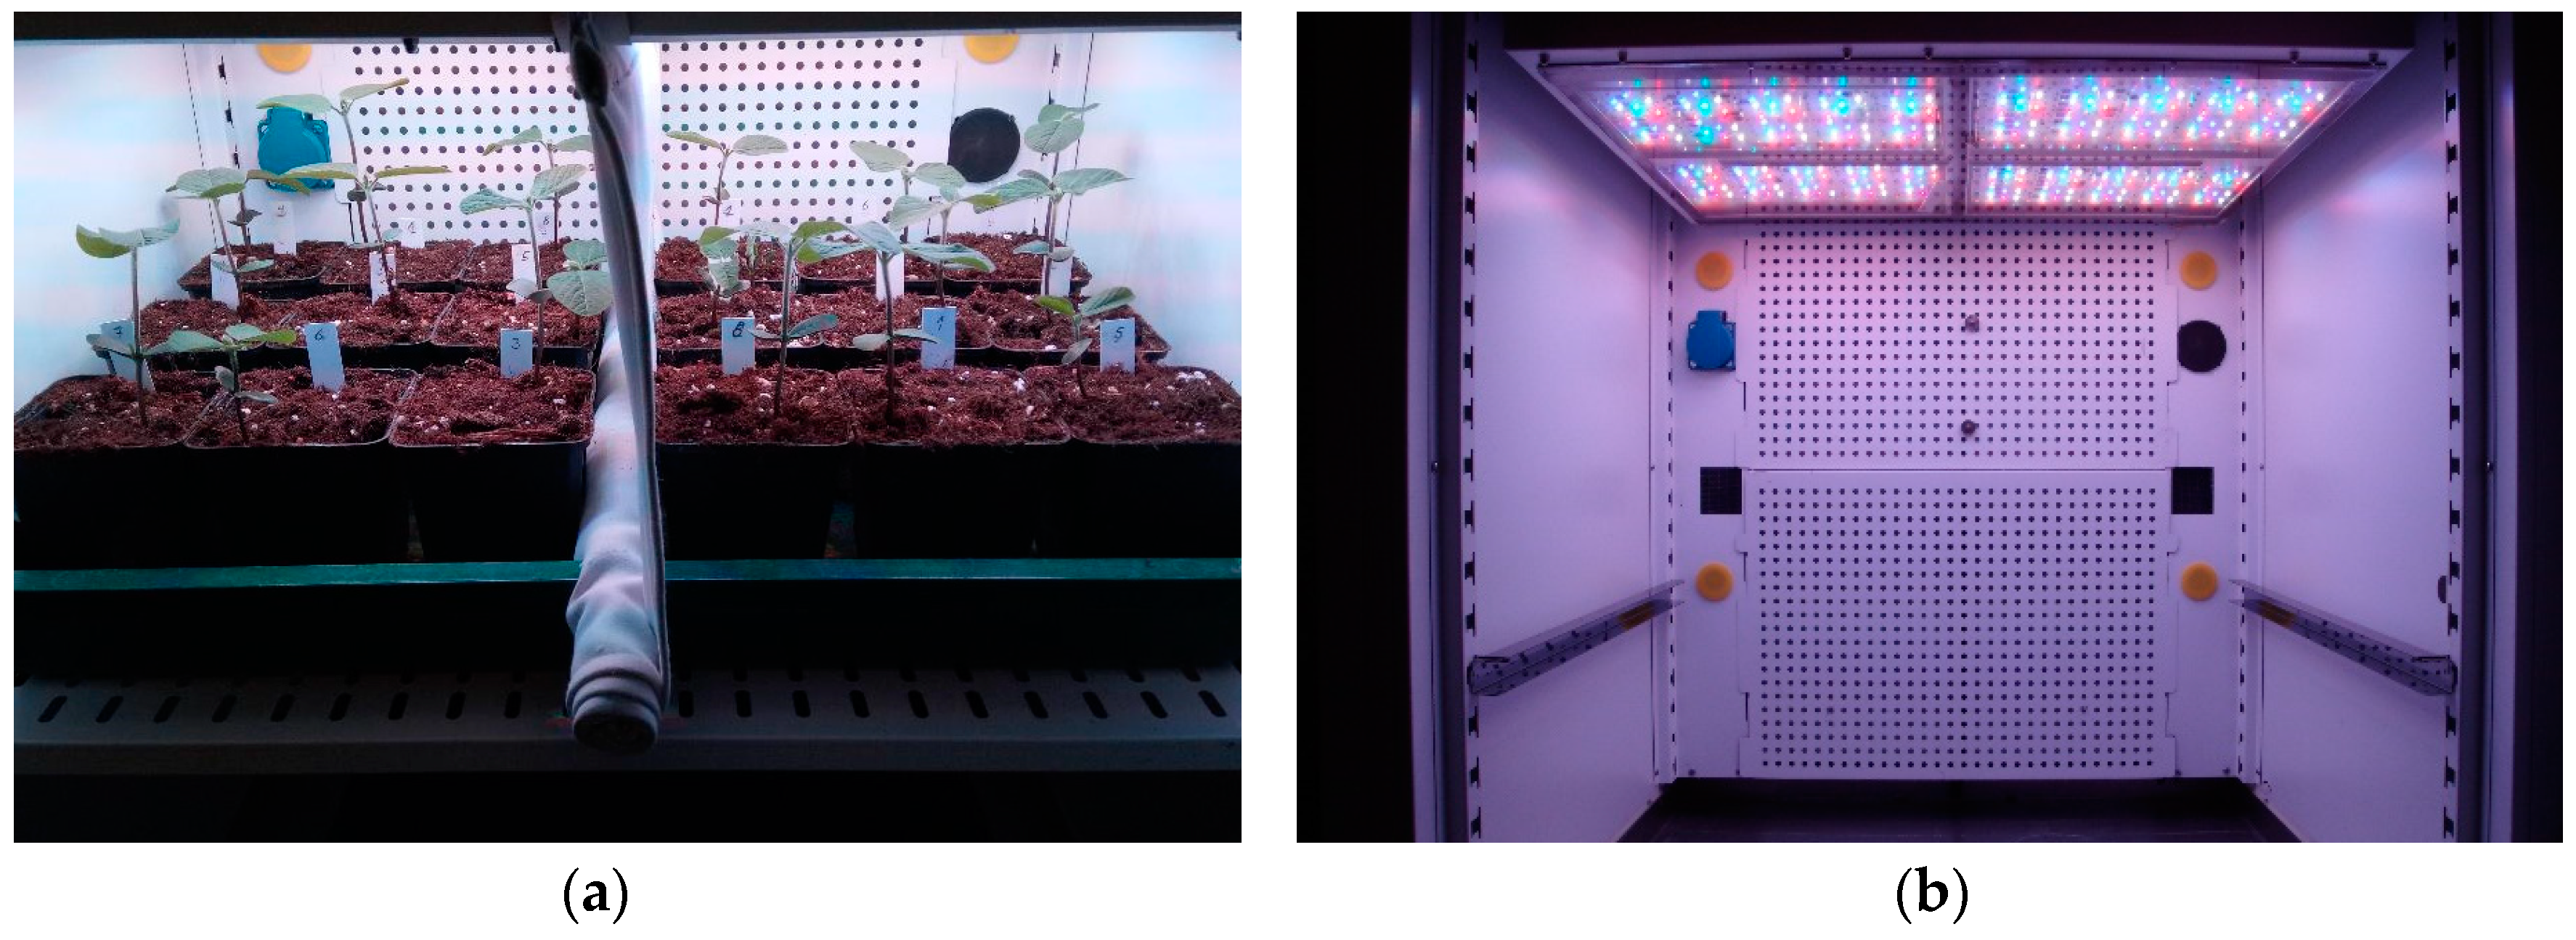
2.1. Experimental Setup
2.2. Light Treatments
2.3. Plant Measurements
2.4. Statistical Design and Analysis
3. Results
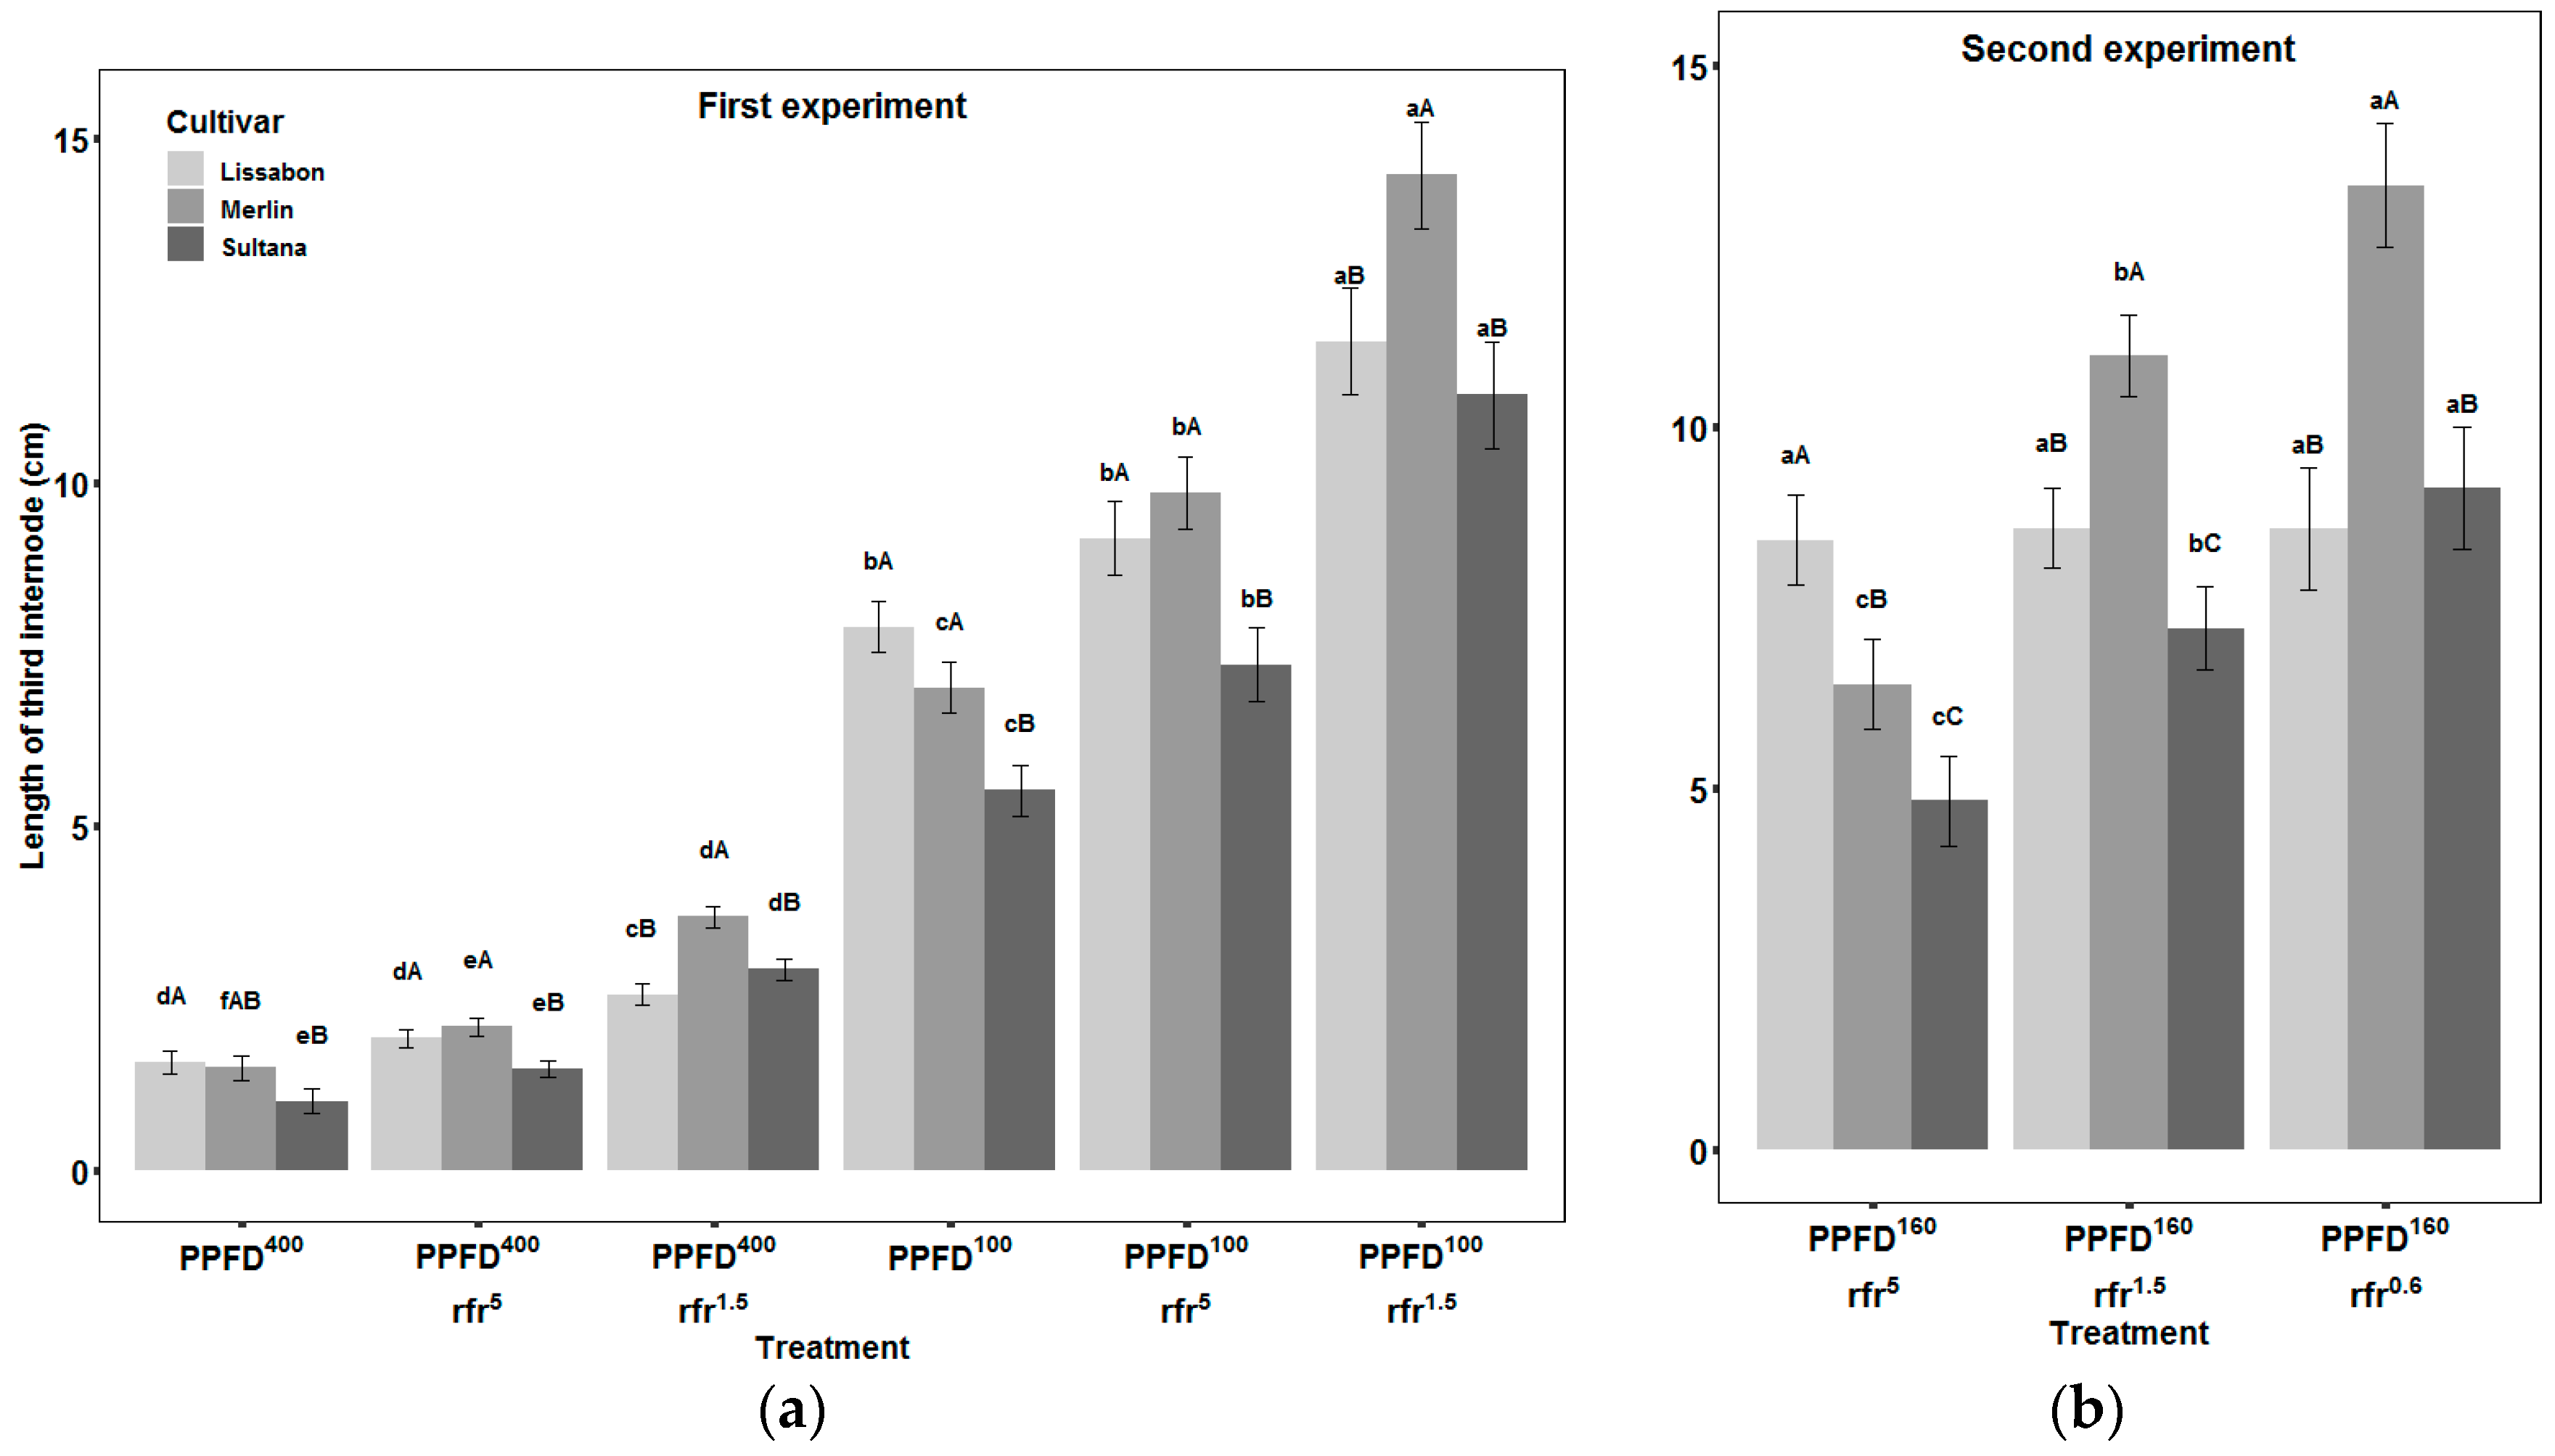
3.1. Internodes
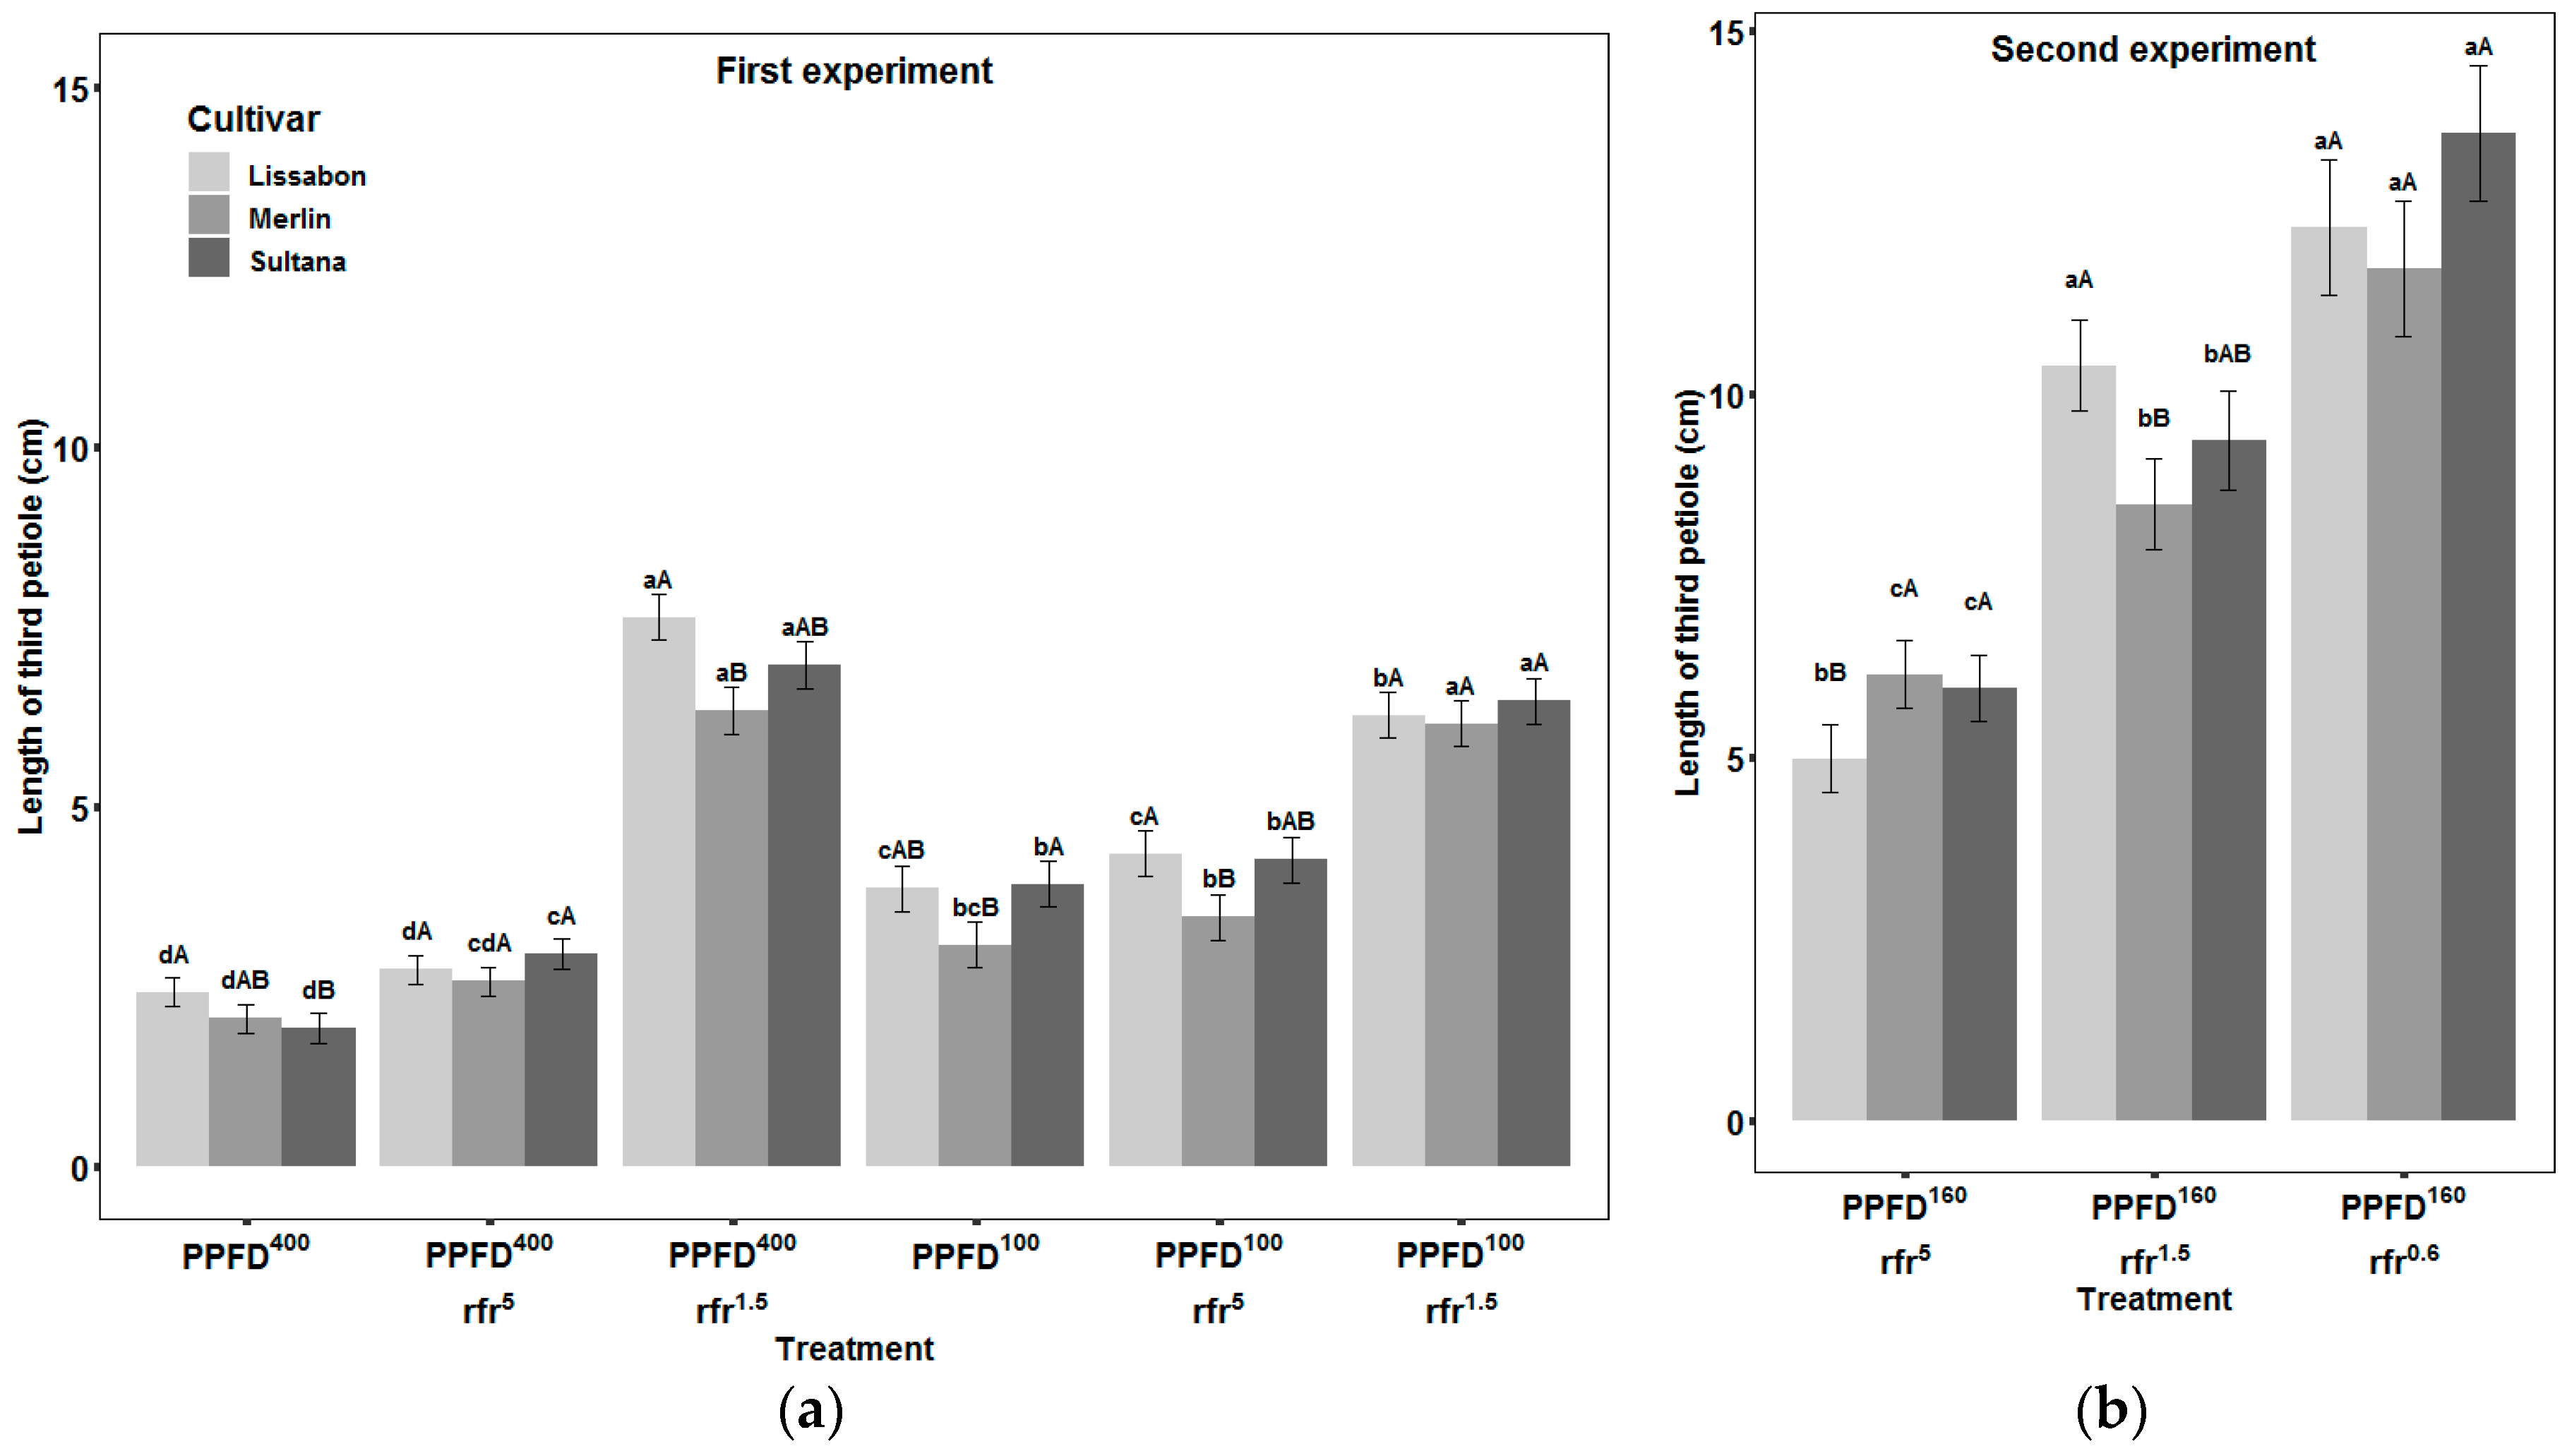
3.2. Petioles
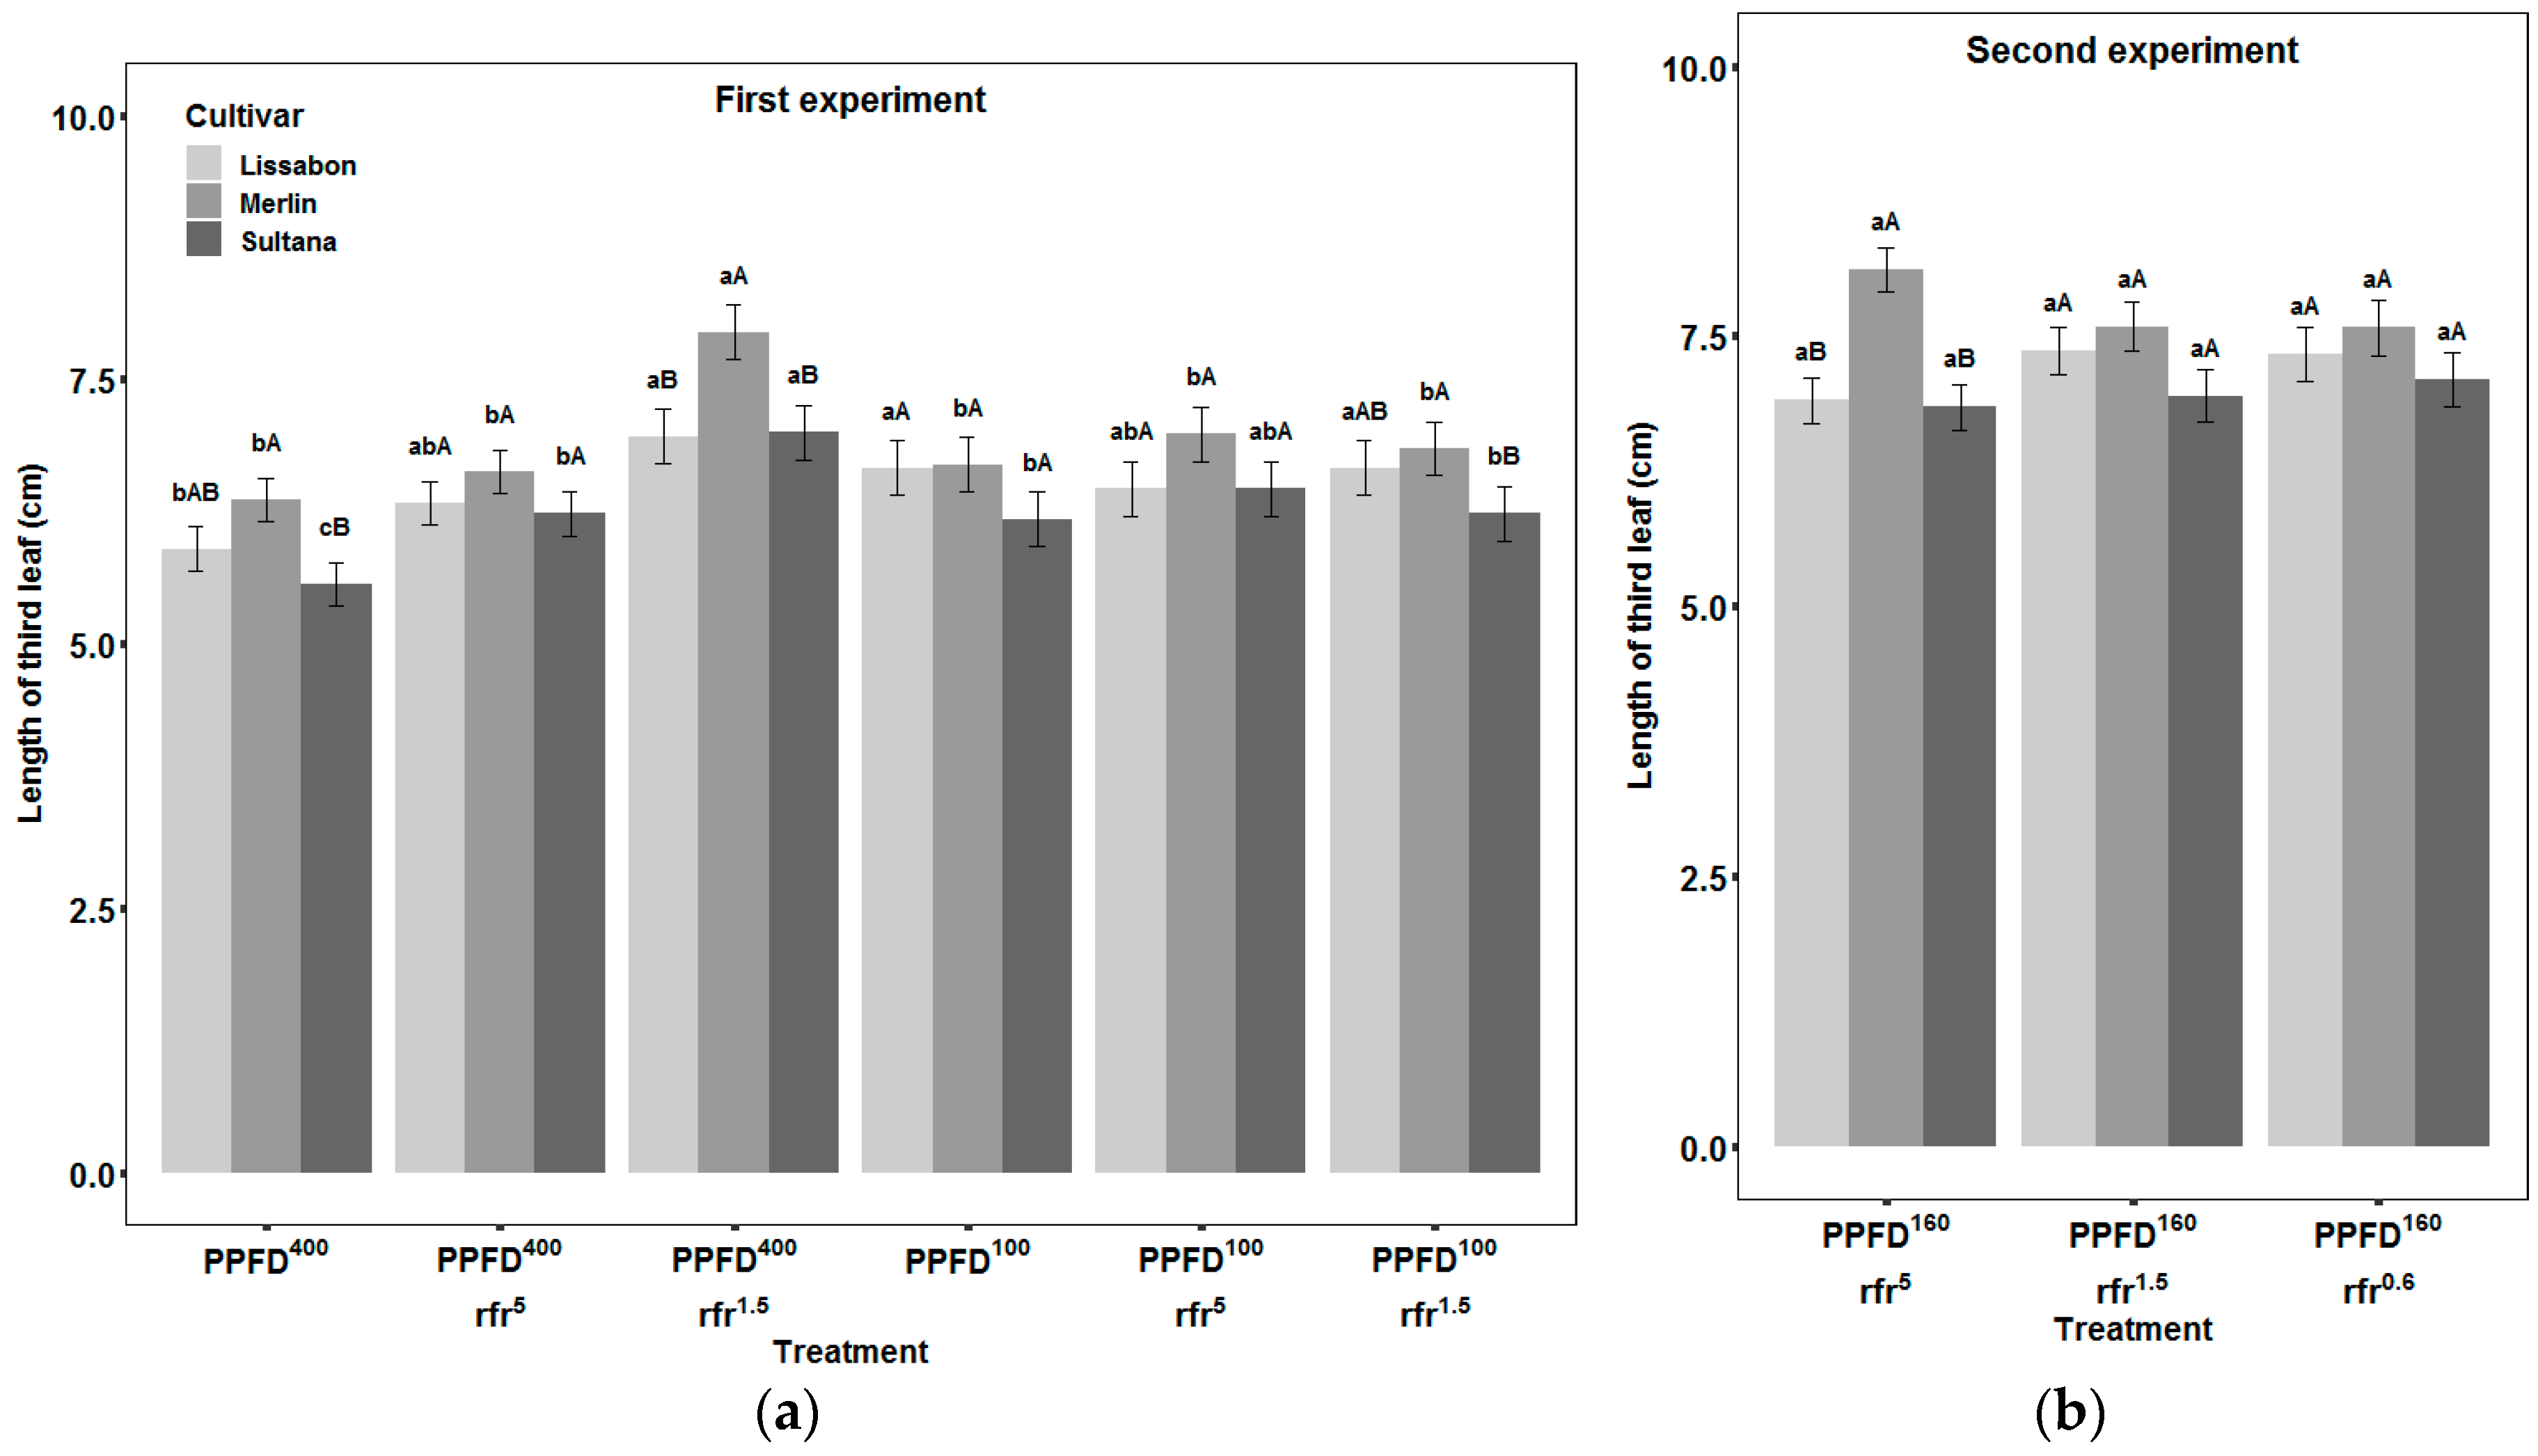
3.3. Leaves
4. Discussion
4.1. Response to PPFD and R:FR
4.2. Cultivar Differences and Aspects for Crop Management
5. Conclusions
Author Contributions
Funding
Acknowledgments
Conflicts of Interest
References
- Pierik, R.; de Wit, M. Shade avoidance: Phytochrome signalling and other aboveground neighbour detection cues. J. Exp. Bot. 2014, 65, 2815–2824. [Google Scholar] [CrossRef] [PubMed]
- Franklin, K.A. Shade avoidance. New Phytol. 2008, 179, 930–944. [Google Scholar] [CrossRef] [PubMed]
- Ballare, C.L.; Scopel, A.L.; Sanchez, R.A. Far-Red Radiation Reflected from Adjacent Leaves: An Early Signal of Competition in Plant Canopies. Science 1990, 247, 329–332. [Google Scholar] [CrossRef] [PubMed]
- Green-Tracewicz, E.; Page, E.R.; Swanton, C.J. Shade Avoidance in Soybean Reduces Branching and Increases Plant-to-Plant Variability in Biomass and Yield Per Plant. Weed Sci. 2011, 59, 43–49. [Google Scholar] [CrossRef]
- Fraser, D.P.; Hayes, S.; Franklin, K.A. Photoreceptor crosstalk in shade avoidance. Curr. Opin. Plant. Biol. 2016, 33, 1–7. [Google Scholar] [CrossRef] [Green Version]
- Li, J.; Li, G.; Wang, H.; Wang Deng, X. Phytochrome signaling mechanisms. Arabidopsis Book 2011, 9, e0148. [Google Scholar] [CrossRef] [PubMed]
- Yu, X.; Liu, H.; Klejnot, J.; Lin, C. The Cryptochrome Blue Light Receptors. Arabidopsis Book 2010, 8, e0135. [Google Scholar] [CrossRef] [Green Version]
- De Wit, M.; Keuskamp, D.H.; Bongers, F.J.; Hornitschek, P.; Gommers, C.M.M.; Reinen, E.; Martínez-Cerón, C.; Fankhauser, C.; Pierik, R. Integration of Phytochrome and Cryptochrome Signals Determines Plant Growth during Competition for Light. Curr. Biol. 2016, 26, 3320–3326. [Google Scholar] [CrossRef] [Green Version]
- Keller, M.M.; Jaillais, Y.; Pedmale, U.V.; Moreno, J.E.; Chory, J.; Ballaré, C.L. Cryptochrome 1 and phytochrome B control shade-avoidance responses in Arabidopsis via partially independent hormonal cascades. Plant. J. 2011, 67, 195–207. [Google Scholar] [CrossRef]
- Pedmale, U.V.; Huang, S.C.; Zander, M.; Cole, B.J.; Hetzel, J.; Ljung, K.; Reis, P.A.B.; Sridevi, P.; Nito, K.; Nery, J.R.; et al. Cryptochromes Interact Directly with PIFs to Control Plant Growth in Limiting Blue Light. Cell 2016, 164, 233–245. [Google Scholar] [CrossRef]
- Park, Y.; Runkle, E.S. Far-red radiation and photosynthetic photon flux density independently regulate seedling growth but interactively regulate flowering. Environ. Exp. Bot. 2018, 155, 206–216. [Google Scholar] [CrossRef]
- Weston, E.; Thorogood, K.; Vinti, G.; López-Juez, E. Light quantity controls leaf-cell and chloroplast development in Arabidopsis thaliana wild type and blue-light-perception mutants. Planta 2000, 211, 807–815. [Google Scholar] [CrossRef] [PubMed]
- Liu, W.; Zou, J.; Zhang, J.; Yang, F.; Wan, Y.; Yang, W. Evaluation of Soybean (Glycine max) Stem Vining in Maize-Soybean Relay Strip Intercropping System. Plant Prod. Sci. 2015, 18, 69–75. [Google Scholar] [CrossRef]
- Yang, F.; Huang, S.; Gao, R.; Liu, W.; Yong, T.; Wang, X.; Wu, X.; Yang, W. Growth of soybean seedlings in relay strip intercropping systems in relation to light quantity and red:far-red ratio. Field Crop. Res. 2014, 155, 245–253. [Google Scholar] [CrossRef]
- Su, B.Y.; Song, Y.X.; Song, C.; Cui, L.; Yong, T.W.; Yang, W.Y. Growth and photosynthetic responses of soybean seedlings to maize shading in relay intercropping system in Southwest China. Photosynthetica 2014, 52, 332–340. [Google Scholar] [CrossRef]
- Gong, W.Z.; Jiang, C.D.; Wu, Y.S.; Chen, H.H.; Liu, W.Y.; Yang, W.Y. Tolerance vs. avoidance: Two strategies of soybean (Glycine max) seedlings in response to shade in intercropping. Photosynthetica 2015, 53, 259–268. [Google Scholar] [CrossRef]
- Yao, X.; Li, C.; Li, S.; Zhu, Q.; Zhang, H.; Wang, H.; Yu, C.; Martin, S.K.S.; Xie, F. Effect of shade on leaf photosynthetic capacity, light-intercepting, electron transfer and energy distribution of soybeans. Plant. Growth Regul. 2017, 83, 409–416. [Google Scholar] [CrossRef]
- Valladares, F.; Niinemets, Ü. Shade Tolerance, a Key Plant Feature of Complex Nature and Consequences. Annu. Rev. Ecol. Evol. Syst. 2008, 39, 237–257. [Google Scholar] [CrossRef] [Green Version]
- Gong, W.; Qi, P.; Du, J.; Sun, X.; Wu, X.; Song, C.; Liu, W.; Wu, Y.; Yu, X.; Yong, T.; et al. Transcriptome Analysis of Shade-Induced Inhibition on Leaf Size in Relay Intercropped Soybean. PLoS ONE 2014, 9, e98465. [Google Scholar] [CrossRef]
- Pauch, R.C.; Britz, S.J.; Mulchi, C.L. Growth and photosynthesis of soybean (Glycine max (L.) Merr.) in simulated vegetation shade: Influence of the ratio of red to far-red radiation *. Plant Cell Environ. 1991, 14, 647–656. [Google Scholar] [CrossRef]
- Hussain, S.; Iqbal, N.; Rahman, T.; Liu, T.; Brestic, M.; Safdar, M.E.; Asghar, M.A.; Farooq, M.U.; Shafiq, I.; Ali, A.; et al. Shade effect on carbohydrates dynamics and stem strength of soybean genotypes. Environ. Exp. Bot. 2019, 162, 374–382. [Google Scholar] [CrossRef]
- Feng, L.; Raza, M.A.; Li, Z.; Chen, Y.; Khalid, M.H.B.; Du, J.; Liu, W.; Wu, X.; Song, C.; Yu, L.; et al. The Influence of Light Intensity and Leaf Movement on Photosynthesis Characteristics and Carbon Balance of Soybean. Front. Plant Sci. 2019, 9, 1952. [Google Scholar] [CrossRef] [PubMed]
- Munz, S.; Feike, T.; Chen, Q.; Claupein, W.; Graeff-Hönninger, S. Understanding interactions between cropping pattern, maize cultivar and the local environment in strip-intercropping systems. Agric. For. Meteorol. 2014, 195–196, 152–164. [Google Scholar] [CrossRef]
- Brooker, R.W.; Bennett, A.E.; Cong, W.-F.; Daniell, T.J.; George, T.S.; Hallett, P.D.; Hawes, C.; Iannetta, P.P.M.; Jones, H.G.; Karley, A.J.; et al. Improving intercropping: A synthesis of research in agronomy, plant physiology and ecology. New Phytol. 2015, 206, 107–117. [Google Scholar] [CrossRef]
- Horvath, D.P.; Hansen, S.A.; Moriles-Miller, J.P.; Pierik, R.; Yan, C.; Clay, D.E.; Scheffler, B.; Clay, S.A. RNAseq reveals weed-induced PIF3-like as a candidate target to manipulate weed stress response in soybean. New Phytol. 2015, 207, 196–210. [Google Scholar] [CrossRef]
- Hiebsch, C.K.; Tetio-Kagho, F.; Chirembo, A.M.; Gardner, F.P. Plant Density and Soybean Maturity in a Soybean-Maize Intercrop. Agron. J. 1995, 87, 965. [Google Scholar] [CrossRef]
- Stroup, W.W. Power analysis based on spatial effects mixed models: A tool for comparing design and analysis strategies in the presence of spatial variability. J. Agric. Biol. Environ. Stat. 2002, 7, 491–511. [Google Scholar] [CrossRef]
- Wolfinger, R. Covariance structure selection in general mixed models. Commun. Stat.-Simul. Comput. 1993, 22, 1079–1106. [Google Scholar] [CrossRef]
- Piepho, H.P. An Algorithm for a Letter-Based Representation of All-Pairwise Comparisons. J. Comput. Graph. Stat. 2004, 13, 456–466. [Google Scholar] [CrossRef]
- Kurepin, L.V.; Emery, R.J.N.; Pharis, R.P.; Reid, D.M. Uncoupling light quality from light irradiance effects in Helianthus annuus shoots: Putative roles for plant hormones in leaf and internode growth. J. Exp. Bot. 2007, 58, 2145–2157. [Google Scholar] [CrossRef]
- Lanoue, J.; Leonardos, E.D.; Grodzinski, B. Effects of Light Quality and Intensity on Diurnal Patterns and Rates of Photo-Assimilate Translocation and Transpiration in Tomato Leaves. Front. Plant. Sci. 2018, 9, 756. [Google Scholar] [CrossRef] [Green Version]
- Kim, G.-T.; Yano, S.; Kozuka, T.; Tsukaya, H. Photomorphogenesis of leaves: Shade-avoidance and differentiation of sun and shade leaves. Photochem. Photobiol. Sci. 2005, 4, 770. [Google Scholar] [CrossRef]


| Treatment | PPFD (400–700 nm) | Blue (400–500 nm) | Green (500–600 nm) | Red (600–700 nm) | Far-Red (700–800 nm) | R:FR |
|---|---|---|---|---|---|---|
| First Experiment | ||||||
| PPFD100 | 100 | 37.5 | 25 | 37.5 | 1 | 37.5 |
| PPFD100 rfr5 | 100 | 37.5 | 25 | 37.5 | 7.5 | 5 |
| PPFD100 rfr1.5 | 100 | 37.5 | 25 | 37.5 | 25 | 1.5 |
| PPFD400 | 400 | 150 | 100 | 150 | 4 | 37.5 |
| PPFD400 rfr5 | 400 | 150 | 100 | 150 | 30 | 5 |
| PPFD400 rfr1.5 | 400 | 150 | 100 | 150 | 100 | 1.5 |
| Second Experiment | ||||||
| PPFD160 rfr5 | 160 | 60 | 40 | 60 | 12 | 5 |
| PPFD160 rfr1.5 | 160 | 60 | 40 | 60 | 40 | 1.5 |
| PPFD160 rfr0.6 | 160 | 60 | 40 | 60 | 100 | 0.6 |
| Difference in cm | Two Replicates | Three Replicates |
|---|---|---|
| 1 | 0.362 | 0.509 |
| 2 | 0.894 | 0.977 |
| 3 | 0.998 | >0.999 |
| 4 | >0.999 | >0.999 |
| 5 | >0.999 | >0.999 |
| Treatment | Plant Height (cm) | Plant Weight (g) | ||||
|---|---|---|---|---|---|---|
| Lissabon | Merlin | Sultana | Lissabon | Merlin | Sultana | |
| First experiment | ||||||
| PPFD400 | 12.31 eA | 11.88 fA | 8.89 eB | 0.71 bA | 0.64 bAB | 0.52 bB |
| PPFD400 rfr5 | 13.97 eA | 15.07 eA | 10.48 eB | 0.69 bA | 0.80 abA | 0.61 bA |
| PPFD400 rfr1.5 | 17.16 dB | 18.65 dA | 16.50 dB | 0.92 aA | 0.98 aA | 0.86 aA |
| PPFD100 | 39.74 cA | 29.87 cB | 25.54 cC | 0.32 cA | 0.29 cAB | 0.23 cB |
| PPFD100 rfr5 | 44.34 bA | 36.73 bB | 32.83 bC | 0.37 cA | 0.29 cA | 0.31 cA |
| PPFD100 rfr1.5 | 52.01 aA | 48.73 aAB | 46.63 aB | 0.37 cA | 0.41 cA | 0.33 cA |
| Second Experiment | ||||||
| PPFD160 rfr5 | 45.15 aA | 36.01 aB | 33.35 bB | 0.50 bB | 0.61 aA | 0.49 bB |
| PPFD160 rfr1.5 | 45.47 aA | 44.61 aA | 44.22 abA | 0.77 aA | 0.52 aB | 0.59 bB |
| PPFD160 rfr0.6 | 40.16 aB | 42.03 aB | 44.26 bA | 0.72 abA | 0.70 aA | 0.87 aA |
| Treatment | Third Internode Diameter (mm) | Third Internode Length:Diameter | ||||
|---|---|---|---|---|---|---|
| Lissabon | Merlin | Sultana | Lissabon | Merlin | Sultana | |
| First Experiment | ||||||
| PPFD400 | 2.47 abB | 2.88 aA | 2.73 aAB | 6.48 cA | 5.33 dAB | 4.06 eB |
| PPFD400 rfr5 | 2.41 bB | 2.95 aA | 2.90 aA | 8.10 cA | 7.12 dA | 5.08 eB |
| PPFD400 rfr1.5 | 2.86 aA | 2.79 aA | 3.03 aA | 8.72 cB | 12.93 cA | 9.44 dB |
| PPFD100 | 1.47 cA | 1.66 cA | 1.72 bA | 47.99 bA | 42.98 bAB | 31.66 cB |
| PPFD100 rfr5 | 1.65 cA | 1.73 bcA | 1.59 bA | 58.91 bA | 57.10 aA | 49.58 bA |
| PPFD100 rfr1.5 | 1.65 cB | 2.05 bA | 1.68 bB | 76.33 aA | 73.55 aA | 68.67 aA |
| Second Experiment | ||||||
| PPFD160 rfr5 | 1.84 bB | 2.25 aA | 2.19 bA | 27.71 bA | 27.66 cA | 28.14 bA |
| PPFD160 rfr1.5 | 2.40 aA | 2.15 aA | 2.33 bA | 44.84 aA | 37.38 bA | 35.62 bA |
| PPFD160 rfr0.6 | 2.47 aB | 2.29 aB | 3.03 aA | 47.81 aA | 50.04 aA | 48.09 aA |
| Treatment | Third Center Rachis Length (cm) | ||
|---|---|---|---|
| Lissabon | Merlin | Sultana | |
| First Experiment | |||
| PPFD400 | 0.92 bA | 0.80 cAB | 0.72 dB |
| PPFD400 rfr5 | 1.07 bA | 0.98 bAB | 0.87 cdB |
| PPFD400 rfr1.5 | 1.62 aA | 1.67 aA | 1.30 aA |
| PPFD100 | 0.95 bA | 0.85 bcA | 0.98 bcA |
| PPFD100 rfr5 | 0.97 bA | 0.83 bcA | 0.88 cdA |
| PPFD100 rfr1.5 | 1.13 bA | 1.03 bcA | 1.18 abA |
| Second Experiment | |||
| PPFD160 rfr5 | 0.96 bA | 1.06 bA | 1.03 bA |
| PPFD160 rfr1.5 | 1.38 aA | 1.24 bA | 1.42 aA |
| PPFD160 rfr0.6 | 1.61 aA | 1.78 aA | 1.65 aA |
| Treatment | Specific Leaf Area (cm2 g−1) | Leaf Area Ratio | Leaf Mass Ratio | ||||||
|---|---|---|---|---|---|---|---|---|---|
| Lissabon | Merlin | Sultana | Lissabon | Merlin | Sultana | Lissabon | Merlin | Sultana | |
| First experiment | |||||||||
| PPFD400 | 247.31 cdB | 242.19 cB | 280.22 cA | 170.72 bB | 170.86 cB | 209.30 dA | 0.69 aB | 0.71 aB | 0.75 abA |
| PPFD400 rfr5 | 245.21 dB | 243.60 cB | 326.17 bA | 168.32 bB | 167.59 cB | 248.35 cA | 0.69 aB | 0.69 aB | 0.76 aA |
| PPFD400 rfr1.5 | 278.16 cB | 277.83 bB | 319.13 bA | 172.66 bB | 169.71 cB | 209.63 dA | 0.62 bB | 0.61 bcB | 0.66 cA |
| PPFD100 | 687.99 bB | 726.19 aAB | 816.74 aA | 412.36 aB | 466.52 abB | 588.27 aA | 0.59 bcC | 0.65 bB | 0.72 bA |
| PPFD100 rfr5 | 695.94 bB | 817.27 aA | 791.52 aA | 395.18 aB | 485.04 aA | 526.43 bA | 0.57 cB | 0.60 cB | 0.67 cA |
| PPFD100 rfr1.5 | 843.77 aA | 833.10 aA | 850.56 aA | 405.19 aB | 409.10 bB | 481.52 bA | 0.49 dB | 0.49 dB | 0.57 dA |
| Second Experiment | |||||||||
| PPFD160 rfr5 | 592.98 aB | 614.07 aAB | 701.66 abA | 330.74 aB | 357.98 aB | 457.75 aA | 0.55 aC | 0.59 aB | 0.65 aA |
| PPFD160 rfr1.5 | 599.19 aB | 703.47 aA | 793.77 aA | 298.79 aB | 365.25 aA | 416.26 aA | 0.50 bA | 0.51 bA | 0.53 bA |
| PPFD160 rfr0.6 | 658.65 aA | 672.45 aA | 604.34 bA | 306.23 aA | 309.16 aA | 299.78 bA | 0.47 bB | 0.47 cAB | 0.50 bA |
© 2019 by the authors. Licensee MDPI, Basel, Switzerland. This article is an open access article distributed under the terms and conditions of the Creative Commons Attribution (CC BY) license (http://creativecommons.org/licenses/by/4.0/).
Share and Cite
Hitz, T.; Hartung, J.; Graeff-Hönninger, S.; Munz, S. Morphological Response of Soybean (Glycine max (L.) Merr.) Cultivars to Light Intensity and Red to Far-Red Ratio. Agronomy 2019, 9, 428. https://doi.org/10.3390/agronomy9080428
Hitz T, Hartung J, Graeff-Hönninger S, Munz S. Morphological Response of Soybean (Glycine max (L.) Merr.) Cultivars to Light Intensity and Red to Far-Red Ratio. Agronomy. 2019; 9(8):428. https://doi.org/10.3390/agronomy9080428
Chicago/Turabian StyleHitz, Tina, Jens Hartung, Simone Graeff-Hönninger, and Sebastian Munz. 2019. "Morphological Response of Soybean (Glycine max (L.) Merr.) Cultivars to Light Intensity and Red to Far-Red Ratio" Agronomy 9, no. 8: 428. https://doi.org/10.3390/agronomy9080428
APA StyleHitz, T., Hartung, J., Graeff-Hönninger, S., & Munz, S. (2019). Morphological Response of Soybean (Glycine max (L.) Merr.) Cultivars to Light Intensity and Red to Far-Red Ratio. Agronomy, 9(8), 428. https://doi.org/10.3390/agronomy9080428