Abstract
The genetic architecture and the genetic loci controlling commodity traits in this Hami melon have not been characterized. Multiplexed shotgun genotyping (MSG) was used to genotype an F2 population of 370 Chinese Hami melon progeny. A total of 47,609 single nucleotide polymorphism (SNP) markers were obtained after strict filtering. Thebins were used to construct a genetic linkage map with a total length of 1572.954 cM. Quantitative trait locus (QTL) analysis revealed that fruit color was controlled by one major gene about 2 Mb region on chr09, while exocarp color (EC) was controlled by one major gene about 1.9 Mb on chr04, and skin spotting was controlled by two dominant genes, one in the same region of chr04as the EC QTL and the other in the 1031.05 kb region on chr02. Two major QTLs on chr03 and chr05 were related pleiotropically to several quantitative fruit traits, namely, edge sugar content (ES), center sugar content (CS), fruit weight (FW), and fruit length (FL). A further QTL on chr09 also influenced ES, while five other QTLs affected FL. This study was the first to conduct genetic architecture analysis and QTL mapping in Chinese Hami melon with high-density markers and a large target population.
Keywords:
genetic architecture; QTL; commondity; trait; Chinese; Hami melon; multiplexed shotgun genotyping 1. Introduction
Melon is an important horticultural crop in the world, with 1.72 million hectares cultivated and 47 million tons producedglobally in 2016, located largely in Mediterranean and East Asian countries [1]. The melon crop generates ~2.4 billion US dollars in export value, making this fruit the second most commercially important member of the Cucurbitaceae family [1]. In addition, the nutritional quality of melon is high, as these fruits are low in calories but rich in nutrients including potassium, vitamin C, and β-carotene [2,3]. Moreover, melon is an attractive model for molecular studies owing to its small genome [4] and characteristic biological properties, such as climacteric fruit ripening [5,6], sex determination [7], and carotenoid content [8,9,10].
As members of an outcrossing species, melon cultivars exhibit remarkable diversity with respect to both vegetative morphological characteristics and fruit traits. The morphological variation subdivides Cucumis melo into two subspecies, namely, ssp. agrestis (Naud.) Pangalo (wild melon) and ssp. melo L. (cultivated melon) [11]. The latter is further subdivided into several groups or botanical varieties, including var. flexuosus (L.) Naud. (Armenian cucumber), var. inodorus Jacq. (honeydew melon), var. catalupensis Naud. (cantaloupe melon), var. reticulatus Ser. (Galia muskmelon), var. adana Pangalo (snake cucumber), var. ameri Pangalo, var. chandalak Pangalo (Chandalak melon), and var. tibish Moham [12]. Although the geographical origin of melon remains unclear, Africa [13] and Asia [14] are considered to be the origins of melon domestication. China is the primary or a secondary center of cultivated melon diversity [15,16,17] and is also a major world producer of commercial cultivars of var. cantalupensis, var. inodorus, and var. conomon (Thunb.) Makino (Chinese cucumber) [16,17,18,19], with 16 million tons of production harvested from 479,400 ha in 2016 [1]. In China, melon is traditionally defined by the thickness of the fruit skin and is divided into two cultivated types, namely, thin- or thick-skinned melons [3,16]. The thick-skinned melon, with a longer shelf-life and a higher sugar content, is also known as the Chinese Hami melon, and is generally distributed in the Xinjiang Uygur Autonomous Region (Xinjiang), which is the largest province-level administrative region of China in terms of land area [3,20]. Because its distribution is different from that of other C. melo varieties, Chinese Hami melon is thought to carry a different genetic background. Though genome sequencing, genetic map construction, and quantitative trait locus (QTL) analysis have been carried out on other melon types, it is necessary to characterize the special genetic architecture and map the QTLs controlling commodity traits in Chinese Hami melon under high resolution and using large genetically variant populations.
The economic importance and research value of melons has promoted the study of the genomic sequence, the construction of genetic linkage maps and QTL analysis of economic traits in this crop [4,21,22]. The melon genome was published in 2012 [4], while the first genetic map was constructed in 1996 on the basis of 110 molecular markers, including restriction fragment length polymorphisms, random amplified polymorphic DNA, and isozymes [23]. To date, many linkage maps for melon have been constructed encompassing a few hundred markers [9,24,25,26,27,28,29,30,31,32,33]; eight of these maps were used as the basis for a consensus genetic map of 1150 cM that comprised 1592 markers and was constructed to improve resolution and to facilitate comparisons [33]. By increasing marker density, the precision of QTL localization and the estimates of their effects could be improved and used to potentially distinguish between closely related loci [34]. Quantitative trait loci related to the most important traits have been identified in melon, such as earliness, fruit shape, fruit weight, sugar content, flavor, and β-carotene content [9,25,26,27,30].
To generate a reduced representation of a genome, several next-generation sequencing (NGS) methods, based on restriction enzymes, are available, including restriction-site-associated (RAD) DNA sequencing, multiplexed shotgun genotyping (MSG), and genotyping-by-sequencing [35]. These approaches are capable of discovering, sequencing, and genotyping thousands of markers covering the entire genome in a single step, even for species for which there is little or no genetic information [35]. Multiplexed shotgun genotyping is significantly more efficient and flexible than other approaches [36].The technique involves an extremely simplified protocol for library preparation with one library for a large number of individuals at low cost [37,38].
In the current study, MSG was employed to discover single nucleotide polymorphism (SNP) markers and to genotype an F2 segregating population consisting of 370 progeny lines of Chinese Hami melon. Genetic analysis, including bin map, crossover events, recombination rates, and segregation distortion regions, were explored at the whole-genome level with high-density SNPs, before carrying out QTL analysis on seven agricultural and fruit quality traits to provide basic information for genetic improvement of Chinese Hami melon.
2. Materials and Methods
2.1. Materials and DNA Extraction
The F2 population, consisting of 370 progenies, was generated by crossing the Hami melon breeding lines K1-7 (as the maternal parent) and K3-92-1 (as the paternal parent). The F1 hybrid, JinMi6, is a popular Hami cultivar grown in Southern China. These materials were planted at New Village, Jiyang Town, Sanya City, Hainan Province (coordinates:109°35′ E/18°17′ N). Genomic DNA of the parents and the F2 individuals was isolated from young leaves using the cetyltrimethylammonium bromide (CTAB) method, with some modifications [39]. The DNA was quantified using 0.8% agarose gel electrophoresis and a Qubit Fluorometer (Thermo Fisher Scientific, Wilmington, DE, USA). The DNA concentrations were standardized to 50 ng/µl for subsequent library construction.
2.2. Library Preparation and Sequencing
An aliquot (1 µg) of genomic DNA was used for library preparation following the MSG method with some modifications. Barcoded adapters (6 bp) were designed and modified according to the standard Illumina adapter for paired-end read libraries. Fifteen libraries with 400–600 bp selected fragments were prepared for the 370 F2 individuals, consisting of fourteen 24plex libraries and one 34plex library. Selected fragments in the 350–700 bp range from the two parents were pooled together separately, to achieve full coverage of the selected sites of their F2 offspring. The libraries were quantified on an Agilent 2100 Bioanalyzer (Agilent Technologies, Palo Alto, CA, USA) and sequenced on a Hiseq2000 instrument (Illumina, San Diego, CA, USA).
2.3. SNP Identification
Alignment of raw reads was achieved using the software SOAP2 (version 2.20) [40]. After excluding the reads with low-quality bases (quality score in scale < 20) and length less than 50 bp, the melon DHL92 (doubled-haploid 92) genome was used as a reference for reads alignment [4]. Only reads mapping to a unique location in the genome were retained. Single nucleotide polymorphism calling was carried out using our developed pipeline; SOAPsnp (version 1.01) was applied to generate the consensus sequences for each sample [41]. Input data for SNP calling with realSFS (version 0.983) was prepared with SAMtools (version 0.1.8) [42]. Population SNP calling was carried out with realSFS based on the Bayesian estimation of site frequency at each site. The likelihoods of genotypes of each individual were integrated, and sites with a probability >0.95 and a population whole-depth >40 were extracted as candidate SNPs [43]. The putative SNPs were then filtered, excluding any loci with missing data >60%. All SNPs were filtered with a Perl script.
2.4. Genotyping and Breakpoint Determination
Half of the genotypes of the F2 population were heterozygous. The average 2–5× depth of RAD-tags would be sufficient for homozygous genotyping but insufficient for genotyping heterozygotes, which might present three genotypes randomly at a single locus: the female parent allele, the male parent allele or the heterozygote. Despite the strict SNP filtering process, some noisy SNPs still existed. Given these limiting factors, a sliding window approach was used with a group of 15 consecutive SNPs for genotyping. A SNP ratio of one parent ≥12:3 in a 15SNP window identified a homozygous genotype; otherwise, a heterozygous genotype was identified [38,44].
Recombination breakpoints were determined after genotyping each progeny line. There were two types of breakpoints in segregating populations: (a) homozygous into heterozygous (or heterozygous into homozygous) and (b) homozygous into homozygous. In the F2 population, the first breakpoint type was in the majority. A Perl script was used to judge the breakpoint where genotypes changed from one to another genotype.
2.5. Bin Map Construction
The large number of SNPs detected caused some difficulties in constructing a linkage map by traditional methods, using every single marker. To overcome this problem and increase efficiency, a skeleton bin map was constructed based on the information of recombination events [45]. All breakpoints aligned along the chromosomes were sorted from the upper end to the lower end at a minimum of 20 kb intervals on the basis of the SNP distribution. The region between two adjacent breakpoints was recognized as one bin. A linkage map was constructed using MSTMap with Kosambi’s mapping function with these bins as markers [46].
2.6. Segregation Distortion and Recombination Rate
Segregation distortion assessment of bin markers was examined using the chi-squared test. The following formula was used to calculate the χ2 value and the resulting data were used to generate the p-value.
where Xi is the number of the markers’ genotypes (“a” for K3-92-1 genotype, “h” for heterozygous genotype, “b” for K1-7 genotype), and E is the expected number of the three genotypes (the expected ratio is 1:2:1). A segregation distortion rate was defined as a bin marker deviating significantly from the expected ratio (i.e., p < 0.05), within a region encompassing three adjacent markers.
The recombination rate was calculated by dividing the genetic distance (cM) amongtwo bin markers by the physical distance (Mb), i.e., cM/Mb. Any region amongtwo markers, where cM/Mb was greater than twice the genome average, was considered to be a hotspot. An approach using a 1Mbwindow with a 0.1 Mb slide was used to calculate the average recombination rate over the entire genome.
2.7. Phenotype Assessment
The population, consisting of 370 F2 individuals, the two parents, and the F1 hybrid, were cultivated in New Village, Jiyang Town, Sanya City, Hainan Province (coordinates:109°35′ E/18°17′ N) and seven traits were scored for each individual, including six related to fruit quality (exocarp color (EC), flesh color (FC), skin spotting (SSP), center sugar content (CS), edge sugar content (ES)and fruit length (FL)), and one yield-related trait, fruit weight (FW). The fruit of the male (pollen) parent had yellow–green exocarp, white flesh, and no skin spotting with low-center sugar content, the fruit of the female parent had yellow skin, orange flesh, no skin spotting with high-center sugar content, while the fruit of the F1 hybrid had yellow–green exocarp, orange flesh, and showed skin spotting.
All the traits were investigated when the fruits were mature. Among the F2 progeny, the EC was recorded as yellow or yellow–green according to the fruit’s skin color. Fruit weight was measured to 0.01 g. Sugar content was measured with a portable refractometer/Brix Meter to 0.01. Samples for CS and ES measurements were selected from the center flesh and edge flesh near the rind, respectively. Skin spotting was recorded as positive or negative according to the skin’s appearance. A longitudinal cut was made along the fruit, and FC was observed as orange or white and FL was measured from the top to the bottom of the sectioned fruit.
2.8. QTL Mapping
After construction of the linkage map, WinQTLCart2.5 [47] was used for QTL analysis. Composite interval mapping [48,49] was performed for all traits. A 10 cM window at a walking speed of 1 cM was used in a stepwise forward regression procedure, and five markers were used to eliminate inherent background effects among linked multiple QTLs. The logarithm of the odds (LOD) threshold was calculated using 1000 permutations for an experimental-wise error rate of p = 0.05 (LOD ≥ 2.5). When the positions of a QTL affecting a trait overlapped several locations, they were interpreted to be the same QTL if they fell within a range of 10 cM. Additive (a) effects and phenotypic variance were estimated by QTL (R2) at the highest peaks shown in WinQTLCart2.5 analyses.
3. Results
3.1. Sequencing and SNP Identification
A total of 443.54 million raw paired-end reads were generated with paired-end sequencing on Hi-seq2000 for the 372 individuals, including the two parents.The raw reads were separated according to the sixbp-barcodes associated with each sample, resulting in the retention of 440.46 million reads (99.30%), showing a high efficiency and uniform library preparation and sequencing. The bases ranged from 49.76 Mb to 443.50 Mb among the 370 F2 lines, while the bases of the two parents (535.30 Mb for the female parent and 373.30 Mb for the male parent) (Figure 1; Table S1).
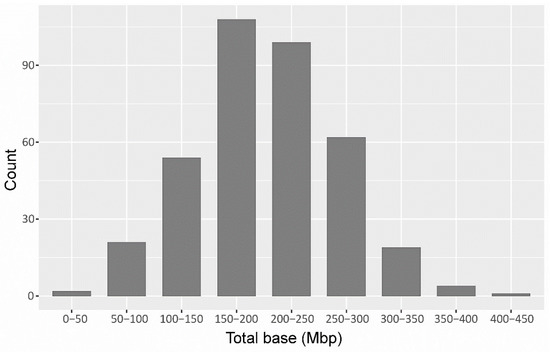
Figure 1.
The distribution of raw data in the F2 population. The x-axis represents the range of megabases (Mbs); the y-axis represents the number of lines falling within the range of data.
The average mapping rate was 66.52% (Table 1), which was relatively low. One reason might be that Chinese Hami melon had some genetic heterogeneity compared with the reference genome. Luan et al. [16] reported that Chinese melon (Cucumismelo) accessions were distinctive with respect to market traits, and that China was a primary or secondary center of cultivated melon diversity worldwide, based on phenotypic and genotypic differences [16]. For the two parents, the coverage of unique mapping reads was 7.63% in the male parent and 8.99% in the female parent, reaching 6.82× and 9.75× for the covered fragments, respectively. For the F2 population, the average coverage was 5.86% and the depth was 4.91× for the coverage loci.

Table 1.
The statistics of the sequence data of F2 populations and the parents.
A total of 47,609 SNPs wereidentified as being homozygous and polymorphic amongthe two parents, segregating normally within the F2 population and representing an average of 7.48 kb/SNP. The SNP numbers on each chromosome varied from 2930 on chr01 to 6715 on chr06, and showed a weak positive non-significant correlation with physical length (r = 0.187). The average SNP distribution among the 12 pseudochromosomes ranged from 4.76 kb/SNP on chr07 to 12.11 kb/SNP on chr01 (Figure 2; Table 2). An average of 26.06 SNPs existed in each progeny line and an average of 0.36 SNPs existed in eachgene.
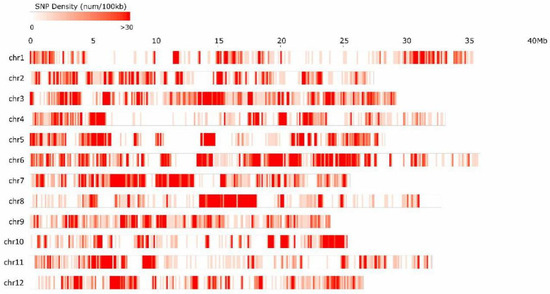
Figure 2.
The distribution of single nucleotide polymorphism(SNP) markers on chromosomes.
Table 2.
Statistics of SNP number, recombination events, and linkage distance on each chromosome.
3.2. Breakpoint Determination
According to the aforementioned method, the 47,609 SNPs were categorized into three genotypes for all 370 F2 plants. The paternal genotype was classified as “a”, the maternal genotype as “b”, and the heterozygous genotype as “h”. A total of 11,640 crossover events weredetected from the 370 plants, corresponding to 31.46 events per line (Table S1). Given that 27,427 protein-encoding genes were predicted from the melon genome, this result indicated that one crossover event occurred every 2.36 genes on average. This high-resolution breakpoint identification allowed us to carry out QTL analysis and even fine mapping of genetic factors to very specific regions.
Crossover events occurred at different rates among the 12 chromosomes, ranging from 1.55 on chr10 to 2.88 on chr01 (Table 2). There was a significant positive correlation between the physical length of a chromosome and the number of crossover events (r = 0.834, n = 12; p-value < 0.05). The maximum number of recombination events per progeny line was 69 in lines 4 and 3, and 3 to 32, with the minimum being 16 in line 12 and 9 (Table S1).
The average recombination rate over the entire genome was 4.41cM/Mb (Table 2), which approximated to the value for rice (4.135 cM/Mb) [41], but was higher than that for the more closely related species cucumber (2.001 cM/Mb) and watermelon (1.765 cM/Mb) [50,51]. The recombination rate in each chromosome ranged from 3.25 cM/Mb on chr10 to5.24cM/Mb on chr11 (Table 2). A total of 3061 windows were prepared to calculate the recombination rate of the entire genome. Recombination rates varied dramatically in different regions. The lowest rate was 0 cM/Mb and the highest was 71.5 cM/Mb in a 1Mb window (Figure 3; Table S2). Basically, high recombination rates were observed in telomeric regions and low rates in centromeric and pericentromeric regions. We found that nearly 7.83% of the entire genome had no recombination events, while about 29.23% had recombination rates below 1 cM/Mb. Approximately half of the entire genome had a recombination rate <2.5 cM/Mb. The recombination hotspots (≥9.78 cM/Mb) covered 14.27%of the entire genome (Figure 3; Table S2).
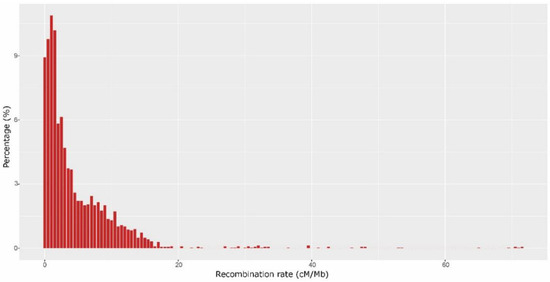
Figure 3.
The distribution of recombination rate over the entire genome. The x-axis shows the average recombination rate (cM/Mb); the y-axis shows the proportion of the whole windows (%).
3.3. Construction of Bin Maps and a High-Resolution Genetic Map
A total of 2554 bins were obtained from the 370 F2 plants, according to the recombination breakpoints (Table S3). The average physical length of the bins was 129.07 kb, ranging from 13.13 kb to 3.02 Mb (Table S3).
Among the F2 population, 25.36% of all genotypes were inherited from K3-92-1, 49.96% were heterozygous, and 24.67% from K1-7 (Table S4). The ratio of the three genotypes approximated to 1:2:1 over the entire genome, indicating that normal genetic architecture exists in this population. However, some segregation distortions were observed. A total of 262 segregation distortion regions were observed on chr05, chr08, chr02, chr01, chr04, chr07, chr11, and chr12 (p-value < 0.05; Figure 4; Table S5). The major segregation distortion regions were located at chr05; 161 bins on the chr05 showed extreme segregation distortion (p < 0.01), while only one bin on chr08 reached significance (Figure 4; Table S5).The genotypes in the segregation distortion regions on chr05 were significantly positive for the pollen parent.
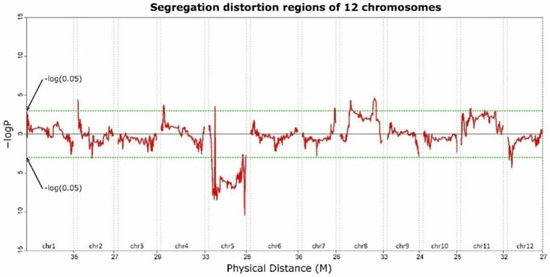
Figure 4.
Distortion regions of the 12 chromosomes. The values above or below the black horizontal line indicate positive (male parent) and negative (female parent) segregation distortion, respectively.
3.4. Mapping the Genetic Loci Controlling the Commodity Traits
After the high-resolution genetic map was constructed, it was used to map the genetic loci controlling the three quality traits FC, EC, and SSP. The FC of the hybrid F1 line was orange, and the ratio of orange flesh to white flesh was 275:95 among the F2 progeny in accordance with the expected ratio of 3:1 (confirmed with χ2 analysis), which indicated that FC was controlled by a single dominant gene. Recombinant plants mapped FC on to chr09, narrowed to 1.97 Mb (Figure 5; Table S6). Exocarp color (EC) segregated into yellow–green (276) and yellow (94) in the F2 population, approximating to the 3:1 ratio. This result suggests that EC was also controlled by a single dominant gene. Using EC as a dominant phenotypic marker, we mapped the locus on to chr04. Recombinant lines narrowed the locus to a 425.79 kb region (Figure 5; Table S6). The genetics of the SSP trait werevery interesting;neither of the two parents had SSP, but the F1 hybrid had spotting on the rind. Of the 370 F2 plants, 213 plants had SSP and 157 progenies had no spotting on the rind, revealing a ratio approximating to 9:7. On this basis, SSP appeared to be the result of the epistatic effects of two genes, with each parent containing a dominant allele of one gene and a recessive allele of the other gene. The two SSP loci were mapped on to the lower end of chr02 and to the upper end of chr04 (Figure 5; Table S6). Meanwhile, we found that the SSP gene on chr04 was in the same region as EC and was named SSP1. The other SSP gene, this time on chr02, was at 51 kb, and, according to the annotation information, was named SSP2.
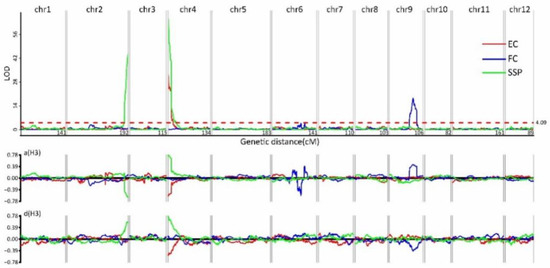
Figure 5.
Quantitative trait locus (QTL) analysis of exocarp color (EC), flesh color (FC), and skin spotting (SSP). Upper graph: The x-axis shows the 12 groups and linkage distance; the y-axis shows the logarithm of odds (LOD) values. The LOD threshold was >2.5. Lower graph: The x-axis shows the 12 groups; the y-axis shows additive values.
A total of 14 QTLs were detected for the other four quantitative traits. These QTLs were distributed across six chromosomes, namely, chr01, chr02, chr04, chr06, chr10, and chr11 (Figure 6; Table S6). Two QTLs for CS were located on chr03 and chr05, and the proportions of phenotypic variance R2 (coefficient of determination) were 14.83% and 5.37%, respectively (Figure 6; Table S6). The two QTLs on chr03 and chr05 for CS also controlled the trait FW, where the R2 values were 11.53% and 8.26%, respectively (Figure 6; Table S6). The QTLs for ES were localized on chr03, chr05, and chr09. The proportion of phenotypic variance (R2) explained by the region of the upper end of chr05 was 12.59% and the total of the three QTLs reached 24.62%. Seven QTLs for FL were located on chr03, chr05, chr07, chr08, and chr12, with the R2 values ranging from 2.98% to 16.19% (Figure 6; Table S6). The QTLs on chr03 and chr05 were pleiotropic, with effects being detected for all four quantitative traits. The additive values in these two regions were both positive for FW and FL, but negative for EC and EC, indicating that the sugar content was negatively correlated to fruit weight in this hybrid. The dominant effects were positive for the four traits except with respect to the ES locus on chr05 and the FL locus on chr03.
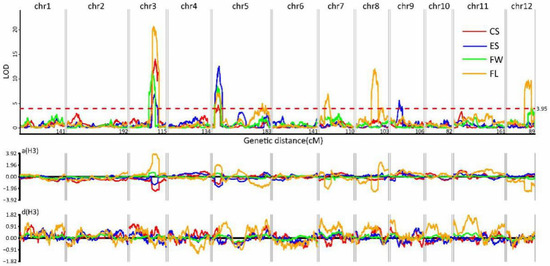
Figure 6.
The QTL analysis of center sugar content (CS), edge sugar content (ES), fruit weight (FW), and fruit length (FL). Upper graph: The x-axis shows the 12 groups and linkage distance; the y-axis shows the LOD values. The LOD threshold was >2.5. Lower graph: The x-axis shows the 12 groups; the y-axis shows additive values.
4. Discussion
4.1. It Is Time- and Cost-Effective to Use MSG to Achieve Genetic Map Construction and QTL Mapping of an F2 Population in Melon
In all previous research on the construction of genetic maps and QTL analysis in melon, population sizes were <200 lines. Firstly, melon is an outcrossing plant, and manual pollination is needed to ensure self-pollination in order to generate recombinant lines from inbred parents, and this is a high-cost and labor-intensive way of constructing a segregating population. Secondly, the process of genotyping using traditional genetic markers, such as SSRs, RFLPs, and AFLPs, was iterative, and genotyping a large population would be prohibitively expensive and laborious. In this manuscript, the commercial F1 hybrid JinMi6, derived from the cross between maternal parent K1-7 and paternal parent K3-92-1, a popular hybrid cultivated in Southern China, was straightforward to self-pollinate and generate 370 progeny lines, which were used as the F2 population. Moreover, the MSG technology could be used in genotyping, making the entire exercise more rapid, less expensive, and less labor-intensive. Multiplexed shotgun genotyping (MSG) is similar to RAD DNA sequencing and genotyping-by-sequencing, except that only one barcode adaptor is used to ligate to both ends of each restriction fragment. Simple library construction via MSG saved both money and time. Barcode-ligated fragments were size-selected before sequencing. The higher coverage of the two parents suggested that fragment size selection could be adjusted to get more or fewerSNPs, according to the requirements of the particular research purpose. The SNPs detected in this study were high density and distributed evenly along the chromosomes. For a 450 Mb melon genome, an average 0.5× raw sequencing data had 4.62× for covered loci. With this depth, genotyping in a segregating population was quite accurate, even for the F2 population. In this study, the combination of an F2 population and MSG technology produced a1572.954cM genetic map of Chinese Hami melon, larger than any produced for C. melo melons in previous studies, and successfully identified the gene loci controlling seven commodity traits. This strategy should be employed with other plants or animals to achieve the rapid construction of a genetic map and identification of the gene loci controlling important traits.
4.2. Chinese Hami Melon Has a Special Genetic Architecture
In this study, 47,609 SNP markers were discovered (the largest set reported in melon to date) and used to genotype a large segregating population of 370 plants. The length of the genetic map was 1572.954 cM, larger than those reported from previous studies in other melon types, namely, 1150 cM and 1088.3 cM, which should be attributed to the unique genetic architecture of Hami melon. A total of 11,640 crossover events were detected from the 370 plants, representing 31.46 events per F2 line and 2.36 genes per event on average. The average recombination rate in Chinese Hami melon was 4.41cM/Mb, higher than the values recorded for cucumber (2.001 cM/Mb) and watermelon (1.765 cM/Mb). The recombination rates for different chromosomes were similar but varied dramatically in different regions of the same chromosome. An entire chromosome could be inherited from a single parent without any recombination in some lines. This phenomenon had been observed previously in maize [52]. There was no artificial selection in our population and neither of the two parents was resistant to powdery mildew. Consequently, the segregation distortion of chr05 in the current study could not be related to resistance gene selection. Further research and the analysis of more populations would be needed to investigate the genetic mechanisms underlying this phenomenon.
4.3. QTLs Identified in This Research Should Facilitate Chinese Hami Melon Breeding
Chinese Hami melon is a popular fruit in China, and outward appearance and taste determine the commodity qualities and economic value directly. It is a major challenge for breeders to improve the fruit quality of Chinese Hami melon. In this research, the genetic loci controlling seven commodity traits, EC, FC, SSP, ES, CS, FL, and FW, were mapped to improve the commodity quality of Chinese Hami melons. Three traits, EC, FC and SSP, were related to pigment biosynthesis, and were controlled by one (FC and EC) or two major genes with epistatic effects (SSP). The major gene controlling FC was located on chr09, a finding which was also reported by Wang et al. [53], Cuevas et al. [26] and Ramamurthy et al. [54] in other melon types. Genes controlling FC have also been shown to be located on chr01, chr04, and chr08 [22]. Previous experiments had shown that the FC gene on chr09 encodes the ORANGE (CmOr) protein, where a single SNP causes a change from arginine (green fruit flesh) to histidine (orange fruit flesh, as a result of increased β-carotene content) in the CmOr protein encoded by the chr09 gene [10]. More research should be conducted to isolate the CmOr in our melon material to explain the FC difference. Loci controlling EC have been found on chr03 and chr04 in previous research [22]. In the current study, EC was located on chr04, which was the same chromosome reported by Chang et al. [22]. In our study, SSP was controlled by two dominant genes SSP1 and SSP2. EC co-segregated with SSP1, which means that yellow EC and SSP could not appear concurrently in the same cultivar, and that SSP cultivars could be generated through a cross amongtwo non-SSP cultivars, as in this case. It was also proposed that either EC or SSP1 was related to chlorophyll biosynthesis, while the SSP2 gene was related to the distribution of chlorophyll on the skin.
A total of eight QTLs were detected for the four quantitative traits CS, ES, FL, and FW, while the QTLs on chr03 and chr05 were shown to be pleiotropic for all of the quantitative traits, a finding which has not been reported previously. Their additive values were positive for both ES and CS but negative for FW and FL, which means that the sugar content was negatively correlated with fruit weight in the Chinese Hami melon. This result indicates that the development of cultivars with heavy fruits and a high sugar content would need to be obtained through selecting for other genes or by introducing other melon germplasm resources. These results provide some important information on cultivar improvement in the Chinese Hami melon.
5. Conclusions
The current study was the first to conduct genetic architecture analysis and QTL mapping in Chinese Hami melon with high-density markers and a large target population. The loci and genes that are critical for fruit color, exocarp color, skin spotting, edge sugar content, center sugar content, fruit weight, and fruit length were identified. These results showed that the method of using MSG to genotype an F2 populationcan be used for breeding programs to genetically improve consumer traits of the Chinese Hami melon.
Supplementary Materials
The following are available online at https://www.mdpi.com/2073-4395/9/8/430/s1, Figure S1: Genetic linkage map of Hami melon (Cucumis melo var. saccharinus) constructed with Multiplexed shotgun genotyping method, Table S1: The statistics of raw data of each lines, Table S2: Average recombination rate information, Table S3: The bin information of each chromosome, Table S4: The bin genotype of F2 population, Table S5: The information of segregation distortion regions, Table S6: QTLs related to seven trait of Chinese Hami melon.
Author Contributions
Y.C. and G.Z. conceived and designed the experiments, J.H. and Z.L. performed the experiments, and Q.X., Y.L., X.D., S.L., Z.Z. and D.C. analyzed the data. X.N. and S.C. contributed reagents/materials/analysis tools, while S.L., B.L. and S.Z. wrote the paper. All authors read and consented to the final version of the manuscript.
Funding
The work was supported by the National Key Technology R&D Program (2015BAD02B01-7), Shenzhen Municipal Government of China (No. JCYJ20150831201123287), Shenzhen Municipal Government of China (No. DRC-SZ(2015)946), West Light Talent Program of the Chinese Academy of Sciences, and the QingHai Science and Technology Department (2018-NK-133, 2018-ZJ-T08, 2019-ZJ-982Q), and Innovation Academy for Seed Design, Chinese Academy of Sciences.The funders had no role in study design, data collection and analysis, decision to publish, or preparation of the manuscript.
Acknowledgments
We are grateful to all participants of the Agriculture Department at BGI.
Availability of Data and Materials
The raw reads were deposited in Sequence Read Archive (SRA) under PRJNA344422.
Conflicts of Interest
The authors have no conflicts of interest to declare.
References
- Food and agriculture Organization of the United Nations. Available online: http://www.fao.org/faostat/en/ (accessed on 4 August 2019).
- Escribano, S.; Lazaro, A. Physicochemical and nutritional evaluation of Spanish melon landraces. Plant Genet. Resour. C. 2015, 15, 177–186. [Google Scholar] [CrossRef]
- Saini, R.K.; Assefa, A.D.; Keum, Y.S. Fatty acid and carotenoid composition of bitter melon (Momordicacharantia L.) seed arils: A potentially valuable source of lycopene. J. Food Meas. Charact. 2017, 11, 1266–1273. [Google Scholar] [CrossRef]
- Garcia-Mas, J.; Benjak, A.; Sanseverino, W.; Bourgeois, M.; Mir, G.; Gonzalez, V.M.; Hénaff, E.; Câmara, F.; Cozzuto, L.; Lowy, E.; et al. The genome of melon (Cucumismelo L.). Proc. Natl. Acad. Sci. USA 2012, 109, 11872–11877. [Google Scholar] [CrossRef] [PubMed]
- Pech, J.C.; Bouzayen, M.; Latche, A. Climacteric fruit ripening: Ethylene-dependent and independent regulation of ripening pathways in melon fruit. Plant Sci. 2008, 175, 114–120. [Google Scholar] [CrossRef]
- Saladié, M.; Cañizares, J.; Phillips, M.A.; Rodriguez-Concepcion, M.; Larrigaudière, C.; Gibon, Y.; Stitt, M.; Lunn, J.E.; Garcia-Mas, J. Comparative transcriptional profiling analysis of developing melon (Cucumismelo L.) fruit from climacteric and non-climacteric varieties. BMC Genom. 2015, 16, 440. [Google Scholar] [CrossRef] [PubMed]
- Martin, A.; Troadec, C.; Boualem, A.; Rajab, M.; Fernandez, R.; Morin, H.; Pitrat, M.; Dogimont, C.; Bendahmane, A. A transposon-induced epigenetic change leads to sex determination in melon. Nature 2009, 461, 1135–1138. [Google Scholar] [CrossRef] [PubMed]
- Ibdah, M.; Azulay, Y.; Portnoy, V.; Wasserman, B.; Bar, E.; Meir, A.; Burger, Y.; Hirschberg, J.; Schaffer, A.A.; Katzir, N.; et al. Functional characterization of CmCCD1, a carotenoid cleavage dioxygenase from melon. Phytochemistry 2006, 67, 1579–1589. [Google Scholar] [CrossRef] [PubMed]
- Harel-Beja, R.; Tzuri, G.; Portnoy, V.; Lotan-Pompan, M.; Lev, S.; Cohen, S.; Dai, N.; Yeselson, L.; Meir, A.; Libhaber, S.E.; et al. A genetic map of melon highly enriched with fruit quality QTLs and EST markers, including sugar and carotenoid metabolism genes. Theor. Appl. Genet. 2010, 121, 511–533. [Google Scholar] [CrossRef] [PubMed]
- Tzuri, G.; Zhou, X.; Chayut, N.; Yuan, H.; Portnoy, V.; Meir, A.; Sa’ar, U.; Baumkoler, F.; Mazourek, M.; Lewinsohn, E.; et al. A ‘golden’ SNP in CmOr governs the fruit flesh color of melon (Cucumismelo L.). Plant J. 2015, 82, 267–279. [Google Scholar] [CrossRef] [PubMed]
- Kirkbride, J.H.J. Biosystematic Monograph of the Genus Cucumis (Cucurbitaceae): Botanical Identification of Cucumbers and Melons; Parkway Publishers: Boone, NC, USA, 1993. [Google Scholar]
- Hammer, K.; Gladis, T. Notes on infraspecific nomenclature and classifications of cultivated plants in Compositae, Cruciferae, Cucurbitaceae, Gramineae (with a remark on Triticumdicoccon Schrank) and Leguminosae. Genet. Resour. Crop Evol. 2014, 61, 1455–1467. [Google Scholar] [CrossRef]
- Tanaka, K.; Akashi, Y.; Fukunaga, K.; Yamamoto, T.; Aierken, Y.; Nishida, H.; Long, C.L.; Yoshino, H.; Sato, Y.I.; Kato, K. Diversification and genetic differentiation of cultivated melon inferred from sequence polymorphism in the chloroplast genome. Breed. Sci. 2013, 63, 183–196. [Google Scholar] [CrossRef] [PubMed]
- Renner, S.S.; Schaefer, H.; Kocyan, A. Phylogenetics of Cucumis (Cucurbitaceae):Cucumber (C-sativus) belongs in an Asian/Australian clade far from melon (C-melo). BMC Evolut. Biol. 2007, 7, 58. [Google Scholar] [CrossRef] [PubMed]
- Robinson, R.W.; Decker-Walters, D.S. Cucurbits; Cab International: Wallingford, UK, 1997. [Google Scholar]
- Luan, F.; Delannay, I.; Staub, J.E. Chinese melon (Cucumismelo L.) diversity analyses provide strategies for germplasm curation, genetic improvement, and evidentiary support of domestication patterns. Euphytica 2008, 164, 445–461. [Google Scholar] [CrossRef]
- Malik, A.A.; Vashisht, V.K.; Singh, K.; Sharma, A.; Singh, D.K.; Singh, H.; Monforte, A.J.; McCreight, J.D.; Dhillon, N.P. Diversity among melon (Cucumismelo L.) landraces from the Indo-Gangetic plains of India and their genetic relationship with USA melon cultivars. Genet. Resour. Crop Evol. 2014, 61, 1189–1208. [Google Scholar] [CrossRef]
- Aierken, Y.; Akashi, Y.; Nhi, P.T.P.; Halidan, Y.; Tanaka, K.; Long, B.; Nishida, H.; Long, C.; Wu, M.Z.; Kato, K.; et al. Molecular analysis of the genetic diversity of chinese Hami melon and its relationship to the melon germplasm from central and south Asia. J. Jpn. Soc. Hortic. Sci. 2011, 80, 52–65. [Google Scholar] [CrossRef]
- RagHami, M.; Lopez-Sese, A.I.; Hasandokht, M.R.; Zamani, Z.; Moghadam, M.R.F.; Kashi, A. Genetic diversity among melon accessions from Iran and their relationships with melon germplasm of diverse origins using microsatellite markers. Plant Syst. Evol. 2014, 300, 139–151. [Google Scholar] [CrossRef]
- Zhang, Y.P.; Yang, S.J.; Chen, Y.Y. Studies on genetic relationship analysis and purity identification of hybrids of melon cultivars by SRAP markers. In Cucurbitaceae 2012. Proceedings of the Xth EUCARPIA Meeting on Genetics and Breeding of Cucurbitaceae, Antalya, Turkey, 5–18 October 2012; ZiraatFakultesi: Antalya, Turkey, 2012; pp. 459–465. [Google Scholar]
- Rodriguez-Moreno, L.; Gonzalez, V.M.; Benjak, A.; Marti, M.C.; Puigdomenech, P.; Aranda, M.A.; Garcia-Mas, J. Determination of the melon chloroplast and mitochondrial genome sequences reveals that the largest reported mitochondrial genome in plants contains a significant amount of DNA having a nuclear origin. BMC Genom. 2011, 12, 424. [Google Scholar] [CrossRef]
- Chang, C.W.; Wang, Y.H.; Tung, C.W. Genome-wide single nucleotide polymorphism discovery and the construction of a high-density genetic map for melon (Cucumismelo L.) using genotyping-by-sequencing. Front.Plant Sci. 2017, 8, 125. [Google Scholar] [CrossRef]
- Baudracco-Arnas, S.; Pitrat, M. A genetic map of melon (Cucumismelo L.) with RFLP, RAPD, isozyme, disease resistance and morphological markers. Theor. Appl. Genet. 1996, 93, 57–64. [Google Scholar] [CrossRef]
- Oliver, M.; Garcia-Mas, J.; Cardus, M.; Pueyo, N.; López-Sesé, A.I.; Arroyo, M.; Gomez-Paniagua, H.; Arus, P.; Vicente, M.D. Construction of a reference linkage map for melon. Genome 2001, 44, 836–845. [Google Scholar] [CrossRef]
- Perin, C.; Hagen, L.S.; Giovinazzo, N.; Besombes, D.; Dogimont, C.; Pitrat, M. Genetic control of fruit shape acts prior to anthesis in melon (Cucumismelo L.). Mol. Genet. Genom. 2002, 266, 933–941. [Google Scholar]
- Cuevas, H.E.; Staub, J.E.; Simon, P.W.; Zalapa, J.E. A consensus linkage map identifies genomic regions controlling fruit maturity and beta-carotene-associated flesh color in melon (Cucumismelo L.). Theoret. Appl. Genet. 2009, 119, 741–756. [Google Scholar] [CrossRef] [PubMed]
- Cuevas, H.E.; Staub, J.E.; Simon, P.W.; Zalapa, J.E.; McCreight, J.D. Mapping of genetic loci that regulate quantity of beta-carotene in fruit of US Western Shipping melon (Cucumismelo L.). Theor. Appl. Genet. 2008, 117, 1345–1359. [Google Scholar] [CrossRef] [PubMed]
- Fernandez-Silva, I.; Eduardo, I.; Blanca, J.; Esteras, C.; Pico, B.; Nuez, F.; Arus, P.; Garcia-Mas, J.; Monforte, A.J. Bin mapping of genomic and EST-derived SSRs in melon (Cucumismelo L.). Theor. Appl. Genet. 2008, 118, 139–150. [Google Scholar] [CrossRef] [PubMed]
- Deleu, W.; Esteras, C.; Roig, C.; González-To, M.; Fernández-Silva, I.; Gonzalez-Ibeas, D.; Blanca, J.; Aranda, M.A.; Arús, P.; Nuez, F.; et al. A set of EST-SNPs for map saturation and cultivar identification in melon. BMC Plant Biol. 2009, 9, 90. [Google Scholar] [CrossRef] [PubMed]
- Boissot, N.; Thomas, S.; Sauvion, N.; Marchal, C.; Pavis, C.; Dogimont, C. Mapping and validation of QTLs for resistance to aphids and whiteflies in melon. Theor. Appl. Genet. 2010, 121, 9–20. [Google Scholar] [CrossRef]
- Lu, F.; Xu, Y.; Zhao, Y.; Cao, D.; Feng, J.; Guo, S.; Gong, G.; Yi, H.; Wu, M.; Zhang, H. Construction of permanent genetic mapand comparative analysis of Xinjiang Hami melon (Cucumismelo L. ssp.elo. convar. ameri (Pang.) Greb). Acta Hortic. 2009, 36, 1767–1774. [Google Scholar]
- Perin, C.; Hagen, L.; De Conto, V.; Katzir, N.; Danin-Poleg, Y.; Portnoy, V.; Baudracco-Arnas, S.; Chadoeuf, J.; Dogimont, C.; Pitrat, M. A reference map of Cucumismelo based on two recombinant inbred line populations. Theor. Appl. Genet. 2002, 104, 1017–1034. [Google Scholar] [CrossRef]
- Diaz, A.; Fergany, M.; Formisano, G.; Ziarsolo, P.; Blanca, J.; Fei, Z.; Staub, J.E.; Zalapa, J.E.; Cuevas, H.E.; Dace, G.; et al. A consensus linkage map for molecular markers and quantitative trait loci associated with economically important traits in melon (Cucumismelo L.). BMC Plant Biol. 2011, 11, 111. [Google Scholar] [CrossRef]
- Stange, M.; Utz, H.F.; Schrag, T.A.; Melchinger, A.E.; Wurschum, T. High-density genotyping: An overkill for QTL mapping Lessons learned from a case study in maize and simulations. Theor. Appl. Genet. 2013, 126, 2563–2574. [Google Scholar] [CrossRef]
- Almannai, M.; Marom, R.; Sutton, V.R. Newborn screening: A review of history, recent advancements, and future perspectives in the era of next generation sequencing. Curr. Opin. Pediatr. 2016, 28, 694–699. [Google Scholar] [CrossRef] [PubMed]
- Andolfatto, P.; Davison, D.; Erezyilmaz, D.; Hu, T.T.; Mast, J.; Sunayama-Morita, T.; Stern, D.L. Multiplexed shotgun genotyping for rapid and efficient genetic mapping. Genome Res. 2011, 21, 610–617. [Google Scholar] [CrossRef] [PubMed]
- Baird, N.A.; Etter, P.D.; Atwood, T.S.; Currey, M.C.; Shiver, A.L.; Lewis, Z.A.; Selker, E.U.; Cresko, W.A.; Johnson, E.A. Rapid SNP discovery and genetic mapping using sequencedRAD markers. PLoS ONE 2008, 3, e3376. [Google Scholar] [CrossRef] [PubMed]
- Huang, X.; Feng, Q.; Qian, Q.; Zhao, Q.; Wang, L.; Wang, A.; Guan, J.; Fan, D.; Weng, Q.; Huang, T.; et al. High-throughput genotyping bywhole-genome resequencing. Genome Res. 2009, 19, 1068–1076. [Google Scholar] [CrossRef] [PubMed]
- Porebski, S.; Bailey, L.G.; Baum, B.R. Modification of a CTAB DNA extraction protocol for plants containing high polysaccharide and polyphenol components. Plant Mol. Biol. Rep. 1997, 15, 8–15. [Google Scholar] [CrossRef]
- Li, R.; Yu, C.; Li, Y.; Lam, T.W.; Yiu, S.M.; Kristiansen, K.; Wang, J. SOAP2: An improved ultrafast tool for short read alignment. Bioinformatics 2009, 25, 1966–1967. [Google Scholar] [CrossRef] [PubMed]
- Li, R.; Li, Y.; Fang, X.; Yang, H.; Wang, J.; Kristiansen, K.; Wang, J. SNP detection for massively parallel whole-genome resequencing. Genome Res. 2009, 19, 1124–1132. [Google Scholar] [CrossRef] [PubMed]
- Li, H.; Handsaker, B.; Wysoker, A.; Fennell, T.; Ruan, J.; Homer, N.; Marth, G.; Abecasis, G.; Durbin, R. The Sequence Alignment/Map format and SAMtools. Bioinformatics 2009, 25, 2078–2079. [Google Scholar] [CrossRef] [PubMed]
- Xu, X.; Liu, X.; Ge, S.; Jensen, J.D.; Hu, F.; Li, X.; Dong, Y.; Gutenkunst, R.N.; Fang, L.; Huang, L.; et al. Resequencing 50 accessions of cultivated and wild rice yields markers for identifying agronomically important genes. Nat. Biotechnol. 2012, 30, 105–111. [Google Scholar] [CrossRef]
- Duan, M.; Sun, Z.; Shu, L.; Tan, Y.; Yu, D.; Sun, X.; Liu, R.; Li, Y.; Gong, S.; Yuan, D. Genetic analysis of an elite super-hybrid rice parent using high-density SNP markers. Rice 2013, 6, 1–15. [Google Scholar] [CrossRef]
- Van Os, H.; Andrzejewski, S.; Bakker, E.; Barrena, I.; Bryan, G.J.; Caromel, B.; Ghareeb, B.; Isidore, E.; De Jong, W.; Van Koert, P.; et al. Construction of a 10,000-marker ultradense genetic recombination map of potato:Providing a framework for accelerated gene isolation and a genomewide physical map. Genetics 2006, 173, 1075–1087. [Google Scholar] [CrossRef] [PubMed]
- Wu, Y.H.; Bhat, P.R.; Close, T.J.; Lonardi, S. Efficient and accurate construction of genetic linkage maps from the minimum spanning tree of a graph. PLoS Genet. 2008, 4, e1000212. [Google Scholar] [CrossRef] [PubMed]
- Wang, S.; Basten, C.J.; Zeng, Z.B. Windows QTL Cartographer2.5 Department of Statistics. North Carolina StateUniversity: Raleigh, 2006. Available online: http://statgen.ncsu.edu/qtlcart/WQTLCart.htm (accessed on 1 August 2012).
- Zeng, Z.B. Theoretical basis for separation of multiple linked gene effects in mapping quantitative trait loci. Proc. Natl. Acad. Sci. USA 1993, 90, 10972–10976. [Google Scholar] [CrossRef] [PubMed]
- Zeng, Z.B. Precision mapping of quantitative trait loci. Genetics 1994, 136, 1457–1468. [Google Scholar] [PubMed]
- Fazio, G.; Staub, J.E.; Stevens, M.R. Genetic mapping and QTL analysis of horticultural traits in cucumber (Cucumis sativus L.) using recombinant inbred lines. Tagtheor. Appl. Genet. 2003, 107, 864–874. [Google Scholar] [CrossRef] [PubMed]
- Ren, Y.; Zhao, H.; Kou, Q.; Jiang, J.; Guo, S.; Zhang, H.; Hou, W.; Zou, X.; Sun, H.; Gong, G.; et al. A high resolution genetic map anchoring scaffolds of the sequenced watermelon genome. PLoS ONE 2012, 7, e29453. [Google Scholar] [CrossRef]
- Pan, Q.C. Ali, F.; Yang, X.H.; Li, J.S.; Yan, J.B. Exploring the genetic characteristics of two recombinant inbred line populations via high-density SNP markers in maize. PLoS ONE 2012, 7, e52777. [Google Scholar] [CrossRef]
- Wang, Y.H.; Thomas, C.E.; Dean, R.A. A genetic map of melon (Cucumismelo L.) based on amplified fragment length polymorphism (AFLP) markers. Theor. Appl. Genet. 1997, 95, 791–798. [Google Scholar] [CrossRef]
- Ramamurthy, R.K.; Waters, B.M. Identification of fruit quality and morphology QTLs in melon (Cucumismelo L.) using a population derived from flexuosus and cantalupensis botanical groups. Euphytica 2015, 204, 163–177. [Google Scholar] [CrossRef]


© 2019 by the authors. Licensee MDPI, Basel, Switzerland. This article is an open access article distributed under the terms and conditions of the Creative Commons Attribution (CC BY) license (http://creativecommons.org/licenses/by/4.0/).