Article

The Nitrification Inhibitor Vizura® Reduces N2O Emissions When Added to Digestate before Injection under Irrigated Maize in the Po Valley (Northern Italy)

1
DiSAA, Department of Agricultural and Environmental Sciences, University of Milan, Via Celoria 2, 20133 Milan, Italy
2
UMR EcoSys, INRA, AgroParisTech, Université Paris Saclay, route de la Ferme, 75019 Thiverval-Grignon, France
*
Author to whom correspondence should be addressed.
Agronomy 2019, 9(8), 431; https://doi.org/10.3390/agronomy9080431
Submission received: 6 July 2019 / Revised: 31 July 2019 / Accepted: 2 August 2019 / Published: 5 August 2019
(This article belongs to the Section Soil and Plant Nutrition)

Abstract

:
The agricultural area in the Po Valley is prone to high nitrous oxide (N2O) emissions as it is characterized by irrigated maize-based cropping systems, high amounts of nitrogen supplied, and elevated air temperature in summer. Here, two monitoring campaigns were carried out in maize fertilized with raw digestate in a randomized block design in 2016 and 2017 to test the effectiveness of the 3, 4 DMPP inhibitor Vizura® on reducing N2O-N emissions. Digestate was injected into 0.15 m soil depth at side-dressing (2016) and before sowing (2017). Non-steady state chambers were used to collect N2O-N air samples under zero N fertilization (N0), digestate (D), and digestate + Vizura® (V). Overall, emissions were significantly higher in the D treatment than in the V treatment in both 2016 and 2017. The emission factor (EF, %) of V was two and four times lower than the EF in D in 2016 and 2017, respectively. Peaks of NO3-N generally resulted in N2O-N emissions peaks, especially during rainfall or irrigation events. The water-filled pore space (WFPS, %) did not differ between treatments and was generally below 60%, suggesting that N2O-N emissions were mainly due to nitrification rather than denitrification.

1. Introduction

Nitrous oxide (N2O) is a greenhouse gas (GHG) with a global warming potential 265 times greater than carbon dioxide in 100-year time frame [1], accounting for 6.42% of the retained global radiative forcing [2]. The dominant sources of N2O are closely related to microbial processes of nitrification and denitrification, which occur in soils, sediments and water bodies [3].
Agricultural soils are the main anthropogenic source of N2O. The magnitude of the gas emissions is due to mineral N-fertilizer and manure application rate [4], particularly relevant in over-fertilized systems [5]. The rate of the N2O emissions is often controlled by the type of cropping system and soil properties [6]. N2O emissions from soil are indeed affected by different factors as water-filled pore space (WFPS), surface temperature, pH, organic matter, C:N ratio, available C and N, residue management, fertilization practices, soil tillage and crop rotation [7,8,9,10,11,12]. Temporal variability in N2O emissions occurs over different time scales, the year, the growing season and over the day [13]. This variation is due to the magnitude of the driver factors that affect the emissions [14] and is further complicated by fertilizer spreading, the spreading method and the type of fertilizer used [15]. Significant peaks in the emission can typically occur between 0 and about 21 days after spreading, often triggered by rainfall [16].
To attain high nitrogen use efficiency with organic fertilization, matching the timing of the application with the plant needs is essential but often difficult to achieve. Adequate amounts of N available for plants must be present during the periods of high N demand, whereas minimal amounts of N should be present during periods of little N uptake [17].
Among organic fertilizers, the post-digestion liquid from a biogas plant, namely digestate, can be used either in a liquid or solid form since it contains considerable amounts of mineral elements (nitrogen—N, phosphorus—P, potassium—K). The liquid form of digestate resembles a mineral fertilizer in terms of promptness of the elements’ absorption by plants, since N, P and K elements are easily available [18]. Solid fraction of digestates can be applied directly as organic fertilizer [19] or after treatments (e.g., composting, pellets). During the digestion process, the breakdown of labile C may reduce soil N immobilization following digestate application, resulting in an increase of N availability with possible losses [20]. Organic fertilizers, as well as mineral fertilizers, are subjected to loss of nitrogen use efficiency due to nitrogen gaseous emissions and nitrate leaching. To increase the nitrogen use efficiency, different strategies can be applied, such as specific application techniques and equipment (e.g., trailing shoes, disc injector, tine injector) and the use of nitrification inhibitors (NIs). The use of NIs has been found to reduce N2O emissions from liquid manure and synthetic N fertilizers [21,22,23] and increase the nitrogen use efficiency of fertilizers [24]. Most NIs retard microbial oxidation of ammonium (NH4) by depressing the activities of nitrifying bacteria in soil. Therefore, mineral N is stabilized in the rather immobile form of NH4 instead of being transformed to nitrate (NO3), a highly mobile form which provides a much greater potential for leaching from the rooting zone or gaseous emission in the form of N2O [24]. Nitrification inhibitors were shown to effectively reduce N2O emission from short-term fertilization experiments with both mineral and organic fertilizers from grassland and arable soils [25].
Many compounds have been tested as nitrification inhibitors, but only a few are commercially available, with dicyandiamide (DCD) and 3,4-dimethylpyrazole phosphate (DMPP) being the most common [26]. Application of nitrification inhibitors with several ammonium-based fertilizers has been shown to decrease N2O emissions [27,28,29]. DMPP inhibits NO3 conversion from NH4 by depressing Nitrosomonas bacteria activity in the oxidation of ammonia to nitrite in the nitrification process. As a consequence, N2O emissions from nitrification and nitrate leaching are reduced over a period of 4–10 weeks even at very low rate of DMPP application (0.5–1.5 kg DMPP ha–1) [30,31] showed that the risk of negative effects on microbial activity associated to DMPP availability in soil is extremely low even at application rates up to 25 to 90 times higher than those typically used in the field. Similar results were found by Reference [32], wthe authors of which carried out extensive ecotoxicology tests on rats, fishes, water fleas, algae, heterotrophic soil, and water bacteria. In a recent study on DMPP accumulation in clover, Reference [33] found that DMPP was accumulated mostly in leaves, although toxic effects were observed only at very high application rate (i.e., 100 mg kg−1 soil).
The DMPP addition to digestate, which was injected into the soil under controlled conditions, decreased in cumulative N2O emissions by 17–70% [30,34] proposed DMPP as an inhibitor alternative to DCD or Nitrapyr since it requires low application rate, is non-hazardous, and can be added to slurry.
When DMPP was added to dairy slurry and injected into grassland soil, it was found to reduce N2O loss by 32% [35]. Compared to DCD, DMPP resulted in less N2O emissions [36] and led to higher dry matter yield of annual ryegrass in a study where these inhibitors were mixed with cattle slurry [37].
Different techniques are available to quantify the magnitude of the N2O emissions (e.g., micrometeorological, soil profile chamber technique). Among these, in the last 40 years [38,39] static chambers (or “non-flow-through non-steady state”, NFT-NSS) have been the most commonly used method for measuring N2O emissions from agricultural soils. This technique is relatively inexpensive, allows repetition and direct comparison of treatments, is versatile in the field the technology is very easy to adopt, and it does not require large experimental areas [40,41].
Under the hypothesis that nitrification inhibitors contribute to mitigate N2O emissions from digestate application, the effect of DMPP inhibitor mixed with raw digestate was assessed in this study. With this aim, two monitoring experimental field monitoring campaigns were carried out in side-dressing and pre-sowing fertilization of maize, in 2016 and in 2017, respectively. N2O emissions were quantified following the fertilization of maize with the application of raw digestate (D), raw digestate + DMPP-based product Vizura® (V) and no fertilization (N0). NFT-NSS chambers were used to measure N2O emissions. The case study was in the Po Valley, a large cultivated area in the northern part of Italy, which is characterized by intensive and irrigated cropping systems where high N-fertilizer rates [42,43], together with atmospheric N deposition, often result in N surplus [44].

2. Materials and Methods

2.1. Experimental Site

Two experimental field trials were carried out for measuring N2O emissions after side-dressing and pre-sowing fertilization under irrigated maize, in 2016 and 2017, respectively. The two field trials were located in Valera Fratta (Italy, 45°15’53”N, 9°19’44”E, 78 m a.s.l.). Three fertilization treatments were applied in a randomized blocks design: non-fertilized plot (N0), raw digestate (D) and raw digestate + DMPP-based product Vizura® (V), were disposed in a randomized block design with 3 replications per treatment. A field area of 800 m2 for 2016 and 952 m2 for 2017 was split into three equal size blocks within which the three treatments were randomly applied, for a total of 9 plots per field trial and year. The experiments lasted for about 30 days, from June 9th to July 8th 2016, and from July 11th to August 8th in 2017. The raw digestate was applied on the first day of the monitoring campaigns. Maize crop (Zea mays L.) was sown on May 5th 2016 (DeKalb DKC7428) and July 11th 2017 (DeKalb DKC3440). The nitrification inhibitor, a DMPP-based product Vizura® (BASF, SE), was mixed with the digestate just before the injection, with the recommended rate of 2 L ha−1. This rate was recognized to depress soil nitrifier bacteria on 1 ha area. Digestate was applied with injectors directly linked to the backside of the slurry tank and operating at 0.15 m depth. During the side-dressing fertilization in 2016, the fertilizers were injected into the soil between the maize rows with a slurry chisel injector at the stage 37 of the BBCH (Biologische Bundesantalt, Bundessortenamt and Chemische Industrie) phenological scale, which codifies the main phenological stages of cereals and dicotyledonous crops [45]. In 2017, digestate was applied prior to maize sowing with a tines harrow injector. In both 2016 and 2017, the injector was used also in the N0 plots without digestate injection to cause the same soil physical disturbance in the three treatments. The amount of total nitrogen (Kjeldahl) added by the digestate was 61 kg N ha−1 and 238 kg N ha−1 in 2016 and 2017, respectively. The ammoniacal nitrogen content was determined by manual distillation-titration and corresponded to 45.6% (27.8 kg NH4-N ha−1) and 70.4% (167.6 kg NH4-N ha−1) of the total applied nitrogen in 2016 and 2017, respectively. Principal chemical and physical soil properties for both the experimental fields are reported in Table 1. Experimental fields had sandy loam and loam textures, for 2016 and 2017 respectively. In both fields, pH was neutral and the total soil N content, which was determined with the Dumas method (elemental analyzer NA 1500, Carlo Erba, IT), was 1.76 and 2.26 g N kg−1, respectively in the two experimental fields.
Meteorological data were collected by a standard weather station from the Lombardy Region meteorological service (ARPA) in a nearby location three km away from the experimental fields.

2.2. N2O-N Emissions

2.2.1. N2O-N Field Sampling

Non-steady-state chambers were used to collect N2O air samples. The chambers, 0.3 m length × 0.3 m width × 0.3 m height, were built according to the method reported in detail by Reference [46] and applied by various authors before [47,48] in pedoclimatic and management conditions similar to our sites. We used three chambers (i.e., three sub-replicates along a transect within the plot) for each of the nine plots. This number of replicates has been recognized as effective in capturing the spatial variability of the emission rates [46]. During each sampling event, chambers were placed on a plastic frame coated with a silicon seal to ensure the continuity with the camber and avoid air exchanges. The frames were positioned between the maize rows and fixed into the soil before the start of the monitoring period and remained until the end of the trial.
Chambers were made with inert material (polypropylene) and the dimensions, especially the height, where chosen according to the duration of the sampling event. Moreover, the chambers were thermally insulated to avoid temperature and pressure variation during the sampling. With the purpose of homogenizing the inner air in the chamber, each chamber was equipped with a fan system was inserted under the ceiling. The fan was activated by a 12 V battery manually handled during the sampling. Gas samples were taken by means of a syringe connected with a tube and a valve equipped with a Luer Lock system.
In each sampling event, chambers were placed on the frame and air samples were collected at three intervals: 0, 20 and 40 min. Prior to each sampling interval, the fan system was run for 10 s and the connection tube and valve were cleaned to evacuate non-representative gases. For each sampling interval, a volume of 30 mL of inner air was collected by 60 mL syringe and transferred into a 12 mL under vacuum LabcoExetainer® glass vial. These operations—mixing, cleaning and taking sample—were performed for each chamber and sampling interval, with a total of 21 inner air samples were taken for each sampling date, 11 in 2016 and 12 in 2017. For each sampling date, samples were taken around 11 a.m. at the mean daily air temperature. Since samples were not collected every day, emissions were calculated by linear interpolation between the sampling dates to estimate the cumulative N2O emissions [49].
The concentration of N2O, together with CH4 and CO2 (ppmv) were quantified for all the collected samples by means of an automated gas chromatograph (Agilent mod. 7890A ECD/TCD/FID) equipped with thermal conductivity, an electron capture detector for N2O, and a flame ionization detector for CH4 determination. Chambers were rigorously designed and samplings were well conducted as suggested by the trend of the CO2 concentration inside the chamber (data not reported), which generally increased during the samplings. This indicates that no gaseous exchanges towards the surrounding atmosphere occurred, since the CO2 accumulation derived from the microbial activity in the explored portion of the soil.

2.2.2. N2O-N Emissions Calculation

According to the measurement set-up adopted in the field studies, for which three chambers were used for sampling under each treatment, a linear regression scheme [48] was adopted to calculate N2O emissions for each chamber (Equation (1)):
F   =   δ C δ t · p · V R · T · A
where F is the flux (μg N2O-N m−2 s−1) from the source, C is N2O concentration (μmol mol−1), t is the time (s), p is the atmospheric pressure (Pa, constant), V is the headspace volume (m3), R is the universal gas constant (8.3145 m3 Pa K−1 mol−1), T is the ambient air temperature (K) and A is the surface area enclosed by the chamber (m2). The linear regression approach uses the slope obtained from least-squares linear regression of C versus t to estimate δC and δt to be used in Equation (1).
At the end of each monitoring campaign, the Emission Factor (EF) was calculated by Equation (2) to define the percentage of nitrogen lost via nitrous oxide emission:
E F = T x N 0 N t o t
where Tx and N0 represent respectively the cumulative N2O-N (kg ha−1) emitted from the fertilized plots–D or V– and non-fertilized plot–N0– at the end of each monitoring campaign, while Ntot (kg N ha−1) is the total amount of nitrogen supplied with digestate.

2.3. Bulk Density, Soil Nitrate Content, and Water-Filled Pore Space (WFPS)

Bulk density (BD) was measured at different soil depths at the beginning of the field campaigns as it is an indicator of soil compaction, which can cause anaerobic conditions and, ultimately, N2O-N emissions from denitrification. For each treatment, BD was measured by sampling soil cores every 0.05 m soil depth until 0.25 m depth. The core sampling required a volumetric cylinder (0.05 m diameter and 0.05 m height) to be inserted into the undisturbed soil. The collected samples were then dried at 105 °C until stable weight. Bulk density was calculated as function of the soil dry weight and the inner volume of the cylinder.
As the soil NO3-N concentration and the WFPS are also recognized to drive the N2O emissions, the top soil layer (down to 0.3 m) was sampled to determine NO3-N and water content during the two monitoring campaigns. The sampling frequency was every two days over the first two weeks and then every five days until the end of the campaigns. Soil samples were analyzed without drying, after storing at 5 °C. Soluble and exchangeable NO3-N was extracted with a solution of 1 M KCl (extraction ratio 1:3). Suspensions of each derived sample were then prepared by filtration through Whatman n.2 filter paper (Whatman International Ltd., Maidstone, England). NO3-N concentration was then determined through the flow injection analysis and spectrometric detection (FIAstar5000 Analyzer, Foss Tecator, Hillerød, Denmark). The soil samples water content (g g−1) was determined to calculate the dry weight of the extracted soil. The gravimetric water content (GWC) was used to calculate the WFPS, which was determined as follows (Equation (3)):
W F P S = 100   · G W C   ·   B D 1 ( B D 2.65 )
where GWC is the gravimetric water content determined of the oven-dried soil (g g−1), BD is the soil bulk density (g cm−3), 2.65 is the particle density (g cm−3).

2.4. Statistical Analysis

A bootstrap-based method, proposed by Reference [50], was applied to estimate the standard deviation of the cumulated N2O emissions for each plot. A repeated measure mixed model was used to test the effect of the treatments on the daily N2O-N emissions, bulk density, NO3-N content, and WFPS over the two monitoring campaigns, splitting the dataset by year and using the repeated measures for considering the correlation between data measured in consecutive dates. The mean comparison was performed with the Tukey post-hoc test. The statistical analysis was executed with IBM SPSS 24.0.

3. Results

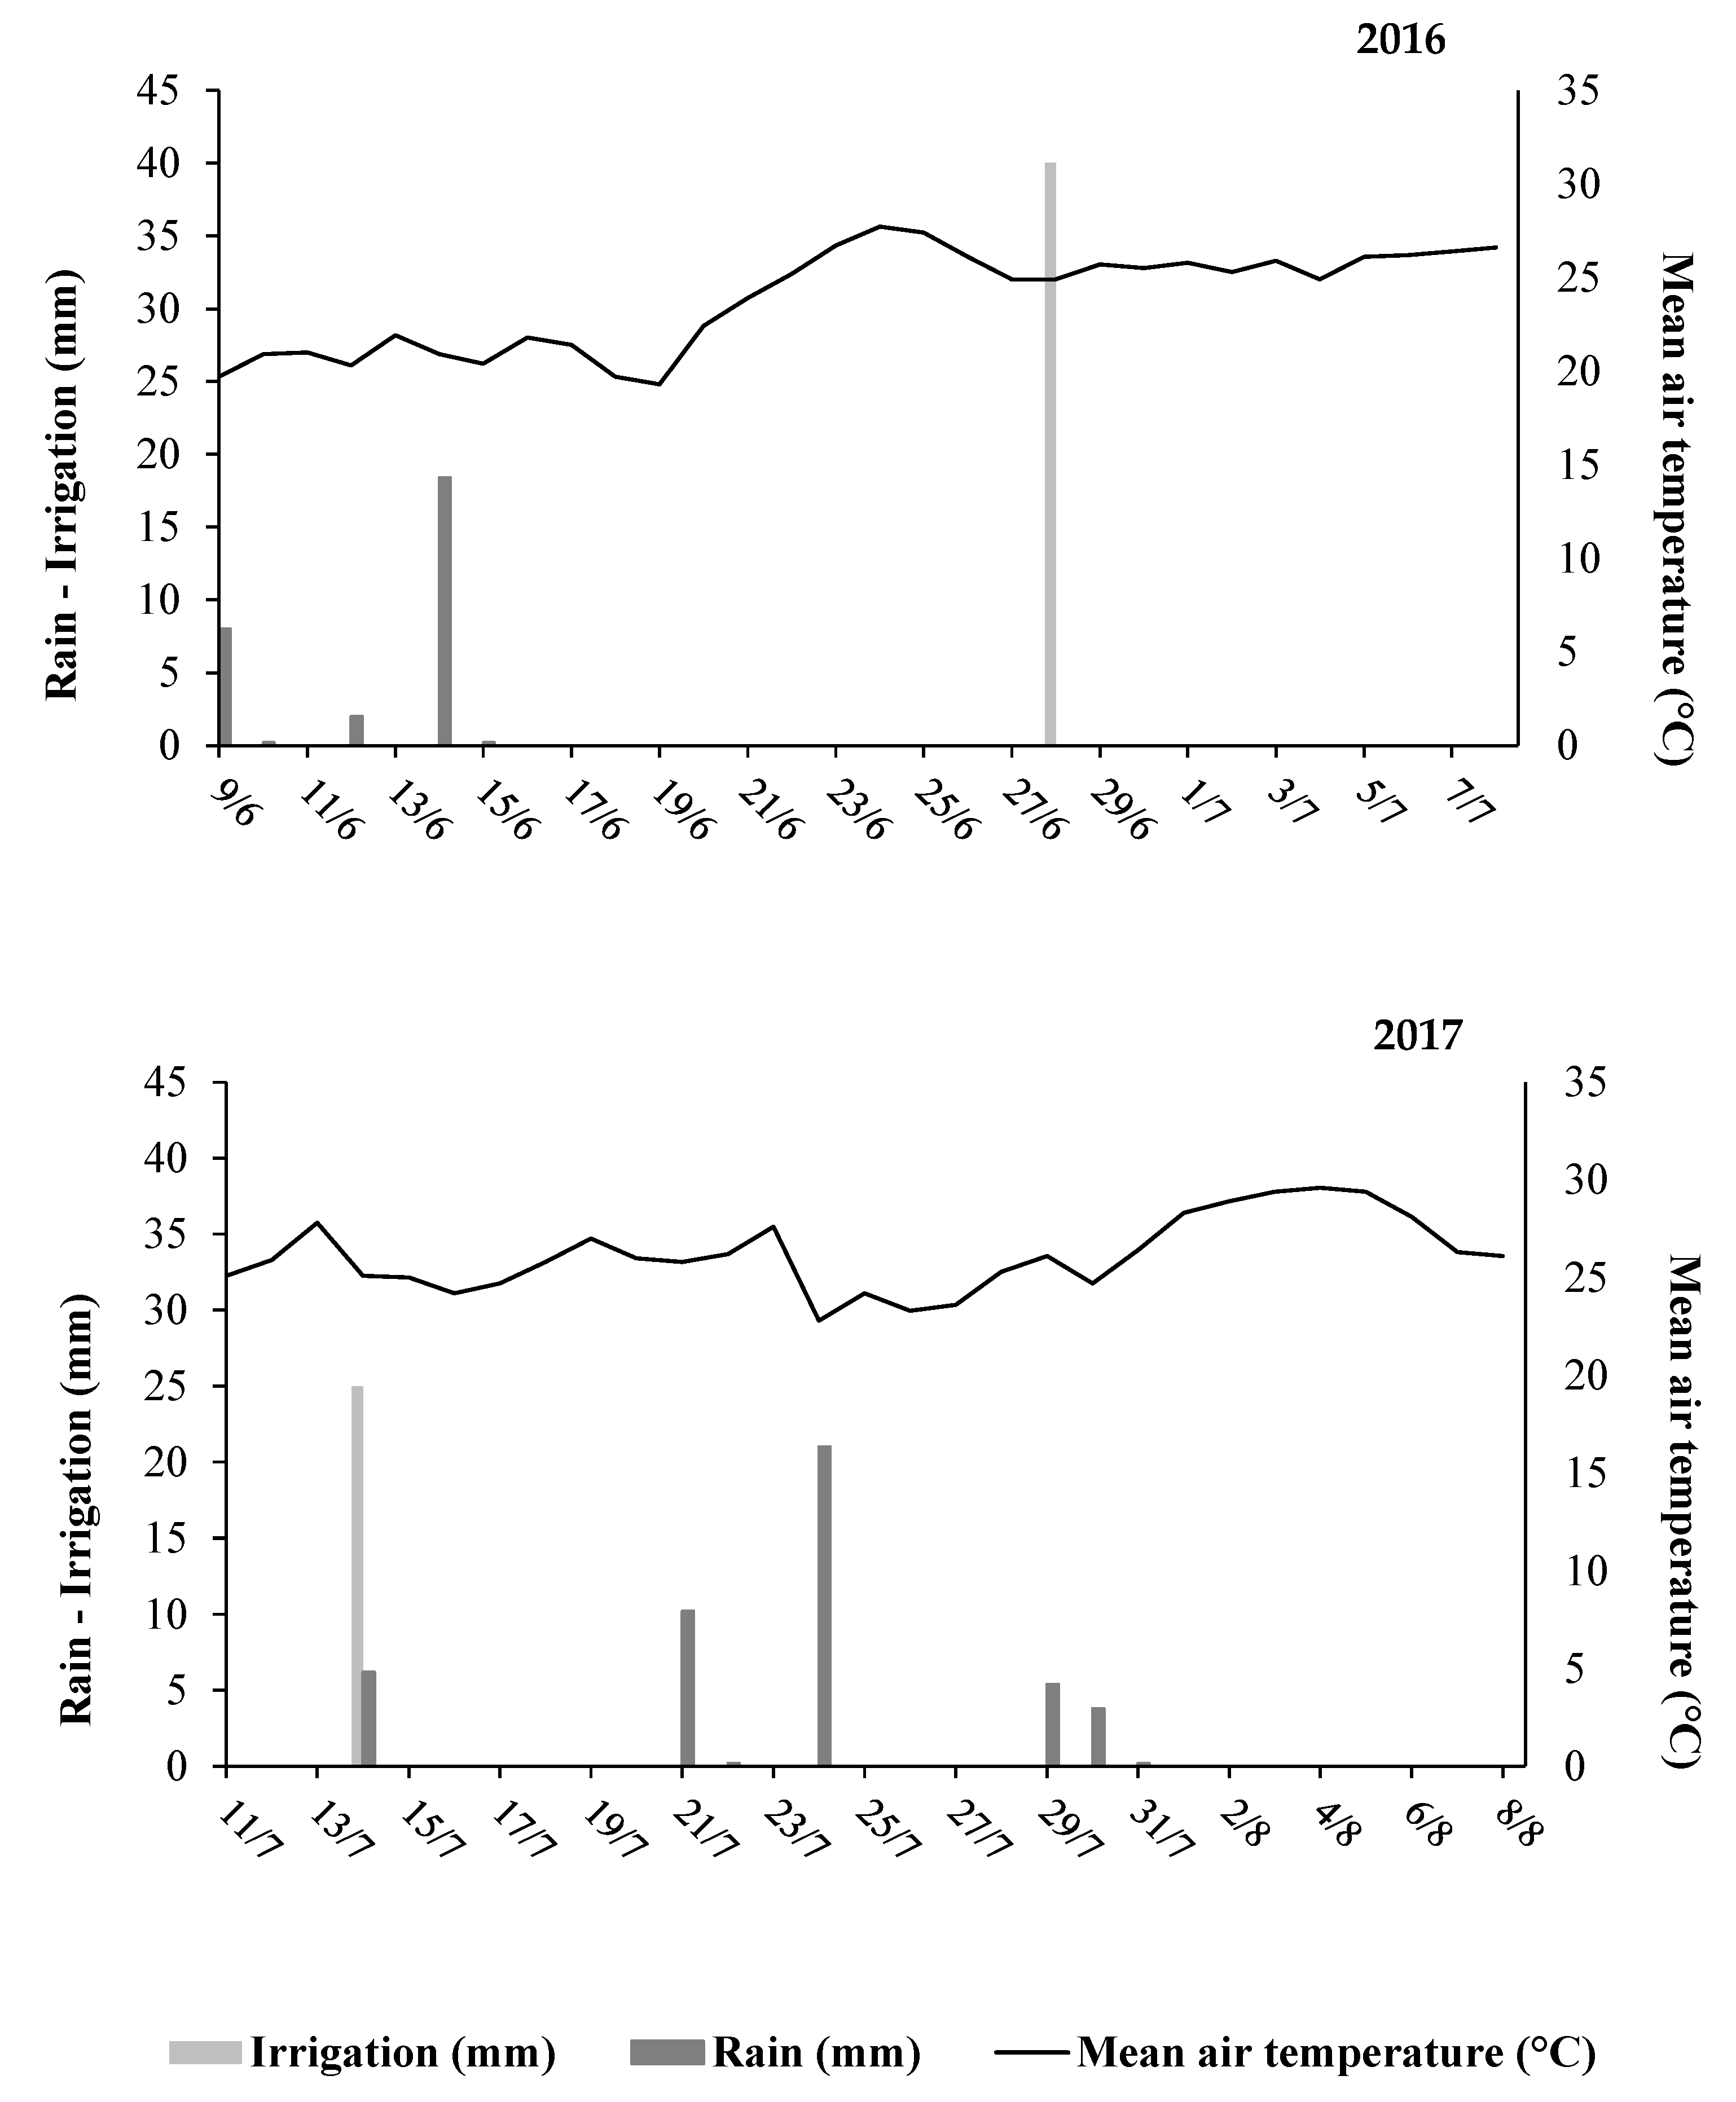
3.1. Weather Conditions

Mean daily air temperature, precipitation, and irrigation amounts are displayed in Figure 1. In 2016, two trends of mean daily temperature were detected, one from the beginning of the experimentation until June 20th (i.e., 20.8 ± 0.97 °C), and the second from this date to the end of the trial (i.e., 25.9 ± 0.94 °C). In 2017, mean daily air temperature was 26.2 ± 1.8.
The total amount of water received by the crop in the measurement period during 2016 was 69 mm, of which 29 mm was rainfall and 40 mm was irrigation water in 2016, while in 2017 the amount of water was 72 mm (25 as irrigation water). In 2016, rain occurred five times in the first week after the fertilization. In 2017, seven rain events occurred over the 21 days after the fertilizer application. Irrigation water was applied once in both years, by surface application in 2016 and by a sprinkler method in 2017.

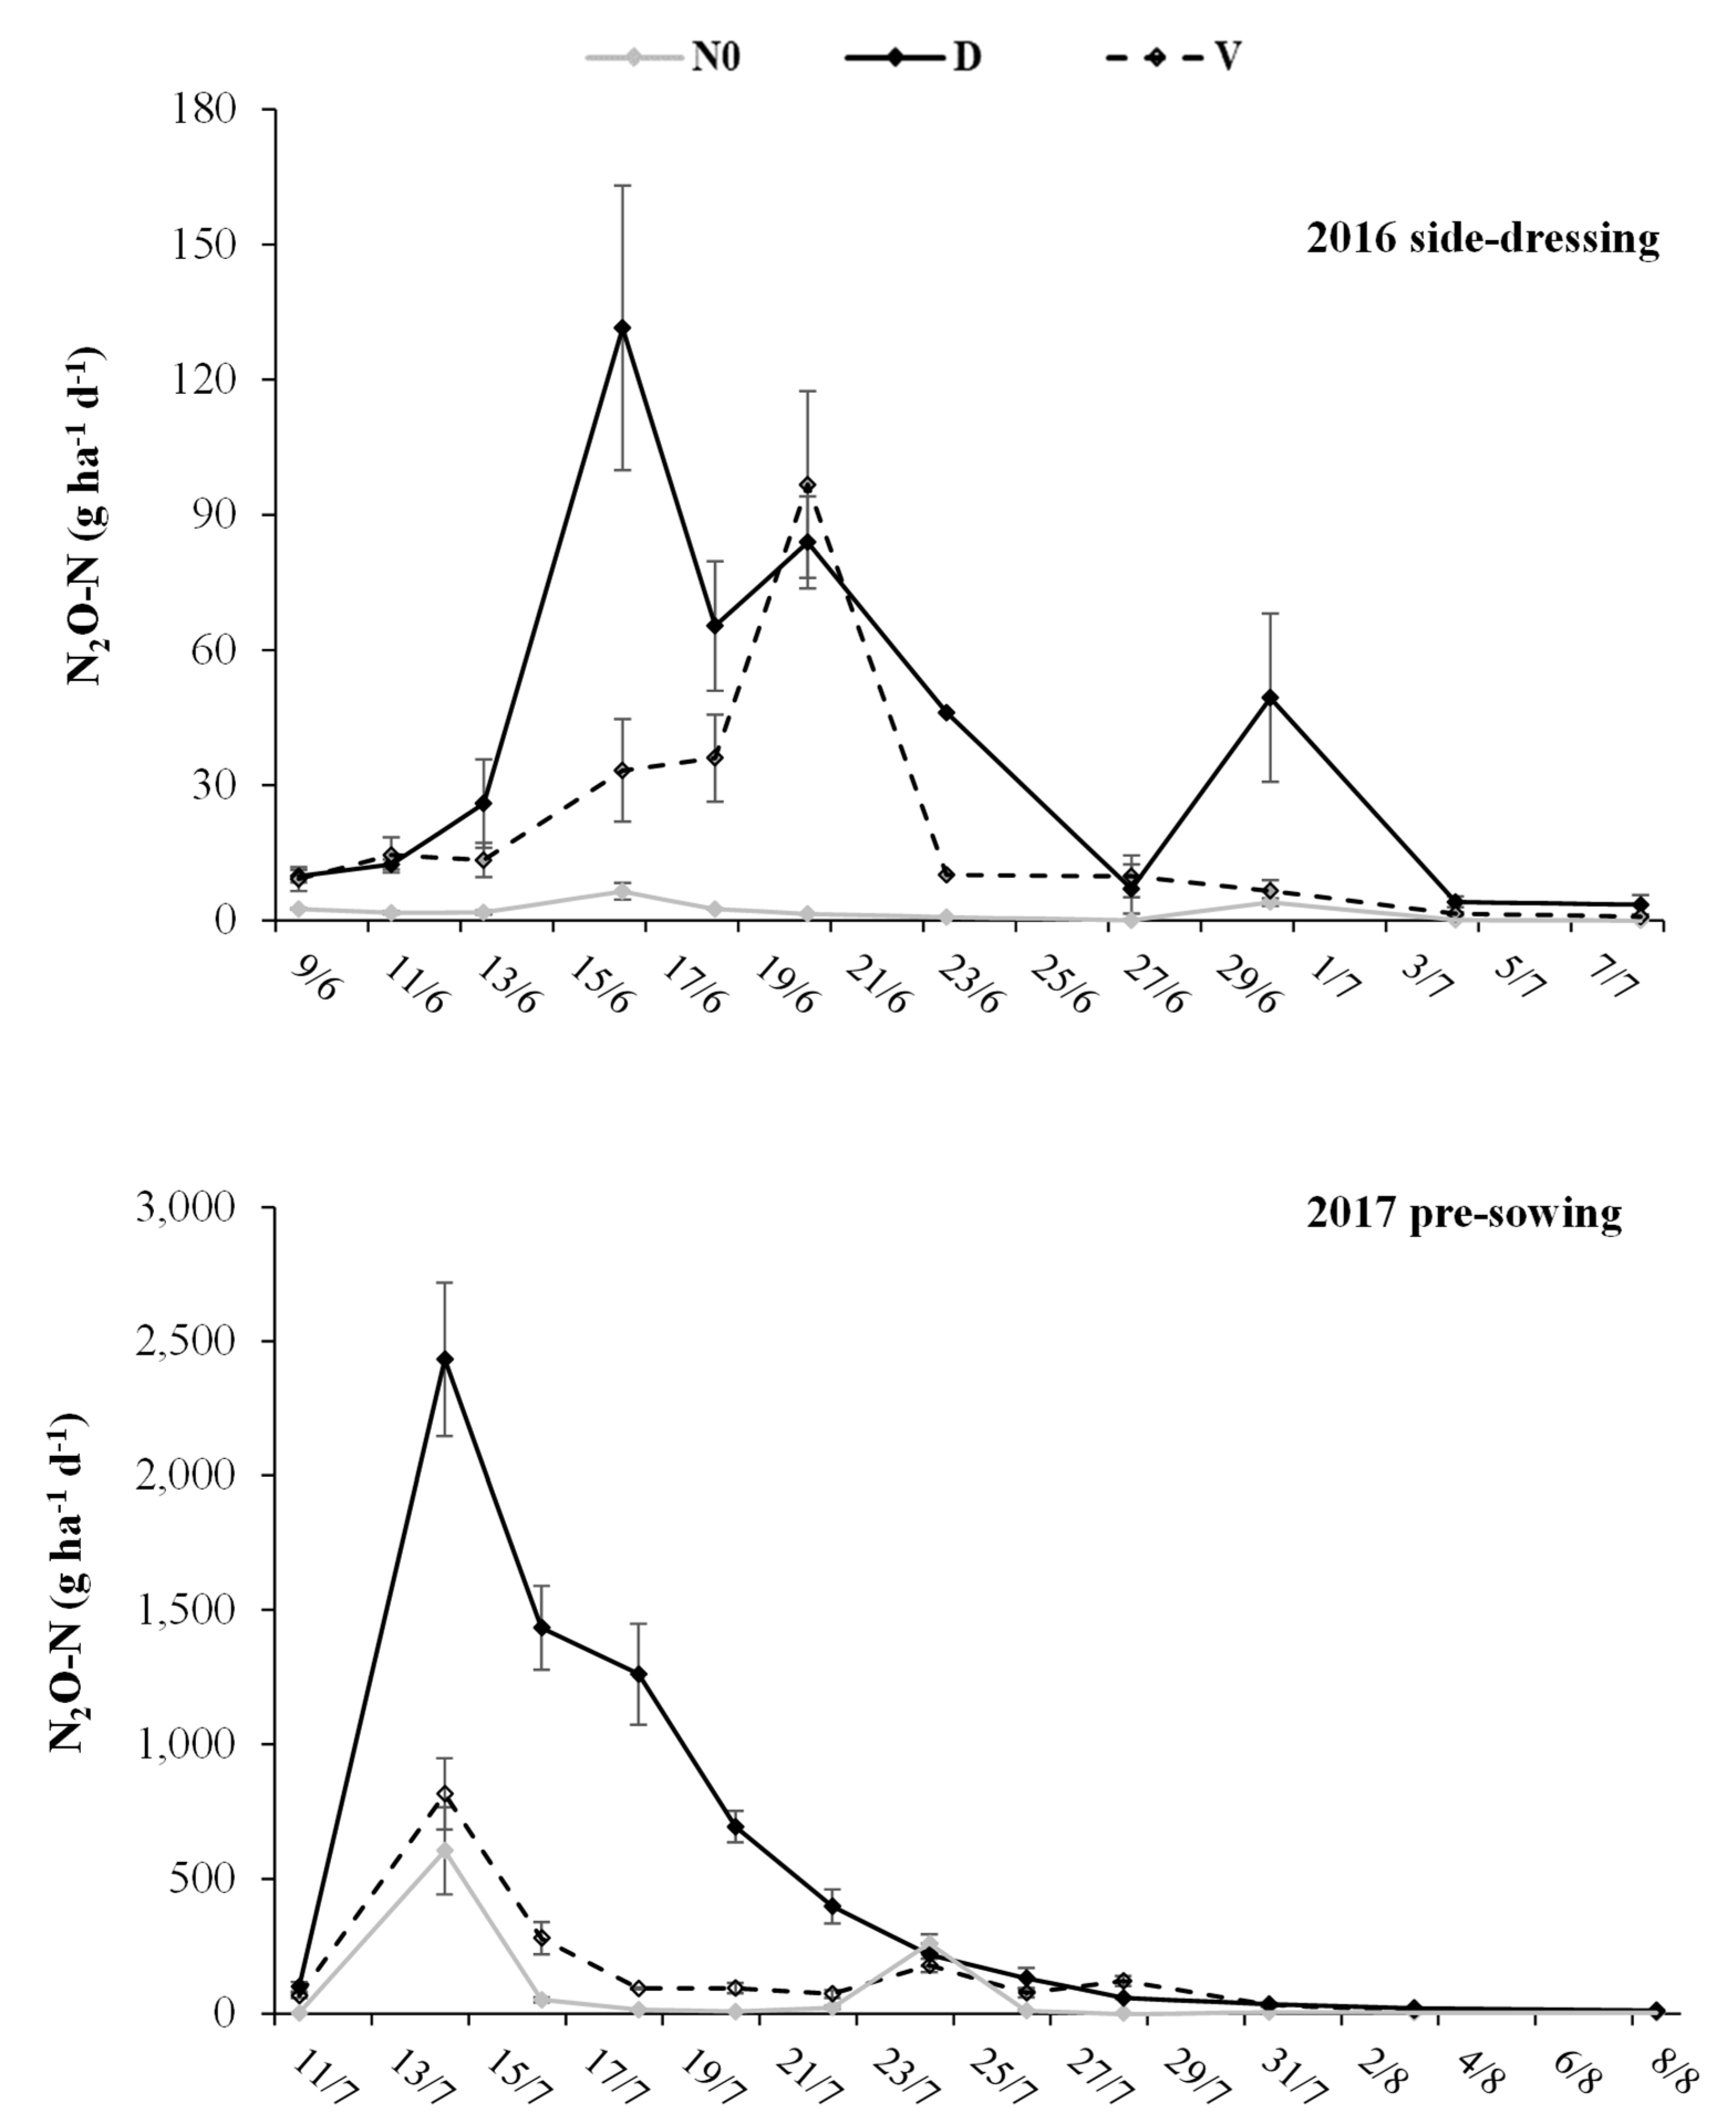
3.2. N2O-N Emissions

The daily N2O emissions are shown in Figure 2. Over the monitoring campaign in 2016, the average emissions were significantly higher in the D treatment than in the V treatment (p < 0.001). D treatment showed three peaks of emission of decreasing intensity on June 15th, 20th and 30th, while V treatment showed an increase of the emission after the application and described a main peak in correspondence of June 20th, to decrease afterwards to emissions close to the N0 treatments. Values determined for non-fertilized plot N0 were always lower than for the other treatments. For all the treatments, the emissions from July 4th toward the end of the experiment attained similar values.
In 2017, a first and main emission peak was observed on July 14th for all the treatments. The greatest peak was measured for the D treatment (2.3 times higher than the V treatment) (Figure 2). After this main peak the emissions dropped with a slower reduction over time for the D in comparison with the N0 and V treatments. A second emission peak was observed only for V and N0 treatments (July 22nd), matching in magnitude the constantly decreasing emission observed for D. A third increase of the daily emission was observed for the V treatment of the same magnitude of the previous. N0 followed the trend of V, remaining on lower values during the first peak (July 14th) and matching the D and V treatments on July 22nd. From July 31st onward, the treatments resulted in similar emissions.
The cumulative N2O emissions (Figure 3) were determined by linear interpolation between the N2O daily emissions. In both years, the V treatment resulted in lower N2O-N cumulated emissions than the D treatment, 50% and 81% lower in 2016 and 2017, respectively.
At the end of both experiments, N2O emitted reached steady values for all the treatments. The maximum difference between the cumulated N2O emissions of D and V treatments was reached eight and three days after the injection of the fertilizers, in 2016 and 2017 respectively (Figure 3). In these dates, the cumulative N2O emitted under V was 61.9% and 94.4% lower than under D in 2016 and 2017, respectively.
Overall, the cumulative N2O-N emissions dramatically decreased from D to V (Figure 3 and Figure 4). These differences resulted in different emission factors (EF) (Table 2).

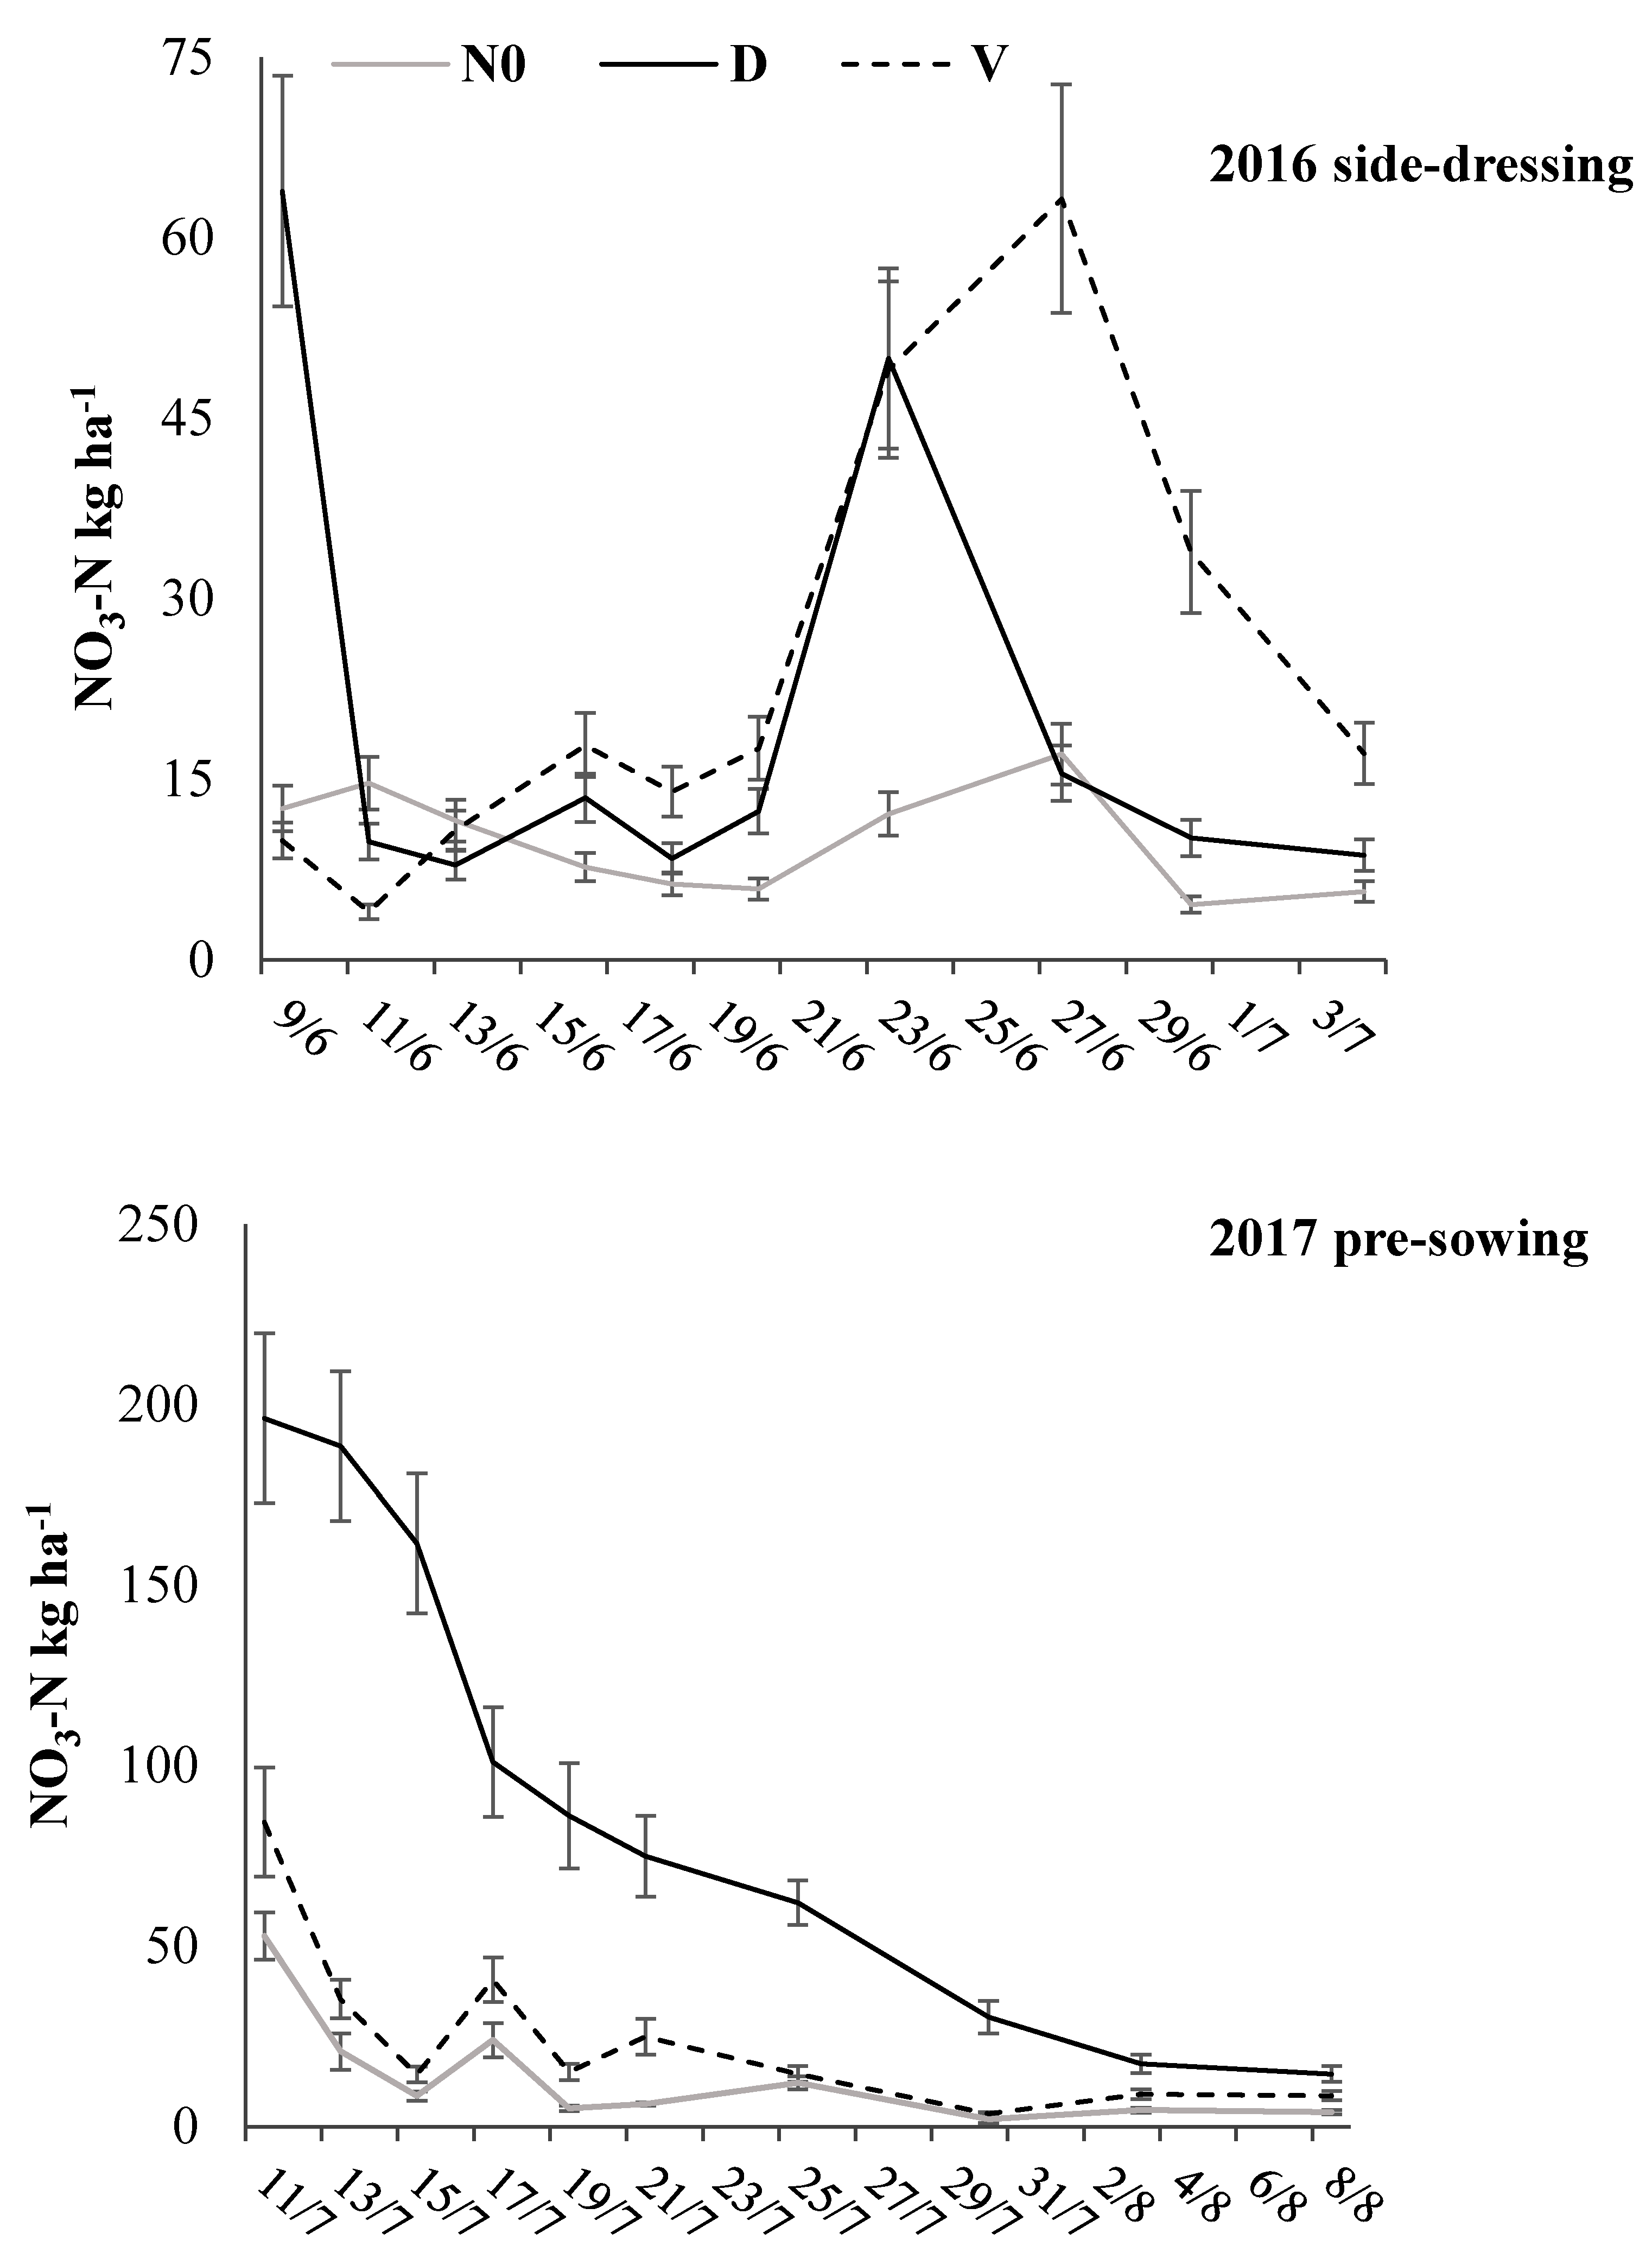
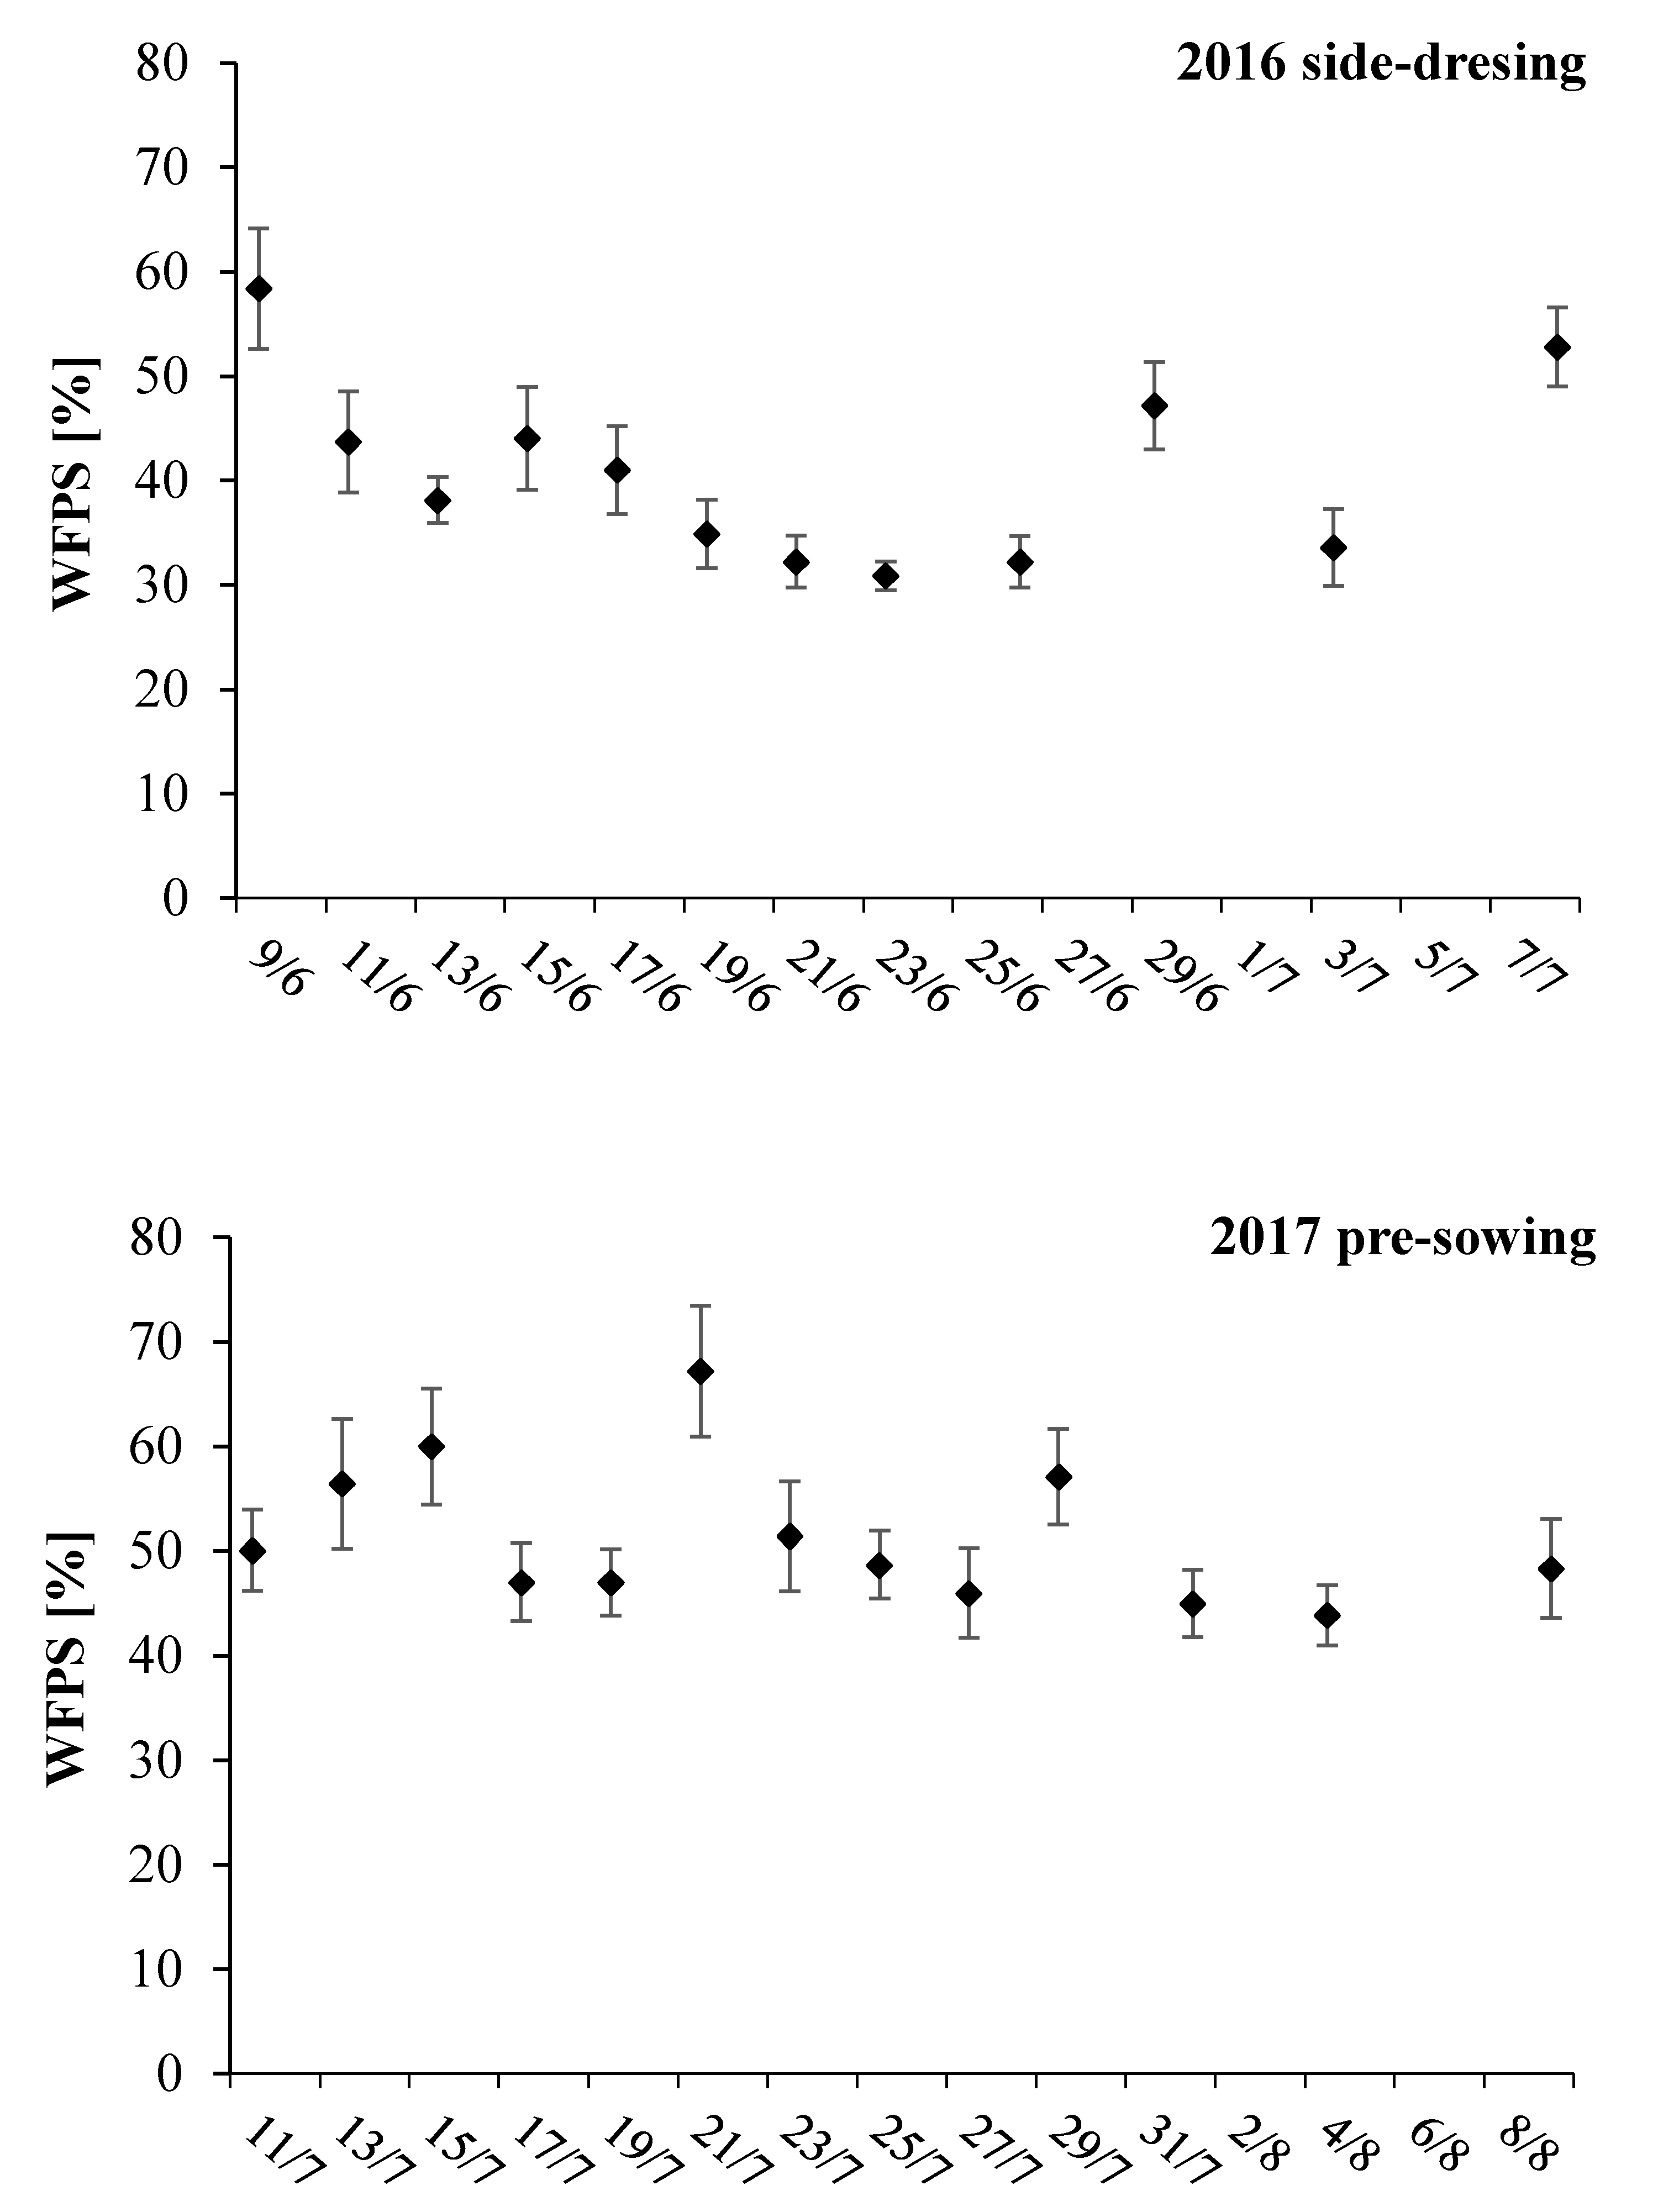
3.3. Bulk Density, NO3-N Content, and WFPS

The value of BD for each sampling layer and for each treatment and year are shown in Table 3. The values increased with the depth in both 2016 and 2017 trials, whereas within the same year, no significant differences were found between treatments (p = 0.46).
The NO3-N content in 2016 was not different among the treatments (p = 0.25). At the beginning of the monitoring experiments the concentration was higher in D than in N0 and V. Soon after, the content decreased until reaching the value of N0 and V (Figure 4). After June 20th, when mean daily air temperature increased, an increase in the NO3-N concentrations was detected in the three treatments, with different magnitudes.
In 2017, the NO3-N content in the soil was significantly higher in D compared to V and N0 (p < 0.01), while V and N0 did not differ between them (Figure 4). At the beginning of the field trial the NO3-N concentration were higher on average compared with the ones measured in the field of the 2016 trial. This can be due to the higher N rate applied in this field trial, which was four times higher than 2016. In contrast to the data observed in 2016, high concentrations of NO3-N at the beginning of the trial caused an immediate emission peak of N2O-N in all three treatments, with its magnitude being proportional to the NO3-N content, after a delay of a couple of days.
The WFPS did not significantly vary between treatments either in 2016 or in 2017 (p = 0.36 and p = 0.72, respectively). As expected, increases in WFPS were observed in response to water input, from rainfall or irrigation. In 2016, the values ranged between 33% and 59%, with an average value of 39%. In 2017, values were higher on average (51%) and ranged between 42% and 69%. (Figure 5).
The mean daily N2O-N emissions (g ha−1 d−1) are plotted against the mean daily WFPS in Figure 6. Both N2O-N emissions and WFPS were calculated as mean across treatments for both 2016 and 2017. WFPS was often lower than 60% and N2O-N emissions peaks occurred in the WFPS range between 50% and 70%, with higher frequency at WFPS equal to 50%.

4. Discussion

The maximum differences between D and V in daily N2O emissions were observed in the first week after digestate injection in both years, suggesting the remarkable effect of Vizura® in reducing the N2O-N emissions (Figure 2). The time lapse between the fertilizer application and the appearance of the first N2O-N peak suggests that a couple of days are required to activate nitrification. The effect of the DMPP to reduce the nitrification is evident when comparing V with D, especially in the rise of N2O-N emissions detected in July 18th 2017. The slower nitrification rate soon after the digestate injection in V resulted in higher NO3-N availability later in the season when compared to D. Conversely, the higher emissions found in V on July 20th can be explained by the fact that the availability of NH4 was presumably higher in this treatment compared to D, where it was earlier consumed.
The time lapse between the application of the fertilizer and the N2O-N peak in 2016 for D and V could be explained by the development of the microbial community responsible for N2O emission process. In this regard, Reference [51] observed that there is a time-lagged induction in N2O emissions, which was possibly caused by slow population growth of nitrifiers and/or by a slow shift in community of ammonia oxidizers. The cumulative N2O emissions grew differently in D and V treatments over the whole experiment. We considered this behavior as a clear effect of DMPP-based product in reducing the nitrification activity and consequently the N2O-N emissions. This result agrees with the outcome of many authors [25,35,52,53]. At the end of the 2016 experiment, the cumulative N2O-N emissions measured in V was approximatively 50% lower than in D. This phenomenon suggested that the effect of DMPP was still present. This finding agrees with the effects observed by Reference [54], who found low and stable NO3-N concentrations and increasing NH4-N concentration over 120 days after the application of DMPP and ammonium sulphate nitrate. Similarly, Reference [55] observed a significant effect of DMPP added to urea in reducing soil NO3-N concentrations for 60 days.
Matching the weather and irrigation data (Figure 1), WFPS (Figure 5) and the daily N2O emissions (Figure 2), a clear rise in N2O emissions was detected when either rain or irrigation occurred, suggesting that abundant water availability likely promoted the denitrification and nitrification process [56]. Moreover, Reference [16] found that the emission peaks in N2O occur typically between 0 and about 21 days after spreading and are often triggered by rain. In our study, the effect of soil water content varied between D and V. After the irrigation of June 28th 2016, an emission peak was observed on June 30th 2016, but only in D and not in the V treatment. This suggests that the nitrification inhibition was still active.
The rise on N2O emission on June 18th and 20th 2016 was higher in V treatment than in D treatment, although this difference was not statistically significant. These emissions were presumably due to the rise of the mean daily air temperatures and the low values of the WFPS (<40%) that create the suitable conditions for N2O-N emissions by nitrification process [56]. The effectiveness of the reduction of the N2O emissions with the use of the inhibitors observed in this study was greater compared to the values reported in the meta-analysis conducted by Reference [57], and in the review of Reference [23], in which the average reduction due to different inhibitors ranged from 8% to 57%. Recently, the authors of Reference [58] found no evidence about the effectiveness of DMPP added to slurry in Estonia. They also observed WFPS frequently above the 60%, which is recognized by many authors as the value above which N2O emissions are associated to denitrification rather than nitrification [7,56,59,60]. Another study, conducted by Reference [51], showed reduced nitrification activity with DMPP at 40% of WFPS and mean air temperature of 20 °C. In our study, WFPS was generally below 60% and N2O-N emissions mostly occurred when WFPS was between 30% and 60% (Figure 6). This result can suggest that the emissions observed in this study were likely due to nitrification. This finding was also confirmed by [61], who reported that nitrification is an aerobic process and occurs at low to medium soil water content. This result agrees with the N2O emissions and the WFPS found by Reference [11], i.e., 47%, in a maize-base cropping system in the Po Valley. In this environment the nitrification inhibition by DMPP appears indeed to be a feasible strategy for reducing N2O emissions.
The cumulative amount of N2O emitted in 2016 was much lower than the emission in 2017. The rapid increase of emissions observed in 2017 (Figure 2) could be caused by the combined effect of the larger amount of the nitrogen input, the mean daily air temperature, and the water added by sprinkler irrigation. In 2017, the emissions increased rapidly in response to the high dose of nitrogen injected into the soil at the beginning of the monitoring campaign. In a previous study, the authors of [62] found that N2O emissions were positively correlated with air temperature and soil temperature in a long-term experiment and under different fertilization systems. In 2016, the digestate was injected at the devolpement stage corresponding to stem elongation (37 of the BBCH scale) and the effect of temperature appeared to be reduced by the canopy cover. At that stage, the canopy covered most of the inter-row spaces and this likely caused lower solar radiation incidence on the soil surface and consequently lower topsoil temperature. Furthermore, the presence of a developed crop affected the availability of mineral nitrogen in the soil layer [14].
The effect of BD was also evaluated in this study, under the assumption that it could be a driver in the N2O-N emissions. In this respect, Reference [14] reported that soil water content in combination with soil physical properties, such as bulk density and texture are important factors influencing N2O emissions, as they determine total porosity and pore size distribution and in turn the diffusion of oxygen into the soil. In this study, BD values (Table 3), did not show differences between treatments for each analyzed layer.
The EF estimated for V treatment was comparable to the values adopted by the IPCC (1%). In this study, the EF reduction due to DMPP agrees with Reference [34], who found a reduction up to 70% due to DMPP added to digestate injected into soil under laboratory controlled conditions. The magnitude of the EF values calculated in this study is also consistent with data reported by Reference [11] for irrigated crops in Mediterranean area.
Finally, the effect of the nitrification inhibitors in reducing N2O emission in the Po Valley can be determined a potential increase of NH3 volatilization. This aspect requires a specific study for evaluating the interactions between volatilization and nitrification due to the inhibitors addition to digestate or slurry.

5. Conclusions

Our study found that the addition of the DMPP-based product Vizura® to the digestate significantly reduced the cumulative N2O emitted to the atmosphere. The DMPP-based product was effective in reducing the N2O emission within the experienced ranges of rainfall, air temperature, and N fertilization in the two experimental years, which were typical of the Po Valley in summer. These experiments confirmed the positive effect of DMPP in reducing N2O losses if applied and correctly mixed with digestate under different conditions and different amount of fertilizer. The outcome of the present study found that in the investigated environment—mainly characterized by high air temperature and low to medium soil water content during growing season of maize—N2O emissions were mainly generated by nitrification. In this context, the inhibition given by DMPP ensures the slowing down of the nitrification rate, which would be otherwise high. Considering its effectiveness in reducing N2O emissions, Vizura® appears to be a valuable solution for decreasing greenhouse gases emissions.

Author Contributions

Conceptualization, M.A.; methodology, M.E.C. and M.A.; Software, M.C. and M.A.; Formal analysis, M.E.C. and A.P.; investigation, A.P.; resources, M.A.; data curation, A.P.; writing—original draft preparation, M.E.C.; writing—review and editing, A.P. and M.C.; supervision, M.A.; funding acquisition, M.A.

Funding

This research was funded by BASF SE, Agricultural Solutions, Germany, and BASF Italia S.p.a., Divisione Agro.

Acknowledgments

The authors wish to thank their colleague Calogero Schillaci (post-doctoral research fellow at University of Milan, Department of Agricultural and Environmental Sciences) for helping during field samplings and laboratory analyses.

Conflicts of Interest

The authors declare no conflicts of interest and that the funders had no role in the design of the study; in the collection, analyses, or interpretation of data; in the writing of the manuscript, or in the decision to publish the results.

References

  1. Myhre, G.; Shindell, D.; Bréon, F.-M.; Collins, W.; Fuglestvedt, J.; Huang, J.; Koch, D.; Lamarque, J.-F.; Lee, D.; Mendoza, B.; et al. Anthropogenic and Natural Radiative Forcing. In Climate Change 2013: The Physical Science Basis. Contribution of Working Group I to the Fifth Assessment Report of the Intergovernmental Panel on Climate Change; Stocker, T.F., Qin, D., Plattner, G.-K., Tignor, M., Allen, S.K., Boschung, J., Nauels, A., Xia, Y., Bex, V., Midgley, P.M., Eds.; Cambridge University Press: Cambridge, UK; New York, NY, USA, 2013; Available online: https://www.ipcc.ch/site/assets/uploads/2018/02/WG1AR5_Chapter08_FINAL.pdf (accessed on 24 July 2019).
  2. Butler, J.H.; Montzka, S.A. The NOAA Annual Greenhouse Gas Index (AGGI). Updated: Spring 2019. Available online: https://www.esrl.noaa.gov/gmd/aggi/aggi.html (accessed on 25 July 2019).
  3. Davidson, E.A.; Keller, M.; Erickson, H.E.; Verchot, L.V.; Veldkamp, E. Testing a Conceptual Model of Soil Emissions of Nitrous and Nitric Oxides: Using two functions based on soil nitrogen availability and soil water content, the hole-in-the-pipe model characterizes a large fraction of the observed variation of nitric oxide and nitrous oxide emissions from soils. BioScience 2000, 50, 667–680. [Google Scholar] [CrossRef]
  4. Fowler, D.; Coyle, M.; Skiba, U.; Sutton, M.A.; Cape, J.N.; Reis, S.; Sheppard, L.J.; Jenkins, A.; Grizzetti, B.; Galloway, J.N.; et al. The global nitrogen cycle in the twenty-first century. Philos. Trans. R. Soc. B Biol. Sci. 2013, 368, 20130164. [Google Scholar] [CrossRef] [PubMed]
  5. Shcherbak, I.; Neville, M.; Robertson, G.P. Global metaanalysis of the nonlinear response of soil nitrous oxide (N2O) emissions to fertilizer nitrogen. Proc. Natl. Acad. Sci. USA 2014, 111, 9199–9204. [Google Scholar] [CrossRef]
  6. Dalal, R.; Allen, D. Greenhouse gas emissions from natural ecosystems. Aust. J. Bot. 2008, 56, 369–407. [Google Scholar] [CrossRef]
  7. Ruser, R.; Flessa, H.; Russow, R.; Schmidt, G.; Buegger, F.; Munch, J.C. Emission of N2O, N2 and CO2 from soil fertilized with nitrate: Effect of compaction, soil moisture and rewetting. Soil Biol. Biochem. 2006, 38, 263–274. [Google Scholar] [CrossRef]
  8. Snyder, C.S.; Bruulsema, T.W.; Jensen, T. Review of greenhouse gas emissions from crop production systems and fertilizer management effects. Agric. Ecosyst. Environ. 2009, 133, 247–266. [Google Scholar] [CrossRef]
  9. Cowan, N.J.; Levy, P.E.; Famulari, D.; Anderson, M.; Drewer, J.; Carozzi, M.; Reay, D.S.; Skiba, U.M. The influence of tillage on N2O fluxes from an intensively managed grazed grassland in Scotland. Biogeosciences 2016, 13, 4811–4821. [Google Scholar] [CrossRef]
  10. Perego, A.; Wu, L.; Gerosa, G.; Finco, A.; Chiazzese, M.; Amaducci, S. Field evaluation combined with modelling analysis to study fertilizer and tillage as factors affecting N2O emissions: A case study in the Po valley (Northern Italy). Agric. Ecosyst. Environ. 2016, 225, 72–85. [Google Scholar] [CrossRef]
  11. Cayuela, M.L.; Aguilera, E.; Sanz-Cobena, A.; Adams, D.C.; Abalos, D.; Barton, L.; Ryals, R.; Silver, W.L.; Alfaro, M.A.; Pappa, V.A.; et al. Direct nitrous oxide emissions in Mediterranean climate cropping systems: Emission factors based on a meta-analysis of available measurement data. Agric. Ecosys. Environ. 2017, 238, 25–35. [Google Scholar] [CrossRef]
  12. Volpi, I.; Laville, P.; Bonari, E.; o di Nasso, N.N.; Bosco, S. Improving the management of mineral fertilizers for nitrous oxide mitigation: The effect of nitrogen fertilizer type, urease and nitrification inhibitors in two different textured soils. Geoderma 2017, 307, 181–188. [Google Scholar] [CrossRef]
  13. Zhu, J.; Mulder, J.; Wu, L.P.; Meng, X.X.; Wang, Y.H.; Dörsch, P. Spatial and temporal variability of N2O emissions in a subtropical forest catchment in China. Biogeosciences 2013, 10, 1309–1321. [Google Scholar] [CrossRef]
  14. Butterbach-Bahl, K.; Baggs, E.M.; Dannenmann, M.; Kiese, R.; Zechmeister-Boltenstern, S. Nitrous oxide emissions from soils: How well do we understand the processes and their controls? Philos. Trans. R. Soc. B Biol. Sci. 2013, 368. [Google Scholar] [CrossRef] [PubMed]
  15. Dobbie, K.E.; McTaggart, I.P.; Smith, K.A. Nitrous oxide emissions from intensive agricultural systems: Variations between crops and seasons, key driving variables, and mean emission factors. J. Geophys. Res. Atmos. 1999, 104, 26891–26899. [Google Scholar] [CrossRef]
  16. Skiba, U.; Jones, S.K.; Drewer, J.; Helfter, C.; Anderson, M.; Dinsmore, K.; McKenzie, R.; Nemitz, E.; Sutton, M.A. Comparison of soil greenhouse gas emissions from extensive and intensive grazing in a temperate maritime climate. Biogeosciences 2013, 10, 1231–1241. [Google Scholar] [CrossRef]
  17. Möller, K.; Stinner, W.; Deuker, A.; Leithold, G. Effects of different manuring systems with and without biogas digestion on nitrogen cycle and crop yield in mixed organic dairy farming systems. Nutr. Cycl. Agroecosyst. 2008, 82, 209–232. [Google Scholar] [CrossRef]
  18. Koszel, M.; Kocira, A.; Lorencowicz, E. The evaluation of the use of biogas plant digestate as a fertilizer in alfalfa and spring wheat cultivation. Fresenius Environ. Bull. 2016, 25, 3258–3264. [Google Scholar]
  19. Tambone, F.; Terruzzi, L.; Scaglia, B.; Adani, F. Composting of the solid fraction of digestate derived from pig slurry: Biological processes and compost properties. Waste Manag. 2015, 35, 55–61. [Google Scholar] [CrossRef] [PubMed]
  20. Webb, J.; Sørensen, P.; Velthof, G.; Amon, B.; Pinto, M.; Rodhe, L.; Salomon, E.; Hutchings, N.; Burczyk, P.; Reid, J. An assessment of the variation of manure nitrogen efficiency throughout Europe and an appraisal of means to increase manure-N efficiency. Adv. Agron. 2013, 119, 371–442. [Google Scholar]
  21. Prasad, R.; Power, J.F. Nitrification Inhibitors for Agriculture, Health, and the Environment. Adv. Agron. 1995, 233–281. [Google Scholar] [CrossRef]
  22. Ruser, R.; Schulz, R. The effect of nitrification inhibitors on the nitrous oxide (N2O) release from agricultural soils—A review. J. Plant Nutr. Soil Sci. 2015, 178, 171–188. [Google Scholar] [CrossRef]
  23. Subbarao, G.V.; Ito, O.; Sahrawat, K.L.; Berry, W.L.; Nakahara, K.; Ishikawa, T.; Watanabe, T.; Suenaga, K.; Rondon, M.; Rao, I.M. Scope and Strategies for Regulation of Nitrification in Agricultural Systems—Challenges and Opportunities. Crit. Rev. Plant Sci. 2006, 25, 303–335. [Google Scholar] [CrossRef]
  24. Merino, P.; Menéndez, S.; Pinto, M.; González-Murua, C.; Estavillo, J.M. 3,4-Dimethylpyrazole phosphate reduces nitrous oxide emissions from grassland after slurry application. Soil Use Manag. 2005, 21, 53–57. [Google Scholar] [CrossRef]
  25. Misselbrook, T.H.; Cardenas, L.M.; Camp, V.; Thorman, R.E.; Williams, J.R.; Rollett, A.J.; Chambers, B.J. An assessment of nitrification inhibitors to reduce nitrous oxide emissions from UK agriculture. Environ. Res. Lett. 2014, 9, 115006. [Google Scholar] [CrossRef] [Green Version]
  26. Bronson, K.F.; Mosier, A.R.; Bishnoi, S.R. Nitrous Oxide Emissions in Irrigated Corn as Affected by Nitrification Inhibitors. Soil Sci. Soc. Am. J. 1992, 56, 161–165. [Google Scholar] [CrossRef] [Green Version]
  27. Habibullah, H.; Nelson, K.; Motavalli, P. Management of Nitrapyrin and Pronitridine Nitrification Inhibitors with Urea Ammonium Nitrate for Winter Wheat Production. Agronomy 2018, 8, 204. [Google Scholar] [CrossRef]
  28. Huérfano, X.; Menéndez, S.; Bolaños-Benavides, M.M.; González-Murua, C.; Estavillo, J.M. 3,4-dimethylpyrazole phosphate (DMPP) reduces N2O Emissions from a Tilled Grassland in the Bogotá Savanna. Agronomy 2019, 9, 102. [Google Scholar] [CrossRef]
  29. Zerulla, W.; Barth, T.; Dressel, J.; Erhardt, K.; von Locquenghien, K.H.; Pasda, G.; Rädle, M.; Wissemeier, A. 3,4-Dimethylpyrazole phosphate (DMPP)—A new nitrification inhibitor for agriculture and horticulture. Biol. Fertil. Soils 2001, 34, 79–84. [Google Scholar] [CrossRef]
  30. Tindaon, F.; Benckiser, G.; Ottow, J.C. Evaluation of ecological doses of the nitrification inhibitors 3, 4-dimethylpyrazole phosphate (DMPP) and 4-chloromethylpyrazole (ClMP) in comparison to dicyandiamide (DCD) in their effects on dehydrogenase and dimethyl sulfoxide reductase activity in soils. Biol. Fertil. Soils 2012, 48, 643–650. [Google Scholar]
  31. Andreae, M. ENTEC (DMPP—E in neuer Ammoniumstabilisator: Ökotoxikologische Bewertung. In Düngen mit einer neuen Technologie—Innovation in der Düngung. Wissenschaftliches Kolloquium Agrarzentrum der BASF Limburgerhof; BASF: Ludwigshafen, Germany, 1999; Volume 7, pp. 3–10. [Google Scholar]
  32. Rodrigues, J.M.; Lasa, B.; Aparicio-Tejo, P.M.; González-Murua, C.; Marino, D. 3,4-Dimethylpyrazole phosphate and 2-(N-3, 4-dimethyl-1H-pyrazol-1-yl) succinic acid isomeric mixture nitrification inhibitors: Quantification in plant tissues and toxicity assays. Sci. Total Environ. 2018, 624, 1180–1186. [Google Scholar] [CrossRef] [PubMed]
  33. Severin, M.; Fuß, R.; Well, R.; Hähndel, R.; Van den Weghe, H. Greenhouse gas emissions after application of digestate: Short-term effects of nitrification inhibitor and application technique effects. Arch. Agron. Soil Sci. 2016, 62, 1007–1020. [Google Scholar] [CrossRef]
  34. Dittert, K.; Bol, R.; King, R.; Chadwick, D.; Hatch, D. Use of a novel nitrification inhibitor to reduce nitrous oxide emission from15N-labelled dairy slurry injected into soil. Rapid Commun. Mass Spectrom. 2001, 15, 1291–1296. [Google Scholar] [CrossRef] [PubMed]
  35. Weiske, A.; Benckiser, G.; Herbert, T.; Ottow, J. Influence of the nitrification inhibitor 3,4-dimethylpyrazole phosphate (DMPP) in comparison to dicyandiamide (DCD) on nitrous oxide emissions, carbon dioxide emissions and methane oxidation during 3 years of repeated application in field experiments. Biol. Fertil. Soils 2001, 34, 109–117. [Google Scholar] [CrossRef]
  36. Fangueiro, D.; Ribeiro, H.; Vasconcelos, E.; Coutinho, J.; Cabral, F. Treatment by acidification followed by solid–liquid separation affects slurry and slurry fractions composition and their potential of N mineralization. Bioresour. Technol. 2009. [Google Scholar] [CrossRef] [PubMed]
  37. Delwiche, C.C.; Rolston, D.E. Measurement of small nitrous oxide concentrations by gas chromatography [Denitrification, helium ionization]. Soil Sci. Soc. Am. J. 1976, 40, 324–327. [Google Scholar]
  38. Matthias, A.D.; Yarger, D.N.; Weinbeck, R.S. A numerical evaluation of chamber methods for determining gas emissions. Geophys. Res. Lett. 1978, 5, 765–768. [Google Scholar] [CrossRef]
  39. Denmead, O.T. Approaches to measuring emissions of methane and nitrous oxide between landscapes and the atmosphere. Plant Soil 2008, 309, 5–24. [Google Scholar] [CrossRef]
  40. Rochette, P. Towards a standard non-steady-state chamber methodology for measuring soil N2O emissions. Anim. Feed Sci. Technol. 2011, 166, 141–146. [Google Scholar] [CrossRef]
  41. Perego, A.; Giussani, A.; Sanna, M.; Fumagalli, M.; Carozzi, M.; Alfieri, L.; Brenna, S.; Acutis, M. The ARMOSA simulation crop model: Overall features, calibration and validation results. Ital. J. Agrometeorol. 2013, 3, 23–38. [Google Scholar]
  42. Fumagalli, M.; Perego, A.; Acutis, M. Modelling nitrogen leaching from sewage sludge application to arable land in the Lombardy region (northern Italy). Sci. Total Environ. 2013, 461, 509–518. [Google Scholar] [CrossRef]
  43. Acutis, M.; Alfieri, L.; Giussani, A.; Provolo, G.; Di Guardo, A.; Colombini, S.; Bertoncini, G.; Castelnuovo, M.; Sali, G.; Moschini, M.; et al. ValorE: An integrated and GIS-based decision support system for livestock manure management in the Lombardy region (northern Italy). Land Use Policy 2014, 41, 149–162. [Google Scholar] [CrossRef]
  44. Meier, U. Growth Stages of Mono-and Dicotyledonous Plants; Blackwell Wissenschafts-Verlag: Hoboken, NJ, USA, 1997. [Google Scholar]
  45. Chadwick, D.R.; Cardenas, L.; Misselbrook, T.H.; Smith, K.A.; Rees, R.M.; Watson, C.J.; McGeough, K.L.; Williams, J.R.; Cloy, J.M.; Thorman, R.E.; et al. Optimizing chamber methods for measuring nitrous oxide emissions from plot-based agricultural experiments. Eur. J. Soil Sci. 2014, 65, 295–307. [Google Scholar] [CrossRef]
  46. Livingston, G.P.; Hutchinson, G.L. Enclosure-based measurement of trace gas exchange: Applications and sources of error. In Biogenic Trace Gases: Measuring Emissions from Soil and Water; Matson, P., Ed.; Blackwell Science: Oxford, UK, 1995. [Google Scholar]
  47. Rochette, P.; Eriksen-Hamel, N.S. Chamber Measurements of Soil Nitrous Oxide Flux: Are Absolute Values Reliable? Soil Sci. Soc. Am. J. 2008, 72, 331–342. [Google Scholar] [CrossRef]
  48. De Klein, C.A.M.; Harvey, M.J. Nitrous oxide chamber methodology guidelines. In Global Research Alliance on Agricultural Greenhouse Gases; Version 1.1.; de Klein, C.A.M., Harvey, M., Eds.; Ministry for Primary Industries: Wellington, New Zealand, 2015; ISBN 978-0-478-40584-2. [Google Scholar]
  49. Efron, B.; Tibshirani, R. Bootstrap methods for standard errors, confidence intervals, and other measures of statistical accuracy. Stat. Sci. 1986, 1, 54–75. [Google Scholar] [CrossRef]
  50. Ding, W.; Yagi, K.; Akiyama, H.; Sudo, S.; Nishimura, S. Time-lagged induction of N2O emission and its trade-off with NO emission from a nitrogen fertilized Andisol. Soil Sci. Plant Nutr. 2007, 53, 362–372. [Google Scholar] [CrossRef]
  51. Macadam, X.M.B.; del Prado, A.; Merino, P.; Estavillo, J.M.; Pinto, M.; González-Murua, C. Dicyandiamide and 3,4-dimethyl pyrazole phosphate decrease N2O emissions from grassland but dicyandiamide produces deleterious effects in clover. J. Plant Physiol. 2003, 160, 1517–1523. [Google Scholar] [CrossRef]
  52. Menéndez, S.; Merino, P.; Pinto, M.; González-Murua, C.; Estavillo, J.M. 3,4-Dimethylpyrazol Phosphate Effect on Nitrous Oxide, Nitric Oxide, Ammonia, and Carbon Dioxide Emissions from Grasslands. J. Environ. Qual. 2006, 35, 973–981. [Google Scholar] [CrossRef]
  53. Serna, M.D.; Bañuls, J.; Quiñones, A.; Primo-Millo, E.; Legaz, F. Evaluation of 3,4-dimethylpyrazole phosphate as a nitrification inhibitor in a Citrus-cultivated soil. Biol. Fertil. Soils 2000, 32, 41–46. [Google Scholar] [CrossRef]
  54. Díez-López, J.A.; Hernaiz-Algarra, P.; Arauzo-Sánchez, M.; Carrasco-Martín, I. Effect of a nitrification inhibitor (DMPP) on nitrate leaching and maize yield during two growing seasons. Span. J. Agric. Res. 2008, 2, 294–303. [Google Scholar] [CrossRef]
  55. Cardenas, L.M.; Bol, R.; Lewicka-Szczebak, D.; Gregory, A.S.; Matthews, G.P.; Whalley, W.R.; Misselbrook, T.H.; Scholefield, D.; Well, R. Effect of soil saturation on denitrification in a grassland soil. Biogeosciences 2017, 14, 4691–4710. [Google Scholar] [CrossRef] [Green Version]
  56. Akiyama, H.; Yan, X.; Yagi, K. Evaluation of effectiveness of enhanced-efficiency fertilizers as mitigation options for N2O and NO emissions from agricultural soils: Meta-analysis. Glob. Chang. Biol. 2010, 16, 1837–1846. [Google Scholar] [CrossRef]
  57. Escuer Gatius, J.; Shanskiy, M.; Mander, U.; Kauer, K.; Astover, A.; Soosaar, K. Effectiveness of a Nitrification Inhibitor to Reduce N2O Emissions—A Case Study in Estonia; European Geoscience Union General Assembly: Vienna, Austria, 2019. [Google Scholar]
  58. Grundmann, G.L.; Rolston, D.E. A water function approximation to degree of anaerobiosis associated with denitrification. Soil Sci. 1987, 144, 437–441. [Google Scholar] [CrossRef]
  59. Davidson, E.A.; Vitousek, P.M.; Matson, P.A.; Riley, R.; García-Méndez, G.; Maass, J.M. Soil emissions of nitric oxide in a seasonally dry tropical forest of Mexico. J. Geophys. Res. Atmos. 1991, 96, 15439–15445. [Google Scholar] [CrossRef]
  60. Torralbo, F.; Menéndez, S.; Barrena, I.; Estavillo, J.M.; Marino, D.; González-Murua, C. Dimethyl pyrazol-based nitrification inhibitors effect on nitrifying and denitrifying bacteria to mitigate N2O emission. Sci. Rep. 2017, 7, 13810. [Google Scholar] [CrossRef] [PubMed]
  61. Khalil, K.; Mary, B.; Renault, P. Nitrous oxide production by nitrification and denitrification in soil aggregates as affected by O2 concentration. Soil Biol. Biochem. 2004, 36, 687–699. [Google Scholar] [CrossRef]
  62. Sosulski, T.; Szara, E.; Stępień, W.; Szymańska, M. Nitrous oxide emissions from the soil under different fertilization systems on a long-term experiment. Plant Soil Environ. 2014, 60, 481–488. [Google Scholar] [CrossRef] [Green Version]
Figure 1. Mean daily air temperature, rainfall and irrigation amounts in side-dressing (2016, upper panel) and pre-sowing (2017, lower panel) fertilizations.
Agronomy 09 00431 g001
Figure 2. Mean daily N2O emissions (g N2O-N ha−1 d−1) after side-dressing (“2016”, upper panel) and pre-sowing (“2017”, lower panel). Non-fertilized plot (N0), digestate injection (D) and digestate + DMPP injection (V). The displayed data were calculated as mean across blocks (n = 3). Error bars represent mean standard error, ±.
Agronomy 09 00431 g002
Figure 3. Cumulative N2O emissions (g N2O-N ha−1) after side-dressing (“2016”, upper panel) and pre-sowing (“2017”, lower panel). Non-fertilized plot (N0), digestate injection (D) and digestate + DMPP injection (V). Dotted lines represent the standard deviation of the cumulated emissions measured in the three blocks.
Agronomy 09 00431 g003
Figure 4. NO3-N content in the soil (kg NO3-N ha−1) during side-dressing (“2016”, upper panel) and pre-sowing (“2017”, lower panel). Non-fertilized plot (N0), digestate injection (D) and digestate + DMPP injection (V). The displayed data were calculated as mean across the three blocks. Error bars represent mean standard error, ±.
Agronomy 09 00431 g004
Figure 5. Daily water-filled pore spaces (WFPS, %) calculated as function of the gravimetric soil water content (m3 m−3), which was measured at 0.3 m soil depth, and the bulk density (mean of the five soil layers). The displayed data were calculated as mean across the three treatments. Error bars represent mean standard error, ±.
Agronomy 09 00431 g005
Figure 6. Daily WFPS (%) and the mean N2O-N emissions (g ha−1 d−1) across treatments measured in 2016 and in 2017. The dashed line represents the value of WFPS (i.e., 60%) below and above which N2O-N emissions are likely due to nitrification and denitrification, respectively.
Agronomy 09 00431 g006
Table 1. Main soil characteristics of the experimental fields.
VariableYear
20162017
Sand (%)56.543.7
Silt (%)24.938.8
Clay (%)18.618.5
pH6.86.7
Total N (g N kg−1)1.762.26
Table 2. The emission factors estimated for D and V in 2016 and in 2017. EF are determined as percentage of N applied subtracted by emissions measured under N0 (non-fertilized plot). Digestate injection (D) and digestate + inhibitor injection (V). ± standard deviations (n = 3). Different letters indicate statistically significant differences between the two means within year, according to the Tukey post-hoc test.
YearsTreatmentApplication MethodTotal Supplied N
(kg N ha−1)
Supplied
NH4-N
(kg NH4-N ha−1)
Cumulative N2O-N
Emissions
(kg N2O-N ha−1)
EF (%)
2016DInter-row injection6127.81.1 ± 0.2a1.8 ± 0.3a
V0.52 ± 0.1b0.9 ± 0.2b
2017DTines harrow injection238167.59.22 ± 1.2a3.9 ± 0.5a
V1.73 ± 0.5b0.7 ± 0.2b
Table 3. Mean bulk density measured in the two experimental fields. Non-fertilized plot (N0), digestate injection (D) and digestate + inhibitor injection (V). The displayed data were calculated as mean across all blocks (n = 3). ± mean standard error.
YearDepth (cm)Bulk Density (Mg m−3)
N0DV
20160–51.17 ± 0.51.33 ± 0.61.28 ± 0.6
5–101.48 ± 0.21.43 ± 0.21.42 ± 0.2
10–151.37 ± 0.51.48 ± 0.61.52 ± 0.6
15–201.53 ± 0.51.59 ± 0.51.45 ± 0.4
20–251.83 ± 0.21.85 ± 0.21.77 ± 0.2
20170–51.24 ± 0.51.13 ± 0.41.21 ± 0.5
5–101.39 ± 0.51.27 ± 0.51.29 ± 0.5
10–151.45 ± 0.51.35 ± 0.41.47 ± 0.5
15–201.60 ± 0.31.50 ± 0.31.55 ± 0.3
20–251.57 ± 0.81.41 ± 0.71.65 ± 0.8

