1. Introduction
Chokeberry (
Aronia melanocarpa) is a 0.5–3 m tall deciduous shrub found in temperate rainforests. It is native from North America, although recently there has been a growing interest in its cultivation in Eastern Europe and Asia. It belongs to the
Rosaceae family and is the best-known species within the genus Aronia [
1]. It produces dark, small berries, similar to cherries, that grow in bunches. It is best harvested between August and September, when it exhibits its outstanding health benefits [
2].
It is currently known for a large number of beneficial properties, being one of the fruits with the highest content in compounds of biological interest which confer its superior antioxidant properties. Total phenolic compounds (TPC) in general, and total anthocyanins (TA) in particular, are some of those special compounds. The characteristic composition of phenolic compounds in chokeberries is procyanidins, flavonols (quercetin-3-galactoside, quercetin-3-glucoside, quercetin-3-rutinoside), (-)-epicatechin, chlorogenic acid, neoclorogenic acid, and anthocyanins (cyanidin 3-
O-arabinoside, cyanidin 3-
O-galactoside, cyanidin 3-
O-glucoside, and cyanidin 3-
O-xyloside) [
3]. Moreover, the literature shows that chokeberry is a rich source of organic acids, such as citric acid, malic acid, ascorbic acid, and lactic acid, all of them with high biological relevance. Its sugar content is also noteworthy, and includes fructose, glucose, and sorbitol [
4]. All of these bioactive compounds are of great commercial value for the food industry.
Its berries composition is responsible for their intense color, being used as a food coloring to make some product look more attractive [
5]. Their content in phenolic compounds is greater than that of other well-known fruits such as guava, kiwi, grapefruit, papaya, avocado or grape, among others [
6]. Its high content in bioactive compounds and its nutritional composition seem to be responsible for the wide range of potential medicinal and therapeutic effects of its fruits, which have antioxidants, anticarcinogenic, anti-inflammatory, anti-mutagenic or anti-viral properties. They also have a role in the prevention of cardiovascular diseases, diabetes, obesity or colon cancer [
7,
8]. For this reason, a generous consumption of chokeberry is recommended in dietary guidelines worldwide. A certain level of bitterness or astringency is also typical, due to the presence of tannins in significant quantities. That way, they are not usually consumed as fresh fruits, but processed as jams, jellies, fruit syrups, juice or energy drinks [
2].
When it comes to establishing the criteria to determine which of the compounds in its content has biological functions, extraction is a crucial step for the pharmaceutical, food industry and quality control aspects. Therefore, rapid and reliable methods for the extraction of such beneficial compounds are required. Antioxidant extraction efficiency is influenced by several factors, such as type and polarity of the solvent, solid-solvent ratio, temperature, pH or time, among others, and that should be optimized to reduce process costs [
9]. According to the reviewed literature, the best yields are obtained when hydroalcoholic mixtures acidified with HCl are used [
10]. High temperature or long extraction times can cause the degradation of the compounds of interest, and, therefore, they must be kept under control [
11].
Conventional extraction methods like percolation, maceration or Soxhlet extraction have been widely applied because of their easy operation and the undemanding equipment required. However, due to their long extraction and processing times or their high organic solvents and energy consumption may result in low yields [
12]. This is the reason why there is at present a growing demand for alternative extraction techniques, such as ultrasound-assisted extraction (UAE), microwave-assisted extraction (MAE), supercritical fluids extraction (SFE) or pressurized liquid extraction (PLE). These environmentally friendly techniques may get around former deficiencies and guarantee a high yield and quality of the extract [
13].
In this work, UAE was used for the extraction of TPC and TA from chokeberries. Ultrasounds consist of pressure waves transmitted by matter through cycles of compression and expansion. As a result of this process, the liquid decomposes and forms cavitation bubbles, which collapse when they reach a critical size and release large amounts of energy. This process breaks the plant matrix cell walls and releases the analytes of interest into the extraction solvent, which increases mass transfer [
14]. This technique has many advantages, since it decreases extraction and processing times, reduces energy and solvent consumption, and improves extraction performance. In addition, it is an easy, flexible, versatile and low-cost technique [
15,
16], as it has already been proven with other fruits such as grapes [
17] or myrtle berries [
18].
In order to determine its optimal conditions, as well as the most relevant factors or interactions, a three-level Box-Behnken experimental design (BBD) was employed. A multivariate second-order response surface design allows to cut down the number of experiments to be carried out when compared to single parameter optimization. In addition, it makes unnecessary any experiments in extreme conditions, which ensures the greatest possible amount of data to be registered [
19].
The influence of the variables in the extraction of individual target compounds from fruits has already been well studied, but the analysis of the simultaneous extraction of several compounds has not been yet deeply investigated. This aspect could be relevant with regards to cost and laboratory time saving. The desirability function, which converts multiple responses into one that is latter on optimized, was used for the optimization of the simultaneous extraction process [
20,
21].
The aim of this work was, therefore, to develop two separate and optimized methods for the extraction of TPC and TA, respectively and, an additional novel method for the simultaneous extraction of the two compound types of interest. The specific conditions that maximize the extraction of both, TPC and TA, were compared to those for each compound separate extraction. Additionally, a method for the extraction of organic acids and sugars was also developed.
2. Materials and Methods
2.1. Biological Material
Raw and dehydrated aronia berries from organic farming (NaturGreen, Librilla, Murcia, Spain) have been used for these experiments. The sample was not completely dry, so it had to be previously lyophilized. Subsequently, the sample was crushed in a conventional electric grinder to increase their contact surface and promote their extraction. The suitability of the final extraction method was determined by comparing different commercial samples made with black aronia in different formats (powder, capsules and dehydrated raw aronia). Prior to their analysis, the samples were stored at −20 °C.
2.2. Solvents and Reagents
Methanol (Fischer Scientific, Loughborough, UK) was HPLC grade. Ultra-pure water was supplied by a Milli-Q water purification system from EMD Millipore Corporation (Bedford, MA, USA). The pH values of the different mixtures were adjusted by adding 0.1 M sodium hydroxide and 0.5 M hydrochloric acid (Panreac Química S.A.U., Castellar del Vallés, Barcelona, Spain).
For the quantification of total phenolic compounds, distilled water, Folin-Ciocalteu reagent (Merck KGaA, EMD Millipore Corporation, Darmstadt, Germany), anhydrous sodium carbonate (Panreac Química S.A.U., Castellar del Vallés, Barcelona, Spain) and gallic acid (Sigma-Aldrich, Darmstadt, Germany) as standard were employed.
In the chromatographic separation of anthocyanins, methanol, Milli-Q water and formic acid (Sigma-Aldrich Chemical Co., St. Louis, MO, USA) of HPLC grade were used. For the quantification of anthocyanins, cyanidin chloride (Sigma-Aldrich Chemical Co., St. Louis, MO, USA) was used as a standard.
For the analysis of sugars, a solution of sodium hydroxide for ion chromatography (Sigma-Aldrich Chemical Co., St. Louis, MO, USA) and anhydrous sodium acetate for molecular biology (Sigma-Aldrich Chemical Co., St. Louis, MO, USA) were employed. For organic acids, acetone (VWR International, Radnor, PA, USA) of HPLC grade and concentrated sulfuric acid for ion chromatography were used (Sigma-Aldrich Chemical Co., St. Louis, MO, USA).
2.3. Ultrasound-Assisted Extraction (UAE)
UAE was carried out using a UP 200 S probe (Ultraschallprozessor Dr. Hielscher, Gmbh, Berlin, Germany) equipment, with controlled cycle and amplitude. This probe was coupled with a thermostatic bath (VWR, Radnor, PA, USA), under controlled temperature. The variables to be evaluated were: percentage of methanol (25–50–75%), temperature (10–40–70 °C), amplitude (30–50–70%), cycle (0.2–0.45–0.7 s), pH (2–4.5–7) and the relation of sample mass/solvent volume ratio (0.5:10–0.5:15–0.5:20 g:mL). First, 0.5 g of lyophilized sample was weighed in a 50 mL “Falcon” tube. Subsequently, the corresponding volume and type of solvent, according to the experiment was added. Next, the “Falcon” tube was placed inside a double-walled vessel under controlled temperature. The probe was placed into the vessel while any contact with the walls and the bottom was avoided. The desired amplitude and cycle were selected, and 10 min for extraction time was set. After that time, the extract was centrifuged twice for 5 min in a 9.5 cm orbital radius centrifuge. The supernatant was transferred to a 25 mL volumetric flask, and made up to the mark with the same solvent. Finally, the extracts were stored at −20 °C prior to their analysis.
2.4. Folin-Ciocalteau Procedure
This procedure was used to determine TPC content in black aronia. It consists of adding 250 μL of previously filtered sample by means of a 0.45 μm syringe filter (RephiLe Bioscience, Ltd., Shanghai, China), 12.5 mL of distilled water, 1.25 mL of Folin-Ciocalteau reagent (mixture of sodium phosphomolybdate and sodium phosphotungstate) and 5 mL of 20% sodium carbonate to a 25 mL volumetric flask. Then, the solution was made up to the mark with distilled water. The reaction between the phenolic compounds in the sample and the Folin-Ciocalteau reagent forms a blue color complex, whose color intensity depends on the proportion of these compounds. This complex absorbs at a maximum of 765 nm and a Cary 60 UV-Vis spectrophotometer (Agilent Technologies, Santa Clara, CA, USA) with quartz cuvettes was used. This method has been previously used by numerous researchers for other matrices [
22,
23]. Due to the extraction kinetics and the stability of the complex formed, the samples were kept in the dark for 30 min, which is the time necessary for the formation of the blue complex. Their absorbances were then measured at 765 nm. A calibration curve was previously established by the same procedure, using gallic acid as a standard according to pre-established concentration sample patterns that ranged between 1 and 1000 mg L
−1. The calibration curve was y = 0.00099x − 0.06311 with an
R2 = 0.9999. The results were expressed as mg of gallic acid equivalent per gram of lyophilized fruit.
2.5. Identification of Anthocyanins
An ultra-high-performance liquid chromatography (UHPLC) equipment coupled to a quadrupole-time-of-flight mass spectrometer (QToF-MS) (Xevo G2 QToF, Waters Corp., Milford, MA, USA) was used. It consisted of a PDA detector, an autosampler, a column and several administrators of quaternary and binary solvents. The chromatographic separation was performed on a C-18 analytical column (1.7 μm, 2.1 × 100 mm, Acquity UPLC BEH C18, Waters Corp., Milford, Massachusetts, United States). Two solvents were necessary: Milli-Q water acidified with 2% formic acid as solvent A, and pure methanol as solvent B. The flow rate was 0.4 mL min−1. The gradient used was as follows: 0.0 min, 15% B; 3.30 min, 20% B; 3.86 min, 30% B; 5.05 min, 40% B; 5.35 min, 55% B; 5.64 min, 60% B; 5.95 min, 95% B; 7.50 min, 95% B. The analyzes were carried out by means of an electrospray source operating in positive ionization mode under the following conditions: desolvation gas flow = 700 L h−1, desolvation temperature = 500 °C, cone gas flow = 10 L h−1, source temperature = 150 °C, capillary voltage = 700 V, cone voltage = 30 V and collision energy = 20 eV. “Full Scan” mode was used (m/z = 100–1200). In the mass spectrum, four molecular ions [M+] were identified corresponding to the anthocyanins present in black aronia and showed the following m/z ratios: cyanidin 3-O-galactoside (449), cyanidin 3-O-glucoside (449), cyanidin 3-O-arabinoside (419), and cyanidin 3-O-xyloside (419).
2.6. Separation and Quantification of Anthocyanins
This process was carried out by means of an Elite LaChrom Ultra System chromatography equipment (VWR Hitachi, Tokyo, Japan), which consists of a UV-Vis L-2420U detector set at 520 nm, an L-2300 column oven set at 50 °C, an L-2200U autosampler, and two L-2160U pumps. The solvents used were: solvent A, Milli-Q water acidified with 5% formic acid and solvent B, pure methanol HPLC grade. Both solvents were degassed in an ultrasonic bath (Elma S300 Elmasonic, Singen, Germany) and filtered through a 0.22 μm filters (RephiLe Bioscience, Ltd., Shanghai, China). The black chokeberry extracts were also filtered through a 0.22 μm syringe filter. A Fused-Core C-18 column (2.6 μm, 2.1 × 100 mm, Phenomenex Kinetex, CoreShell Technology, Torrance, CA, USA), and an injection volume of 15 μL were employed. Firstly, in order to achieve the most effective separation of the anthocyanins and the best possible resolution, the optimization of the chromatographic method was carried out. Different gradients of separation, flows and column temperature were studied. Finally, a flow of 0.7 mL min
−1, a column temperature of 50 °C and the following gradients were selected: 0.0 min, 15% B; 0.5 min, 25% B; 2.0 min, 25% B; 3.3 min, 30% B; 4.8 min, 40% B; 5.4 min, 55% B; 5.9 min, 60% B; 6.6 min, 95% B; 9.3 min, 95% B; 10.0 min, 15% B; 12.0 min, 15% B. The chromatogram has been included in the
Supplementary Material as Figure S1. For the quantification, a calibration curve was generated using cyanidin chloride as the reference standard, and patterns of known concentrations between 0.1 and 29 mg L
−1 were prepared (y = 262231.56x − 2460.24, LOD = 0.186 mg L
−1 and LOQ = 0.620 mg L
−1). The detection and quantification limits were determined as the analytic concentration that corresponds to the standard deviation from the blank signal values (
n = 10) plus 3 or 10 times, respectively, divided by the slope of the linear regression. Assuming that the different anthocyanins have similar absorbances, and taking into account their individual molecular weights, a calibration curve was prepared to quantify each anthocyanin. The results were expressed as a sum of individual anthocyanins and as milligrams of cyanidin chloride equivalents per gram of lyophilized fruit.
2.7. Data Statistical Analysis
Two types of variables can be distinguished in this optimization study: independent variables or factors (percentage of methanol, temperature, amplitude, cycle, pH, and ratio), and dependent variables or responses (TPC and TA). Each factor can take three possible values, coded as −1, 0 and 1, depending on whether it is the minimum, average or maximum value, respectively. Therefore, the design indicates the results from 54 experiments as included in the
Supplementary Material, Table S1. The results were analyzed by a response surface methodology (RSM) and a mathematical model was obtained. This is a second-order polynomial equation in which the response of the system was considered as a function of the factors and interactions involved [
24,
25].
In the above equation, y represents the response, β0 is the model constant, βi is the coefficient for each main effect, βii is the coefficient of the quadratic factors, βij is the coefficient of the interactions between i and j, X represents each factor, and ε is the residual value.
Quality control and analytical laboratories try to minimize analysis costs and time, therefore, multiresponse optimization is of utmost importance, since this reduces the number of necessary experiments. Thus, instead of applying specific conditions for each response, commitment conditions were also studied in order to optimize both responses at the same time. Such optimization was based on a desirability function that provides an approximation to how acceptable an experiment with several responses is. Initially, an individual desirability function was created for each response, (d), (TPC and TA), with values between 0 and 1, where 0 is an undesirable response, and 1 a desirable and ideal response. Finally, the global desirability function (D) was worked out by means of the following equation [
26,
27].
where d
i are the individual normalized values. When this equation’s value is different from 0 all the optimized variables have a desirable value. The statistical significance of the model as well as the regression terms and the fitting quality of the polynomial model were evaluated by means of the analysis of variance (ANOVA). For experimental design, data analysis and model building, the Design Expert software 11 (Trial Version, Stat-Ease Inc., Statistic Made Easy, Minneapolis, MN, USA) was employed.
2.8. Analysis of Sugars
For the analysis of sugars, an ion chromatography system was used (Metrohm, 930 Compact IC Flex, Gallen, Switzerland), which has an amperometry detector and a Metrosep Carb 2—150/4.0 column (Metrohm AG, Gallen, Switzerland).
As explained above for anthocyanins, before the identification and quantification of sugars, the influence of several factors that can affect their extraction was evaluated: temperature (10, 20, 30, 40, 50, 60, 70 °C), percentage of methanol (0, 10, 20, 40, 60%) and time (2, 5, 10, 15, 20, 25, 30 min). For each experiment 0.5 g of sample were weighed, UAE was performed, and then the extracts were filtered and placed in a 25 mL volumetric flask. The extracts obtained under the optimal conditions were diluted 1:10 in order to identify and quantify their compounds content.
A mixture of 300 mmol L−1 of sodium hydroxide and 1 mmol L−1 of sodium acetate as eluent was used at an isocratic flow of 0.5 mL min−1 for 20 min. The sugars present in black chokeberry could be quantified by means of the calibration curve of each detected compound: glucose (y = 1.13x + 33.77), sorbitol (y = 4.46x − 10.08), fructose (y = 2.22x + 36.88), inositol (y = 4.39x − 2.21), maltose (y = 1.24x − 0.87), and glycerol (y = 4.56x + 7.65).
2.9. Analysis of Organic Acids
For organic acids, an ion chromatography system was used (Metrohm, 930 Compact IC Flex, Gallen, Switzerland), which has a conductometric detector and a Metrosep Organic Acids column—250/7.8 (Metrohm AG, Gallen, Switzerland).
The influence of the optimized factors for the organic acids that can affect the extraction were also evaluated. The same experimental procedure was carried out and the optimal conditions were determined as follow: 0% methanol at 50 °C and for 5 min.
In this case, the eluent employed was a mixture of 0.4 mmol L−1 of sulfuric acid and 12% of acetone, at an isocratic flow of 0.4 mL min−1 for 20 min. As for sugars, it was necessary to perform a calibration curve for each detected organic acid for it later quantification: ascorbic acid (y = 2.06 × 10⁻⁴x − 0.02), malic acid (y = 2.08 × 10⁻³x + 0.07), citric acid (y = 1.99 × 10⁻³x + 0.09), and latic acid (y = 1.08 × 10⁻³x + 0.02).
3. Results and Discussion
3.1. Optimization of TPC Individual Extraction Method
After performing the matrix of experiments through the BBD experimental design, the analysis explained 80.80% of the total variability. The statistical significance of the model was evaluated by means of the analysis of the variance (ANOVA) (
Table 1).
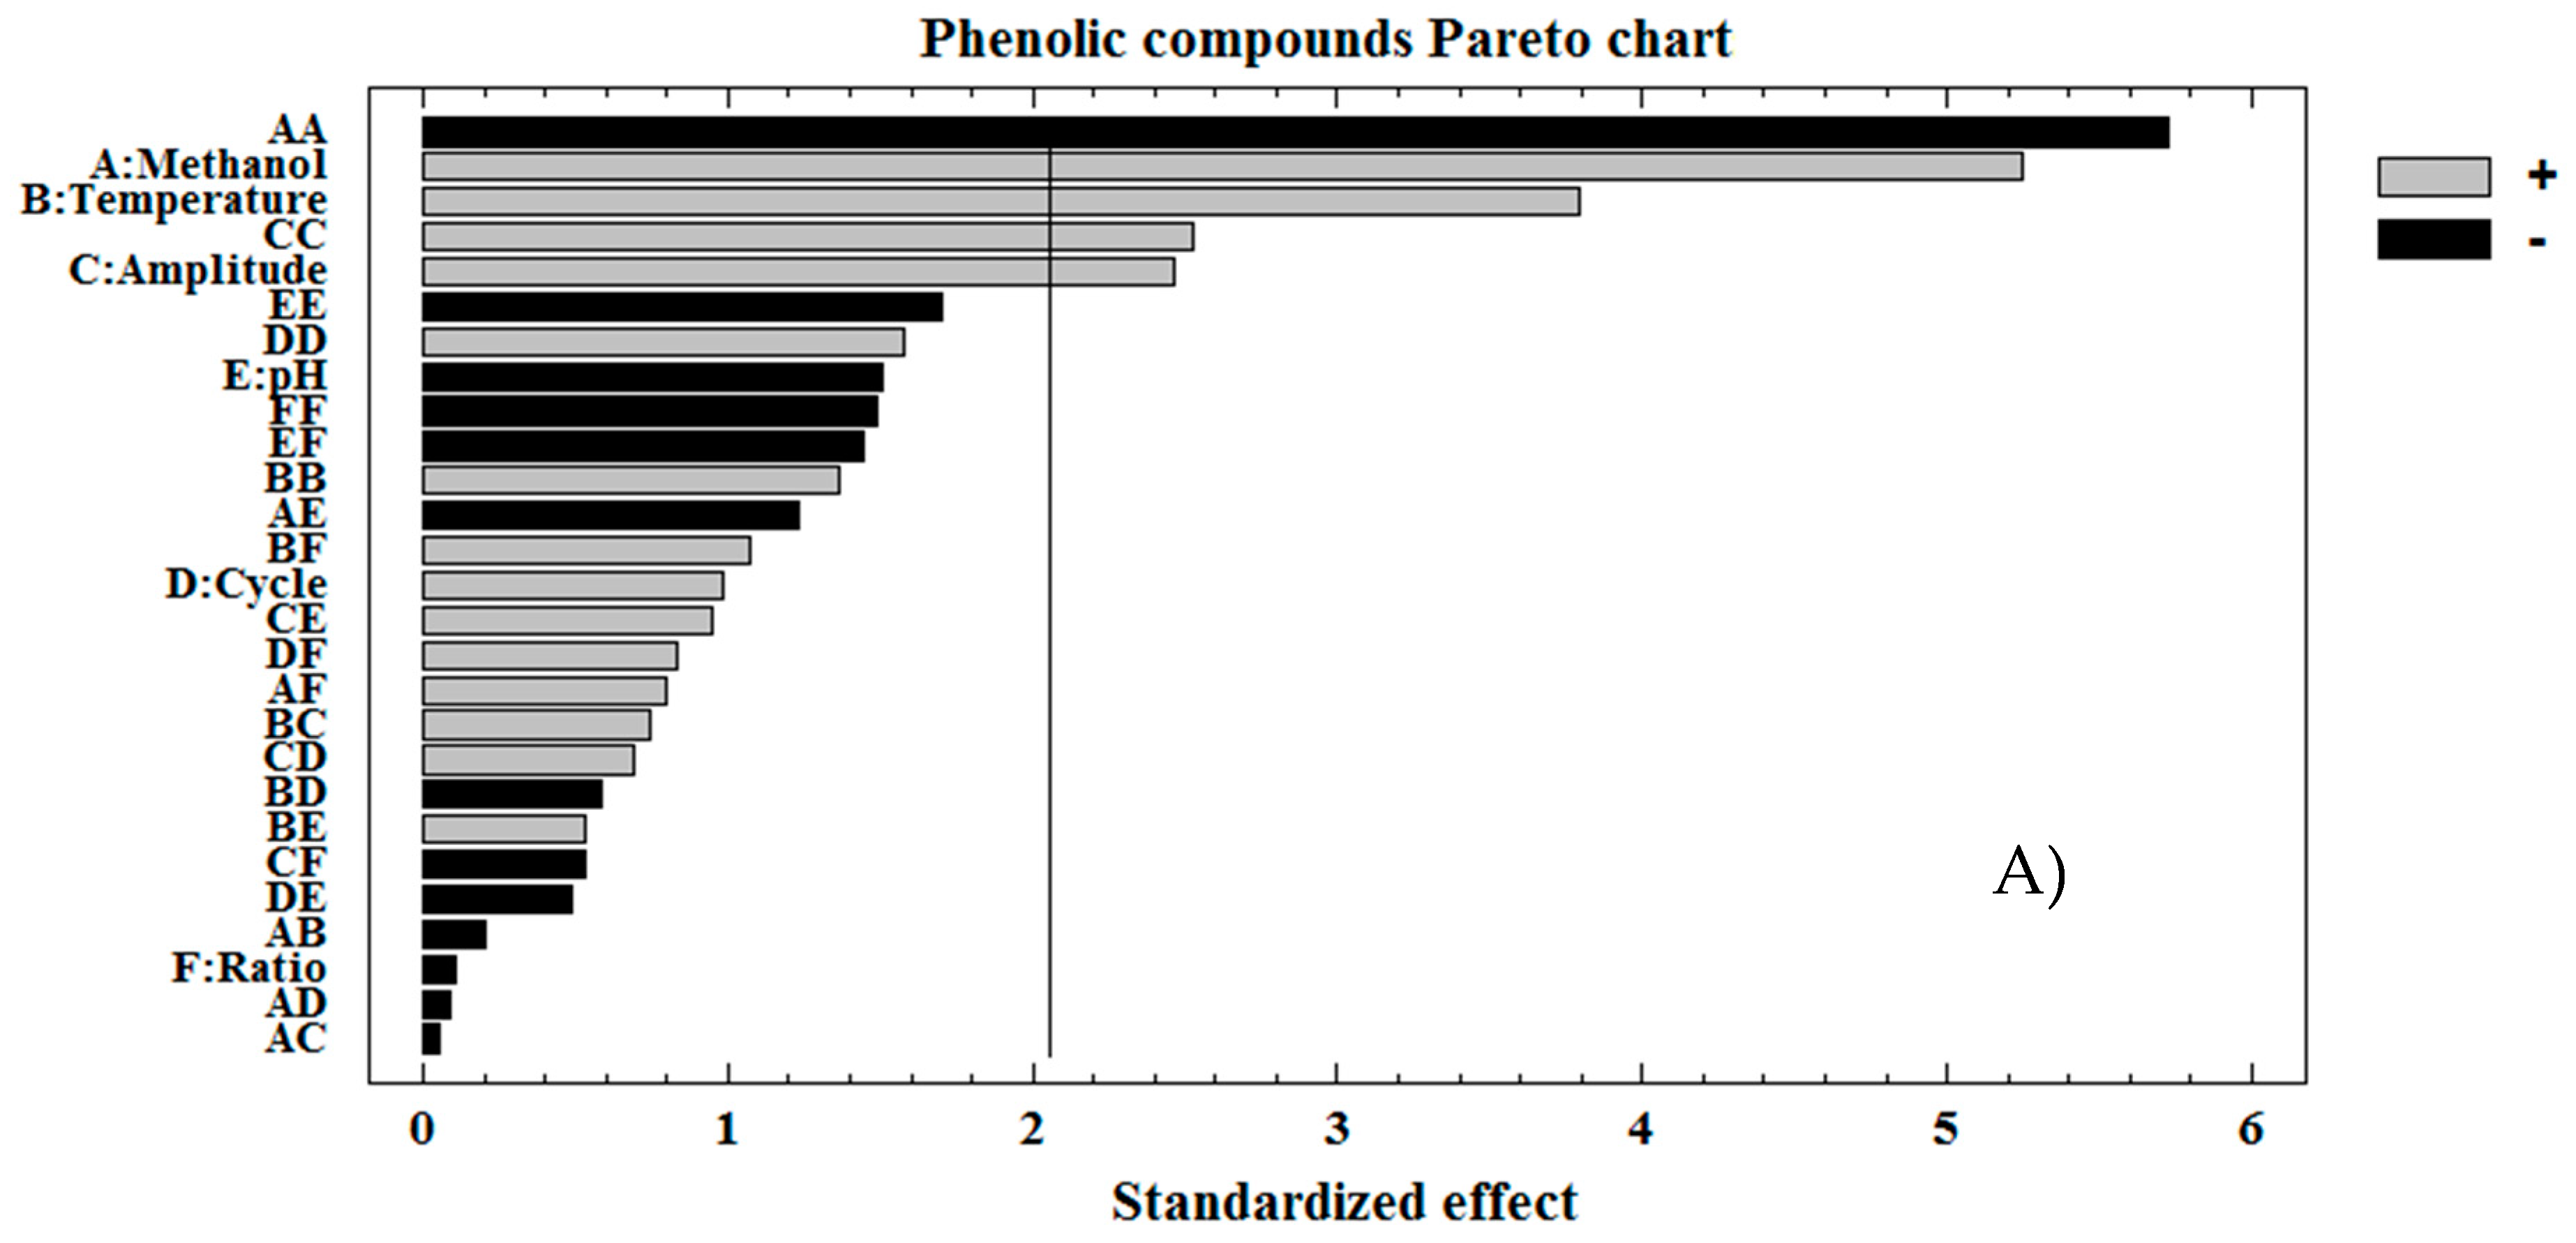
The variables with a p-value of less than 0.05 were considered to be significantly influential on the response at 95% confidence level. Specifically, they were the percentage of methanol, temperature, amplitude and the quadratic interactions MeOH-MeOH and amplitude-amplitude. Taking into account only these variables, a reduced second order polynomial equation that could reliably predict the experimental results was obtained: y = 24.7014 + 3.7671 × MeOH + 2.7221 × Temperature + 1.7705 × Amplitude − 6.2810 × MeOH2 + 2.768 × Amplitude2.
The results were graphically represented in a standardized Pareto chart (
Figure 1). In this case, the length of each bar is proportional to the absolute value of its associated standardized effect. The vertical line represents the statistically significant bound at 95% confidence level. Factors that exceed this reference line are considered significant. The positive or negative sign reveals those cases where the response is enhanced or reduced, respectively, when passing from the lowest to the highest level of a specific variable. Taking all of this into account, the same information mentioned above in the ANOVA was observed. The three most influential factors on the response had a positive effect, that means, an increase of them favors the recovery of TPC in the extract.
According to the data obtained, the optimal conditions for the extraction of TPC in UAE were: 58% methanol extraction solvent in water with pH 3.87 and at 70 °C temperature, 70% amplitude of the maximum value (200 W), 0.7 s cycle and a sample mass/solvent volume ratio of 0.5:17 g:mL. The total average TPC concentration in aronia extract obtained under these optimum conditions was 38.057 mg g−1.
An intermediate value of methanol percentage acidified by means of HCl can be observed, which is determined by the characteristic of the solvent and TPC [
10]. For temperature, the highest value of the interval used was observed. Nevertheless, it was not considered to work at a higher temperature level, since methanol can be evaporated over 70 °C. With regards to the amplitude, values over 70% are not recommended, since splashes were produced. A high volume of extraction solvent has been observed to result in a greater gradient.
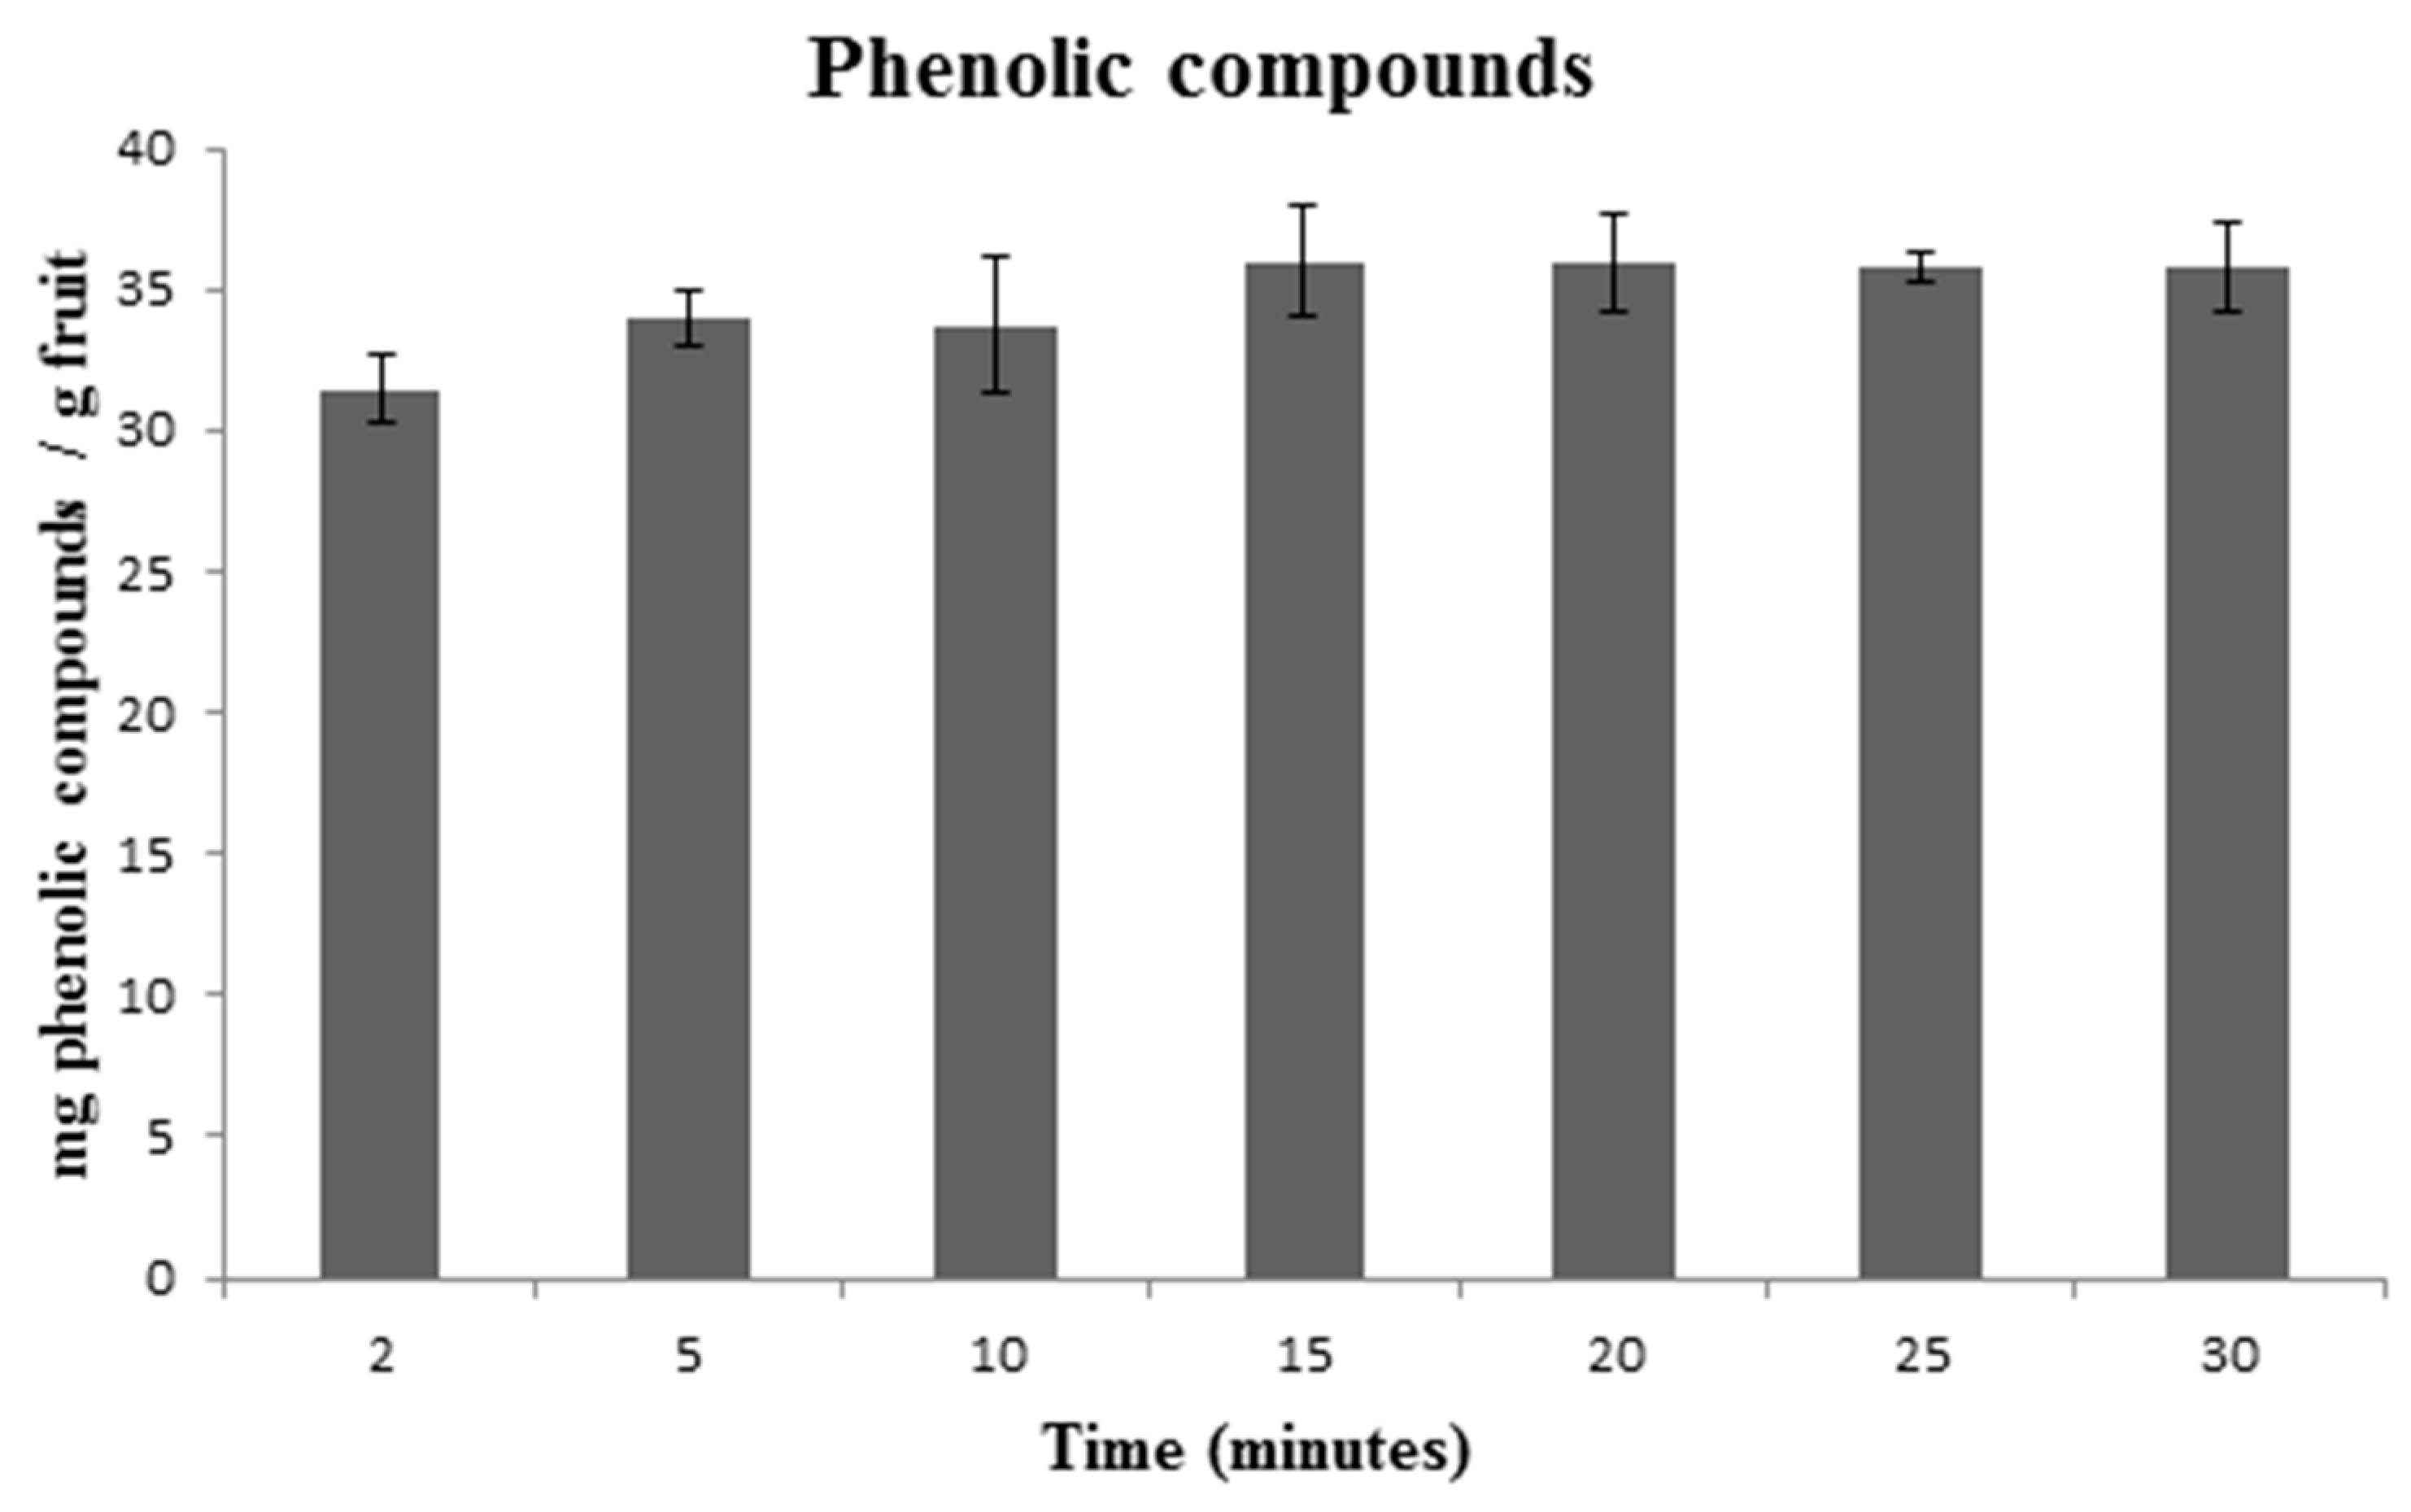
Once the optimal extraction conditions were determined with regards to temperature, solvent concentration, pH, amplitude, cycle and sample mass/solvent ratio, an assay was performed to evaluate the optimal extraction time. Extractions were carried out in duplicate in periods ranging from 2 to 30 min (
Figure 2). For saving reasons, an optimal time of 5 min was selected, even although no statistically significant differences were observed when compared to longer time periods. Finally, under these conditions, the precision of UAE in aronia samples was also studied. In order to determine the repeatability, 12 extractions were carried out on the same day, while for intermediate precision, 12 extractions were carried out daily on three consecutive days. The results obtained were 3.44% and 3.98% for repeatability and intermediate precision, respectively. In none of the cases, the coefficient of variation exceeded 5%, which is considered the accuracy limit for this type of test [
28].
3.2. Optimization of TA Individual Extraction Method
A similar statistical treatment was applied to the anthocyanins present in aronia (
Table 2).
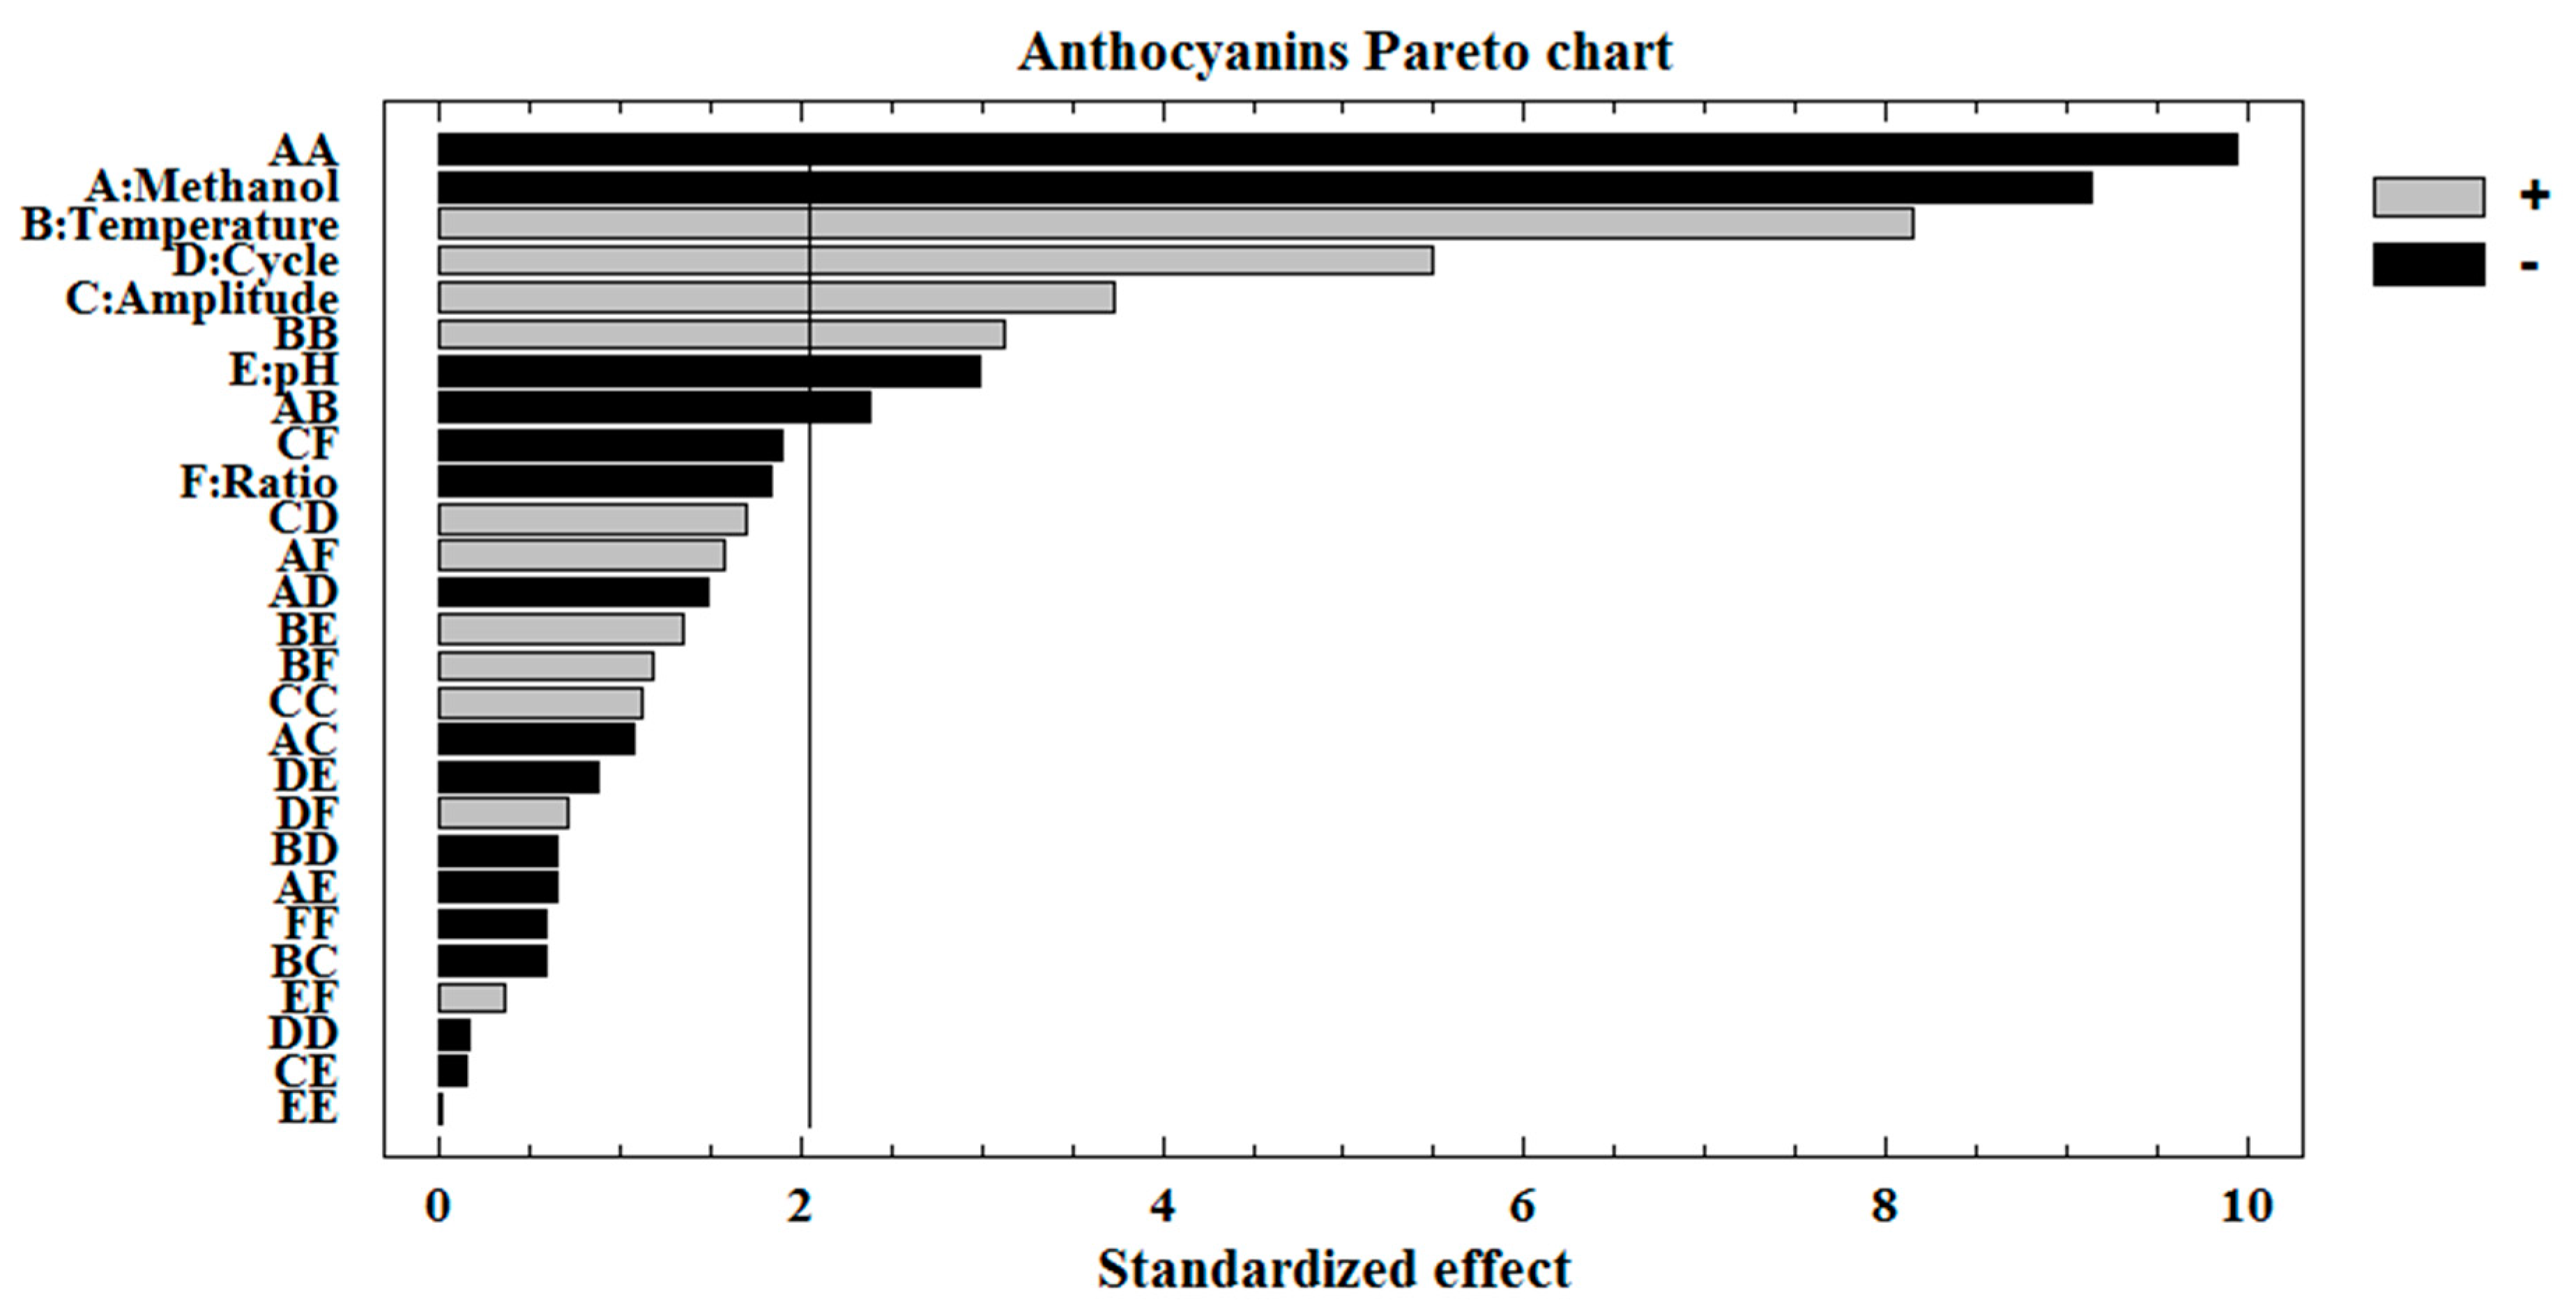
In this case, the analysis explained 93.78% of the total variability, which shows a statistically significant agreement between the measured and estimated responses. The influential variables at 95% confidence level were the following: percentage of methanol, temperature, amplitude, cycle, pH, quadratic interactions MeOH-MeOH, and temperature-temperature as well as the interactions between MeOH and temperature. These effects and interactions are shown in the reduced second order polynomial equation, which provides similar results to those obtained with the complete equation: y = 0.1941 − 0.0371 × MeOH + 0.0331 × Temperature + 0.0152 × Amplitude + 0.0223 × Cycle − 0.0121 × pH − 0.0616 · MeOH2 − 0.0167 × MeOH × Temperature + 0.0194 × Temperature2.
As explained above, these results can be represented graphically by a standardized Pareto chart (
Figure 3). It should be noted that the percentage of methanol and the temperature had a more relevant effect on the response in comparison to the other factors. Temperature, cycle and amplitude had a positive influence, that is, an increase of these values favors the recovery of TA. On the contrary, the percentage of methanol and pH had a negative effect.
After the corresponding statistical treatment of the data, the following optimal conditions were determined for the extraction of TA from aronia by UAE: 34% methanol in water at pH 2 and 70 °C temperature, 70% amplitude of the maximum value (200 W), 0.7 s cycle and 0.5:13.5 g:mL mass/solvent volume ratio. The total average TA concentration in aronia extract at these optimum conditions was found to be 0.305 mg g−1.
A lower percentage of methanol acidified with HCl has been observed, which indicates that the anthocyanins are slightly more polar [
3]. Like in the optimization for TPC extraction, it did not work at a temperature above 70 °C due to the evaporation of methanol or at amplitudes greater than 70% due to possible splashes.
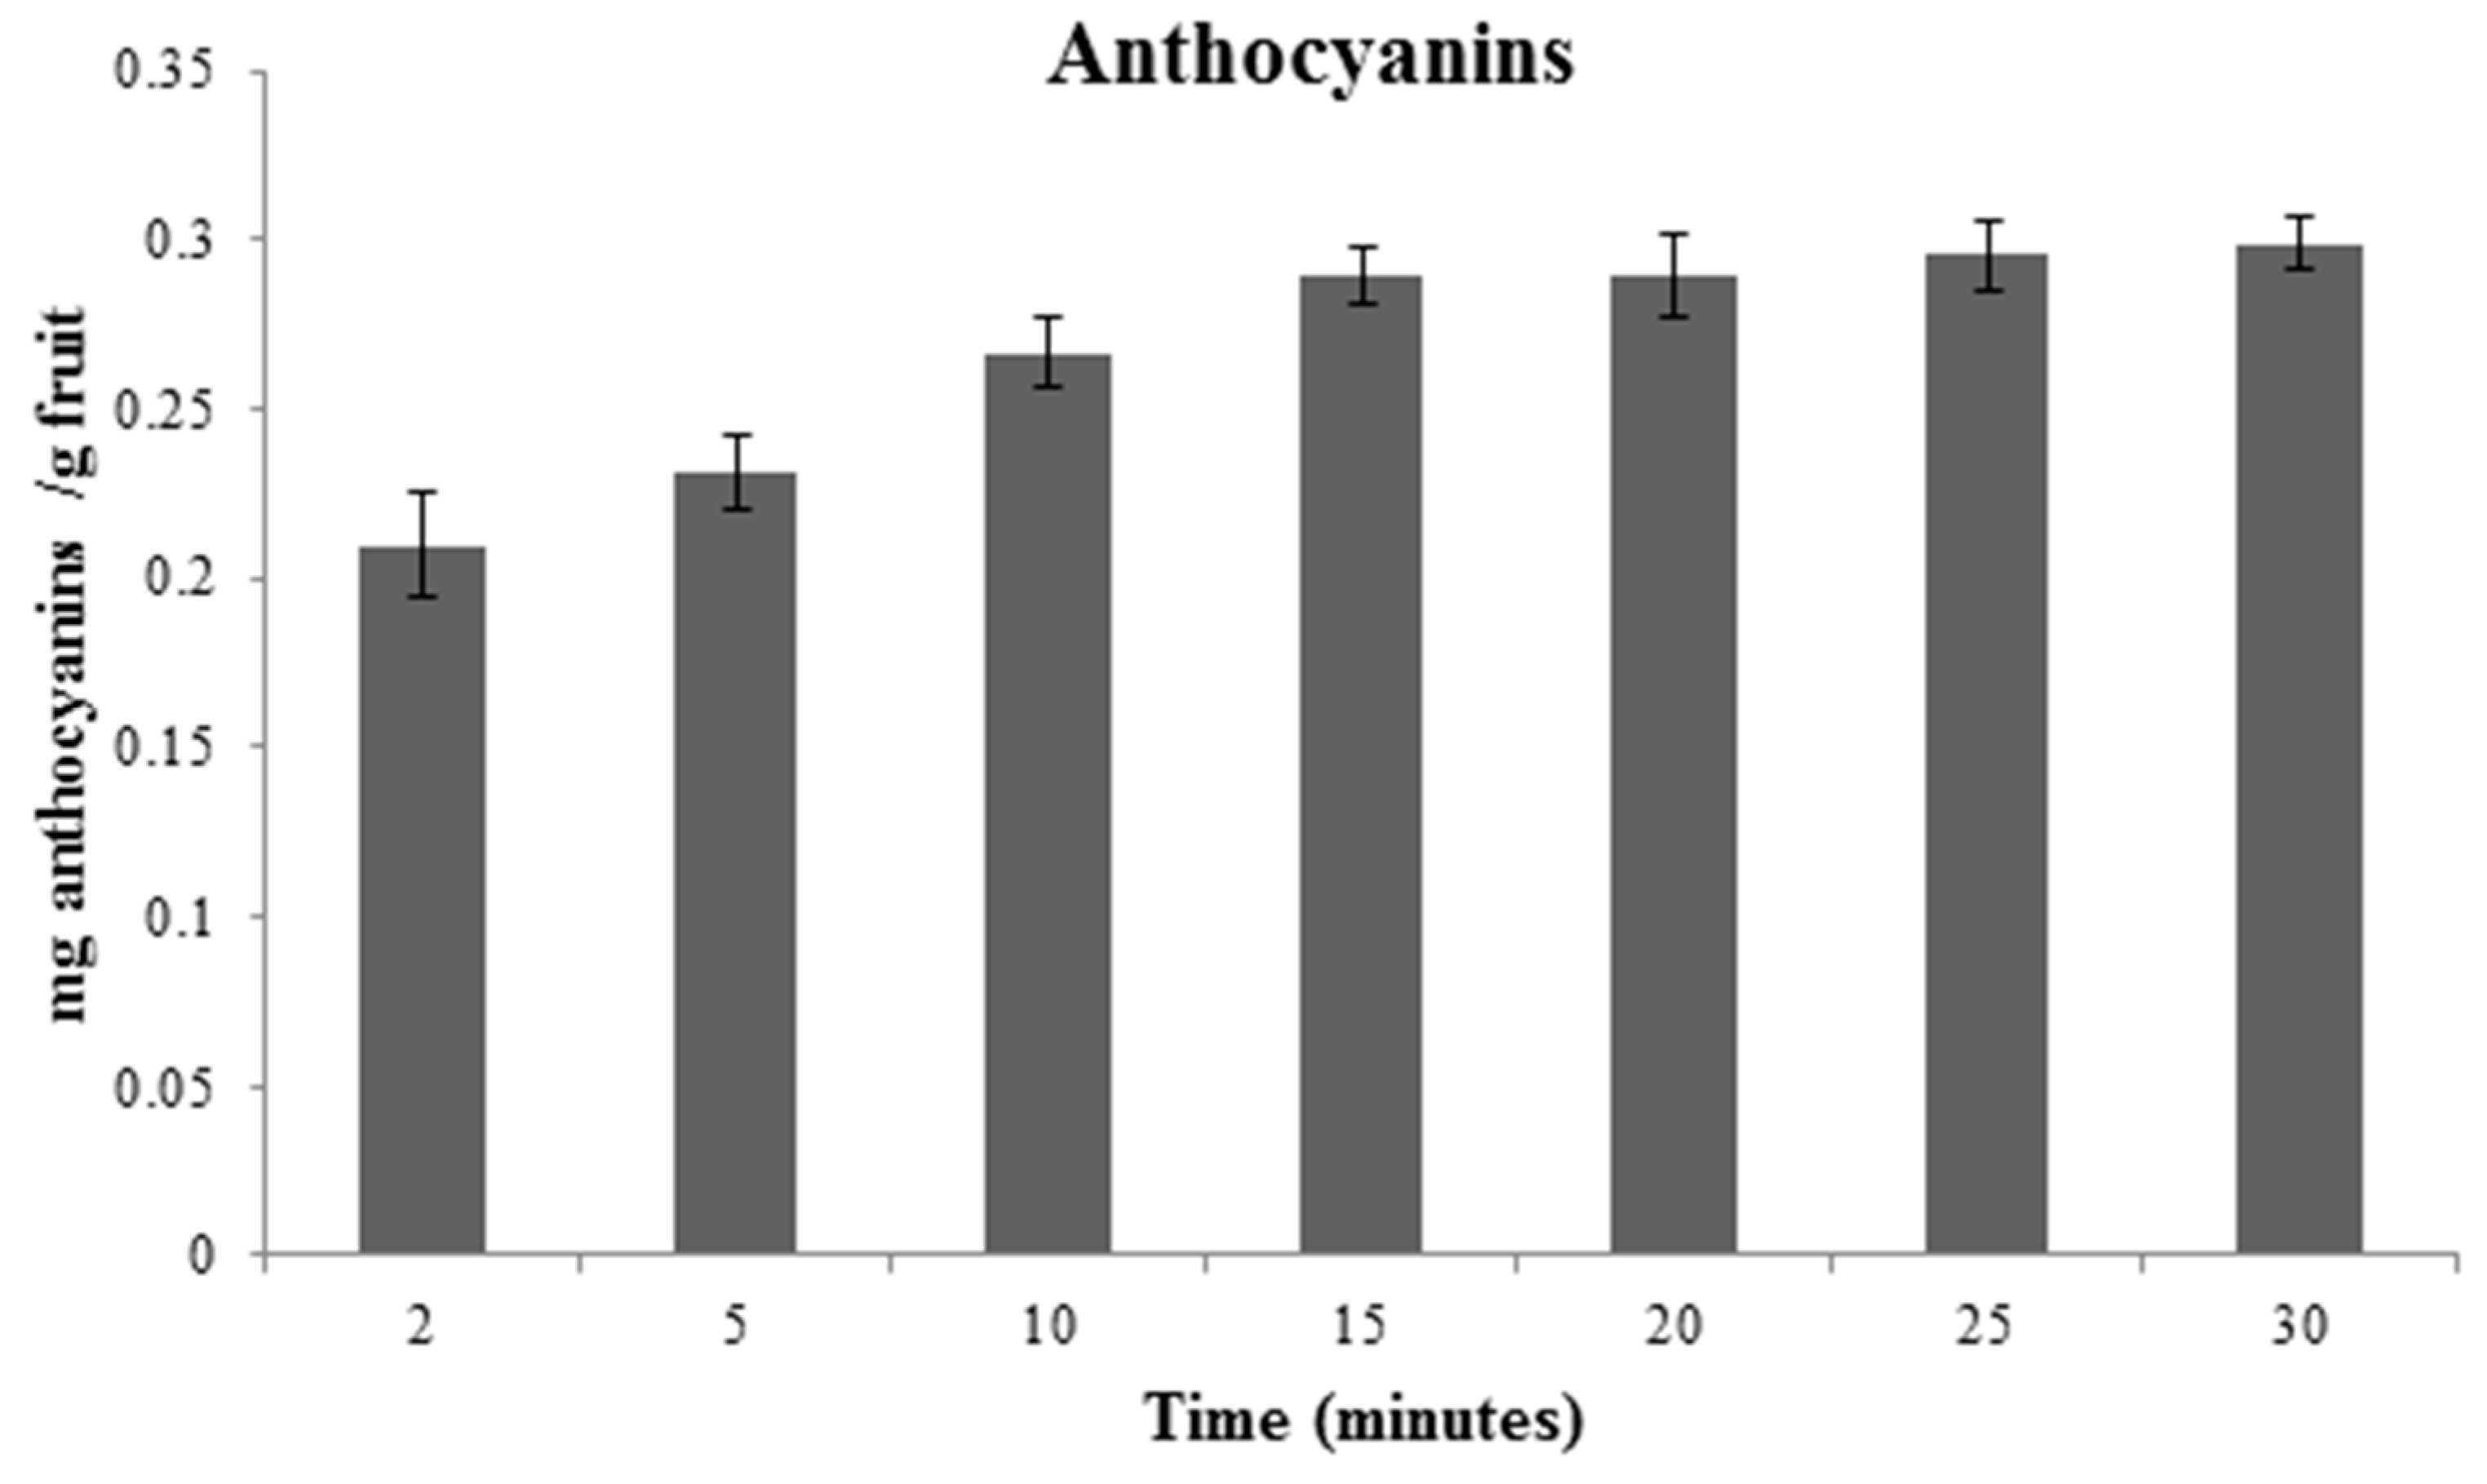
In this case, an optimal extraction time of 15 min was determined as shown in
Figure 4, while there were no significant differences at longer times. The precision of the method was evaluated in terms of repeatability and intermediate precision following the same procedure as for TPC extraction optimization, and values of 3.12% and 3.42%, respectively were obtained. An accurate method with coefficients of variation lower than 5% was obtained.
3.3. Discussion on Each Variable That Influences the Extraction
The polarity of the extraction solvents has been proposed as one of the critical aspects that results in different extraction efficiency [
29]. TPC and TA are moderately polar compounds that can be found in most berries. Therefore, pure water combined to other organic solvents is normally used to extract them. In addition, while methanol can enhance the solute’s solubility, water helps in the desorption of the solute from the substrate [
30]. It is also reported that methanol inhibits the activity of polyphenol oxidases, and in this way reduces phenolic degradation [
31]. For these reasons, an intermediate value for methanol percentage should be used as determined by the characteristics of both, the solvent and the TPC/TA in black aronia. Moreover, acidified solvents were used because of their higher stability and extraction capacity at low pH values [
32]. In general, large volumes of extraction solvents in the range of 10–20 mL has been used for sample preparation. A smaller amount of sample in a greater volume of solvent (greater variation of concentration) resulted in a greater gradient and therefore, a greater extraction, favored by the mass transfer [
33].
Temperature has also had a notable influence on the mass transfer process and therefore its control is of great importance when extracting bioactive compounds from fruits [
34]. It can be observed that, the higher the temperature, the greater the number of phenolic compounds that can be extracted. A high temperature reduces solvent viscosity and improves its penetration. It also accelerates the dissolution of the extract, thus increasing the extraction yield. In addition, it causes the weakening of the bonds that hold the compounds together, which in turn facilitates their desorption and increases their diffusion speed [
35]. Temperatures over 70 °C were discarded since methanol evaporates. Moreover, high temperatures can cause the degradation and fragmentation of several phenolic compounds [
36].
It has been demonstrated that amplitude also plays an important role on the effectiveness of the extraction process. As the amplitude increases, the number of compression and expansion cycles of the ultrasonic wave increases and, as a consequence of this, the ultrasonic wave is more effectively administered. Thus, a greater amplitude induces a more intense cavitation effect and improves the extraction process [
37]. However, higher values over 70% are not recommended, since it can produce splashes and part of the extract may get wasted. In addition, after a literature search, it was found that in some cases there were no significant differences at higher amplitudes [
37,
38].
3.4. Optimization of TPC and TA Simultaneous Extraction Method
There are numerous studies that analyze only specific optimal extraction conditions for particular compounds in other matrices [
39,
40]. However, certain factors such as time and costs are very important for quality control and analytical laboratories, it is, therefore, necessary to determine optimum balanced conditions that allow us to satisfactorily extract TPC and TA at the same time. After the corresponding statistical treatment of the data, the optimal conditions to maximize the simultaneous extraction of both types of compounds are shown in
Table 3 and compared with those obtained individually.
When multiple responses were optimized, the concentration of TPC and TA that can be extracted simultaneously (37.823 and 0.283 mg g−1) was slightly lower than that obtained by means of their specifically optimized extraction method. Nevertheless, no significant differences were observed and, therefore, it can be affirmed that the optimized conditions for the simultaneous extraction of TPC and TA can be applied instead of their specifically optimized extraction conditions with the subsequent saving in time and costs. Regarding each of the factors that have been analyzed, it should be noted that the percentage of methanol (54%) was closer to that used for the individual extraction of TPC, which was 58%, while for the specific extraction of anthocyanins, the percentage was lower, at only 34%. The temperature as well as the wave amplitude and cycle took exactly the same values as for each individual extraction, that is, 70 °C, 70% and 0.7 s, respectively. The pH value for the multiple extraction optimization was 2.72. This is an intermediate value between those obtained for each individual compound extraction optimization, at 3.87 for TPC and just 2 for TA. Finally, the solvent volume was 18.2 mL for the 0.5 g weighed, which is slightly higher than that used for each specific biological compound extraction.
The optimal time for the simultaneous extraction of both, TPC and TA, was set at 15 min. In the same manner as for the optimization of each bioactive compound specific extraction, tests of repeatability and intermediate precision were carried out. The results corresponding to the phenolic compounds were 4.16% for repeatability and 4.37% for intermediate precision. With regards to the results corresponding to the anthocyanins, 3.20% and 3.73% were obtained respectively. These results demonstrated that the method was accurate and that its coefficients of variation were below 5% in all cases.
3.5. Analysis of Sugars and Organic Acids
After the analysis of the different variables, the optimal conditions were determined: 0% methanol at 50 °C for 5 min. These optimal conditions were applied to achieve the best extraction of sugars and organic acids (
Table 4). The different sugars and organic acids found in aronia were quantitatively determined. It is noteworthy to point out that the content level of these compounds is strongly conditioned by the circumstances in which the fruit ripening occurs [
41].
Glucose, sorbitol and fructose were the major sugars in chokeberry, with 99.70% of the total composition. Sorbitol should be mentioned as a natural sugar polyalcohol that is widely used as sweetener and humectant in food and pharmaceutical industries. Its content level was higher when compared to other sweet berries commercially available, including strawberries, blueberries, blackberries or raspberries, while the acidity levels of the aronia were not significantly different from the rest of the commercial berries [
4,
41]. Although inositol, maltose and glycerol have also been detected, their presence is practically negligible.
In relation to acids, ascorbic acid was the main compound, since it represents 85% of the total composition of this fruit. This acid is also known as vitamin C, and it have antioxidant properties, acting both directly, by reaction with aqueous peroxyl radicals, and indirectly, by restoring the antioxidant properties of fat-soluble vitamin E [
42]. It is soluble in water and its deficiency can cause anemia, scurvy, as well as a weakening of the immune system. Its intake depends directly on dietary sources, since it cannot be synthesized [
43]. Malic acid and citric acid were 8 and 24 times lower of ascorbic acids, respectively. Both are of enormous biological importance, being the two most used acidifiers in the food industry and in beverages [
44]. Finally, the detection of lactic acid was noteworthy, although it could not be quantified since it was below its quantification limits.
3.6. Real Sample Implementation
The suitability of the new UAE methods that had been developed, both individual and multiple-compound extraction conditions, was evaluated by implementing them to the extraction of TPC and TA from four commercial samples of black chokeberry (S1, S2, S3, and S4). Each one of the methods was analyzed in triplicate and their characteristics and results have been displayed in
Table 5.
S3 showed the highest amount of TPC, exceeding 50 mg g
−1. S1 and S4 had a very similar concentration of phenolic compounds. However, most of the compounds in S1 were anthocyanins, while S4 had a low content of this type of compound. This may be due to the fact that it was applied to dried chokeberries, and a large amount of anthocyanins might have degraded during the drying process [
45]. It may as well be due to the composition of the initial matrix. S1 matrix was a lyophilized sample that is commercialized in powder form, while S4 matrix is formed by chokeberry grains that were previously lyophilized in a laboratory.
The lowest concentration of phenolic compounds can be observed in S2. This sample has also been subjected to a heat treatment, which may have caused the degradation of part of the compounds. S3 displayed the highest concentration level of phenolic compounds and anthocyanins, the latter exceeded 25 mg g−1. When the optimum conditions to maximize the extraction of both types of compounds were implemented, the results were similar to those obtained when applying the optimized individual conditions for each biological compound type. In either case, the same trend can be seen in the samples analyzed. This would support the use of this extraction method in order to save time, labor and costs.
On the other hand, organic acids and sugars were also determined in the foodstuff made with black aronia (
Table 6). Organic acids are another important component in foods, since their presence and composition greatly affect the palatability of foods [
46]. The main acid of aronia fruits is ascorbic acid, which makes of them a rich source of vitamin C. Malic acid was also detected in all the real samples that were analyzed. Samples S1, S2 and S4 had a very similar concentration, since all of them were dehydrated and subsequently lyophilized raw aronia. Sample S3 (aronia capsules) had the lowest concentration because the fruit had been subjected to a drying process and other processes that might have caused the degradation of the compounds of interest.
In relation to sugars, glucose was the main sugar in all the berries. Sorbitol (sugar alcohol) was also a dominant component. This compound is often used as a sugar-free sweetener for confectionery and pharmaceuticals products. Sucrose, glucose and fructose present a high glycemic index, which makes of them unsuitable for diabetic patients to consume. For this reason, it is replaced by polyols, such as sorbitol, which is a type of sugar with significant benefits in terms of reduction of carcinogenicity, obesity and associated diseases [
47].

 ,
, 


