1. Introduction
Cold has been used for decades for neuroprotection and cardioprotection against ischemia-reperfusion injury [
1,
2,
3]. In the clinical field, targeted temperatures range from 4–8 °C (deep) in graft preservation and cardioplegia to 32–36 °C (mild) in post-cardiac arrest care [
2,
4]. In some cardiac surgeries, core temperature is also decreased as low as 20 °C, mostly for brain protection. Despite intense research, the underlying protective mechanisms of therapeutic hypothermia remain poorly understood [
5].
Mitochondrion plays a central role in ischemia-reperfusion injury. Indeed, at the onset of reperfusion, cells can undergo a harmful mitochondrial Ca
2+ overload, facilitating the opening of the mitochondrial permeability transition pore (mPTP). This is thought to be concomitant to a burst of mitochondrial ROS production at the restart of the respiratory chain [
6]. Chouchani et al. have reported that succinate accumulation during ischemia could play a central role in this reperfusion ROS burst. They proposed this latter was induced via the reverse electron transport (RET) towards complex I [
7]. However, an interesting alternative hypothesis involves the over-reduction in the ubiquinone (CoQ) pool through electrons coming from both complex I and II [
8]. Over-reduced CoQ would create a bottleneck for electron, thus increasing electron leak through ROS production by Complex I. All these mechanisms, in addition to the energetic fall during ischemia, concur to the mPTP opening that causes a massive release of Ca
2+ contained inside mitochondria and can finally lead to cell death [
9,
10]. Studies exploring those functions according to temperature are scarce.
Cold influence on mitochondria functions may go far beyond a simple slowdown in chemical reactions, as formalized in the Arrhenius law [
11], and studies have reported non-linear effects of cold within the range of 5–37 °C [
12,
13]. Accumulating data suggest that the hypothermia protective effect could be linked to modifications of the respiratory chain and mitochondrial ROS production [
5,
13]. However, to our knowledge, only a few studies have taken into account the influence of mitochondrial chain substrates, especially succinate, and the modifications of the ratio between succinate and malate/glutamate, which could also alter mitochondrial function after ischemia-reperfusion and response to cold [
7]. No studies have focused on the effect of cold on mitochondrial activity and the subsequent mPTP opening, which is a major event at reperfusion [
14,
15]. Finally, since it is usually thought that cold-response is a ubiquitous phenomenon, there have been no studies comparing the functions of isolated mitochondria from the brain and heart.
The present study investigated the relationship between a range of temperatures (6, 10, 15, 20, 25, 31, and 37 °C) and several mitochondrial functions—namely, respiration, ROS production and CRC—in brain and heart mitochondria isolated from wild-type mouse. We confirmed that, in both organs, the relationship between temperature and activities of the respiratory chain (O2 consumption and ROS production) is non-linear with a temperature coefficient (Q10) in the range of Arrhenius values. More interestingly, we found out that temperature affects, non-linearly, both mitochondrial Ca2+ influx via the mitochondrial Ca2+ uniporter (MCU) and steady-state Ca2+ concentration outside of mitochondria though a mitochondrial Na+/Ca2+ exchanger (NCLX)-dependent mechanism in both organs. Finally, we emphasized strong difference in the behavior of HM as compared to BM.
2. Material and Methods
2.1. Animals
The study was conducted according to the guidelines of the Declaration of Helsinki, and approved by the local institutional animal research committee (N° BH2012-65 for the surgical procedure and N° BH2012-64 for brain and heart collect). C57BL/6J male mice, aged between 12 and 16 weeks, were obtained from Charles River Laboratory. They were continuously exposed to light, with free access to food and water. They received human care according to the NIH Guide on the Use of Laboratory Animals (NIH Publication No. 85-23, revised 2011).
2.2. Mitochondria Extraction
After euthanasia of animal by cervical dislocation, brain and heart mitochondrial fractions were isolated by differential centrifugation. All operations were carried out in the cold or on ice. Brain or heart tissue was placed in a cold isolation buffer (75 mM sucrose, 225 mM mannitol, 0.1 mM EGTA, 20 mM HEPES/Tris, pH 7.40), finely minced and then homogenized in the same buffer (18 mL/g) with 5 mg/mL BSA, using a Potter Elvehjem. For the heart tissue only, the sample was incubated for 1 min with proteases (3 U/g of heart tissue). The homogenate was first centrifuged at 500× g for 5 min, then the supernatant was centrifuged at 1000× g for 5 min (this step was performed only for brain mitochondria), and this last centrifugation supernatant was centrifuged at 9000× g for 10 min. The mitochondrial pellet was suspended and homogenized in the same buffer without Ca2+ chelating agent and with 10 mM HEPES/Tris. Mitochondria were kept on ice until use and were assayed within 4 h of isolation.
2.3. Protein and Mitochondria Quantification
Protein concentration was used to estimate mitochondria concentration in each sample. Samples containing 500 µg of proteins for brain and 250 µg for heart were used for experiments. Protein content was then assayed according to the Lowry method [
16] using BSA as a standard; absorbance was read at 620 nm on a Spark multimode microplate reader (Tecan Trading AG, Männedorf, Switzerland).
Quantification of mitochondrial count was achieved by flow cytometry (BD LFortessa X-20, BD Biosciences, Franklin Lakes, NJ, USA) and the protein concentration was adjusted for brain and heart to 500 µg and 250 µg, respectively. In this control experiment, mitochondria were identified by nonyl acridine orange (NAO) staining. Brain and heart mitochondria (50 µg of total proteins) were counted under flow setting at 12 µL/min. Brain mitochondria exhibited different morphological characteristics from heart mitochondria, as represented on the histograms (
Supplemental Data Figure S1A) by the size (forward scatter) and the granularity (side scatter) of mitochondria populations. This 50 µg of brain and heart samples contained 21 × 10
6 and 32 × 10
6 mitochondria, respectively (
Supplemental Data Figure S1B). Consequently, a 500 µg brain sample for biochemical analysis contained 1.31 times more mitochondria than a 250 µg heart sample.
2.4. Mitochondrial Oxygen Consumption
Oxygen consumption was quantified to report the mitochondria respiration stimulated by complex I or complex II substrates by mean of the polarographic method of Chance and Williams [
17] using a Clark oxygen electrode, with an oxygraph (Oroboros Oxygraph 2-K, Oroboros Instrument Corp, Graz, Austria). Freshly isolated mitochondria were suspended in 2 mL respiration buffer (100 mM KCl, 1 mM EGTA, 5 mM KH
2PO
4, MgCl
2 1.2 mM, Tris HCL, pH 7.40 with 1 mg/mL BSA) and incubated at temperatures of interest (6, 10, 15, 20, 25, 31, or 37 °C) in the oxygraph cuvette. Temperature-dependency of complex I and II was assessed by pairs of activator/inhibitor, one after the other on the same mitochondria sample as followed:
- -
First, glutamate, malate, and pyruvate (GluMP; 20 µL, i.e., 5 mM final concentration in the cuvette for each) was added as electron donors to complex I and to spark the citric acid cycle (CAC). This basal state of oxygen consumption is named state 2.
- -
After stabilization, the whole mitochondrial respiratory chain (MRC) was started using adenosine diphosphate (ADP) in excess (20 µL, i.e., 2 mM), reaching a maximum activity, called state 3. Then, rotenone (10 µL, i.e., 12.5 µM) was used to inhibit complex I (or more precisely to block electrons transfer to ubiquinone), leading to state 4 [
18].
- -
MRC complex II was then stimulated with succinate (20 µL, i.e., 5 mM) and then inhibited by thenoyltrifluoroacetone (10 µL i.e., 80 µM) [
19].
2.5. Mitochondrial ROS (H2O2) Production Rate
H
2O
2 released from isolated mitochondria was detected by N-acetyl-3,7-di-hydroxy-phenoxazine assay (Amplex Red, Molecular Probes, Eugen, OR, USA) combined with horseradish peroxidase. Horseradish peroxidase catalyzes reaction between H
2O
2 and Amplex Red, generating resorufin on an equimolar basis, which, when excited at 530 nm, emits light at 590 nm. Cold effect on this enzymatic reaction was assessed in a control experiment and no significant variation could be detected at low H
2O
2 concentrations (
Supplemental Data Figure S2). One could note that 1 pM H
2O
2 induced a fluorescent signal on par with the values obtained in mitochondria. Measurement of ROS production was performed using a spectro-fluoro-photometer (F-2500 or F-7000 Digilab, Hitachi, Tokyo, Japan) equipped with thermostatic control. For experiments performed on the F-2500 spectro-fluoro-photometer, a correction factor (multiplication by 2.83, determined by the translation factor between the two standard curves) was applied in order to adjust a similar basal fluorescence value as on the F-7000 at the beginning of the experiment. Fluorescence was measured with peroxidase (20 µL, i.e., 7.4 mU/L) and Amplex red (20 µL, i.e., 2.5 µM), in 2 mL of ROS buffer (EGTA 1 mM, EDTA 1 mM, BSA 1.5 g/L, MgCl
2 1.2 mM, Tris 20 mM, pH 7.4) in a spectrophotometer cuvette incubated at the temperature of interest (6, 10, 15, 20, 25, 31, or 37 °C). Following a 2-minute-incubation period at a temperature of interest, mitochondria were added, prior to the substrates 2 min later (GluMP or succinate; 20 µL, i.e., 5 mM each) and ADP (4 µL, i.e., 40 µM). Rotenone (10 µL, i.e., 12.5 µM) was finally added after another 2 min delay. This addition of Rotenone was used to block the electron transport chain within complex I in both forward and reverse mode. Thus, rotenone added after GluMP led to full ROS production by complex I, while rotenone added after succinate blocked RET and forced FET from complex II, thus improving the respiration stimulated by complex II.
ROS assays according to increasing succinate concentrations at different temperatures (15, 20, 25, 31, or 37 °C) were performed with the same procedure with GluMP as initial substrate followed by 10 µL succinate pulses every 1 min and 30 s (10 µL, i.e., an increase in succinate concentration of 1 mM in the cuvette after each pulse). For each temperature, the EC50 of succinate concentrations were determined using a four-parameter logistic regression curve. At 15 °C the ROS production was too low to measure satisfactorily the changes induced by succinate. Data obtained at this temperature were not analyzed.
2.6. Mitochondrial Ca2+ Retention Capacity
Measurement was performed on spectro-fluoro-photometers (F-2500 or F-7000 Digilab, Hitachi, Tokyo, Japan) equipped with thermostatic control. For some experiments performed, a standardization factor (multiplication by 2) was applied on fluorescence values in order to obtain the same basal fluorescence value for all experiments. Extra-mitochondrial Ca2+ concentration was recorded using the Ca2+ sensitive probe Ca2+ green-5N (0.5 µM) (Molecular Probes, Eugene, OR, USA) with excitation and emission wavelengths set at 500 and 530 nm, respectively.
CRC was determined at temperatures of interest (15, 20, 25, 31, and 37 °C). Experiments were not performed below 15 °C because of extremely low Ca
2+ absorption under this temperature. Briefly, fresh mitochondria were suspended in 2 mL buffer (150 mM sucrose, 50 mM KCl, 2 mM KH
2PO
4, in 20 mM Tris/HCl, pH 7.40) in a spectrophotometer cuvette, with specific substrates in order to spark mitochondrial respiration and Krebs cycle, namely, glutamate (5 mM), malate (5 mM) or succinate (concentration was set at ROS production EC50 for each temperature), and MgCl
2 (1.2 mM) and ADP (40 µM). Contrary to the other experiments, pyruvate was not added because we found that it inhibited Ca
2+ absorption by mitochondria, as demonstrated in the control experiment (
Supplemental Data Figure S3A). We also controlled that GM in addition of succinate did not prevent Ca uptake (
Supplemental Data Figure S3B).
After the absorption of the previous pulse was complete (as observed by the plateau phase in the decline of fluorescence), 10 nmol CaCl2 pulses were performed. The amount of CaCl2 necessary to trigger a massive Ca2+ release, corresponding to mPTP opening, was used as an indicator of mitochondrial maximum CRC.
CRC was calculated as previously described [
20] (sum of amount of Ca
2+ added until opening of the mPTP) and with a calibration-based method (
Supplemental Data Figure S3C). We observed that basal fluorescence of Ca
2+ green-5N was lower in presence of mitochondria (even when mitochondria were uncoupled with addition of FCCP) and that this decrease was proportional to the mitochondria amount. In order to take in account this quenching of fluorescence, we subtracted the basal fluorescence level in all our calculation prior to figure out the real Ca
2+ amount absorbed by mitochondria as followed:
- -
Equation (1) is given by the fit of the calibration curve
where
F is the fluorescence intensity,
B is the bottom value of the calibration curve,
T is the top value of the calibration curve, LogEC50 is the logarithm of the [Ca
2+] at which 50% of the probe is bound,
x is the log(amount of Ca
2+) in the cuvette in nmol and
H is the hill slope of the calibration curve.
- -
Ca2+ concentration in the cuvette could be determined back with the fluorescence value using the transformed Equation (1) into Equation (2)
where
F is the fluorescence intensity after subtraction of the fluorescence noise (determined as the average fluorescence during the first 1 min of recording; F0) or by the averaged fluorescence before a Ca
2+ pulse when its level was below F0. Thus, CRC was calculated as the difference between the total amount of Ca
2+ added in the cuvette (number of pulses multiplied by the amount of Ca
2+ in each pulse) and the remaining amount of Ca
2+ in the cuvette just before mPTP opening.
Ca
2+ uptake rate and Ca
2+ concentration equilibrium were assessed using the second pulse of the Ca
2+ absorption curve, after normalization to the maximum peak fluorescence value. The second absorption curve was chosen because in heart, the first curve had, usually, a different profile from others absorption curves in heart or in brain. Ca
2+ uptake rates and Ca
2+ equilibrium concentrations were calculated according to a one phase exponential decay regression model. Experiments were performed with, and without, a mitochondrial NCLX inhibitor (CGP-37157) at a concentration of 20 µM. Indeed, the NCLX drives the efflux of Ca
2+ from the mitochondrion, whereas the MCU drives the influx [
21].
2.7. Mitochondrial Membrane Potential (Ψm)
Tetramethylrhodamine, Methyl Ester, Perchlorate (TMRM, ThermoFisher, Waltham, MA, USA) assay was performed on spectro-fluoro-photometers (F-2500 or F-7000 Digilab, Hitachi, Tokyo, Japan; λex 550 nm, λem 580 nm) equipped with thermostatic control. TMRM fluorescence was measured in the bath, therefore a decrease in fluorescence is associated with the hyperpolarization in Ψm while an increase in fluorescence reports a depolarization in Ψm. Briefly, TMRM was used at 20 nM for about 120 s, then substrates were loaded: (5 mM), malate (5 mM) or succinate (concentration was set at ROS production EC50 for each temperature) in order to make mitochondria respire at the basal level (state 2). After the equilibrium in Ψm was reached, MgCl2 (1.2 mM) and ADP (40 µM) were added to induced ATP synthesis-driving respiration for about 120 s. Finally, 10 µM FCCP was added to uncouple respiration and ATP synthesis that led to disruption of Ψm. After correction of the cold-dependent effect on TMRM, the depolarization induced by state 2 was estimated as the normalization of the mean fluorescence after FCCP by the mean fluorescence after substrates addition. The depolarization induced during state 3 respiration was estimated as the normalization of the mean fluorescence after FCCP by the mean fluorescence after ADP + MgCl2.
2.8. Chemicals
Unless otherwise specified, chemicals were purchased from Sigma Chemical (Sigma-Aldrich, St. Louis, MO, USA).
2.9. Statistics
Values were expressed as mean ± 95% confidence interval (IC95%) to measure the reproducibility of data values and mean ± SEM when the precision of the mean value was important for the interpretation of data. To assess temperature effect, Q
10 was used: it is a measure of the rate of change in a biological or chemical system with increasing the temperature by 10 °C. Q
10 value was determine with the following Equation (3):
Calculation of Ca2+ uptake rate by mitochondria was modelized by a one phase decay fit from the peak of fluorescence triggered by the second Ca2+ pulse. The rate constant, K (s−1), was extracted for all fits. Data were analyzed using GraphPad Prism 8.4.1 software (GraphPad Software, La Jolla, CA, USA). All reported p values are two-sided, and a p < 0.05 was considered statistically significant.
4. Discussion
Mitochondrion is at the crossroad of many cellular processes and it plays a key role in cellular death following I/R injury. Cold is an important factor in protecting against I/R injury. Surprisingly, only a few studies have explored the relationship between mitochondrial functions and cold. In our study, we explored the cold-sensitivity of respiration, ROS production, and CRC in both brain and heart mitochondria in normoxic conditions.
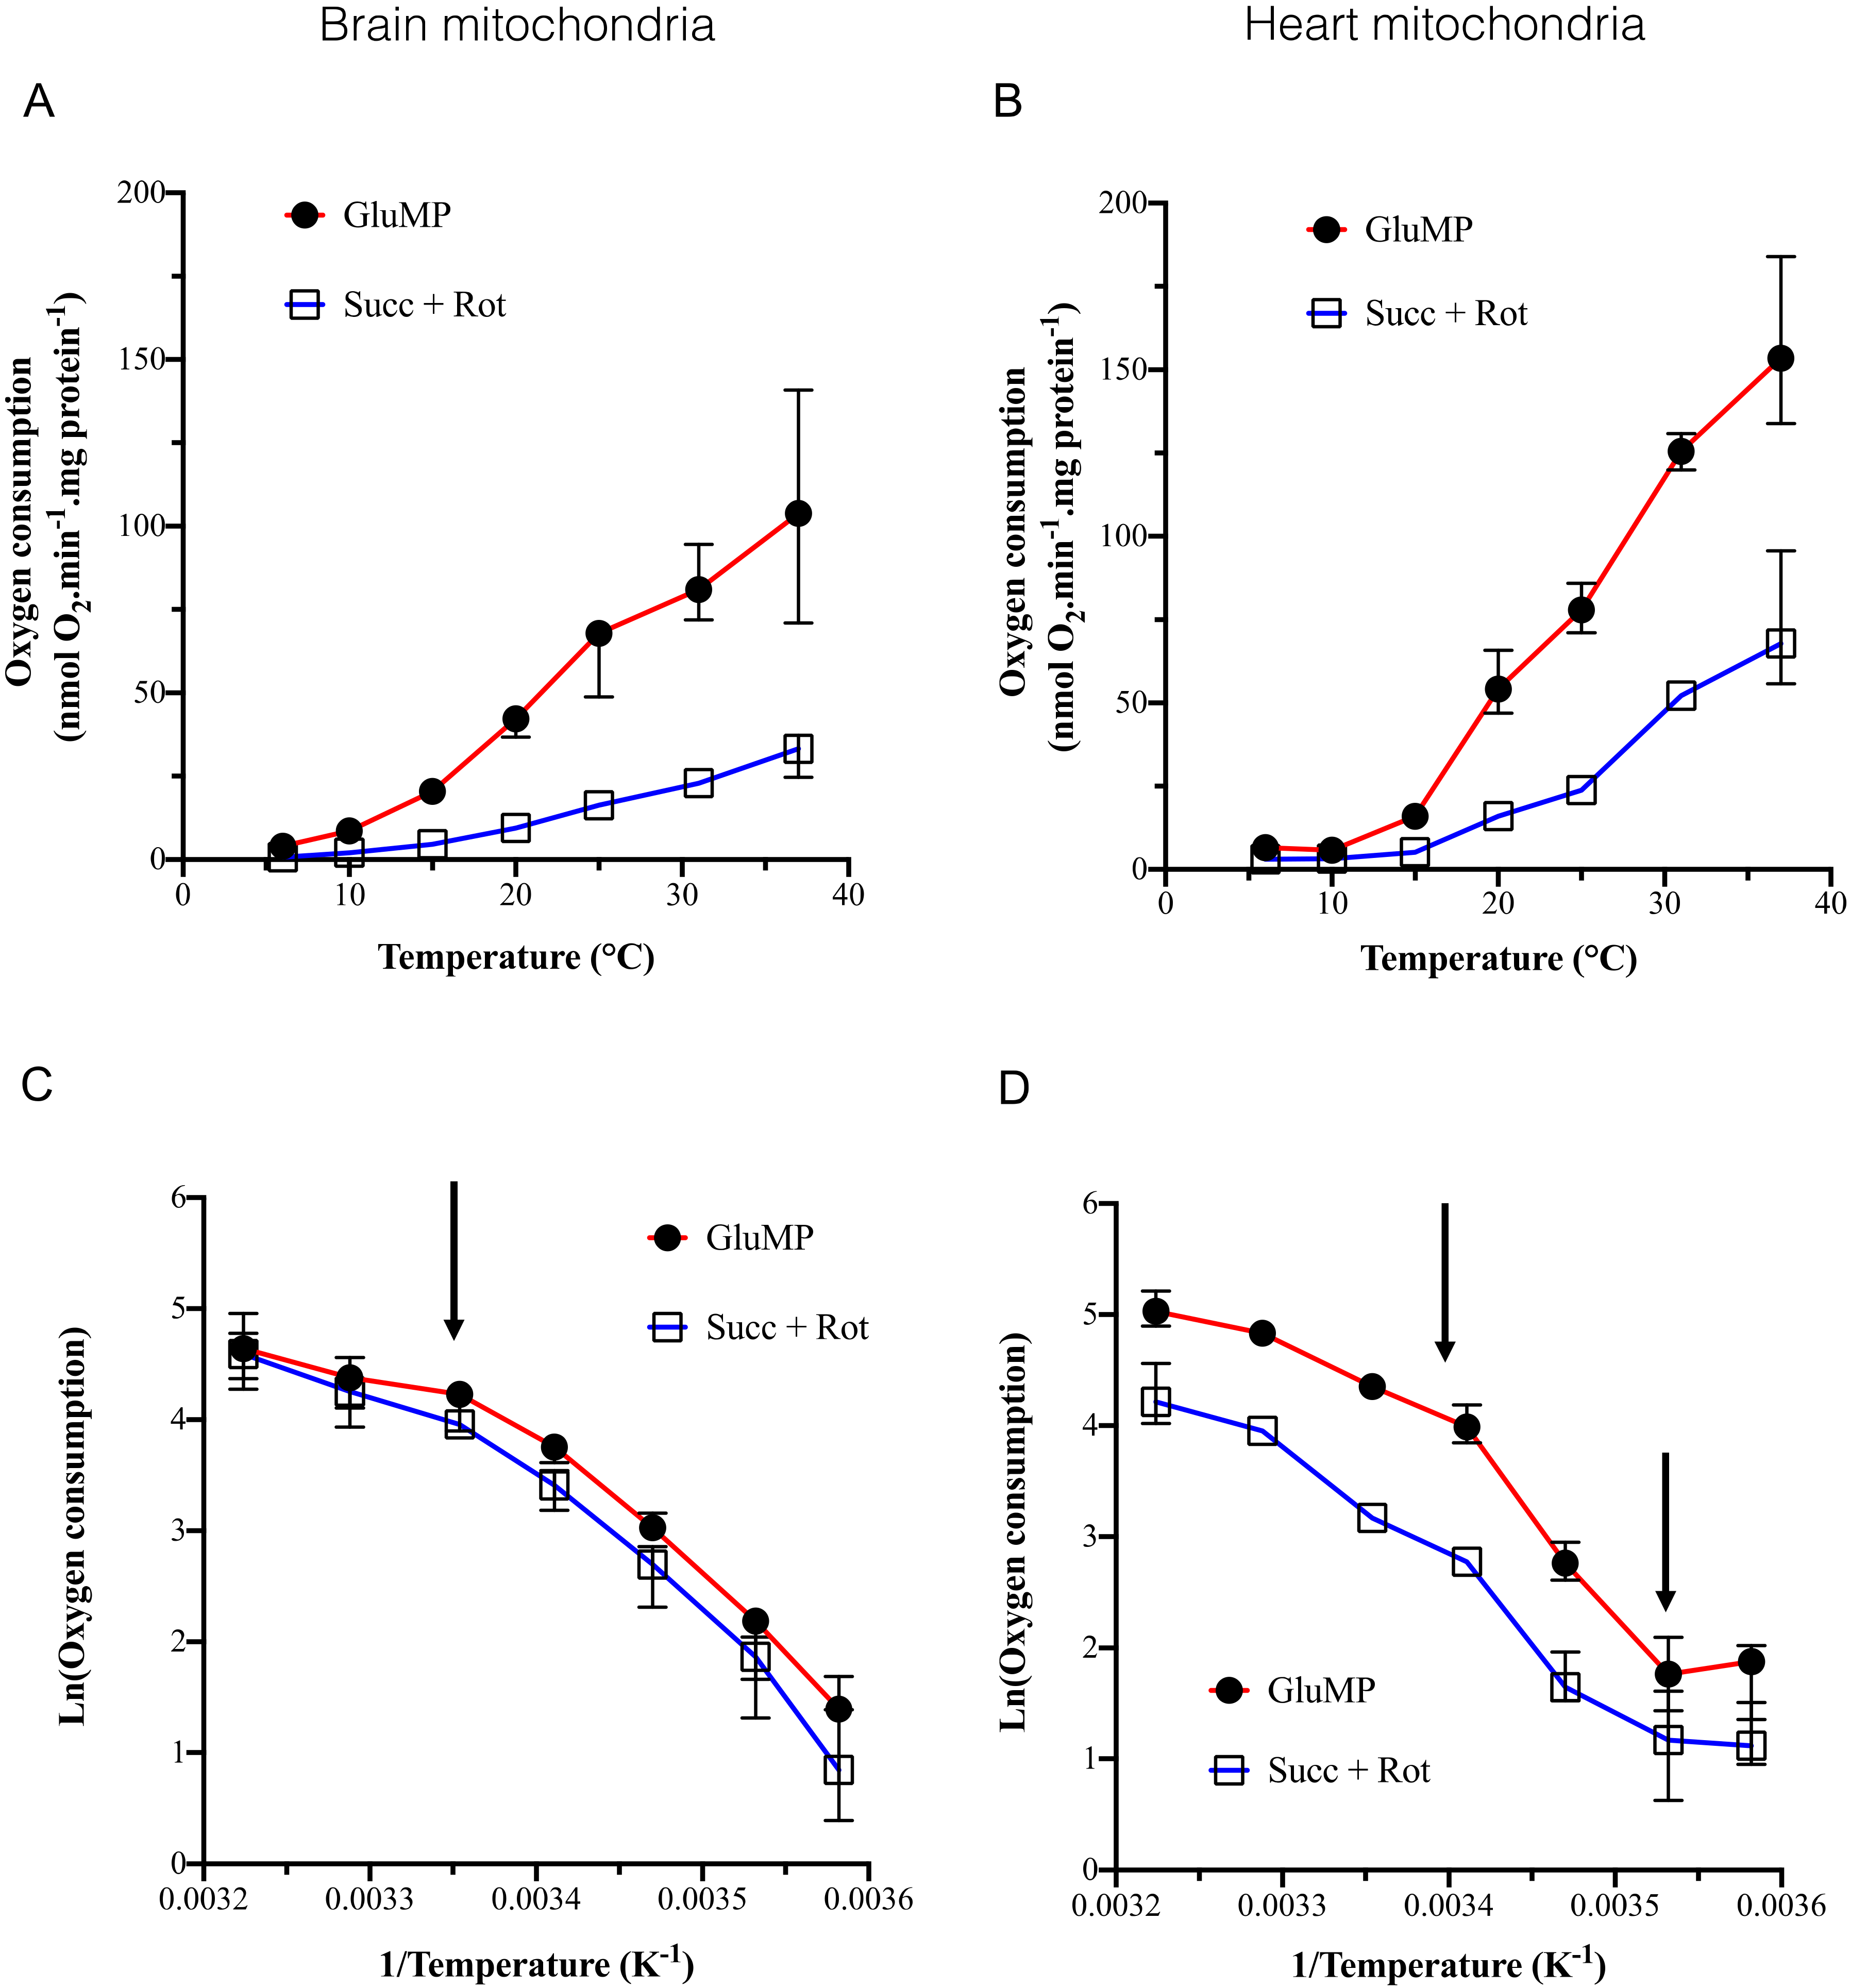
We confirmed the previously reported cold-dependence of respiration with a major breaking point in its activation energy around 25 °C [
12,
13,
28]. However, contrarily to these studies, we showed that (i) the cold-dependence of respiration was equivalent to whatever the substrate (GluMP or Succ + rotenone); (ii) the break point in activation energy of BM was 25 °C but was around 20 °C in HM. Two studies addressed this topic through a wide range of temperatures (37–7 °C) in mitochondria of homeothermic animals, fueled with glutamate malate and ADP-Mg
2+ [
28,
29]. They found a similar trend with a strong inhibition of respiration below 25 °C and Q
10 between 2 and 4. Another study on brain squirrel mitochondria [
30], in a narrower range of 37 to 28 °C, found a decrease of around 60% in mitochondrial GluMP or succinate-driven respiration. In mild cold condition (31 °C), the inhibition of respiration was 20%, but fell to an 80% decrease at 15 °C. The maximal cold-sensitivity was found between 25 and 6 °C that suggests that the cold-dependence could likely be related to protein denaturation happening gradually below 25–20 °C. Lemieux et al. reported that succinate addition to GluMP-fueled mitochondria enhanced their respiration but did not modify the cold sensitivity (Q
10 ~ 4 between 25 and 4 °C) [
28]. Our data confirmed that addition of Succ to GluMP could enhance respiration, and at least did not impair it (
Figure 3E,F). Lemieux et al. also concluded that the NADH-dependent respiration was enhanced while the temperature decreased. In our study, Q
10 was around four in BM but reached nine in HM fed with GluMP while it dropped to three in Succ-fed HM in the range (20–10 °C). Despite the Q
10 estimates, which can suffer from the divergency between the exponential models used [
22,
31], the Arrhenius plots did not show a lesser decrease in respiration in GluMP-fueled HM than in Succ-fueled ones (
Figure 1C,D).
ROS are mainly produced by mitochondria, as a byproduct of the MRC, in normoxia, as well as in the I/R setting. A two-site model of ROS production at complex I was proposed ten years ago [
32]. One site (I
F) is supposed to be at the NADH-binding site, the other one (I
Q), at the ubiquinone-binding site. The first is thought to be implied in ROS production during FET, the second during RET. We explored these two sites’ cold dependency, I
F alone in GluMP-fueled mitochondria incubated with rotenone, and I
Q with Succ alone-fueled ones. In mild cold condition (31 °C), the I
Q-mediated ROS production was decreased by 15%, but fell to an 85% decrease at 15 °C in BM and HM. I
F-mediated ROS production was decreased by 15% in HM but 45% in BM, and fell to a 90% decrease at 15 °C in HM. This difference in I
F-mediated ROS between BM and HM is supported by a difference in the activation energy, which decreased linearly with cooling in BM but started to decrease below 25 °C in HM (
Figure 2C,D). These results suggest that the composition (in sub-units or partner proteins) of complex I must be different in BM and HM in order to explain this difference.
In both BM as in HM, I
Q-mediated ROS is relatively stable in the range (37–20 °C), which means that while respiration decreases, the potency of RET to produce ROS is maintained. Below 15 °C, I
Q-mediated ROS cold-sensitive increases drastically, which could prevent ROS production through RET. Noteworthily, we found that the ROS production rate in BM was equivalent in both substrates, while ROS production via the complex I I
Q site was two times greater than via the complex I I
F site in the range (37–20 °C) (
Figure 2D and
Supplemental Figure S4B). In both organs, the cold-dependence of ROS production was higher (higher Q
10 values) in substrate conditions maximizing ROS production: GluMP + rot and Succ alone (
Table 1). This indicates that the complex I I
F site + complex III and complex II + complex III are less sensitive to cold than the pure complex I I
F site or complex II + complex I I
Q site.
A recent study introduced a novel paradigm in ROS implication in I/R injury physiopathology by showing that the accumulated Succ during ischemia was rapidly oxidized by complex II at the onset of reperfusion, which could lead to massive mitochondrial ROS production through RET at complex I [
7]. However, this theory has never accounted for the maintenance of complex I activity during the enhanced complex II stimulation with succinate. As succinate accumulation during in vivo ischemia is proportional to the duration of ischemia [
7], we studied mitochondrial ROS production according to increasing succinate concentrations. First of all, we demonstrated that ROS production induced by the addition of Succ required a higher (Succ) than (GluMP) at physiological temperatures. In addition, when temperature decreases, the requirement for Succ increases to boost ROS production in the presence of complex I substrates. This may explain why cold is known to reduce ROS production in cells. This boost in ROS production could indeed be caused by RET as proposed by Chouchani et al. [
7], but could also rely on a bottleneck in the electron path caused by the over-reduction in the CoQ pool [
8]. Involvement of RET would uncouple substrate consumption and respiration efficiency with a decrease in maximal respiration rate because RET would compete with FET. However, we observed a small increase in respiration what argued for a mechanism, different from RET, in which the respiration rate is already maximized and the electrons overproduced are released through ROS production. This mechanism would involve the over-reduction in the CoQ pool, which limits the ability of electrons produced by NAD Desyhydrogenase to be taken in charge in FET. These electrons will thereby leak through the complex I I
F or I
Q sites. In our study, BM produced ROS in mixt substrate condition at a maximal rate similar to the one induced by Succ alone or GluMP + rotenone. However, the boost of ROS production induced by addition of Succ in the presence of GluMP is maximized below 25 °C (
Figure 3D), a threshold temperature at which respiration decreases, whatever the substrate, ROS production at the complex I site I
F site decreases, while ROS production at the complex I site I
Q site is maintained. It is, thus, likely that ROS overproduction in mixt substrate condition mainly relies on the complex I site I
Q site. Noteworthily, we found that in HM, the boost in the ROS production rate in mixt substrate condition (
Figure 3) was equivalent to the ROS production rate driven by Succ alone but within the range (25–15 °C) but similar to the ROS production rate driven by GluMP + rotenone between 31 and 37 °C. This suggest that ROS production in mixt substrate condition is achieved at the complex I I
Q site in the range (25–15 °C). However, the decrease in ROS production rate between 31 and 37 °C in HM is likely due to the uncoupling between respiration and ROS production. Indeed, while the respiration rate fall by 50%, the maximal ROS production by the complex I I
F and I
Q sites only decreased by 39% and 25%, respectively. By contrast, in BM fueled by mixt substrate condition, the respiration rate fall only by 32% when maximal ROS production by the complex I I
F and I
Q sites only decreased by 58% and 43%, respectively. This uncoupling between respiration and ROS production rates between BM and HM in mixt substrate condition could shed light on the results found in neuroprotection in clinical studies [
2,
4].
Mitochondrion Ca
2+ homeostasis plays a key role in bioenergetics and in the protection of the cell by buffering the Ca
2+ overload in the cytosol. However, mitochondria can absorb Ca
2+ to a saturation threshold above which mPTP opens and causes a massive detrimental release of Ca
2+. So, increasing the CRC value could be a relevant aim to protect cells against Ca
2+ overload at reperfusion. In this study, we found an almost linear relation between CRC and cold, with a plateau in the range (25–20 °C) in BM and a limited increase in HM. Interestingly, BM displayed a higher absolute value of CRC per mitochondria, whereas the difference decreased when cooling down (12-fold at 37 °C to 4-fold at 15 °C). To go further into the characterization of the cold effect on the Ca
2+ homeostasis dynamic, we measured both Ca
2+ uptake rate and steady-state [Ca
2+] outside mitochondria and figured out the role of NCLX on these characteristic as well as its susceptibility to cold, and we finally estimated the role of MCU. We confirmed previous knowledge that NCLX activity is cold-dependent [
26], and we showed that it was mainly involved in the steady-state Ca
2+ concentration outside mitochondria. Interestingly, NCLX activity plays a major role in steady-state [Ca
2+] and is inversely correlated to CRC values in HM. Its role is milder in BM and the correlation with CRC values is not as strict as in HM (
Supplemental Figure S5D). Mild cold showed a strong inhibiting activity on the Ca
2+ uptake rate even in the presence of the NCLX inhibitor, in BM and HM in the narrow window of 37 to 25 °C. According to the key role of the MCU complex in the mitochondrial Ca
2+ uptake rate (
Supplemental Figure S5C), we, thus, inferred that the inhibition of the MCU complex by cold could explain this decrease in the Ca
2+ uptake rate within the range (37–25 °C). The discrepancy in the range of temperatures at which MCU and NCLX are inhibited, (37–25 °C) and (37–15 °C), respectively, would have strong consequences on the net flux of Ca
2+ and could participate in the increase in CRC value.
Our study has several limitations. First, we worked on intact mitochondria, not exposed to pathological processes such as I/R, but this was the only way to isolate cold as the sole factor influencing mitochondrial functions. Second, we studied non-cellular-specific brain and heart mitochondria. Indeed, brain and heart cells contain different types of mitochondria according to the different cell types, but, as used in clinical setting, therapeutic hypothermia is applied to the whole brain or heart, which is consistent with our approach. Third, our model excluded the effect of cell antioxidants and the effect of cold on them, but our model of isolated mitochondria was the only possible way to study the cold effects on MRC complexes.
In conclusion, we demonstrated that, in mixed substrates condition, cold uncouples differentially ROS production from respiration and mitochondrial Ca2+ fluxes, which could likely protect mitochondria from oxidation burst and mPTP opening, respectively.


 ,
, 


