
SMAD4-Dependent Signaling Pathway Involves in the Pathogenesis of TGFBR2-Related CE-like Phenotype
1
Edith Crawley Vision Research Center, Department of Ophthalmology, College of Medicine, University of Cincinnati, Cincinnati, OH 45267, USA
2
Department of Anesthesia, School of Medicine, Washington University in St. Louis, St. Louis, MO 63110, USA
3
School of Optometry, Indiana University, Bloomington, IN 47405, USA
*
Author to whom correspondence should be addressed.
Cells 2024, 13(7), 626; https://doi.org/10.3390/cells13070626
Submission received: 21 December 2023
/
Revised: 20 March 2024
/
Accepted: 27 March 2024
/
Published: 4 April 2024
Abstract
:(1) Background: Our previous data indicated that disturbance of the Transforming Growth Factor beta (TGFB) signaling pathway via its Type-2 Receptor (TGFBR2) can cause a Corneal Ectasia (CE)-like phenotype. The purpose of this study is to elucidate whether the SMAD4-dependent signaling pathway is involved in the TGFBR2-related CE-like pathogenesis. (2) Methods: Smad4 was designed to be conditionally knocked out from keratocytes. Novel triple transgenic mice, KerartTA; Tet-O-Cre; Smad4flox/flox (Smad4kera-cko), were administered with doxycycline (Dox). Optical Coherence Tomography (OCT) was performed to examine Central Corneal Thickness (CCT), Corneal Radius, Anterior Chamber and CE-like phenotype and compared to the littermate Control group (Smad4Ctrl). (3) Results: The OCT revealed normal cornea in the Smad4Ctrl and a CE-like phenotype in the Smad4kera-cko cornea, in which the overall CCT in Smad4kera-cko was thinner than that of Smad4Ctrl at P42 (n = 6, p < 0.0001) and showed no significant difference when compared to that in Tgfbr2kera-cko. Furthermore, the measurements of the Anterior Chamber and Corneal Radius indicated a substantial ectatic cornea in the Smad4kera-cko compared to Smad4Ctrl. The H&E staining of Smad4kera-cko mimics the finding in the Tgfbr2kera-cko. The positive immunostaining of cornea-specific marker K12 indicating the cell fate of cornea epithelium remained unchanged in Smad4kera-cko and the Proliferating Cell Nuclear Antigen (PCNA) immunostaining further indicated an enhanced proliferation in the Smad4kera-cko. Both immunostainings recapitulated the finding in Tgfbr2kera-cko. The Masson’s Trichrome staining revealed decreased collagen formation in the corneal stroma from both Smad4kera-cko and Tgfbr2kera-cko. The collagen type 1 (Col1a1) immunostaining further confirmed the reduction in collagen type 1 formation in Smad4kera-cko. (4) Conclusions: The aforementioned phenotypes in the Smad4kera-cko strain indicated that the SMAD4-dependent signaling pathway is involved in the pathogenesis of the CE-like phenotype observed in Tgfbr2kera-cko.
1. Introduction
Corneal stroma, serves as the major layer providing the most diopter for Visual Acuity (VA) in the cornea, is a highly organized collagenous matrix consisting of multiple collagenous lamellae and keratocytes [1,2,3,4,5]. The homeostasis of the corneal stroma requires proper formation of collagen, which is related to the SMAD4-dependent signaling pathway, a well-known pathway for Transforming Growth Factor beta (TGFB) signaling [6,7]. Disturbance in the corneal stroma can result in pathological changes, corneal abnormalities, and vision disorders. Among these disorders, Cornea Ectasia (CE) has the highest morbidity and is characterized by different patterns of corneal stroma thinning. Depending on the thinning pattern in the Optical Coherence Tomography (OCT), CE can be divided into keratoconus, keratoglobus and Pellucid Marginal Degeneration (PMD) [8,9].
Our previous study has established the Cause-to-Consequence rationale between Corneal Stroma TGFB Signaling and the CE-like phenotype, in which the deletion of the Transforming growth factor receptor 2 (Tgfbr2) in the stroma cell, specifically the keratocyte in the animal model Tgfbr2kera-cko at postnatal day 1 (P1), can generate the overall cornea thinning, accompanied with corneal epithelium thickening and pathological thinning in the corneal stroma at puberty [10]. Furthermore, the classic clinical sign of Acute Corneal Hydrops (ACH) can be recapitulated in our animal model of Tgfbr2kera-cko in the eye-rubbing experiment. The similarities shared between Tgfbr2kera-cko and CE patients were manifested in diagnosis, tissue, cell, and microstructure levels, which indicated that the downstream signaling of the Transforming Growth Factor-beta Type 2 Receptor (TGFBR2) at the postnatal stage plays an important role in triggering the pathogenesis, and the corneal stroma can serve as the major layer contributing to the CE-like phenotype [10]. Our previous findings are consistence with genomic and RNA-seq studies in clinics, which implicated that TGFB signaling dysfunction might be associated with the etiology of CE [11,12,13,14,15].
However, although the Cause-to-Consequence rationale between TGFB signaling and the CE-like phenotype was established in our previous study, TGFBR2 serves as an initiation component for the general TGFB signaling, and the deficiency of this receptor can affect many downstream pathways including SMAD4-dependent and SMAD4-independent pathways [12,14,16,17]. Whether the SMAD4-dependent signaling pathway is involved in the etiopathogenesis still needs further investigation. Furthermore, in another report, the protein level of phosphorylated SMAD2/3 is elevated in the keratoconus stroma cell, which contradicts our established rationale [12,18]. Due to the complicated interactions within the general TGFB signaling, our previous study encountered difficulty in further elucidating the major signaling pathways behind the CE-like phenotype.
To elucidate whether SMAD4-dependent signaling is involved in the pathogenesis of the TGFBR2 deficiency-related CE-like phenotype in the aspect of Loss-of-Function, we generated a novel transgenic mouse strain, Smad4kera-cko, in which the Smad4 is a conditional knockout from the keratocan (Kera)-positive keratocytes, the stroma cell, at postnatal day 1 (P1). The diagnosis approaches, basic science methods, and research strategies used in our previous study apply to this study to have a better comparison between these two conditional knockout mouse strains.
2. Method and Material
2.1. Mouse Strains
All the genetically modified mouse lines, KerartTA, Tet-O-Cre (TC) and Smad4flox/flox, have been previously described [19]. Compound transgenic mice were generated via natural mating of each mouse line. Most of the mice were bred at the Animal Facility of the School of Optometry, Indiana University, and few at University of Cincinnati. Experimental procedures for handling the mice were approved by the IACUC, Indiana University and University of Cincinnati. Animal care and use conform with the ARVO Statement for the Use of Animals in Ophthalmic and Vision Research.
2.2. Administration of Dox Chow
Mice were subjected to systemic induction by Dox chow (1 g/kg, Custom Animal Diets, Bangor, PA, USA). The Dox chow was given to Smad4kera-cko and Tgfbr2kera-cko at postnatal day 1 (P1) for postnatal development research and the measurements, including the OCT, OCE, HE stains, Fluorescent Immunostaining, and TEM, were performed at P42. For the embryonic research, the Dox chow was given on a breeder mating date and the data were collected at P1.
2.3. Hematoxylin and Eosin (H&E) Stain and Immunofluorescent Staining
Enucleated eyes and eyelids were fixed overnight in 4% PFA in PBS at 4 °C, followed by dehydration and paraffin embedding. De-paraffinized and rehydrated tissue sections (5 μm) were stained with Hematoxylin and Eosin and examined under a stereomicroscope (EVOSFL Auto, Life Technologies, Carlsbad, CA, USA). For immunofluorescent staining, tissue sections were subjected to antigen retrieval in sodium citrate buffer (10 mM sodium citrate, 0.05% Tween-20, pH 6.0) at boiling temperature. Cornea sections were then blocked with 3% bovine serum albumin (BSA) in PBS containing 0.05% NP-40 for 1 h at room temperature, then incubated overnight at 4 °C with the primary antibodies diluted in the same buffer. After three washes in PBST (PBS/0.1% Tween-20), slides were incubated at room temperature for 1 h with Alexa Fluor 488- or Alexa 555-conjugated secondary antibodies (Invitrogen, Waltham, MA, USA) and 1 μg/mL DAPI (Cat: #D3571; Molecular Probes, Inc. Eugene, OR, USA) as a nuclear counterstain, washed with PBST again, and mounted with Mowiol (Sanofi-Aventis U.S., Bridgewater, NJ, USA).
2.4. Corneal Thickness Examination
The central corneal thickness was measured by OCT using an iVue instrument (Optovue, Fremont, CA, USA). Smad4Kera-cko mice and littermate control were placed on a holder to keep the mouse corneas facing the OCT machine.
2.5. Genotyping
The identification of each transgenic allele was performed by Polymerase Chain Reaction (PCR) using tail genomic DNA as templates. PCR was performed by using the C1000TM Thermal Cycler (Bio-Rad Laboratories Inc., Hercules, CA, USA). After the initial step at 98 °C for 5 min, 40 cycles at 98 °C for 30 s, 65 °C for 30 s and 72 °C for 30 s were performed. Primer sets are listed below: KerartTA forward primer 5′ TGGTGGCTTGCTTCAAGCTTCTTC 3′, KerartTA reverse primer 1 5′ TATCCAACTCACAACGTGGCACTG 3′, KerartTA reverse primer 2 5′ GGAGTCTGCACTACCAGTACTCAT 3′, PCR product base pairs (bps); forward primer/reverse primer-1 knock-in 462 bps, forward primer/reverse primer-2 Wild-Type (WT) 389 bps. Tet-O-Cre forward primer 5′ GTCAGATCGCCTGGAGACGCC 3′, Tet-O-Cre reverse primer 5′ TCGCGAACATCTTCAGGTTCTGC 3′, PCR product 293 bps; Smad4flox forward primer 5′ TAAGAGCCACAGGGTCAAGC 3′, Smad4flox reverse primer 5′ TTCCAGGAAAAACAGGGCTA 3′, PCR product; knock-in 500 bps, WT 436 bps.
2.6. Statistical Analysis
A two-tailed Student’s t-test (Prism 10.2.1) was used to analyze the significance of the difference. p-value and the * number were automatically generated by Prism. The sign of ns represents “not significant” between two groups.
2.7. Transmission Electron Microscopy (TEM)
Tissue was fixed in 3% glutaraldehyde in 0.15 M sodium cacodylate buffer, postfixed in 1% osmium tetroxide in 0.15 M sodium cacodylate buffer, processed through a series of alcohols, infiltrated and embedded in LX-112 resin. After polymerization at 60° for three days, ultrathin sections (120 nm) were cut using a Leica EM UC7 ultramicrotome and counterstained in 2% aqueous uranyl acetate and Reynold’s lead citrate. Images were taken with a transmission electron microscope (Hitachi H-7650, Tokyo, Japan) equipped with a digital camera (BioSprint 16, Frankfurt, Germany).
2.8. Optical Coherence Elastography (OCE)
The corneas were collected from Smad4kera-cko and Smad4Ctrl. After the collection, the eyeballs were fixed in 4% PFA for 1 min to inhibit the enzyme reaction and then stored in the cornea transfer buffer Optisol-GS® before OCE examination. The Wave Speed, Young’s Modulus, and Viscosity were measured at 10 mmHg IntraOcular Pressure (IOP).
3. Result
The SMAD4-dependent signaling pathway is one of the major pathways in TGFB signaling administering collagen formation in corneal stroma via controlling the activity of keratocytes [7]. Our previous study established the Cause-to-Consequence rationale between corneal stroma TGFBR2-deficiency and CE-like Phenotype [10]. Whether the CE-like phenotype is related solely to decreased collagen formation or more severe pathological changes disturbing the ECM organization remains elusive. To address this topic, whether SMAD4-dependent signaling can generate a similar CE-like phenotype as found in Tgfbr2kera-cko in the aspect of Loss-of-Function becomes critical.
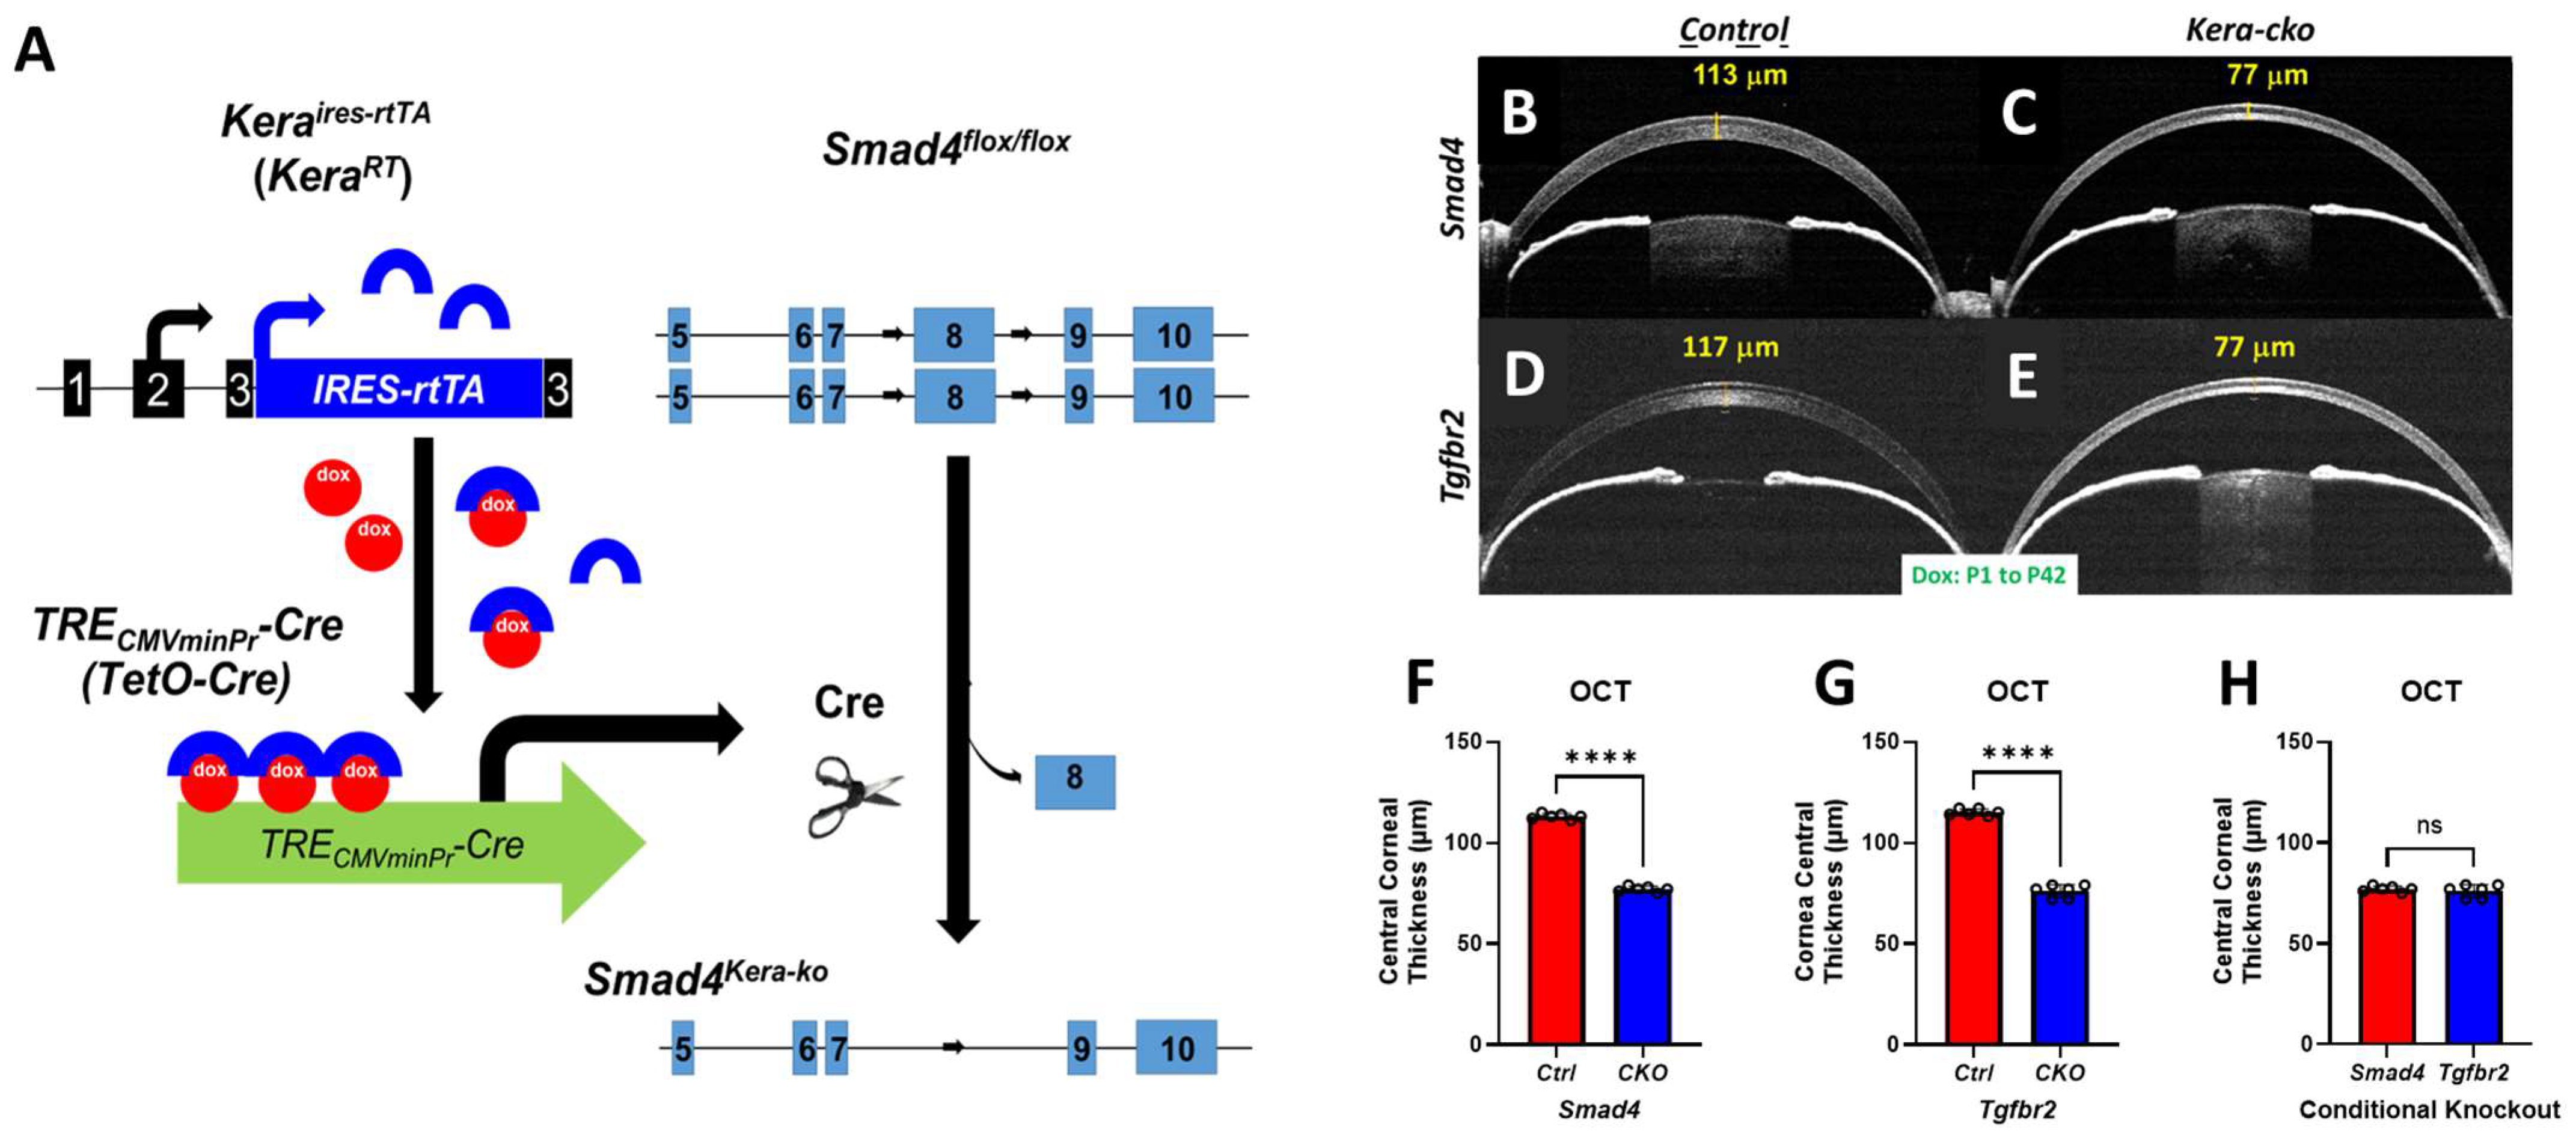
Herein, we generated a novel transgenic mouse strain, Smad4kera-cko, in which the Smad4 is deleted from the keratocyte at postnatal day 1 (P1) upon Dox administration (Figure 1 A). OCT, stereo microscopy, iCare Tonolab, H&E staining, Immunofluorescence, and TEM were applied to Smad4kera-cko and Smad4Ctrl at P42 to have a better phenotype comparison between Smad4kera-cko, Tgfbr2kera-cko and their control group mouse strains, respectively.
3.1. OCT Revealed a General Cornea Thinning in Smad4kera-cko and Tgfbr2kera-cko
OCT revealed greater corneal thinning in Smad4kera-cko compared to those in the control group (Figure 1A–C). In detail, OCT revealed that instead of forming normal Central Corneal Thickness (CCT) of 113.00 ± 0.58 μm (Mean ± SEM) in the littermate controls at P42, the conditional knockout of Smad4 in keratocytes resulted in a thinner cornea with a CCT of 77.00 ± 0.58 μm (n = 6, ****, p < 0.0001). (Figure 1B,C,F) Moreover, Tgfbr2kera-cko also exhibited a significantly thinner cornea with a CCT of 76.00 ± 1.32 μm compared to the control group with a CCT of 115.00 ± 0.68 μm (n = 6, ****, p < 0.0001). (Figure 1D,E,G).
We further compared the CCT of Smad4kera-cko and Smad4Ctrl to those of Tgfbr2kera-cko and Tgfbr2Ctrl to elucidate whether there is a significant difference between each with Dox induction during postnatal development. The OCT showed no significant difference between the conditional knockout groups of Smad4kera-cko and Tgfbr2kera-cko, (n = 6, ns) (Figure 1H) and control groups of Smad4Ctrl and Tgfbr2Ctrl. These data suggested the possibility that the dysfunction of SMAD4-dependent signaling is involved in the generation of TGFBR2-related CE-like cornea thinning.
3.2. Ectatic Cornea with Normal IOP Reading
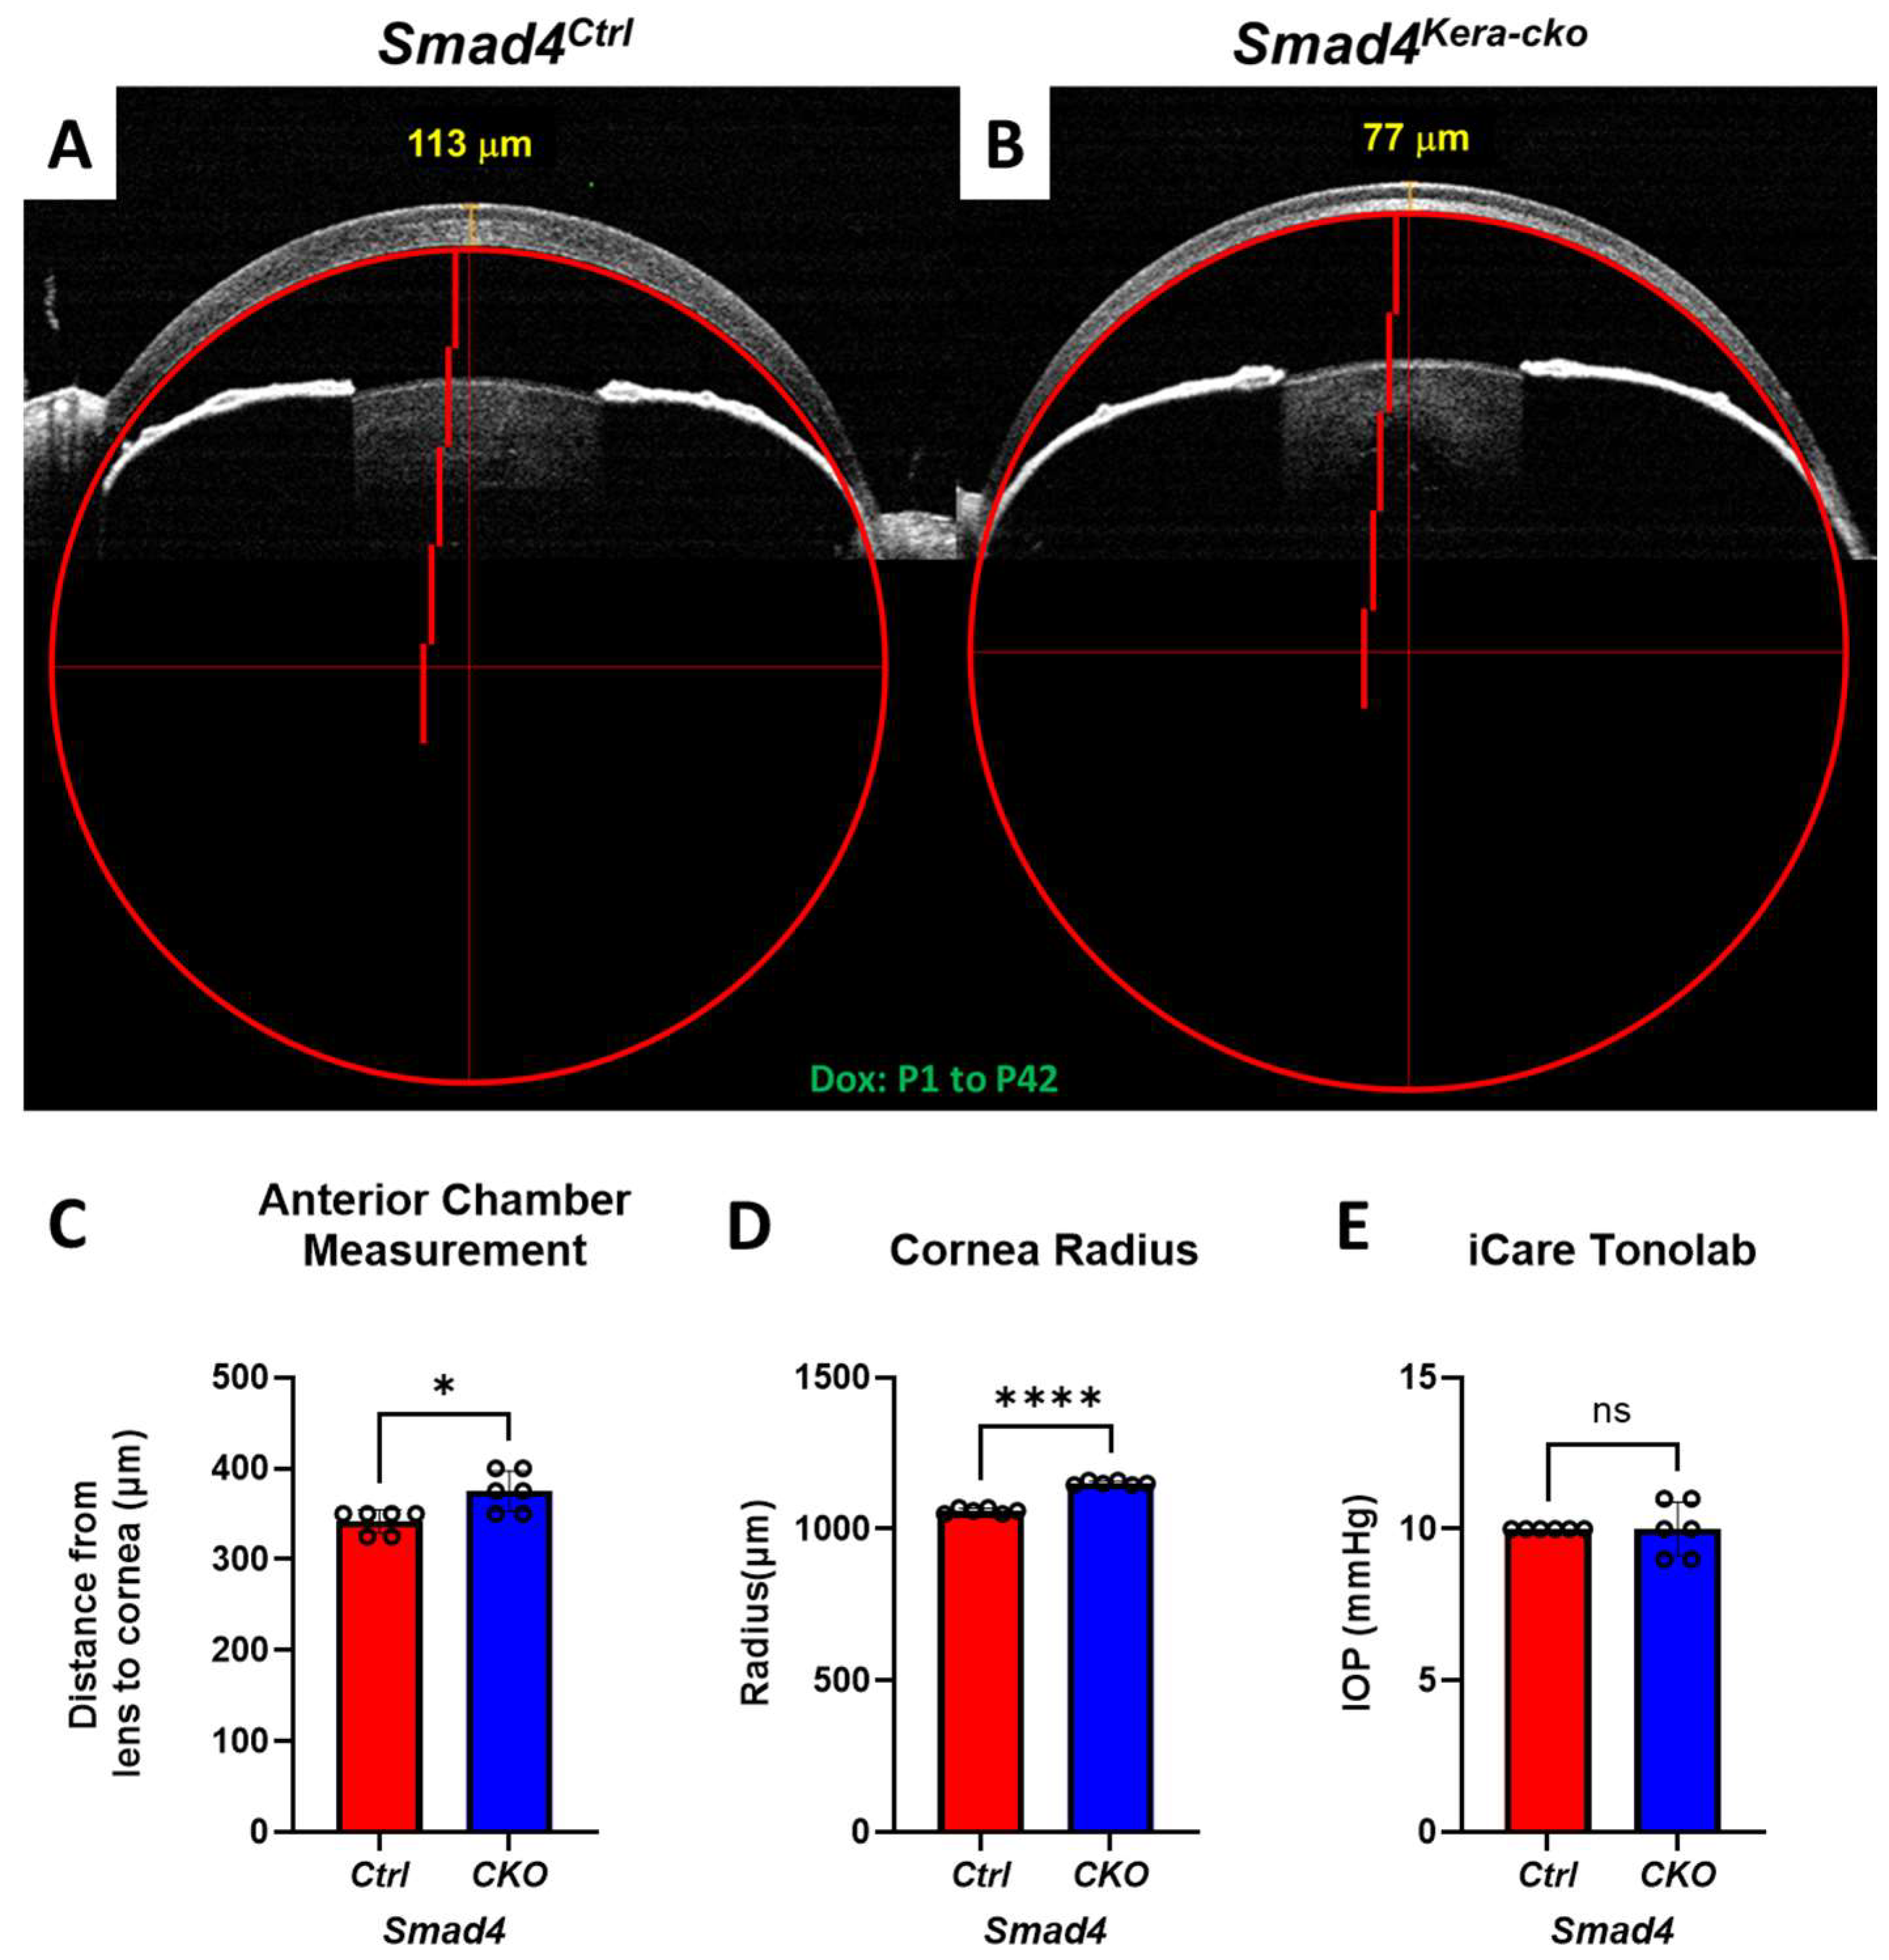
To quantify the level of ectatic cornea, we used the perfect circle to measure the radius of the corneas via OCT images to check the expansion and protrusion situation in Smad4kera-cko and Smad4Ctrl (Figure 2A,B). OCT showed that, instead of showing a normal-sized cornea with a radius of 1060.00 ± 3.65 μm in the littermate controls at P42, deletion of Smad4 in keratocytes resulted in ectatic cornea with a radius of 1151.56 ± 2.79 μm (n = 6, ****, p < 0.0001) (Figure 2A,B,D). Furthermore, we measured the distance between the lens and posterior cornea to see whether the Anterior Chamber was enlarged in the Smad4kera-cko compared to Smad4Ctrl. A significant Anterior Chamber enlargement was noticed in the Smad4kera-cko with a distance of 375.00 ± 9.13 μm compared to the control group with 341.67 ± 5.27 μm (n = 6, *, p = 0.013) (Figure 2A–C). We further used the iCare Tonolab to measure the IntraOcular Pressure (IOP) in Smad4kera-cko and the control group. The IOP reading from iCare Tonolab showed no difference between the two groups (Figure 2E).
3.3. Decreased VP Can Be Found in Ectatic Cornea
In clinics, decreased Visual Acuity (VA) is one of the major symptoms in CE patients. In this study, we desire to check whether the ectatic cornea can also result in decreased Visual Precision (VP) in Smad4kera-cko. A stereo microscope was applied to our animal models of Smad4kera-cko and Smad4Ctrl to have a better understanding of the ocular surface conditions.
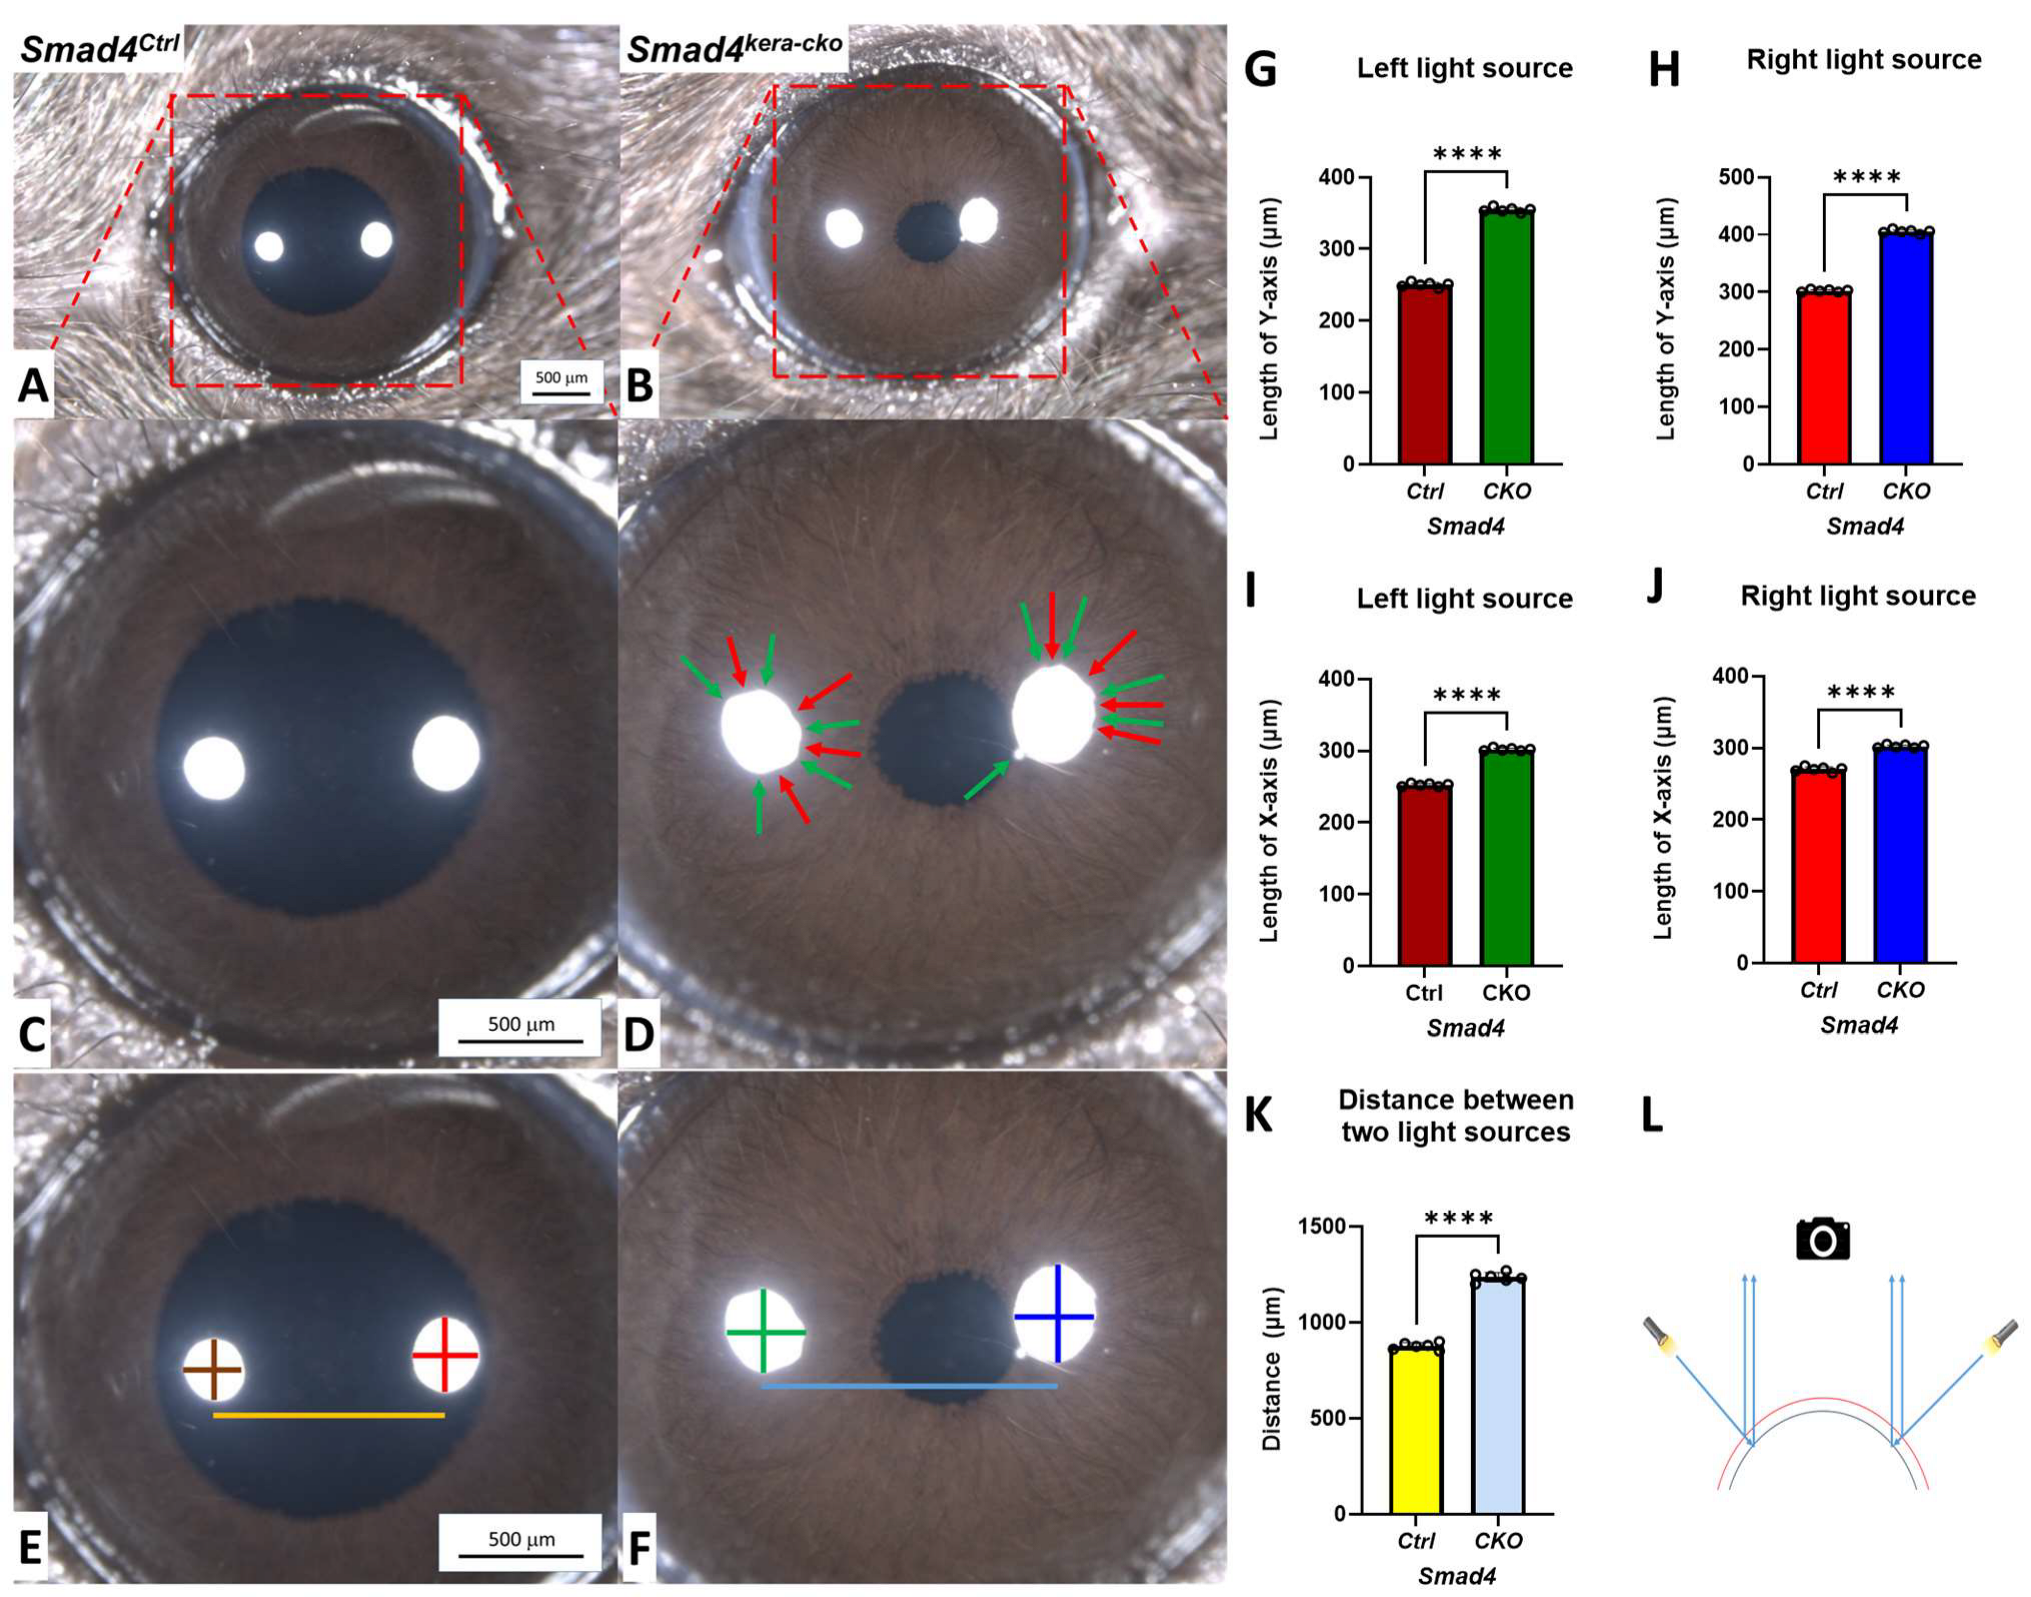
The stereo microscope showed transparency in both groups with a well-developed ocular appendage (Figure 3A,B). Furthermore, the sharp reflections from the light sources indicated that the tear film was well formed in Smad4kera-cko and the littermate control. However, unlike the control group with the round reflection of two light sources, altered and irregular reflections from light sources were found in the Smad4kera-cko mice, which indicates that the ocular surface has an irregular shape (Figure 3C,D). The altered ocular surface can cause decreased VP due to the altered refraction angles and the existence of multiple Focal Points other than Principal Focal Point. Furthermore, the altered dimensions from the two sources in the Smad4kera-cko indicate substantial cornea expansion compared to the Smad4Ctrl cornea (Figure 3E–L).
3.4. Histopathological Changes
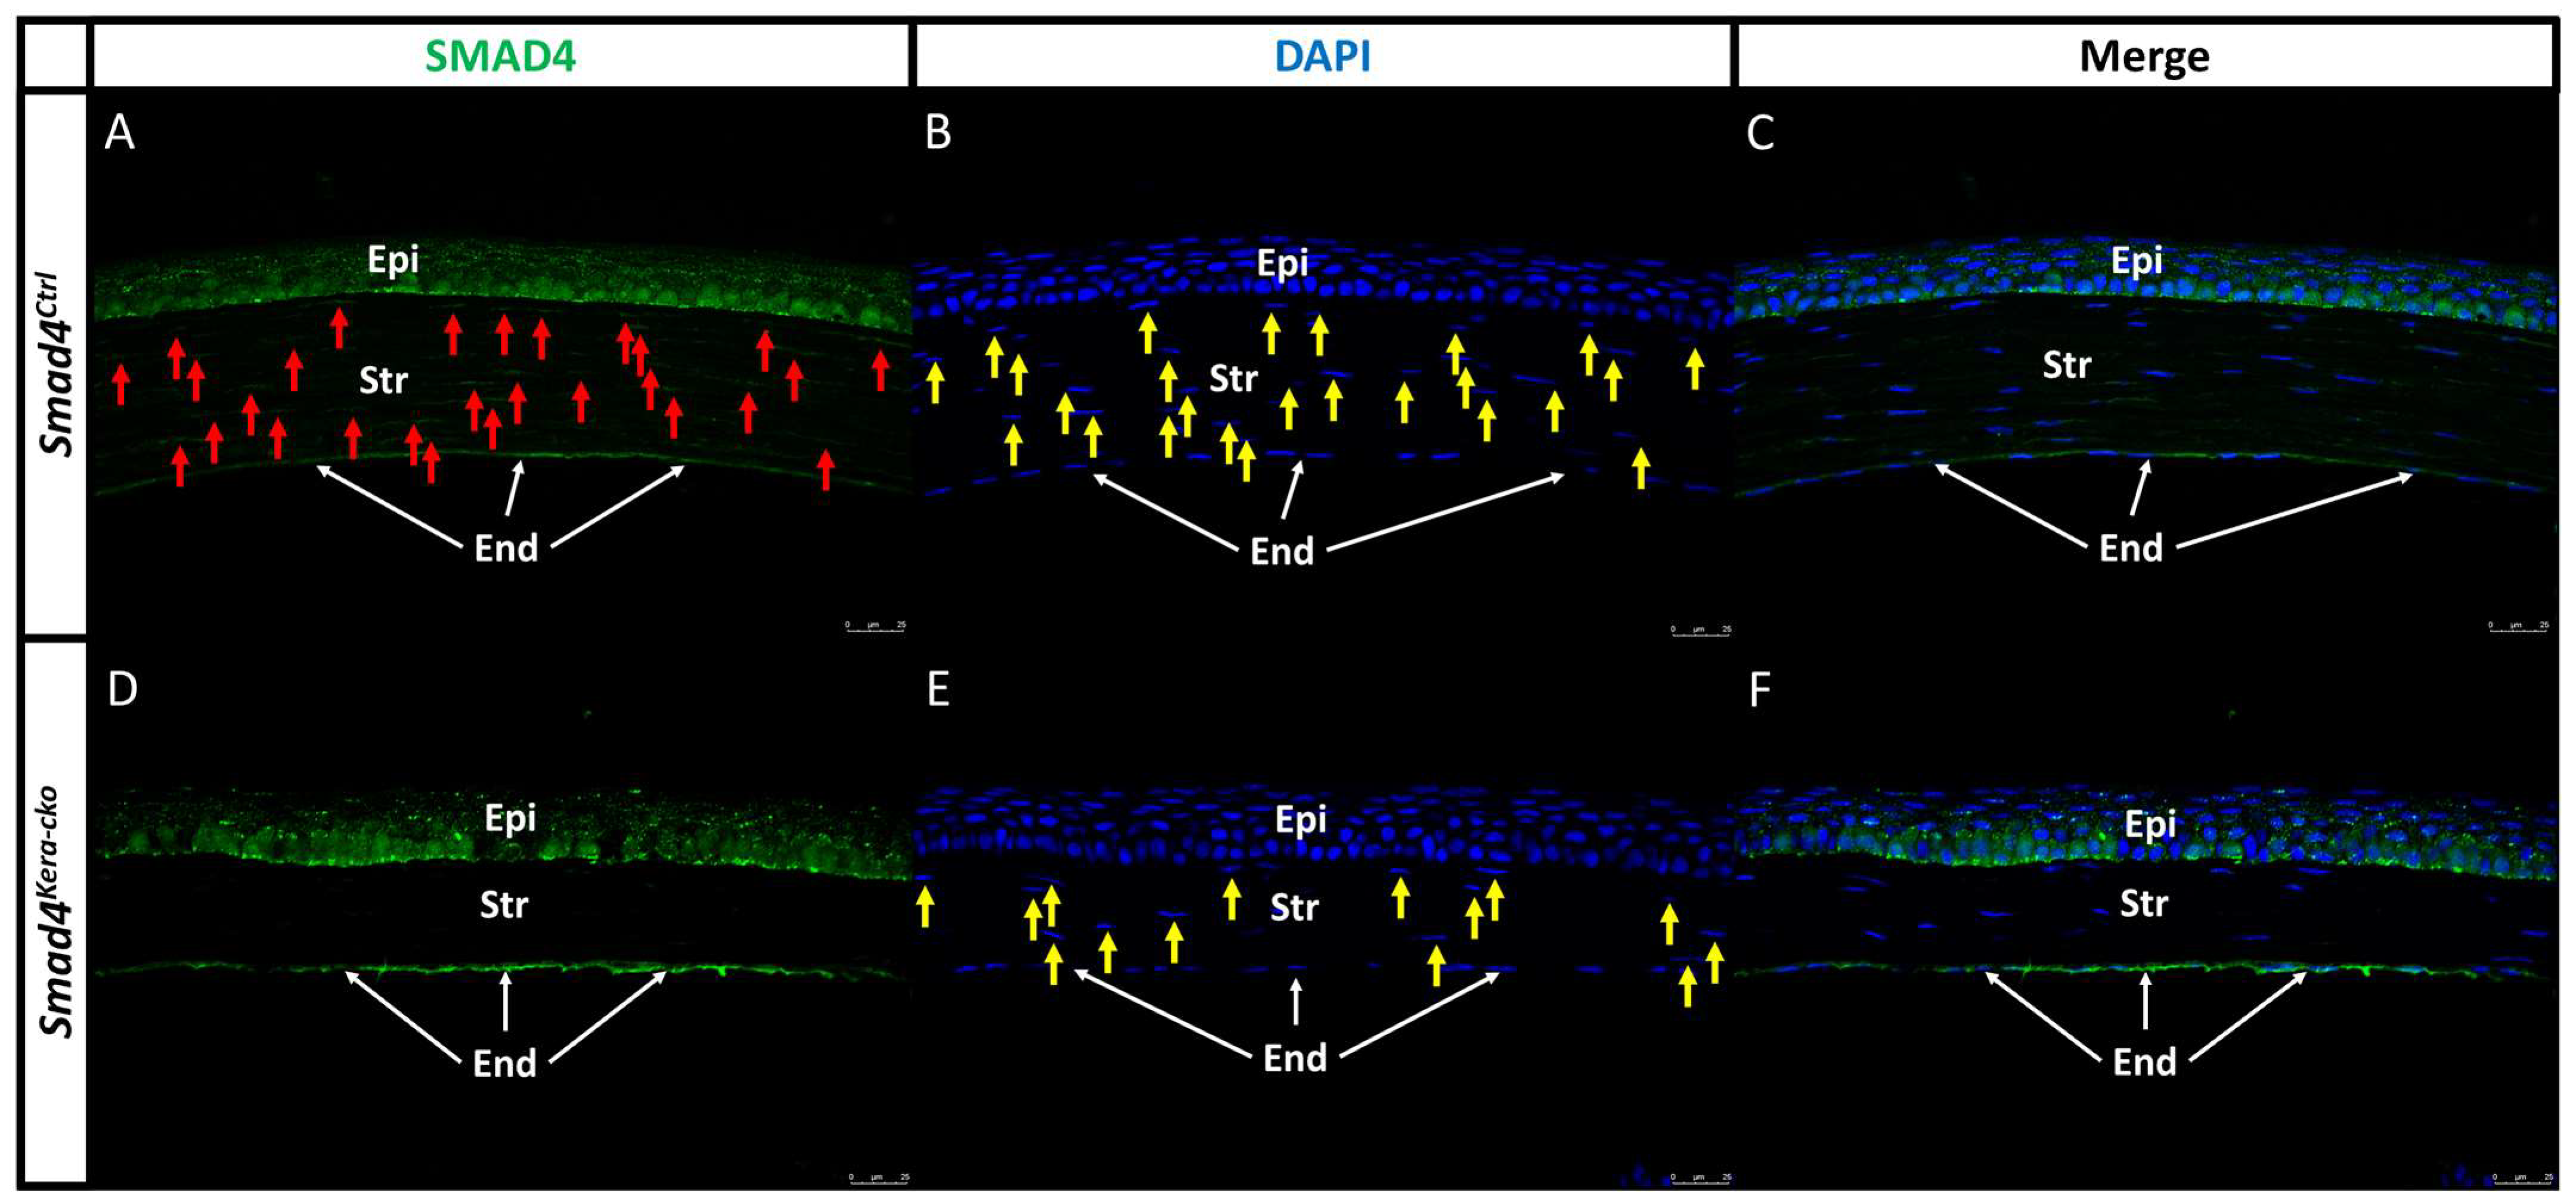
Our previous findings in diagnosis level including cornea thinning and a transparent cornea with normal IOP in Tgfbr2kera-cko were recapitulated in this current study using Smad4kera-cko. Whether the histological changes including the corneal epithelium thickening, corneal stroma thinning, and corneal epithelial basal cell morphology also mimic the Tgfbr2kera-cko findings needs further confirmation. To have a better understanding of the tissue and cellular level and see whether the findings in OCT, iCare Tonolab and stereo microscope in Smad4kera-cko followed the same rationale found in Tgfbr2kera-cko, we first checked the SMAD4 expression in the Smad4kera-cko mice to see whether the Smad4 was a conditional knockout in the keratocyte and then we examined the histopathological changes and cell behavior including the histology, collagen formation, proliferation and differentiation marker. Like the littermate controls, the Smad4kera-cko mice were able to develop normal eye appendages. The SMAD4 expression can be found in the corneal epithelium and corneal stroma in Smad4Ctrl close to the nuclei (Figure 4A–C, Epi area, red arrow for SMAD4 in the Str and yellow arrow for nuclei in the Str) and the corneal epithelium in the Smad4kera-cko (Figure 4D–F, Epi area). However, the SMAD4 expression could not be detected in the corneal stroma of Smad4kera-cko (Figure 4D Str area). The SMAD4 immunostaining indicated that the Smad4 was deleted successfully in the keratocytes.
3.4.1. Corneal Epithelium
The corneal epithelium consists of five to seven cell layers including a basal cell layer, wing cell layers, and squamous cell layers, unlike the corneal stroma, and has the major role of providing the diopter for human VA. It also serves as the outermost protective component, playing multiple functions including migration, proliferation, forming the bowman’s membrane in humans and the basement membrane in mice to guarantee the function of the corneal stroma and further serves as a pool for ocular surface compensation to uneven corneal stroma thinning, which is a characteristic used in LASIK surgery [20,21,22]. Our previous study using Tgfbr2kera-cko had shown that basal epithelial cells exhibited enlargement and irregular arrangement when compared to the control group, which recapitulates the clinical findings in CE patients. Similar to Tgfbr2kera-cko, in Smad4kera-cko, our H&E histology staining confirmed the finding in OCT that the cornea is substantially thinner in Smad4kera-cko as compared to that in the littermate control (Figure 5A–D). Furthermore, in detail information, the corneal epithelium layer in Smad4kera-cko is substantially thicker than the control group. The H&E histological staining illustrated that the thinner corneas found in the OCT were contributed by the thinner corneal stroma, which is consistent with Tgfbr2kera-cko.
At the cellular level, compared to the control group, a substantial hypertrophic pathological change was found in Smad4kera-cko corneal epithelial basal cell. Depending on the basal cell in Smad4kera-cko, the elongated enlargement was 1.5 to 2 times compared to those in Smad4Ctrl. The pathological changes of hypertrophy and enhanced stratification were also detected in Smad4kera-cko wing cell and superficial cell, which indicates a hyperplasia pathological change. The similarities shared between Tgfbr2kera-cko and Smad4kera-cko suggested that compromised SMAD4 signaling participated in the generation of the cornea thinning phenotype found in the Tgfbr2kera-cko mouse line.
Morphological changes in the epithelial basal cells prompted us to examine epithelial cell differentiation in response to the original Smad4 ablation from the keratocytes. We found that the K12 in the corneal epithelium remained unchanged in Smad4kera-cko as compared with those in their Smad4Ctrl littermates (Figure 6A,B). We further examined the proliferation using PCNA immunostaining to see whether the enhanced proliferation found in the Tgfbr2kera-cko epithelium could be recapitulated in the Smad4kera-cko mice and might serve as an explanation for the corneal epithelium thickening. The result of the PCNA immunostaining revealed an enhanced proliferation in the Smad4kera-cko mice in which the positive immunostaining substantially increased in the corneal epithelium (Figure 6C–I) (n = 6, ****, p < 0.0001). Unlike the Smad4Ctrl mice had the positive staining restricted to the basal cell (Figure 6C,E). The Smad4kera-cko mice exhibited positive staining in the wing cells, which are in the second and third layers in the corneal epithelium (Figure 6F,F′,F″,H,H′,H″). The finding of corneal epithelium proliferation further recapitulated the phenotype found in the Tgfbr2kera-cko in the aspect of cell functional assay.
Furthermore, in this study, we found that the pathogenesis of overall thinning of the cornea accompanied with thinner cornea stroma and thicker cornea epithelium only happened at the postnatal stage (Figure 7A–D).
3.4.2. Corneal Stroma
The corneal stroma is a highly organized collagenous matrix consisting of multiple collagenous lamellae and keratocytes. SMAD4-dependent signaling in keratocytes is known for administering collagen formation and regulation [7]. Our previous CE studies using Tgfbr2kera-cko revealed a significant reduction in collagen type 1 formation and a significant decrease in keratocyte numbers in the corneal stroma [10]. In this current study, H&E histological staining of Smad4kera-cko revealed pathological thinning of the corneal stroma, which recapitulates the finding in Tgfbr2kera-cko. To confirm that the corneal stroma thinning in the Smad4kera-cko is related to the formation of collagen and follows the rationale in Tgfbr2kera-cko, we performed Masson’s Trichrome staining in the Tgfbr2kera-cko, Tgfbr2Ctrl, Smad4kera-cko and Smad4Ctrl mouse lines to visualize the collagen formation and distribution in the corneal stroma. Masson’s Trichrome staining revealed a substantial reduction in collagen in the corneal stroma in Smad4kera-cko (Figure 8B) and Tgfbr2kera-cko (Figure 8D) compared to their control groups, respectively (Figure 8A,C). The findings in Smad4kera-cko and Tgfbr2kera-cko implied that a compromised collagen formation in Smad4kera-cko and Tgfbr2kera-cko, which further correlated a compromised SMAD4-dependent signaling to the Tgfbr2-related CE-like phenotype in the aspect of collagen formation in the corneal stroma.
However, unlike Tgfbr2kera-cko, the phenotype of uneven distribution and clusters of keratocytes in the corneal stroma cannot be recapitulated in Smad4kera-cko mice, indicating the possibility that the pathogenesis and the pathophysiology of keratocyte, although they exhibit the same phenotype in OCT, might differ (Figure 5A–D,D′,D″,D‴, Figure 8A–D). Considering the thinning of the corneal stroma, the total stromal cell density was found to be significantly higher in Smad4kera-cko compared to Smad4Ctrl (Figure 8A–D,K) (n = 6, ****, p < 0.0001).
To further confirm the finding of the Masson’s Trichrome staining in Smad4kera-cko, we performed immunostaining of collagen type 1 (Col1a1) in Smad4kera-cko and Smad4Ctrl. Consistent with the finding of Masson’s Trichrome and our previous paper using Tgfbr2kera-cko, the collagen type 1 formation was substantially lower in the Smad4kera-cko (Figure 8H–J) compared to that of Smad4Ctrl (Figure 8E–G). Moreover, a noticeable discontinued Col1a1 staining was found in the Smad4kera-cko in the posterior and anterior corneal stroma (Figure 8H red *).
3.5. Keratocytes Attache to Descemet’s Membrane in the Absence of SMAD4-Dependent Signaling
In our previous study, eye-rubbing served as the representative of the environmental factors examined in our previous animal model of Tgfbr2kera-cko. The finding of the eye-rubbing experiment indicated the importance and the significance of the involvement of environmental factors in the pathogenesis of the CE-like phenotype by showing the similarities between the classic signs found in acute/advanced CE, including keratoconus, keratoglobus, and a PMD called Acute Corneal Hydrops (ACH), after the disorder was triggered by the genetic defect of TGFBR2 in the corneal stroma. The ACH sign is due to the rupture of Descemet’s membrane, which indicates that Descemet’s membrane suffered due to the pathological thinning of the corneal stroma, and the homeostasis, together with the structure, could not be maintained in our previous animal model.
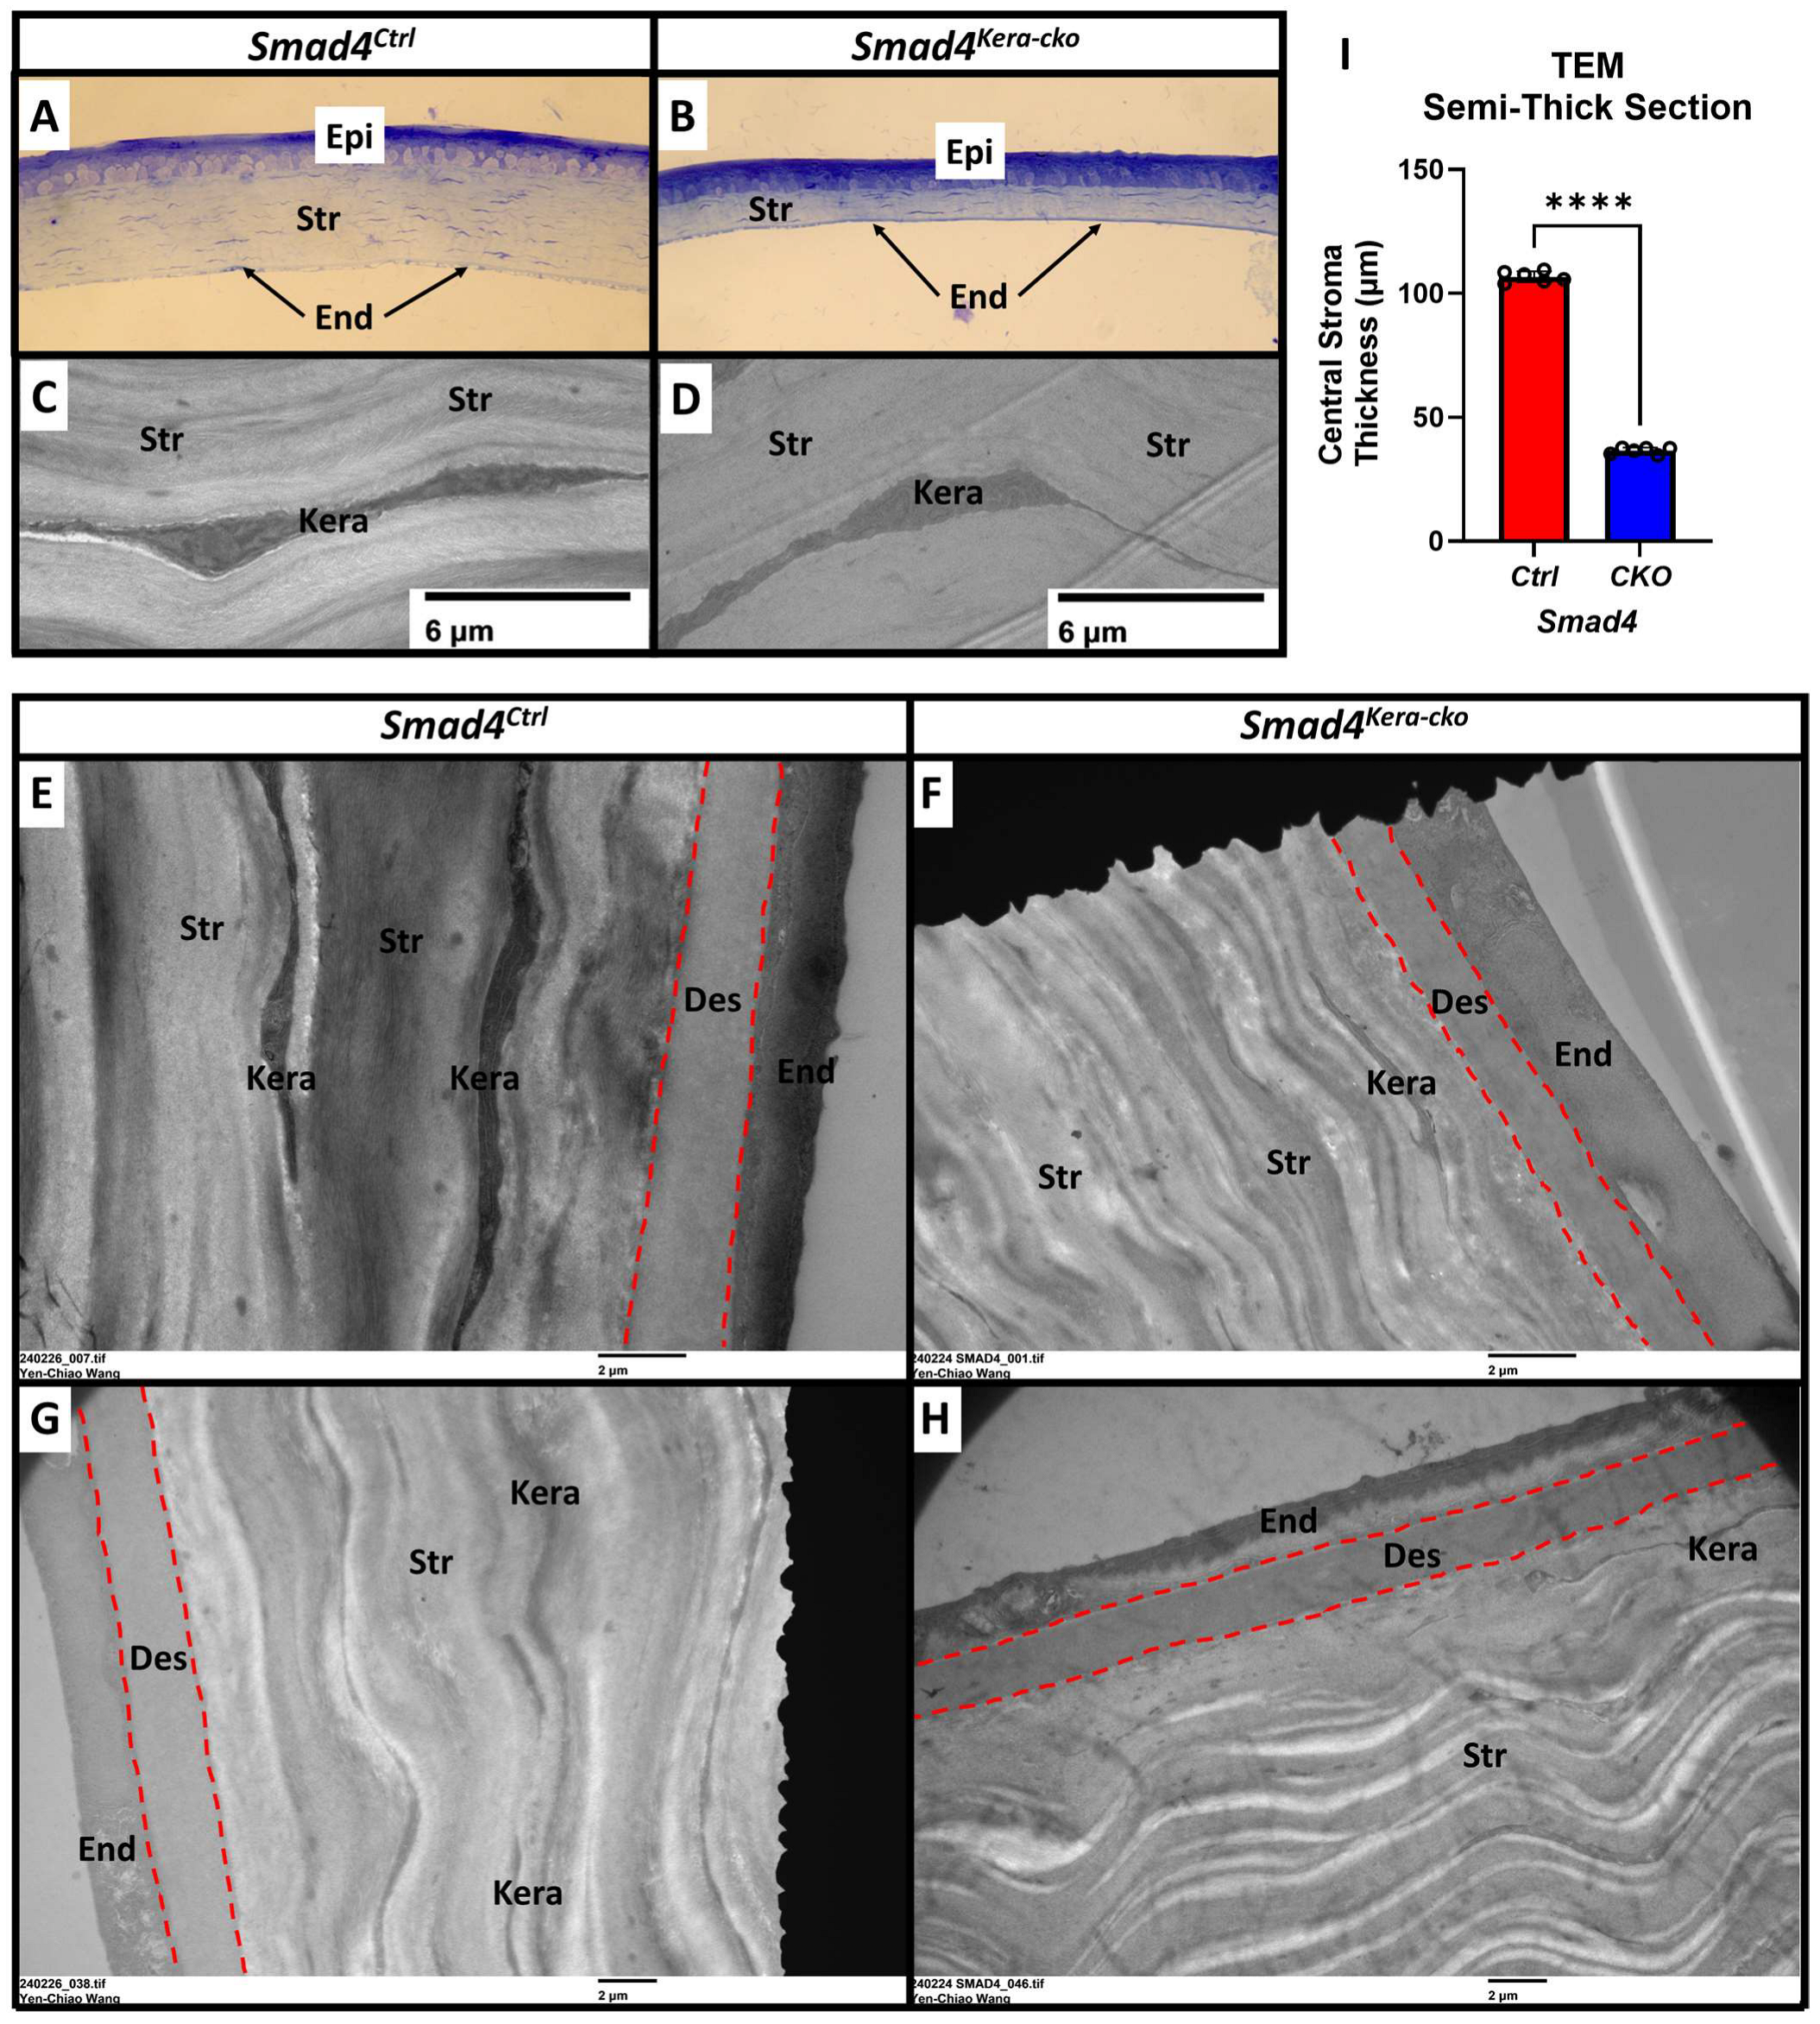
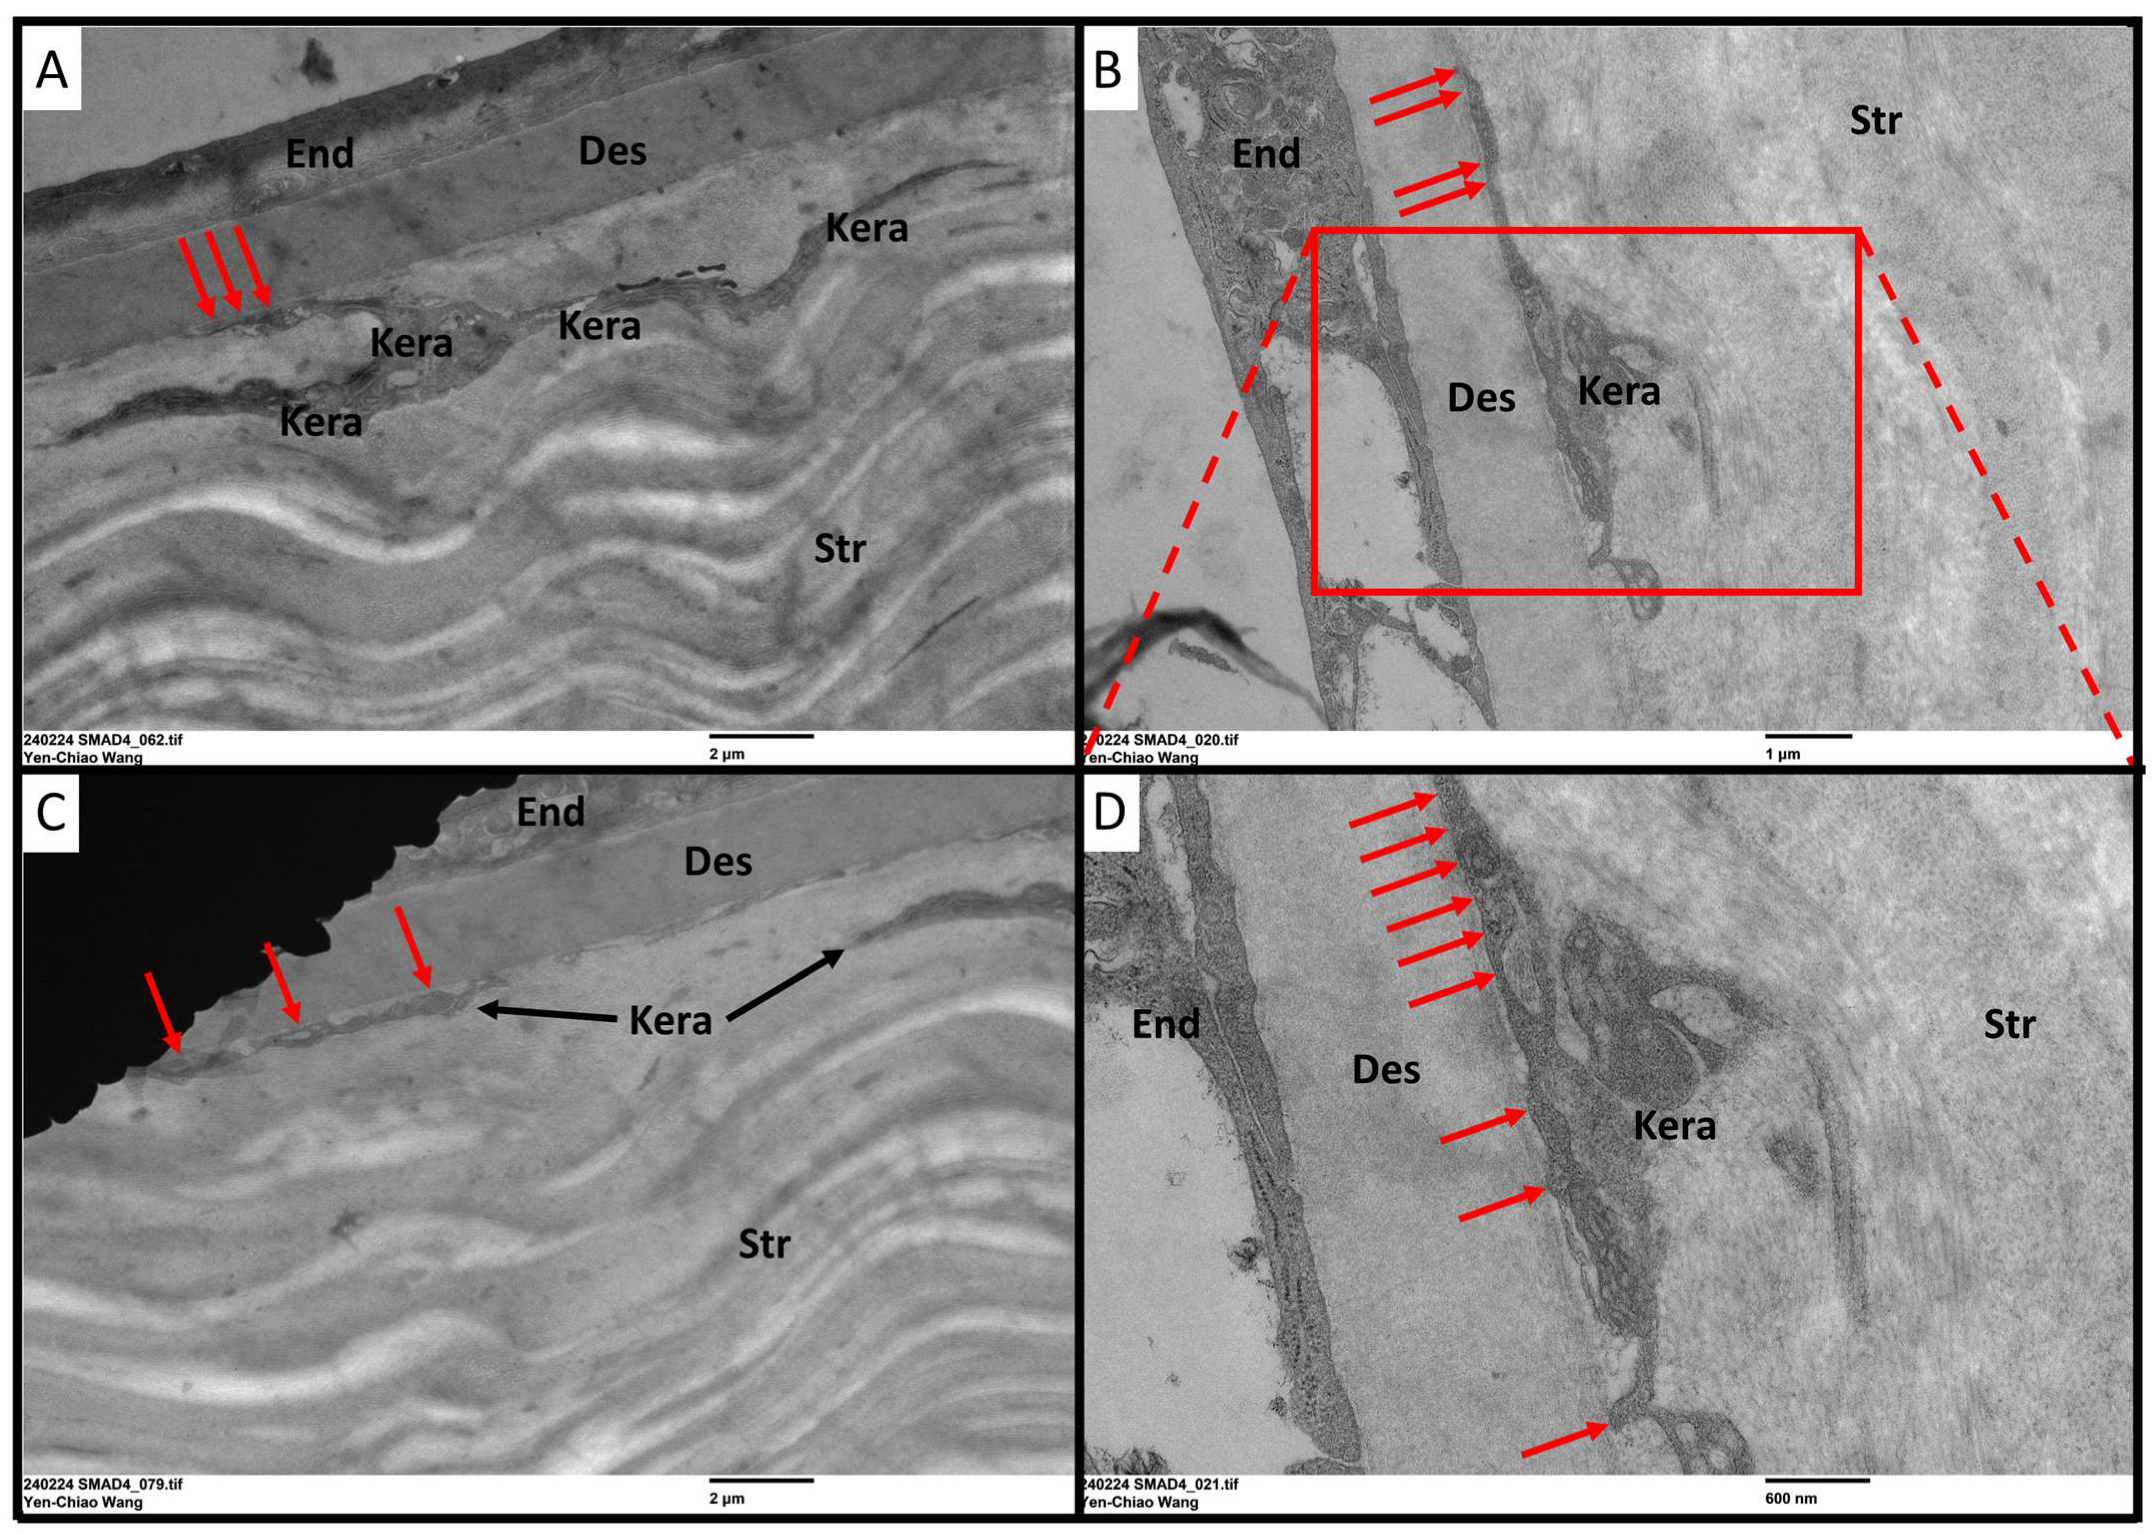
In this study, to test the homeostasis and the health of the Descemet’s membrane in the aspect of functional analysis in our current animal model, we applied the eye-rubbing experiment using the same strategy. Smad4kera-cko mice, unlike the Tgfbr2kera-cko mice, exhibited Acute Corneal Hydrops signs, although they also exhibited cornea thinning with a thinner corneal stroma, survived from the eye-rubbing experiment, which indicates that the Descemet’s membrane structure should remain intact. To confirm our hypothesis, we performed TEM to check the Descemet’s membrane and keratocyte situation. The TEM data revealed an intact and healthy Descemet’s membrane across the whole cornea and a normal keratocyte appearance in Smad4kera-cko, although they also exhibited pathological thinning in the corneal stroma (Figure 9A,B Str, I, 36.55 ± 0.53 μm vs. 106.72 ± 0.90 μm, n = 6, ****, p < 0.0001) using Toluidine blue staining (Figure 9A–H, Des in red dash line). However, a noticeable attachment of the keratocytes to the Descemet’s membrane was found in Smad4kera-cko (Figure 10A–D, red arrow). Furthermore, the keratocyte attached to the Descemet’s membrane exhibited irregular morphology (Figure 10A–D, Kera area) compared to the normal keratocytes, which usually have broad, fan-shaped lamellipodium (Figure 9C,D).
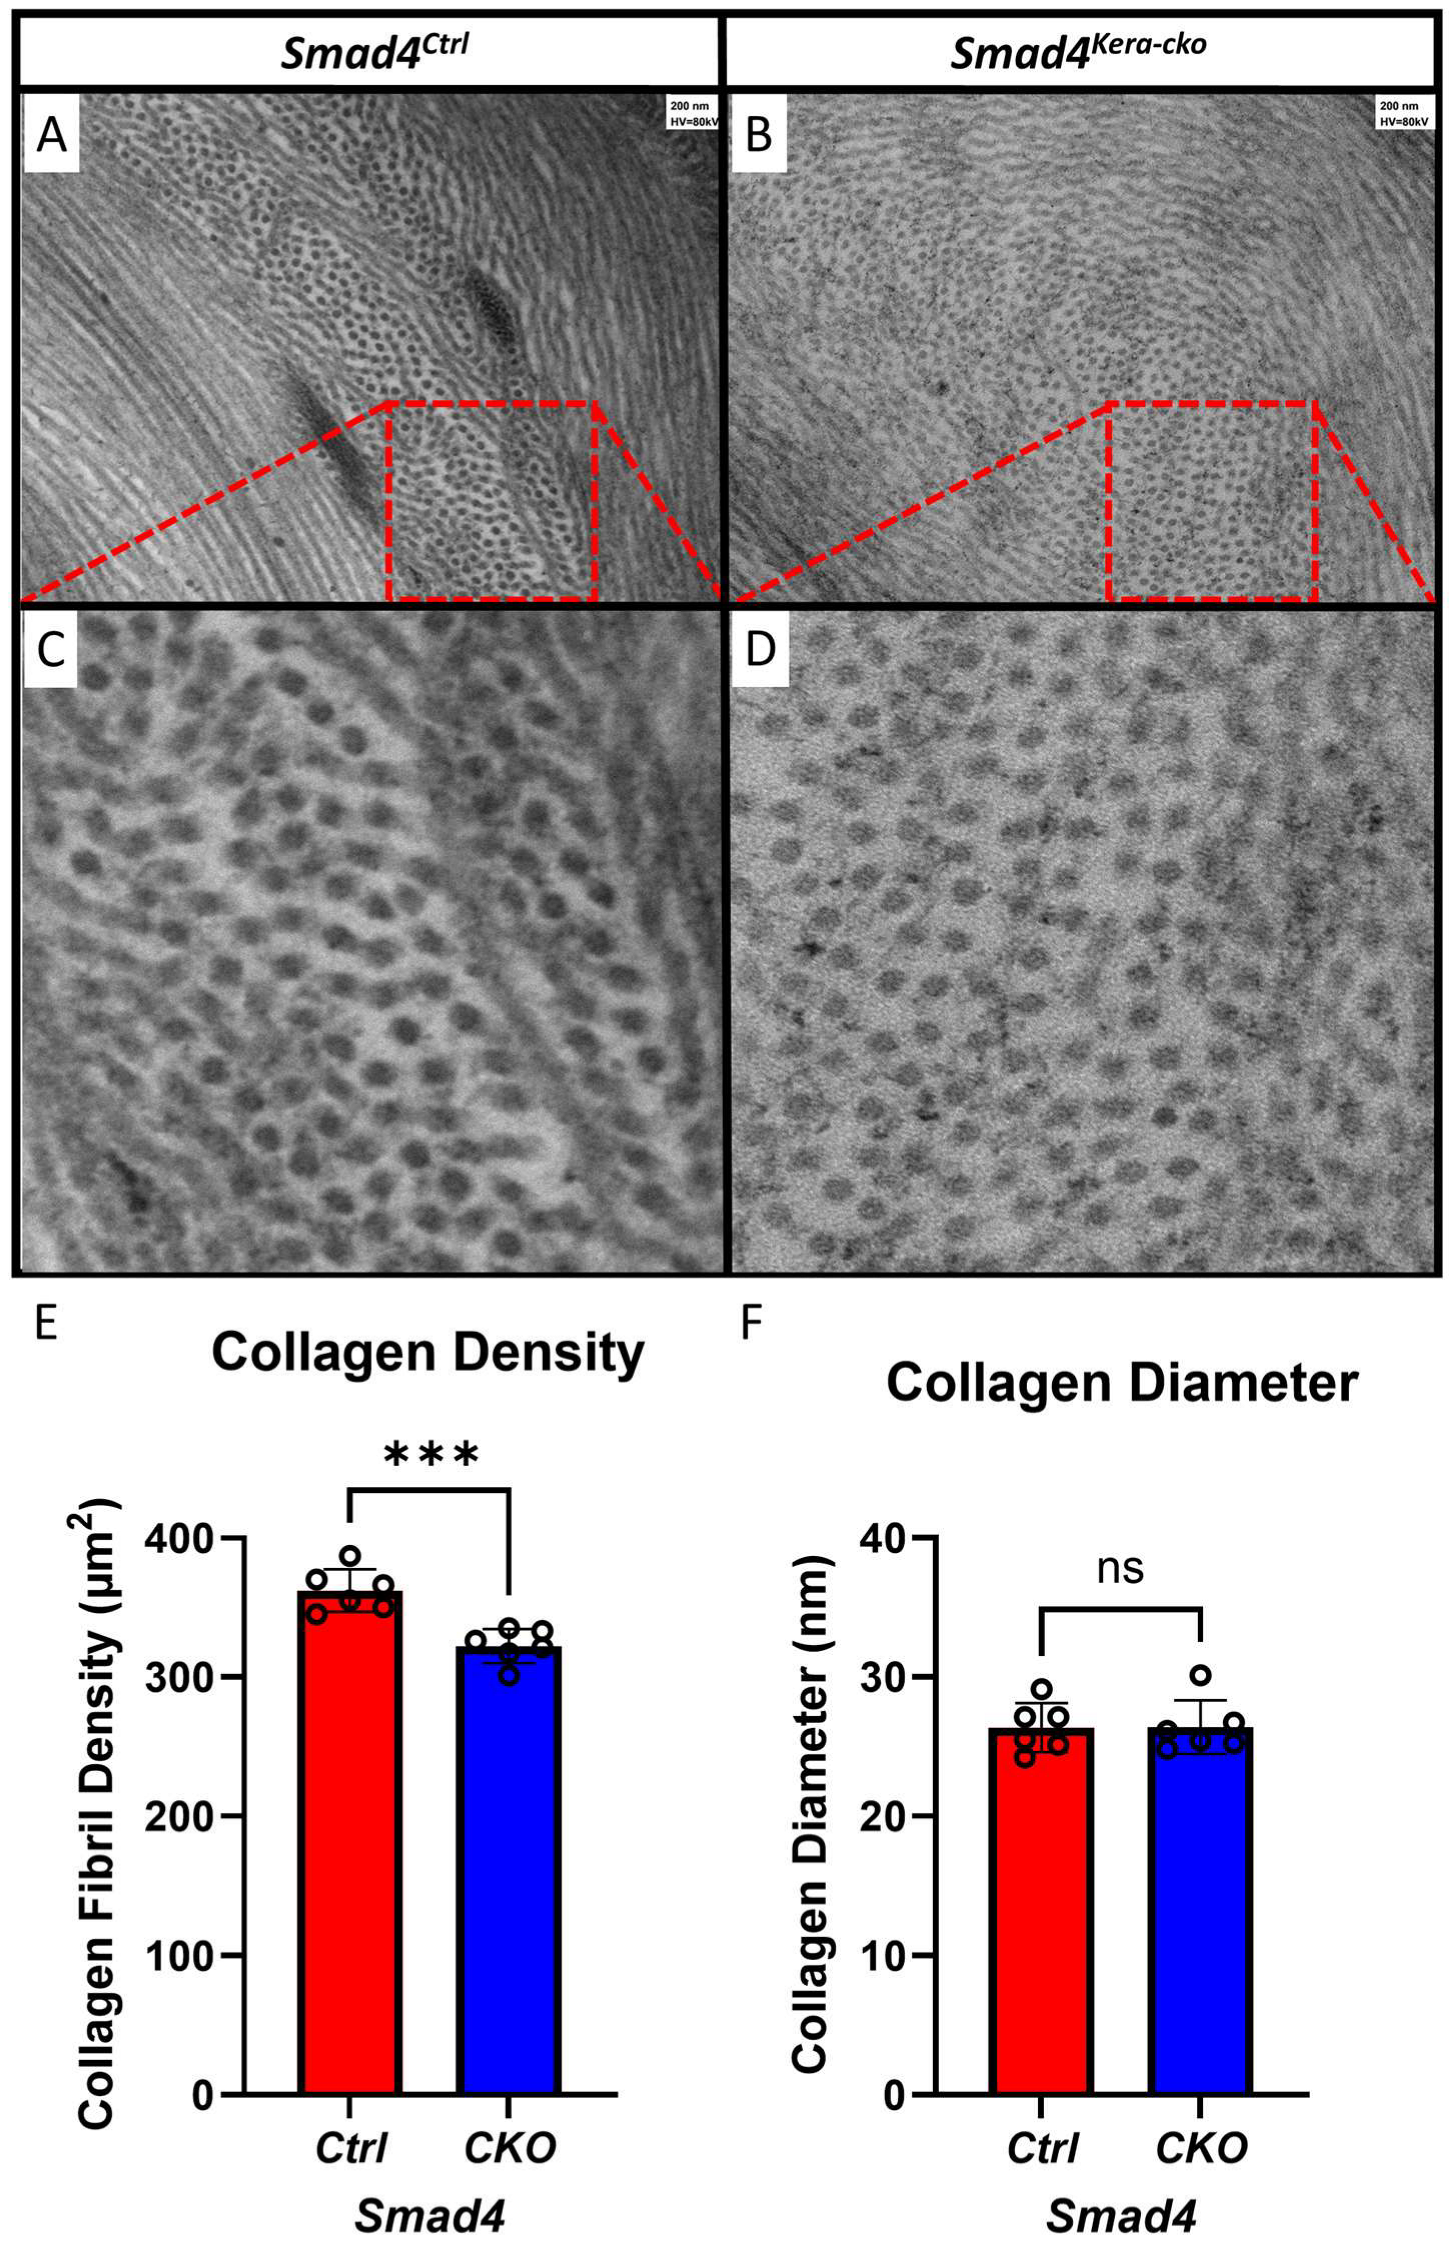
The different findings in the keratocytes and the Descemet’s membrane in the current animal model Smad4kera-cko might serve as an explanation for the clustering and disappearing of the keratocytes found in Tgfbr2kera-cko. Furthermore, the organization of the lamellae was maintained, and the diameters of collagen fibrils remained the same compared to the control group (Figure 11A–D,F), which indicates that although the SMAD4-dependent signaling pathway can contribute to the stroma thinning, the micro-environment in the corneal stroma remains relatively healthy and the structure is still in the proper orientation and provides enough stiffness against the eye-rubbing experiment. However, although the micro-environment is relatively healthy, the density of the collagen fiber showed a significant decrease in the stroma (Figure 11E).
3.6. OCE Revealed a Softer Cornea in Smad4kera-cko
To elucidate whether the corneas are softer in the Smad4kera-cko compared to those in Smad4Ctrl, we performed an OCE to examine the Wave Speed, Young’s Modulus, and the Viscosity. When we compared the Smad4kera-cko to Smad4Ctrl at 10 mmHg IOP (the normal mouse IOP), significant decreases were found in the Wave Speed (3.39 ± 0.82 vs. 2.78 ± 0.40 m/s), Young’s Modulus (2.21 ± 0.92 vs. 1.58 ± 0.59 MPa), and the Viscosity (2.06 ± 0.52 vs. 1.15 ± 0.29 Pa.s.), which indicates the corneas in Smad4kera-cko are softer than those in Smad4Ctrl.
4. Discussion
In clinics, although the treatments for CE patients, including Collagen Cross-Linking (CXL) and Intrastromal Corneal Ring Segments implantation (ICRS), can stop the progression of CE via increasing corneal biomechanical resistance and correct CE by shortening the cone length, respectively, in advanced CE, cornea transplant surgery is not avoidable for treating the extreme pathological cornea thinning and uncontrollable vision loss [23,24,25,26,27,28]. Herein, further elucidating the etiology and pathogenesis for improving the quality of medical treatment in the aspect of molecular biology, specifically the intracellular signaling pathway, becomes necessary to prevent and intervene in CE progression in clinics.
Our previous study indicated that the deficiency of TGFBR2 in the corneal stroma can result in cornea thinning characterized by pathological thinning of the corneal stroma accompanied by thickening of the corneal epithelium [10]. In this current study, we wanted to further investigate whether the SMAD4-dependent signaling is involved in the generation of the CE-like phenotype in the aspect of Loss-of Function, aiming to elucidate the role of collagen formation in our previous findings. Our data revealed certain similarities between Smad4kera-cko and Tgfbr2kera-cko at the diagnosis level, tissue level, and cellular level. Considering that the CCT found in the OCT showed no difference between Smad4kera-cko and Tgfbr2kera-cko and the ultra-pathological thinning found in the Smad4kera-cko toluidine blue staining (Figure 9A,B), a conclusion of the involvement of a compromised SMAD4-dependent signaling pathway in the pathogenesis of TGFBR2-deficiency related to the CE-like phenotype could be made.
However, the difference between the results of the eye-rubbing experiment and intact of Descemet’s membrane, as well as the healthy keratocyte in our TEM of the Smad4kera-cko mice, suggested the existence of another rationale and molecular mechanism behind the similarities in the diagnosis levels contributing to the Descemet’s membrane weakening and keratocyte surviving, which further explains why in the clinics, the progressions in CE patients vary with the similarities in the signs and symptoms when the event is triggered by genetic defects. Elucidating the molecular mechanism can give us insight to further classify the CE disorders and provide better targets for clinicians to intervene.
4.1. A Compromised SMAD4-Dependent Signaling Might Contributed to the TGFBR2-Deficiency Related CE-like Phenotype
The SMAD4-dependent signaling pathway serves as the canonical pathway of TGFB signaling and it plays an important role in the formation of collagen type 1, which is the major component in the corneal stroma. Our result from the Masson’s Trichrome staining helped us to visualize the collagen and revealed a substantial reduction in collagen formation in the corneal stroma of Smad4kera-cko and Tgfbr2kera-cko. Moreover, the collagen type 1 (Col1a1) immunostaining in the Smad4kera-cko further confirms the findings from Masson’s Trichrome and revealed a less abundant and discontinued Col1a1 immunostaining compared to that in the control group. The findings of the discontinued collagen type 1 staining also recapitulate the findings in our previous study in Tgfbr2kera-cko.
Other than the collagen formation, the TEM and OCE revealed a decrease in the collagen density and a decrease in the corneal stiffness, respectively. Considering that the iCare Tonolab did not show a decreased reading in the IOP in Smad4kera-cko, the real IOP under a softer cornea might be higher. An increased IOP and the decreased collagen density in the Smad4kera-cko might serve as the mechanisms of a CE-like phenotype generation at postnatal corneal development. Furthermore, in this study, Smad4kera-cko mice shared many similarities with Tgfbr2kera-cko mice in diagnosis, tissue, and cellular level, including cornea thinning companies with corneal epithelium thickening and pathological thinning of the corneal stroma, hypertrophy and hyperplasia in corneal epithelial cell and transparent cornea with normal IOP reading. Taking these findings together, the involvement of a compromised function of SMAD4-dependent signaling in the generation of the TGFBR2 deficiency-related CE-like phenotype is convincing.
4.2. SMAD4-Independent Signaling Might Play an Important Role in Keratocyte Surviving
In our previous study, the keratocyte in Tgfbr2kera-cko suffered from pathological changes characterized by a vacuole appearance [10]. However, the keratocyte in Smad4kera-cko did not exhibit the same pathological appearance, which indicates that the pathological changes in the keratocyte found in the Tgfbr2kera-cko mice were not directly generated by the SMAD4-dependent signaling pathway in the aspect of Loss-of-Function. TGFBR2 serves as the initiation component control of many downstream signaling pathways including the SMAD4-dependent pathway. Other than SMAD4-dependent signaling, SMAD4-independent is the other group of pathways triggering different signaling, including MAPK/ERK, Tak1 (Mitogen-activated protein kinase kinase kinase 7, MAP3K7), JNK (c-Jun N-terminal kinases) and PI3K [29,30,31,32]. While SMAD4-dependent signaling is in charge of collagen formation in the corneal stroma, SMAD4-independent signaling, on the other hand, plays an important role in the cell cycle, immune response, inflammation, cell growth, proliferation, differentiation, motility, survival, ER-stress regulation, and intracellular trafficking, respectively. Although the similarities shared among Smad4kera-cko, Tgfbr2kera-cko, and CE patients indicate the involvement of SMAD4-dependent signaling in the CE-like pathogenesis, the pathological appearance in the keratocyte of Tgfbr2kera-cko mice might result from the SMAD4-independent signaling pathway. In other words, SMAD4-independent signaling might play an important role in the keratocyte survival.
4.3. Pathological Changes in Keratocyte Might Serve as a Fundamental Background in the Pathogenesis of Advanced CE
Acute Corneal Hydrops, an uncommon complication of CE, involves corneal edema due to a sudden rupture in the Descemet’s membrane and can cause visual defects [33,34,35]. The occurrence of corneal hydrops is a sign of advanced CE, including keratoconus, keratoglobus, and PMD. Our previous study using Tgfbr2kera-cko mice showed that the corneal hydrops phenotype can be induced by eye-rubbing. However, the corneal hydrops phenotype cannot be recapitulated in this current study using Smad4kera-cko, which indicates the different conditions in the Descemet’s membrane between Tgfbr2kera-cko mice and Smad4kera-cko. Considering that SMAD4-dependent signaling is responsible for the collagen formation and the findings of the keratocytes attachments to Descemet’s membrane due to the ultra-pathological thinning of corneal stroma in Smad4kera-cko, the pathological changes in keratocytes and the elimination/absence of posterior keratocytes found in Tgfbr2kera-cko might serve as the fundamental background of ACH in advanced CE. The rationale could be that, due to the pathological thinning of the corneal stroma, some of the keratocytes start to attach to Descemet’s membrane and the following pathological changes in keratocytes might cause the cell death, which further impacts the health and structure of the Descemet’s membrane structure. Although the event is transient and hard to monitor in TEM, such a negative effect can provide a background for ACH happening when environmental factors such as eye-rubbing are involved.
5. Conclusions
In this study, we elucidated the involvement of the SMAD4-dependent signaling pathway in the aspect of Loss-of-Function, in which the corneal thinning phenotype can be recapitulated in Smad4kera-cko. However, the classic sign of advanced CE, called ACH, was missing in the current study, which indicates that the molecular mechanisms behind the keratocyte pathogenesis in these two animal models are not exactly the same. Furthermore, how the SMAD4-independent signaling is involved in the pathological changes in keratocytes remains unclear and needs further investigation. Although signaling pathways and molecular mechanisms are complicated due to the compensation and the interaction between different signaling pathways, conditional knockout animal models with different effect genes can give us an insight and possible explanation behind the phenotype and observation, which further provide more convincing criteria for clinics to categorize the disease with similar signs and symptoms.
Author Contributions
Conceptualization, Y.-C.W.; methodology, Y.-C.W. and C.-Y.L.; software, Y.-C.W.; validation, Y.-C.W., O.B.Z. and C.-Y.L.; formal analysis, Y.-C.W. and O.B.Z.; investigation, Y.-C.W.; resources, C.-Y.L.; data curation, Y.-C.W., O.B.Z. and C.-Y.L.; writing—original draft preparation, Y.-C.W.; writing—review and editing, O.B.Z. and C.-Y.L.; visualization, Y.-C.W.; supervision, Y.-C.W. and C.-Y.L.; project administration, Y.-C.W.; funding acquisition, Y.-C.W. and C.-Y.L. All authors have read and agreed to the published version of the manuscript.
Funding
This research was funded by NIH R01 EY29071 and NIH R01 EY31051.
Institutional Review Board Statement
The animal study protocol was approved by the Institutional Review Board of the Indiana University IACUC (protocol code PA-18-001 and date of approval is 9/2/2018)) and University of Cincinnati IACUC (protocol code 22-07-21-01 and date of approval is 9/2/2022).
Informed Consent Statement
Not applicable.
Data Availability Statement
Dataset available on request from the authors.
Acknowledgments
We thank Cincinnati Children’s Hospital for providing the TEM core facility for us to collect the TEM data. We thank Kirill Larin’s lab for providing the OCE for us to measure the corneal stiffness in our animal model.
Conflicts of Interest
The authors declare no conflict of interest.
References
- Gandhi, S.; Jain, S. The anatomy and physiology of cornea. In Keratoprostheses and Artificial Corneas: Fundamentals and Surgical Applications; Springer: Berlin/Heidelberg, Germany, 2014; pp. 19–25. [Google Scholar]
- Espana, E.M.; Birk, D.E. Composition, structure and function of the corneal stroma. Exp. Eye Res. 2020, 198, 108137. [Google Scholar] [CrossRef] [PubMed]
- Gould, D.; McLellan, G.J. BSAVA manual of canine and feline ophthalmology. BSAVA manual of canine and feline ophthalmology. 2014.
- Eghrari, A.O.; Riazuddin, S.A.; Gottsch, J.D. Overview of the cornea: Structure, function, and development. Prog. Mol. Biol. Transl. Sci. 2015, 134, 7–23. [Google Scholar] [PubMed]
- Zhang, L.; Anderson, M.C.; Liu, C.-Y. The role of corneal stroma: A potential nutritional source for the cornea. J. Nat. Sci. 2017, 3, e428. [Google Scholar] [PubMed]
- Yu, E.-M.; Ma, L.-L.; Ji, H.; Li, Z.-F.; Wang, G.-J.; Xie, J.; Yu, D.-G.; Kaneko, G.; Tian, J.-J.; Zhang, K.; et al. Smad4-dependent regulation of type I collagen expression in the muscle of grass carp fed with faba bean. Gene 2018, 685, 32–41. [Google Scholar] [CrossRef] [PubMed]
- Tsuchida, K.; Zhu, Y.; Siva, S.; Dunn, S.R.; Sharma, K. Role of Smad4 on TGF-β–induced extracellular matrix stimulation in mesangial cells. Kidney Int. 2003, 63, 2000–2009. [Google Scholar] [CrossRef] [PubMed]
- Tandon, A.; Tovey, J.C.; Sharma, A.; Gupta, R.; Mohan, R.R. Role of transforming growth factor Beta in corneal function, biology and pathology. Curr. Mol. Med. 2010, 10, 565–578. [Google Scholar] [PubMed]
- Romero-Jiménez, M.; Santodomingo-Rubido, J.; Wolffsohn, J.S. Keratoconus: A review. Contact Lens Anterior Eye 2010, 33, 157–166. [Google Scholar] [CrossRef] [PubMed]
- Wang, Y.-C.; Zolnik, O.B.; Yasuda, S.; Yeh, L.-K.; Yuan, Y.; Kao, W.; Saika, S.; Liu, C.-Y. Transforming growth factor beta receptor 2 (Tgfbr2) deficiency in keratocytes results in corneal ectasia. Ocul. Surf. 2023, 29, 557–565. [Google Scholar] [CrossRef] [PubMed]
- Iglesias, A.I.; Mishra, A.; Vitart, V.; Bykhovskaya, Y.; Höhn, R.; Springelkamp, H.; Cuellar-Partida, G.; Gharahkhani, P.; Bailey, J.N.C.; Willoughby, C.E.; et al. Cross-ancestry genome-wide association analysis of corneal thickness strengthens link between complex and Mendelian eye diseases. Nat. Commun. 2018, 9, 1864. [Google Scholar] [CrossRef]
- Priyadarsini, S.; McKay, T.B.; Sarker-Nag, A.; Karamichos, D. Keratoconus in vitro and the key players of the TGF-β pathway. Mol. Vis. 2015, 21, 577–588. [Google Scholar] [PubMed]
- Kabza, M.; Karolak, J.A.; Rydzanicz, M.; Szcześniak, M.W.; Nowak, D.M.; Ginter-Matuszewska, B.; Polakowski, P.; Ploski, R.; Szaflik, J.P.; Gajecka, M. Collagen synthesis disruption and downregulation of core elements of TGF-β, Hippo, and Wnt pathways in keratoconus corneas. Eur. J. Hum. Genet. 2017, 25, 582–590. [Google Scholar] [CrossRef] [PubMed]
- Massagué, J. TGFβ signalling in context. Nat. Rev. Mol. Cell Biol. 2012, 13, 616–630. [Google Scholar] [CrossRef] [PubMed]
- Wheeler, J.; Hauser, M.A.; Afshari, N.A.; Allingham, R.R.; Liu, Y. The genetics of keratoconus: A review. Microscopy 2012, (Suppl. S6), 001. [Google Scholar] [CrossRef]
- Clarke, D.C.; Liu, X. Decoding the quantitative nature of TGF-β/Smad signaling. Trends Cell Biol. 2008, 18, 430–442. [Google Scholar] [CrossRef] [PubMed]
- Costello, I.; A Biondi, C.; Taylor, J.M.; Bikoff, E.K.; Robertson, E.J. Smad4-dependent pathways control basement membrane deposition and endodermal cell migration at early stages of mouse development. BMC Dev. Biol. 2009, 9, 54. [Google Scholar] [CrossRef]
- Chen, Y.; Liu, X.; Liu, X.; Cui, L.; He, Z.; Gao, Z.; Liu, L.; Li, Z.; Wan, Z.; Yu, Z. Correlation between TGF-β2/3 promoter DNA methylation and Smad signaling during palatal fusion induced by 2,3,7,8-tetrachlorodibenzo-p-dioxin. Exp. Biol. Med. 2021, 246, 2019–2028. [Google Scholar] [CrossRef] [PubMed]
- Zhang, Y.; Kao, W.W.; Hayashi, Y.; Zhang, L.; Call, M.; Dong, F.; Yuan, Y.; Zhang, J.; Wang, Y.-C.; Yuka, O.; et al. Generation and characterization of a novel mouse line, keratocan-rtTA (KeraRT), for corneal stroma and tendon research. Investig. Ophthalmol. Vis. Sci. 2017, 58, 4800–4808. [Google Scholar] [CrossRef]
- Ambrósio, R.; Wilson, S.E. LASIK vs. LASEK vs. PRK: Advantages and indications. In Seminars in Ophthalmology; Taylor & Francis: Abingdon, UK, 2003. [Google Scholar]
- A Melki, S.; Azar, D.T. LASIK Complications: Etiology, Management, and Prevention. Surv. Ophthalmol. 2001, 46, 95–116. [Google Scholar] [CrossRef] [PubMed]
- Cortina, M.S.; de la Cruz, J. Keratoprostheses and artificial corneas. Fundam. Surg. Appl. 2015, 2015. [Google Scholar]
- Torquetti, L.; Ferrara, G.; Almeida, F.; Cunha, L.; Araujo, L.P.N.; Machado, A.P.; Lyra, J.M.; Merayo-Lloves, J.; Ferrara, P. Intrastromal Corneal Ring Segments Implantation in Patients with Keratoconus: 10-Year Follow-Up. J. Refract. Surg. 2014, 30, 22–26. [Google Scholar] [CrossRef] [PubMed]
- O’brart, D.P. Corneal collagen cross-linking: A review. J. Optom. 2014, 7, 113–124. [Google Scholar] [CrossRef] [PubMed]
- Adamiak, K.; Sionkowska, A. Current methods of collagen cross-linking: Review. Int. J. Biol. Macromol. 2020, 161, 550–560. [Google Scholar] [CrossRef] [PubMed]
- Roberts, C.J.; Dupps, W.J., Jr. Biomechanics of corneal ectasia and biomechanical treatments. J. Cataract Refract. Surg. 2014, 40, 991–998. [Google Scholar] [CrossRef] [PubMed]
- Ziaei, M.; Barsam, A.; Shamie, N.; Vroman, D.; Kim, T.; Donnenfeld, E.D.; Holland, E.J.; Kanellopoulos, J.; Mah, F.S.; Randleman, B.J.; et al. Reshaping procedures for the surgical management of corneal ectasia. J. Cataract. Refract. Surg. 2015, 41, 842–872. [Google Scholar] [CrossRef] [PubMed]
- Tan, D.T.; Por, Y.-M. Current treatment options for corneal ectasia. Curr. Opin. Ophthalmol. 2007, 18, 279–283. [Google Scholar] [CrossRef] [PubMed]
- Wang, C.; Deng, L.; Hong, M.; Akkaraju, G.R.; Inoue, J.; Chen, Z.J. TAK1 is a ubiquitin-dependent kinase of MKK and IKK. Nature 2001, 412, 346–351. [Google Scholar] [CrossRef] [PubMed]
- Sakurai, H. Targeting of TAK1 in inflammatory disorders and cancer. Trends Pharmacol. Sci. 2012, 33, 522–530. [Google Scholar] [CrossRef] [PubMed]
- Sato, S.; Sanjo, H.; Takeda, K.; Ninomiya-Tsuji, J.; Yamamoto, M.; Kawai, T.; Matsumoto, K.; Takeuchi, O.; Akira, S. Essential function for the kinase TAK1 in innate and adaptive immune responses. Nat. Immunol. 2005, 6, 1087–1095. [Google Scholar] [CrossRef] [PubMed]
- Mihaly, S.R.; Ninomiya-Tsuji, J.; Morioka, S. TAK1 control of cell death. Cell Death Differ. 2014, 21, 1667–1676. [Google Scholar] [CrossRef] [PubMed]
- Barsam, A.; Petrushkin, H.; Brennan, N.; Bunce, C.; Xing, W.; Foot, B.; Tuft, S. Acute corneal hydrops in keratoconus: A national prospective study of incidence and management. Eye 2015, 29, 469–474. [Google Scholar] [CrossRef] [PubMed]
- Sharma, N.; Maharana, P.K.; Jhanji, V.; Vajpayee, R.B. Management of acute corneal hydrops in ectatic corneal disorders. Curr. Opin. Ophthalmol. 2012, 23, 317–323. [Google Scholar] [CrossRef] [PubMed]
- Tuft, S.J.; Gregory, W.M.; Buckley, R.J. Acute Corneal Hydrops in Keratoconus. Ophthalmology 1994, 101, 1738–1744. [Google Scholar] [CrossRef] [PubMed]
Figure 1.
Smad4kera-cko revealed corneal thinning phenotype similar to those in Tgfbr2kera-cko. (A) Schematic drawing of Smad4 deletion in KerartTA; TetO-Cre; Smad4flox/flox mouse line. The rtTA is constitutively synthesized from KerartTA alleles in keratocytes but remains in an inactive form. Upon binding of doxycycline (dox) to rtTA, the dox-rtTA complex transcriptionally activates Tet-O-Cre and produces Cre recombinase, which then subsequently splices loxP sites and flank the exon 8. (B–G) OCT revealed thinner corneas in Smad4kera-cko and Tgfbr2kera-cko compared to those in the control group respectively at P42 (n = 6, ****, p < 0.0001). (C,E,H) However, the Central Corneal Thickness of Smad4kera-cko corneas showed no significant difference compared to those in Tgfbr2kera-cko (n = 6, ns). Abbreviation: ns, not significant.

Figure 2.
Smad4kera-cko revealed a larger cornea with enlarged Anterior Chamber under normal IOP reading. (A,D) Cornea Radius measurement indicating significance difference between Smad4kera-cko and Smad4Ctrl at P42 (n = 6, ****, p < 0.0001). (A–C) Anterior chamber measurement using the distance between lens and cornea showed longer distances in Smad4kera-cko compared to those in Smad4Ctrl (n = 6, *, p = 0.0133). (E) IOP measurement using iCare Tonolab exhibited no significant difference between Smad4kera-cko and Smad4Ctrl (n = 6, ns). Abbreviation: ns, not significant.

Figure 3.
Stereo microscope indicating expanded corneas with abnormal light reflection in Smad4kera-cko. (A–D) The abnormal reflection (red arrow for the concave and green arrow for the convex) indicates the irregular corneal surface in Smad4kera-cko compared to those in Smad4Ctrl, which can cause decreased Visual Precision (VP) due to the irregular light refractions. (E–K) Corneal expanding measurement showed significant all-direction expansions in Smad4kera-cko by measuring the distance between two light sources and the X-axis and Y-axis within the light sources (the colors in the chart are consistence with the colors in the measuring lines, n = 6, ****, p < 0.0001). (L) Schematic drawing of the measuring rationale (the red line indicates the ectatic cornea with early reflection of the light paths, which results in a larger distance between two reflections of light sources, and the black cornea represents the normal cornea with a shorter distance between two light reflections).

Figure 4.
SMAD4 Immunofluorescent staining in Smad4Ctrl and Smad4kera-cko. (A,C,D,F) SMAD4 immunostaining (green) showed that the SMAD4 expression can be detected in both Smad4Ctrl and Smad4kera-cko corneal epithelium (Epi) (A,D) but can only be detected in Smad4Ctrl corneal stroma (A, Str, red arrow) and cannot be detected in Smad4kera-cko stroma (D, Str) due to the conditional knockout of Smad4 in keratocyte. (B,D) DAPI immunostaining (blue) revealed the location of the nucleus of keratocyte in the corneal stroma (B,E, Str, yellow arrow) and the locations are mostly consistent with the positive immunostaining of SMAD4 in the Smad4Ctrl (A–C). The reason why some of the SMAD4 immunostaining cannot have the corresponding DAPI immunostaining in stroma and epithelium is that the DAPI only shows where the nucleus is at but the SMAD4 usually stays in the cytoplasm. Considering that the thickness of our sectioning is 5 μm (the dimension of a normal corneal keratocytes is usually over 5 μm and the base diameter of normal corneal epithelial basal cell is around 4–8 μm), the positive SMAD4 immunostaining should be around, overlap or close to the nucleus in both corneal stroma and epithelium. However, if the sectioning only cuts through the cytoplasm and barely touches the nucleus, then we can only have the positive SMAD4 immunostaining without DAPI, and vice versa. Abbreviations: Epi, corneal epithelium; Str, corneal stroma; End, corneal endothelium.

Figure 5.
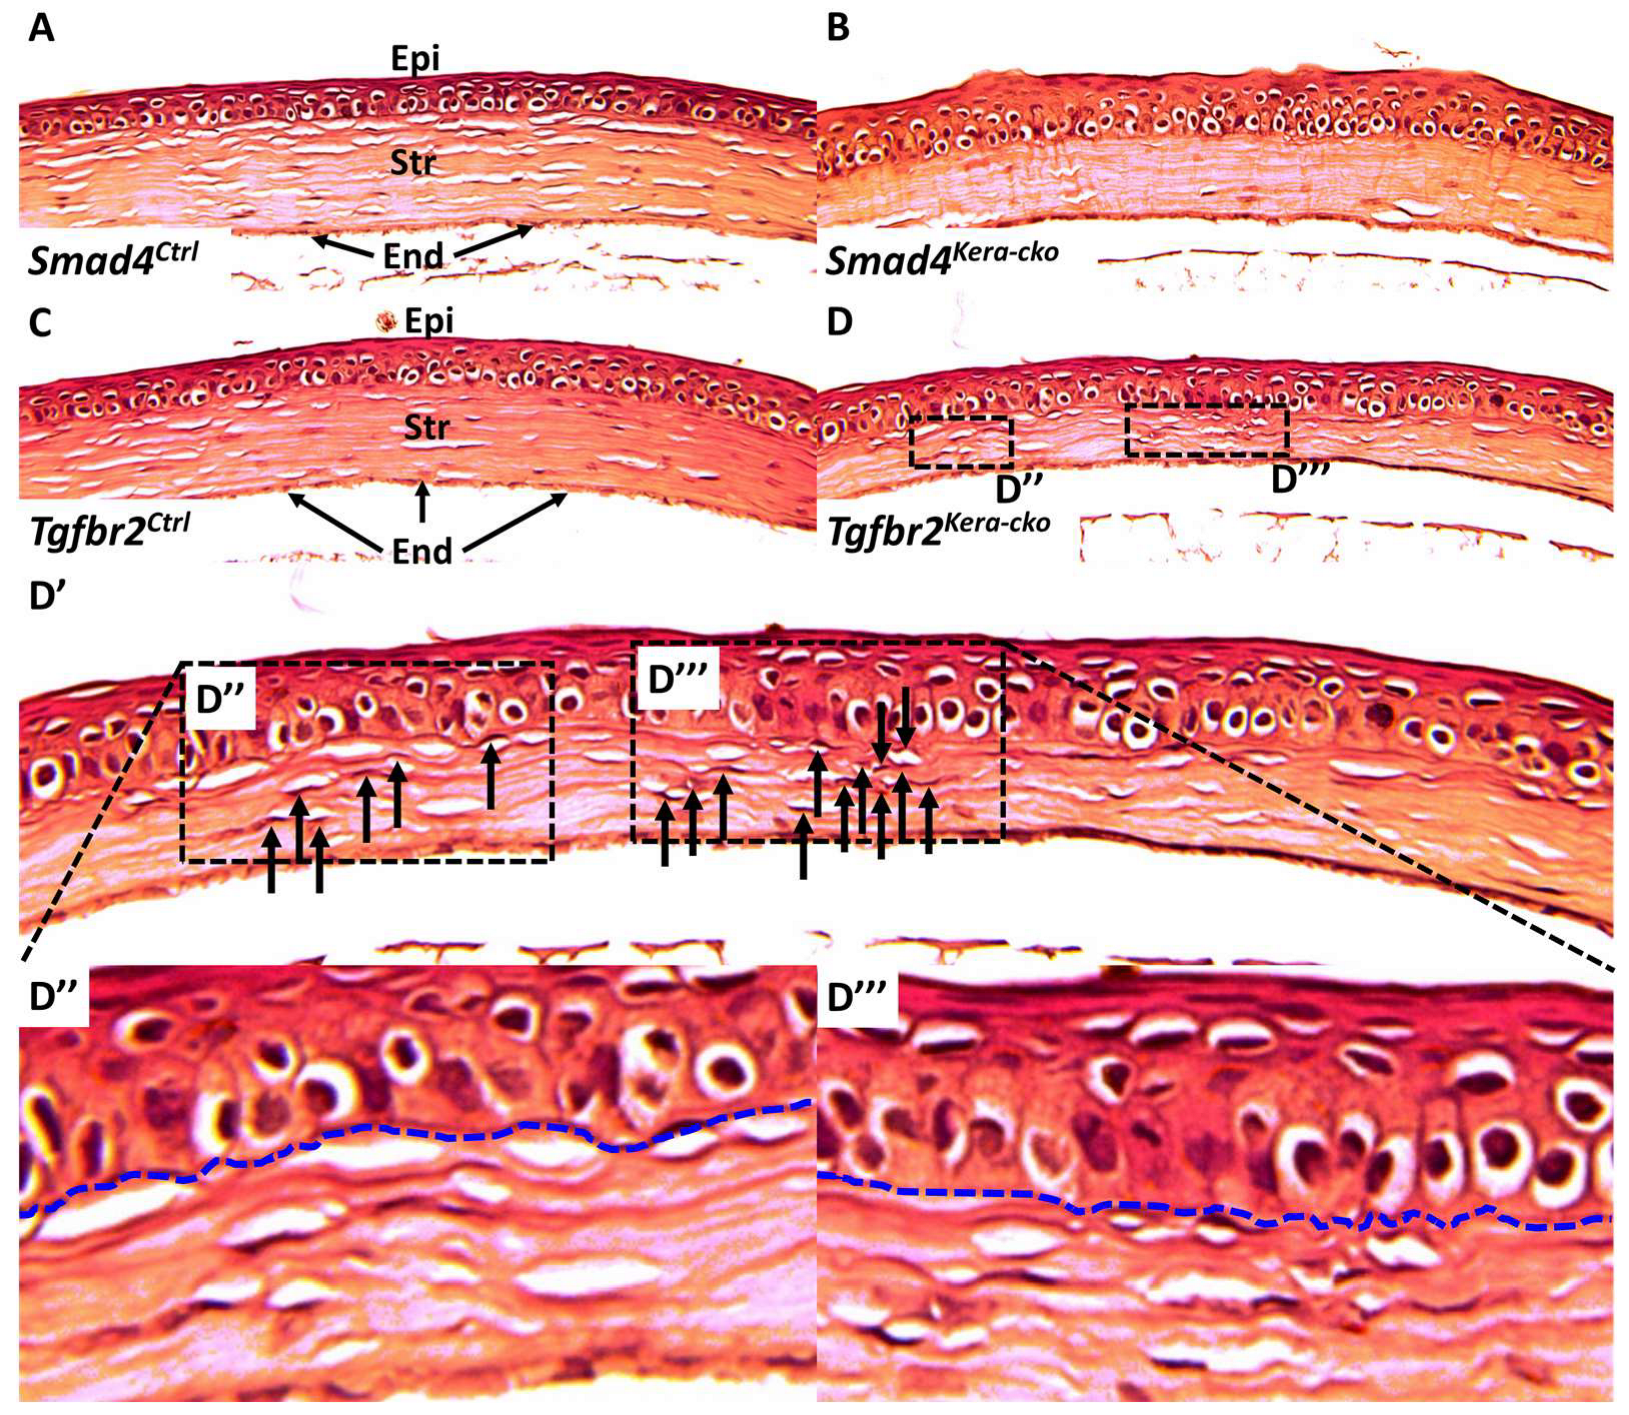
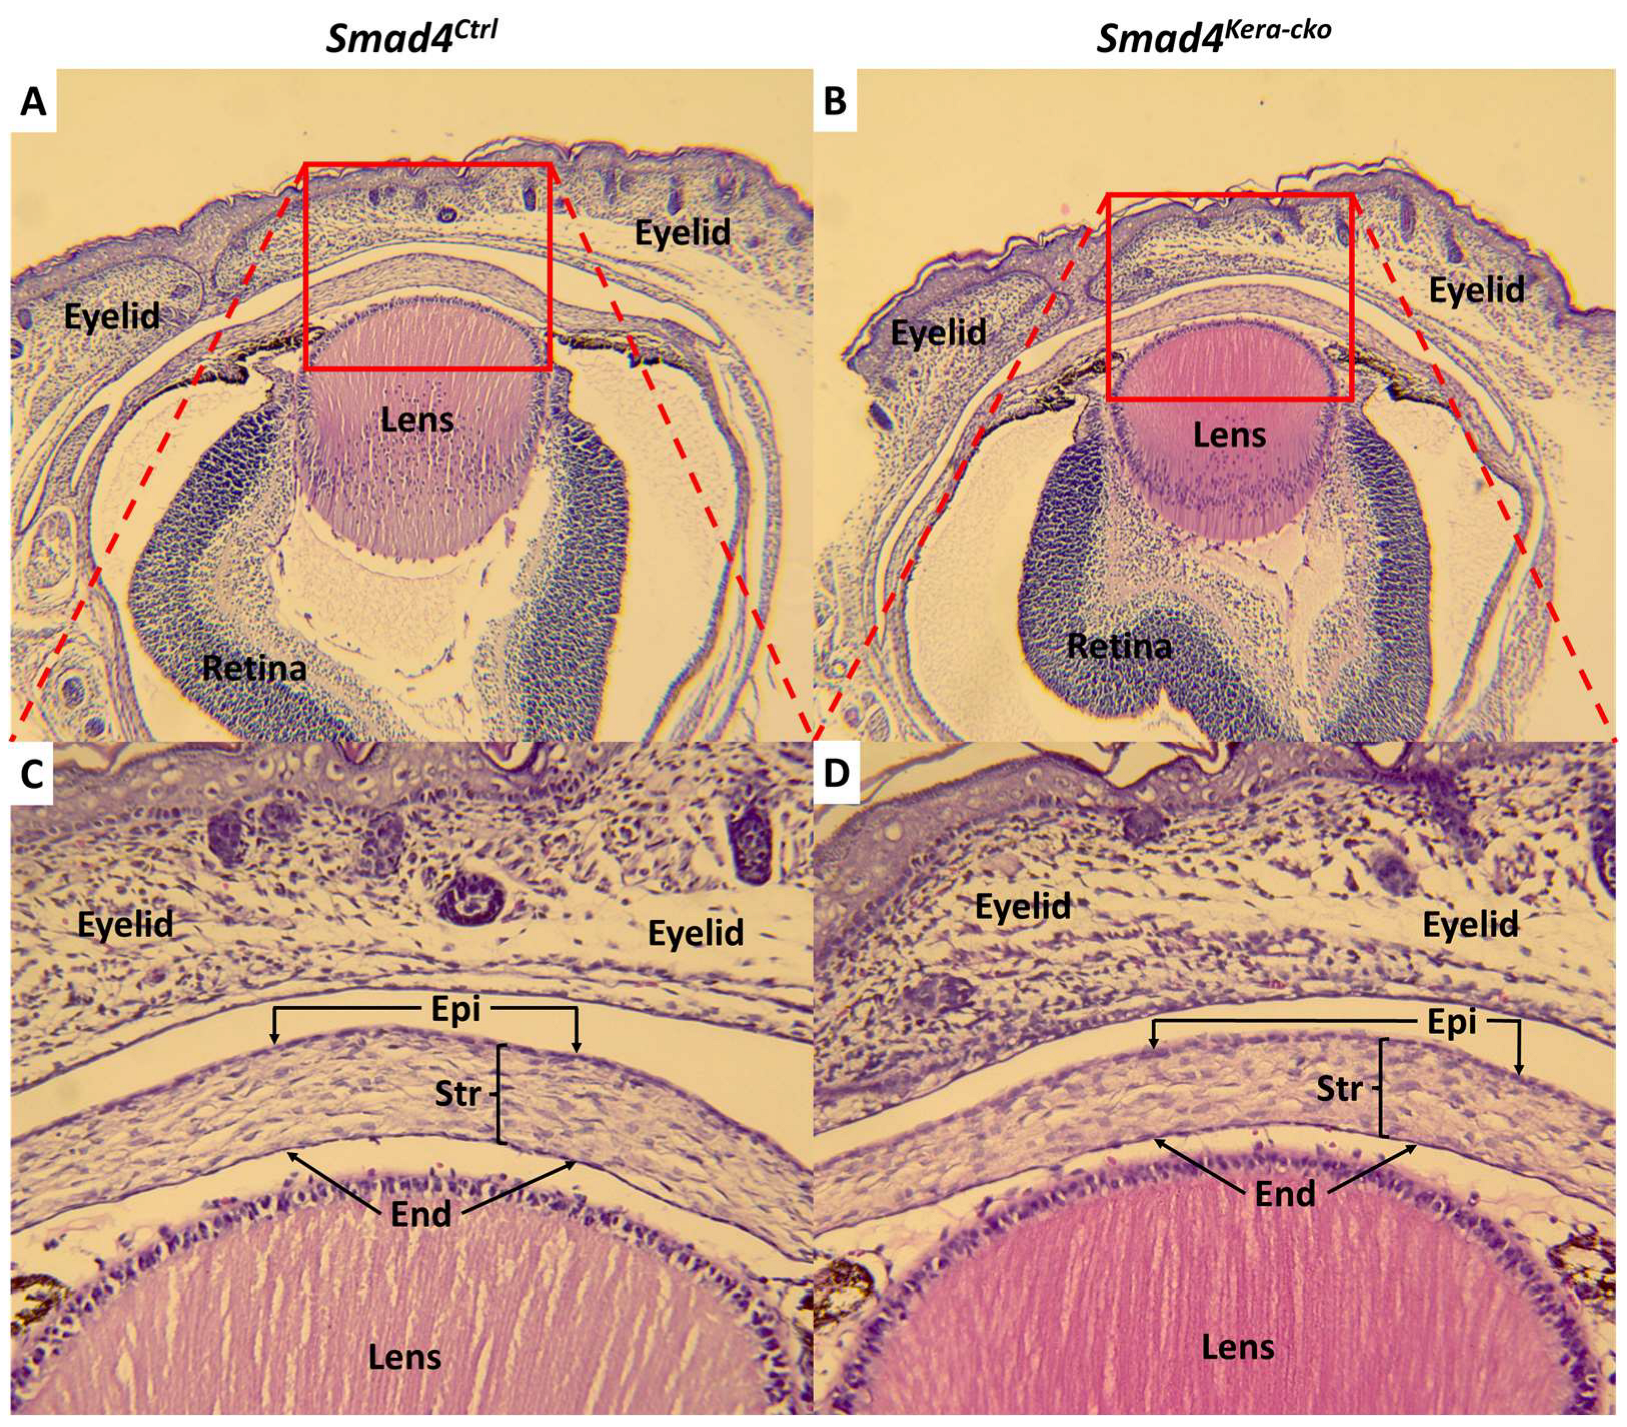
H&E staining in Smad4 and Tgfbr2 mouse lines. (A,C) HE-staining revealed the normal cornea in control groups including the normal ratio of corneal epithelium (Epi) and stroma (Str) and the normal distribution of keratocytes in the corneal stroma. (B,D) Both Smad4kera-cko and Tgfbr2kera-cko exhibited overall corneal thinning with thinner corneal stroma and thicker corneal epithelium characterized by hypertrophy in the basal cell. (A–D) The distribution of keratocytes in the Smad4kera-cko remains normal and even compared to those in Smad4Ctrl (A,B). However, the cluster and gathering of keratocytes can be noticed in the Tgfbr2kera-cko (D, D′ dashed square) compared to those in Tgfbr2Ctrl, Smad4Ctrl, and Smad4kera-cko. The uneven distribution of keratocytes in Tgfbr2kera-cko recapitulates the findings in our previous study. Furthermore, the irregular interfaces between the corneal epithelium and corneal stroma can be found in the Tgfbr2kera-cko and correspond to the keratocyte gathering (D′,D″,D‴, blue dash). (D‴) The severe gathering of the keratocytes (12 keratocytes (black arrows) can be found on the right side of D‴ and 6 keratocytes (black arrow) in the left side of D″) can also be found to correspond to the concave inward to the interface between corneal epithelium and corneal stroma (D″,D‴). Compared to Tgfbr2kera-cko, the interfaces are smooth in the Smad4Ctrl, Tgfbr2Ctrl, and Smad4kera-cko (A–C). Abbreviations: Epi, epithelium; Str, stroma; End, endothelium.
Figure 5.
H&E staining in Smad4 and Tgfbr2 mouse lines. (A,C) HE-staining revealed the normal cornea in control groups including the normal ratio of corneal epithelium (Epi) and stroma (Str) and the normal distribution of keratocytes in the corneal stroma. (B,D) Both Smad4kera-cko and Tgfbr2kera-cko exhibited overall corneal thinning with thinner corneal stroma and thicker corneal epithelium characterized by hypertrophy in the basal cell. (A–D) The distribution of keratocytes in the Smad4kera-cko remains normal and even compared to those in Smad4Ctrl (A,B). However, the cluster and gathering of keratocytes can be noticed in the Tgfbr2kera-cko (D, D′ dashed square) compared to those in Tgfbr2Ctrl, Smad4Ctrl, and Smad4kera-cko. The uneven distribution of keratocytes in Tgfbr2kera-cko recapitulates the findings in our previous study. Furthermore, the irregular interfaces between the corneal epithelium and corneal stroma can be found in the Tgfbr2kera-cko and correspond to the keratocyte gathering (D′,D″,D‴, blue dash). (D‴) The severe gathering of the keratocytes (12 keratocytes (black arrows) can be found on the right side of D‴ and 6 keratocytes (black arrow) in the left side of D″) can also be found to correspond to the concave inward to the interface between corneal epithelium and corneal stroma (D″,D‴). Compared to Tgfbr2kera-cko, the interfaces are smooth in the Smad4Ctrl, Tgfbr2Ctrl, and Smad4kera-cko (A–C). Abbreviations: Epi, epithelium; Str, stroma; End, endothelium.

Figure 6.
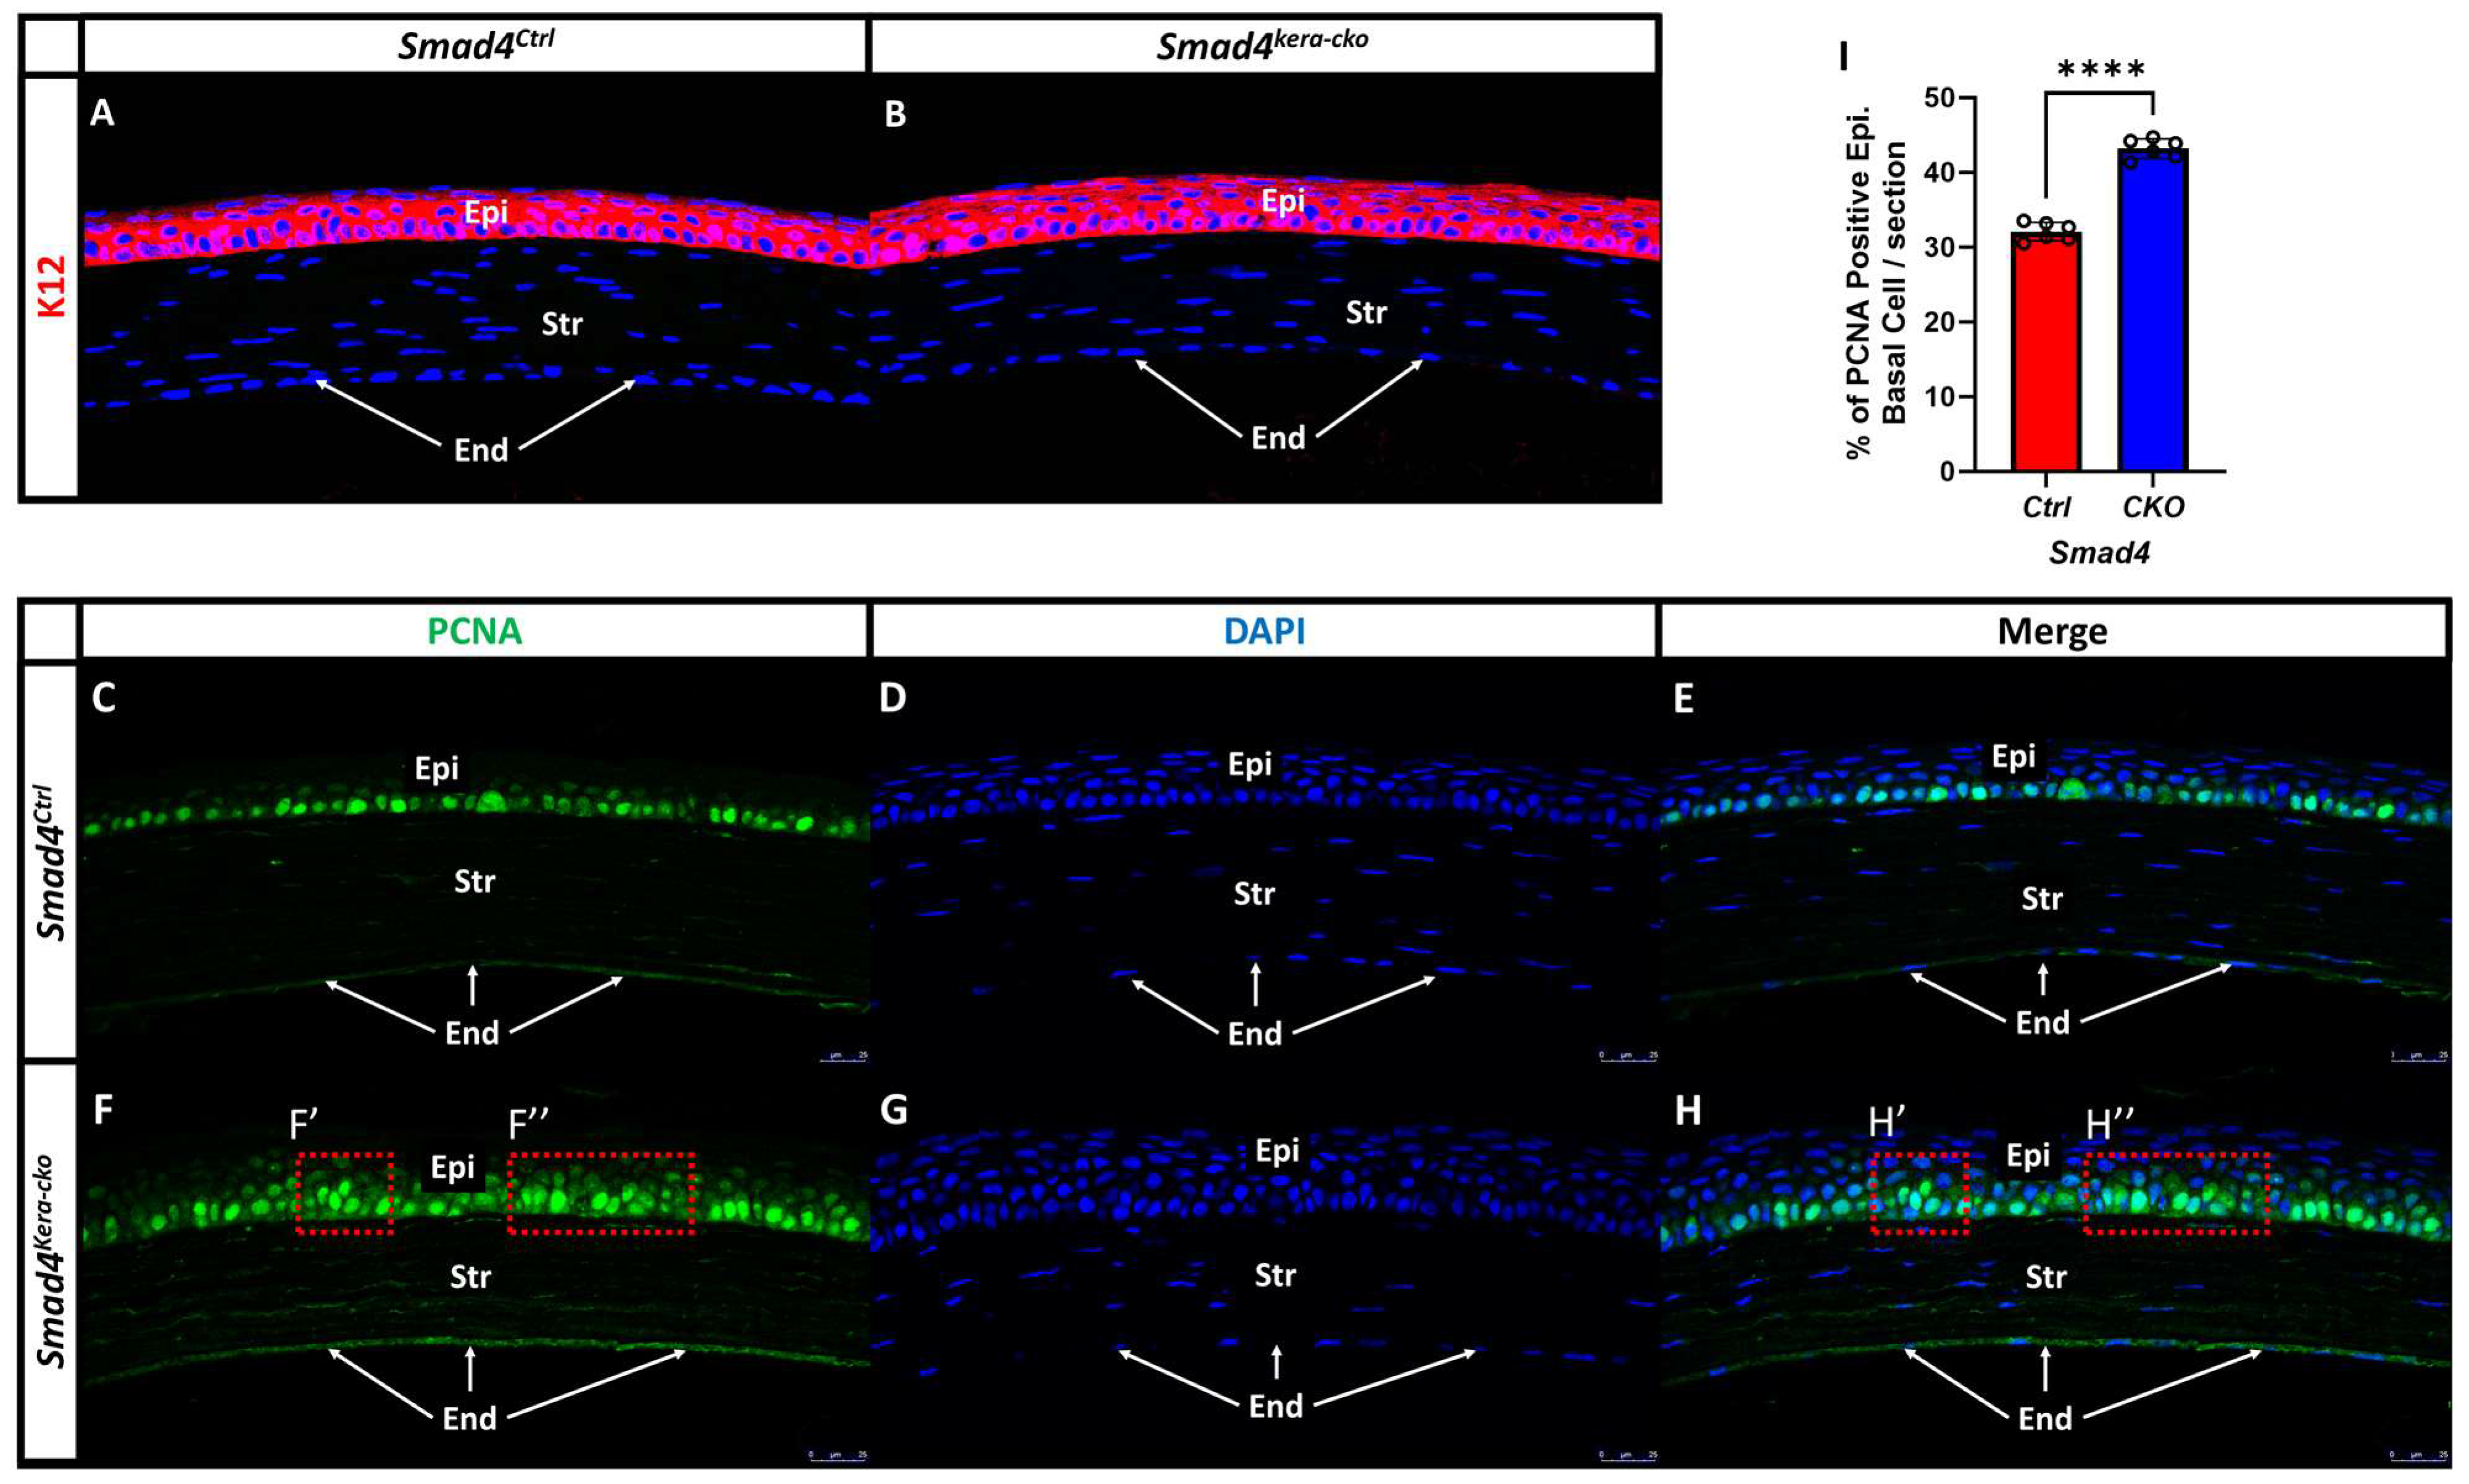
PCNA and K12 Immunofluorescent staining in Smad4Ctrl and Smad4kera-cko. (A,B) Corneal epithelial specific marker K12 remains unchanged in Smad4kera-cko compared to Smad4Ctrl. (C,E,F,H) Proliferating Cell Nuclear Antigen (PCNA) immunostaining (green) showed that the basal cell of corneal epithelium (Epi) underwent DNA replication and proliferation in both Smad4kera-cko and Smad4Ctrl (C,F). However, in the Smad4kera-cko, a significant increase of positive PCNA immunostaining can be noticed (43.17 ± 0.54%) compared to Smad4Ctrl (32.07 ± 0.50%) (n = 6, ****, p < 0.0001) (I) and some of the positive immunostaining can be found in the second and third layer of corneal epithelium which is where the Wing Cell at (F′,F″,H′,H″). (D,G) DAPI immunostaining (blue) revealed the location of the nucleus of epithelial cell in the corneal epithelium and the locations are mostly consistent with the positive immunostaining of PCNA in the Smad4Ctrl and Smad4kera-cko (C–H). The reason why some of the PCNA immunostaining is weaker and cannot have the 100% corresponding DAPI immunostaining in the epithelium is that the thickness of our sectioning is 5 μm (the base diameter of normal corneal epithelial basal cell is around 4–8 μm but the corneal epithelial cell in Smad4kera-cko showed hypertrophy pathological changes which can cause a substantial increase in diameter of the epithelial basal cell and can over 5 μm), the positive PCNA immunostaining sometimes is overlap or close to another nucleus. However, if the sectioning of the particular area in the figure only contains one epithelial cell and barely touches multiple cell nuclei, then we can have a positive PCNA immunostaining with sharp nucleus boundaries and the PCNA immunostaining can overlap with nucleus DAPI immunostaining staining perfectly, and vice versa. Abbreviations: Epi, corneal epithelium; Str, corneal stroma; End, corneal endothelium.
Figure 6.
PCNA and K12 Immunofluorescent staining in Smad4Ctrl and Smad4kera-cko. (A,B) Corneal epithelial specific marker K12 remains unchanged in Smad4kera-cko compared to Smad4Ctrl. (C,E,F,H) Proliferating Cell Nuclear Antigen (PCNA) immunostaining (green) showed that the basal cell of corneal epithelium (Epi) underwent DNA replication and proliferation in both Smad4kera-cko and Smad4Ctrl (C,F). However, in the Smad4kera-cko, a significant increase of positive PCNA immunostaining can be noticed (43.17 ± 0.54%) compared to Smad4Ctrl (32.07 ± 0.50%) (n = 6, ****, p < 0.0001) (I) and some of the positive immunostaining can be found in the second and third layer of corneal epithelium which is where the Wing Cell at (F′,F″,H′,H″). (D,G) DAPI immunostaining (blue) revealed the location of the nucleus of epithelial cell in the corneal epithelium and the locations are mostly consistent with the positive immunostaining of PCNA in the Smad4Ctrl and Smad4kera-cko (C–H). The reason why some of the PCNA immunostaining is weaker and cannot have the 100% corresponding DAPI immunostaining in the epithelium is that the thickness of our sectioning is 5 μm (the base diameter of normal corneal epithelial basal cell is around 4–8 μm but the corneal epithelial cell in Smad4kera-cko showed hypertrophy pathological changes which can cause a substantial increase in diameter of the epithelial basal cell and can over 5 μm), the positive PCNA immunostaining sometimes is overlap or close to another nucleus. However, if the sectioning of the particular area in the figure only contains one epithelial cell and barely touches multiple cell nuclei, then we can have a positive PCNA immunostaining with sharp nucleus boundaries and the PCNA immunostaining can overlap with nucleus DAPI immunostaining staining perfectly, and vice versa. Abbreviations: Epi, corneal epithelium; Str, corneal stroma; End, corneal endothelium.

Figure 7.
H&E staining at postnatal day 1 in Smad4 mouse line. The dox was given at embryonic day 0 and the eyeballs were collected at postnatal day 1 (between postnatal 0 h to 24 h) (A,B) HE-staining revealed the normal development of eyeball including the good formation of the corneal epithelium (Epi), endothelium (End) and stroma (Str) (C,D) and the normal distribution of keratocyte in corneal stroma in both Smad4Ctrl and Smad4kera-cko. Abbreviations: Epi, epithelium; Str, stroma; End, endothelium.

Figure 8.
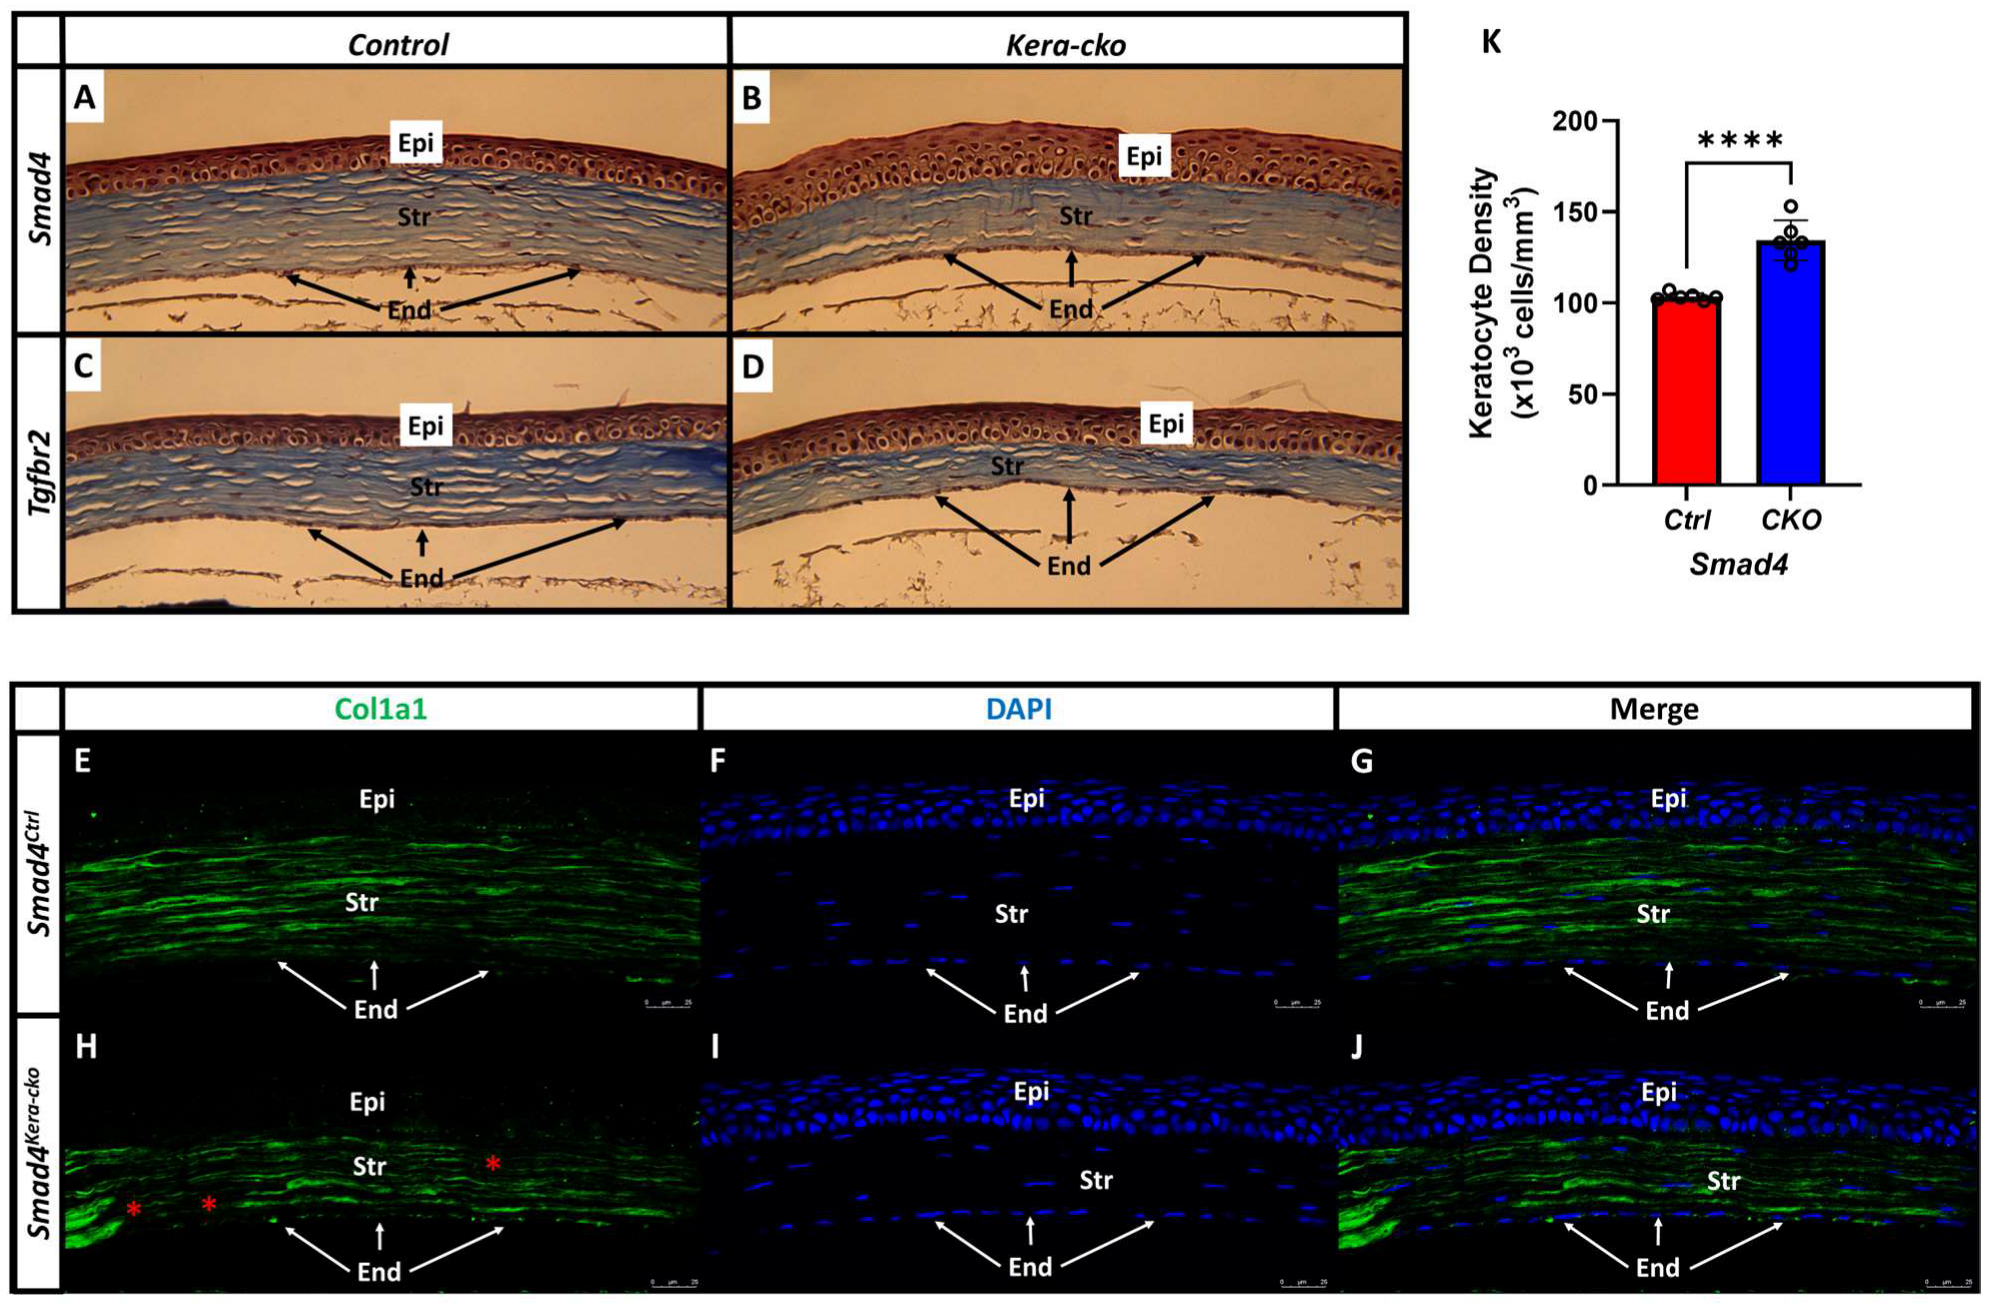
Collagen type 1 formation is less abundant in Smad4kera-cko and Tgfbr2kera-cko. (A,C) Trichrome staining revealed a normal cornea in control groups including the normal ratio between corneal epithelium (Epi) and stroma (Str) and the normal distribution of keratocytes in the corneal stroma. (B,D) Both Smad4kera-cko and Tgfbr2kera-cko exhibited overall corneal thinning with thinner corneal stroma and thicker corneal epithelium characterized with hypertrophy in the epithelial basal cell compared to their control groups respectively. (A–D) The collagens were better visualized in the Masson’s Trichrome staining (blue) in corneal stroma. (B,D) Compared to the control groups, both Smad4kera-cko and Tgfbr2kera-cko exhibited a substantial decrease of the collagen staining (blue), which indicates a substantial decrease of the collagen formation in the stroma of Smad4kera-cko and Tgfbr2kera-cko. (A,B,K) Furthermore, unlike the disappearing and uneven distribution found in the Tgfbr2kera-cko keratocyte, the distribution of the keratocytes in Smad4kera-cko remains normal. Due to the thinning of the corneal stroma, the density of the corneal keratocytes was found increased (103.33 ± 0.84 vs. 134.33 ± 4.49, n = 6, ****, p < 0.0001). (E,G,H,J) Collagen type 1 immunostaining (Col1a1, green) revealed a substantial decrease of the collagen type 1 in the Smad4kera-cko compared to those in the Smad4Ctrl. (H) In Smad4kera-cko, a discontinued Col1a1 staining can be noticed in the posterior stroma and anterior stroma (red *). (F,I) DAPI immunostaining (blue) revealed the location of the nucleus of epithelial cells and keratocyte. Abbreviations: Epi, corneal epithelium; Str, corneal stroma; End, corneal endothelium.
Figure 8.
Collagen type 1 formation is less abundant in Smad4kera-cko and Tgfbr2kera-cko. (A,C) Trichrome staining revealed a normal cornea in control groups including the normal ratio between corneal epithelium (Epi) and stroma (Str) and the normal distribution of keratocytes in the corneal stroma. (B,D) Both Smad4kera-cko and Tgfbr2kera-cko exhibited overall corneal thinning with thinner corneal stroma and thicker corneal epithelium characterized with hypertrophy in the epithelial basal cell compared to their control groups respectively. (A–D) The collagens were better visualized in the Masson’s Trichrome staining (blue) in corneal stroma. (B,D) Compared to the control groups, both Smad4kera-cko and Tgfbr2kera-cko exhibited a substantial decrease of the collagen staining (blue), which indicates a substantial decrease of the collagen formation in the stroma of Smad4kera-cko and Tgfbr2kera-cko. (A,B,K) Furthermore, unlike the disappearing and uneven distribution found in the Tgfbr2kera-cko keratocyte, the distribution of the keratocytes in Smad4kera-cko remains normal. Due to the thinning of the corneal stroma, the density of the corneal keratocytes was found increased (103.33 ± 0.84 vs. 134.33 ± 4.49, n = 6, ****, p < 0.0001). (E,G,H,J) Collagen type 1 immunostaining (Col1a1, green) revealed a substantial decrease of the collagen type 1 in the Smad4kera-cko compared to those in the Smad4Ctrl. (H) In Smad4kera-cko, a discontinued Col1a1 staining can be noticed in the posterior stroma and anterior stroma (red *). (F,I) DAPI immunostaining (blue) revealed the location of the nucleus of epithelial cells and keratocyte. Abbreviations: Epi, corneal epithelium; Str, corneal stroma; End, corneal endothelium.

Figure 9.
TEM revealed a normal keratocyte appearance with an intact Descemet’s membrane. (A,B,I) Representative Toluidine Blue-Stained Semi-Thick Scout Section revealed a pathological thinning in the corneal stroma in Smad4kera-cko (36.55 ± 0.53 μm) compared to those in Smad4Ctrl (106.72 ± 0.90 μm) (n = 6, ****, p < 0.0001) and both the interfaces between corneal epithelium and corneal stroma are smooth. (C,D) TEM revealed a normal appearance in keratocytes in both Smad4Ctrl and Smad4kera-cko. (E–H) The Descemet’s membrane is intact and showed no defect in the Smad4kera-cko, neither a significant difference compared to those in Smad4Ctrl (Red dash lines). Abbreviations: Epi, epithelium; Str, stroma; End, endothelium; Kera, keratocyte; Des, Descemet’s membrane.

Figure 10.
TEM revealed a keratocyte attachment to the Descemet’s membrane in the Smad4kera-cko mouse line. (A–D) Unlike the normal corneal stroma usually have the abundant collagen fibrils between the posterior keratocytes and the Descemet’s membrane, due to the decrease of the collagen type 1 in the stroma, the keratocytes in Smad4kera-cko were noticed to be attached to the Descemet’s membrane (red arrows) in the posterior stroma. An abnormal morphology can also be noticed compared to the normal keratocytes. Abbreviations: Str, stroma; End, endothelium; Kera, keratocyte; Des, Descemet’s membrane.

Figure 11.
TEM revealed a decreased collagen density with normal collagen diameter in Smad4kera-cko. (A,B) TEM revealed the organization of collagen in different orientation including vertical and parallel to the sectioning surface of both the Smad4Ctrl and Smad4kera-cko. (C,D) For those collagens that is vertical to the sectioning surface, we perform the collagen density calculation and collagen diameter measuring. (E) Collagen density is decreased in the Smad4kera-cko compared to those in the Smad4Ctrl (362.17 ± 6.29 vs. 322.17 ± 5.08, n = 6, p = 0.0007, ***). (F) Collagen diameter measurement showed no significant difference between Smad4kera-cko and Smad4Ctrl (n = 6, p = 0.9758, ns). Abbreviation: ns, not significant.

Disclaimer/Publisher’s Note: The statements, opinions and data contained in all publications are solely those of the individual author(s) and contributor(s) and not of MDPI and/or the editor(s). MDPI and/or the editor(s) disclaim responsibility for any injury to people or property resulting from any ideas, methods, instructions or products referred to in the content. |
© 2024 by the authors. Licensee MDPI, Basel, Switzerland. This article is an open access article distributed under the terms and conditions of the Creative Commons Attribution (CC BY) license (https://creativecommons.org/licenses/by/4.0/).
Share and Cite
MDPI and ACS Style
Wang, Y.-C.; Zolnik, O.B.; Liu, C.-Y. SMAD4-Dependent Signaling Pathway Involves in the Pathogenesis of TGFBR2-Related CE-like Phenotype. Cells 2024, 13, 626. https://doi.org/10.3390/cells13070626
AMA Style
Wang Y-C, Zolnik OB, Liu C-Y. SMAD4-Dependent Signaling Pathway Involves in the Pathogenesis of TGFBR2-Related CE-like Phenotype. Cells. 2024; 13(7):626. https://doi.org/10.3390/cells13070626
Chicago/Turabian StyleWang, Yen-Chiao, Olivia Betty Zolnik, and Chia-Yang Liu. 2024. "SMAD4-Dependent Signaling Pathway Involves in the Pathogenesis of TGFBR2-Related CE-like Phenotype" Cells 13, no. 7: 626. https://doi.org/10.3390/cells13070626
Note that from the first issue of 2016, this journal uses article numbers instead of page numbers. See further details here.