
Lateral Ventricular Neural Stem Cells Provide Negative Feedback to Circuit Activation Through GABAergic Signaling


Abstract
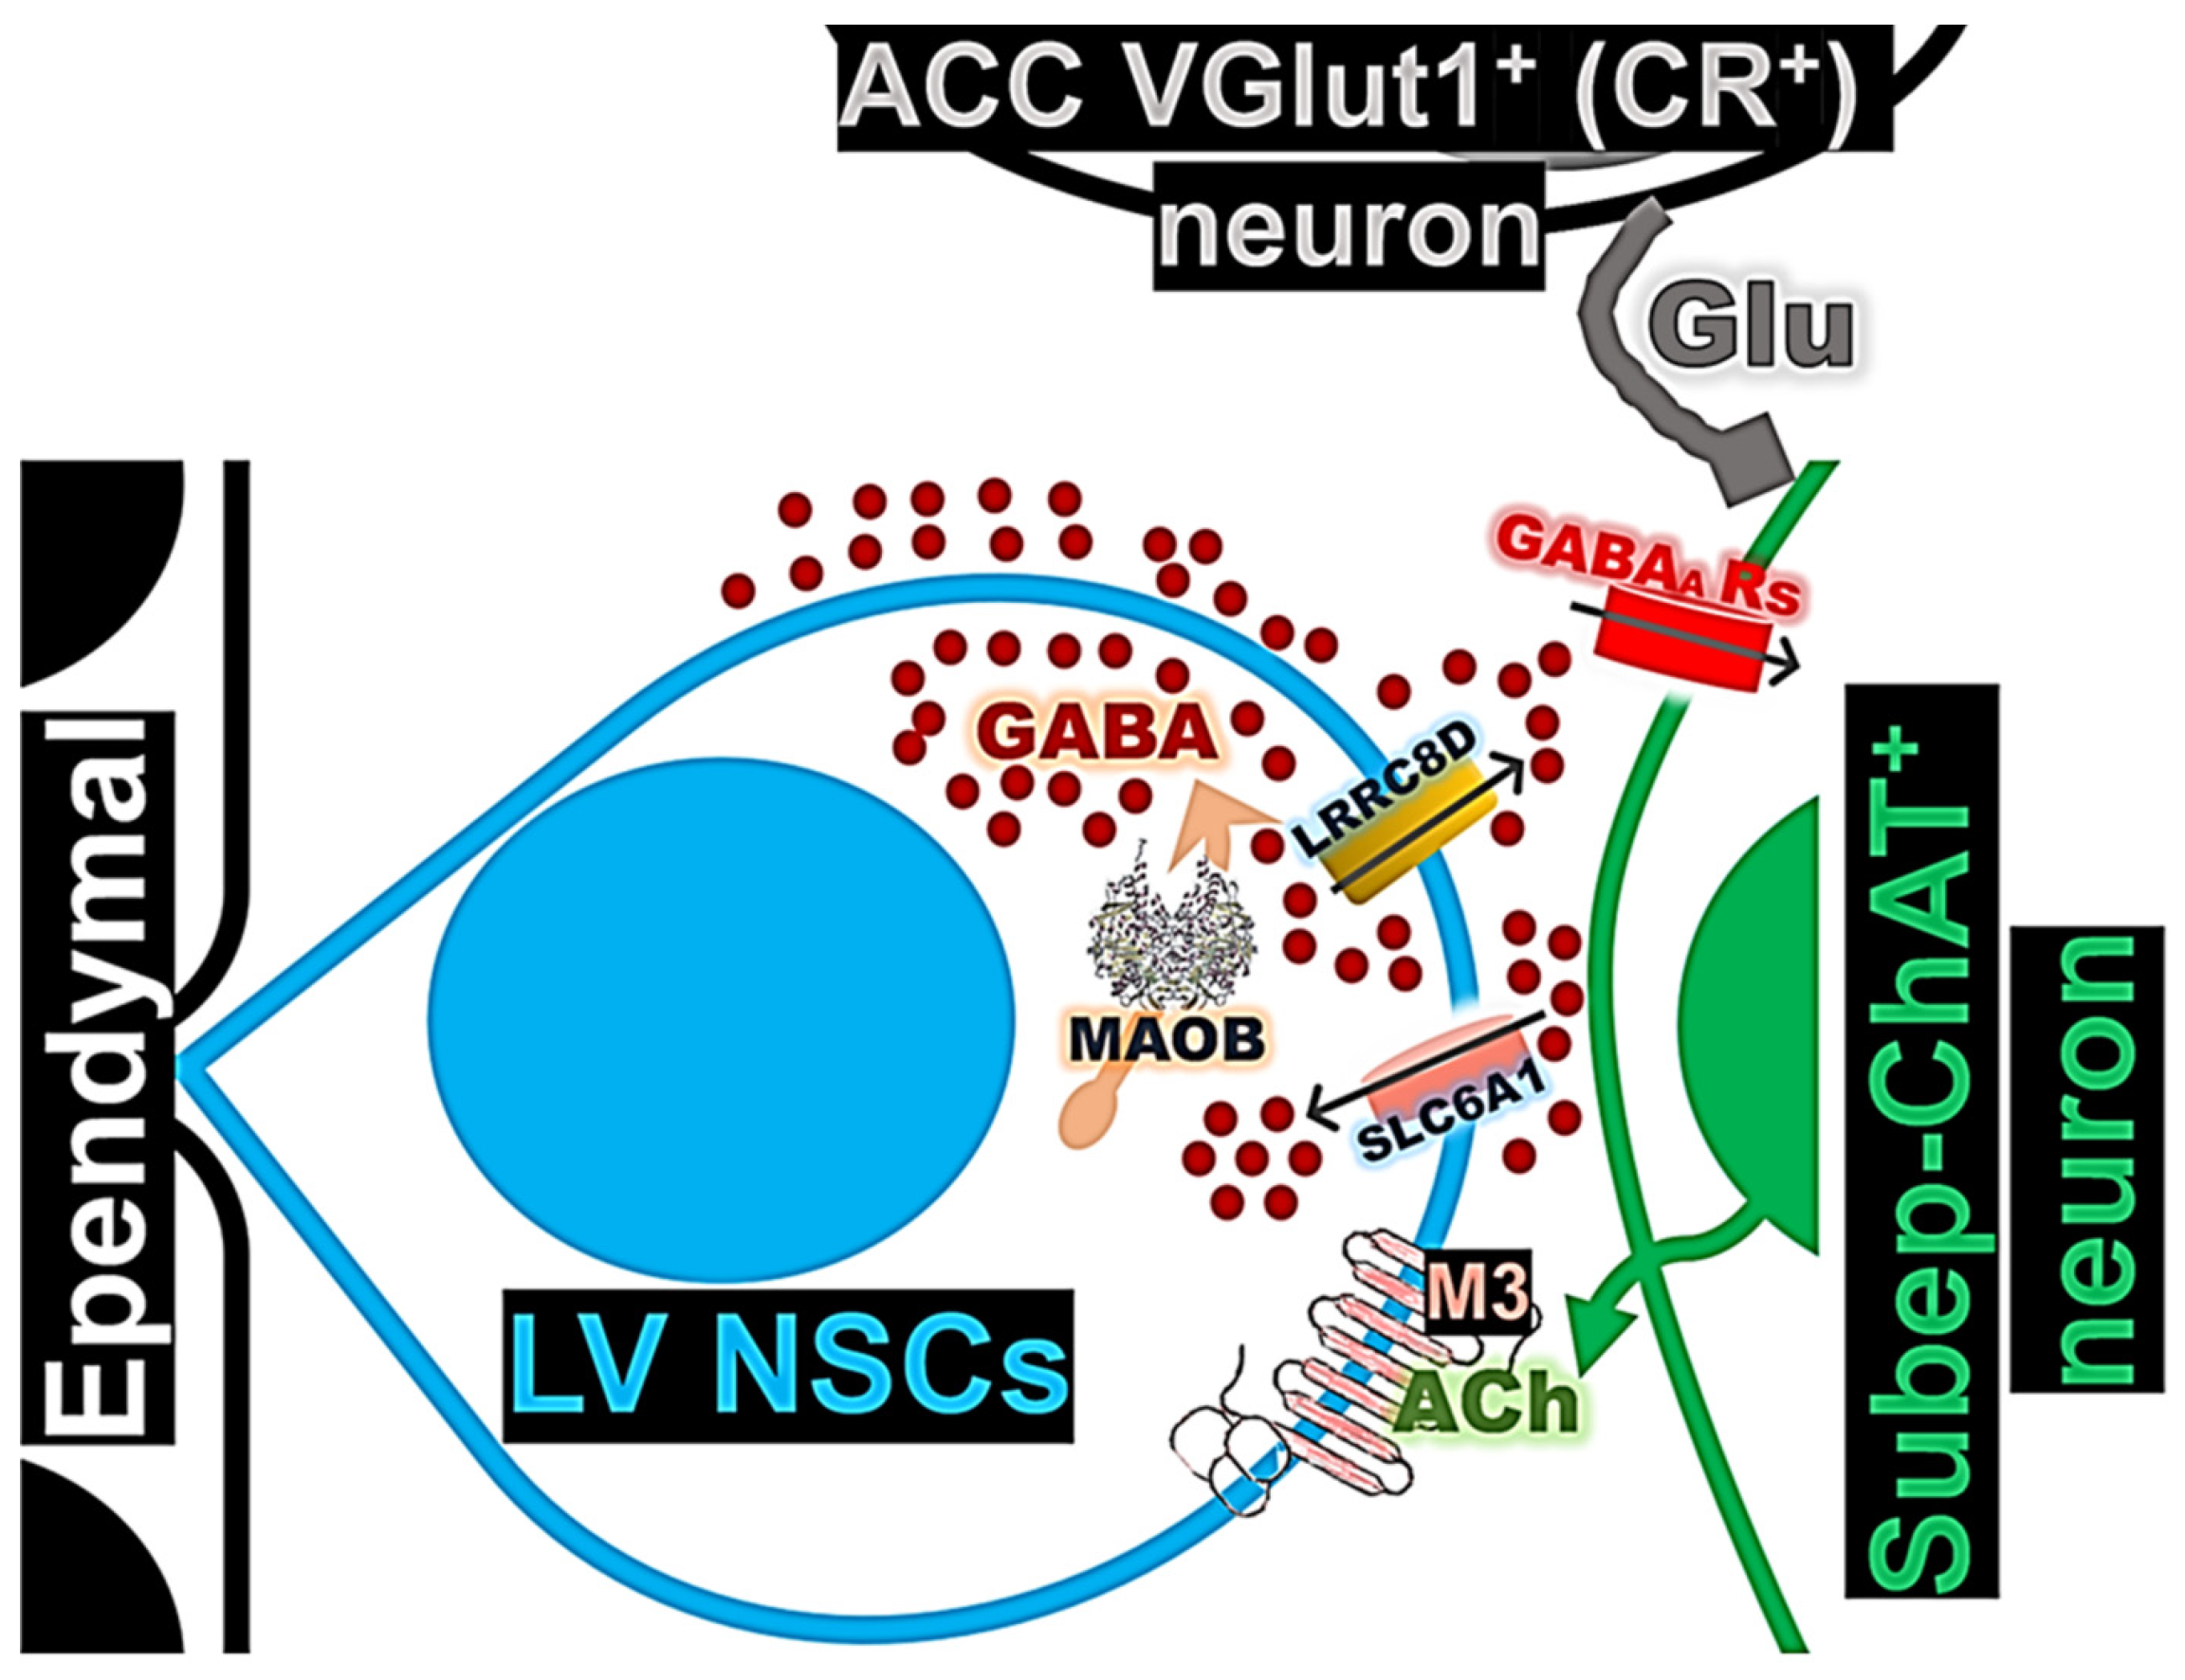
1. Introduction
2. Materials and Methods
2.1. Chemicals
2.2. Mice
2.3. Viruses
2.4. Antibodies
2.5. Stereotaxic Injections
2.6. Immunofluorescence Staining and Imaging
2.7. In Vivo Stimulation of Chemogenetic Circuits and Local Protein Inhibition in the SVZ
2.8. SVZ NSC Culture
2.9. Quantification and Statistical Analysis
3. Results
3.1. Expression and Regulation of GABA Activity in LV NSCs by the ACC-Subep-ChAT⁺ Circuit Activation and Cholinergic Stimulation
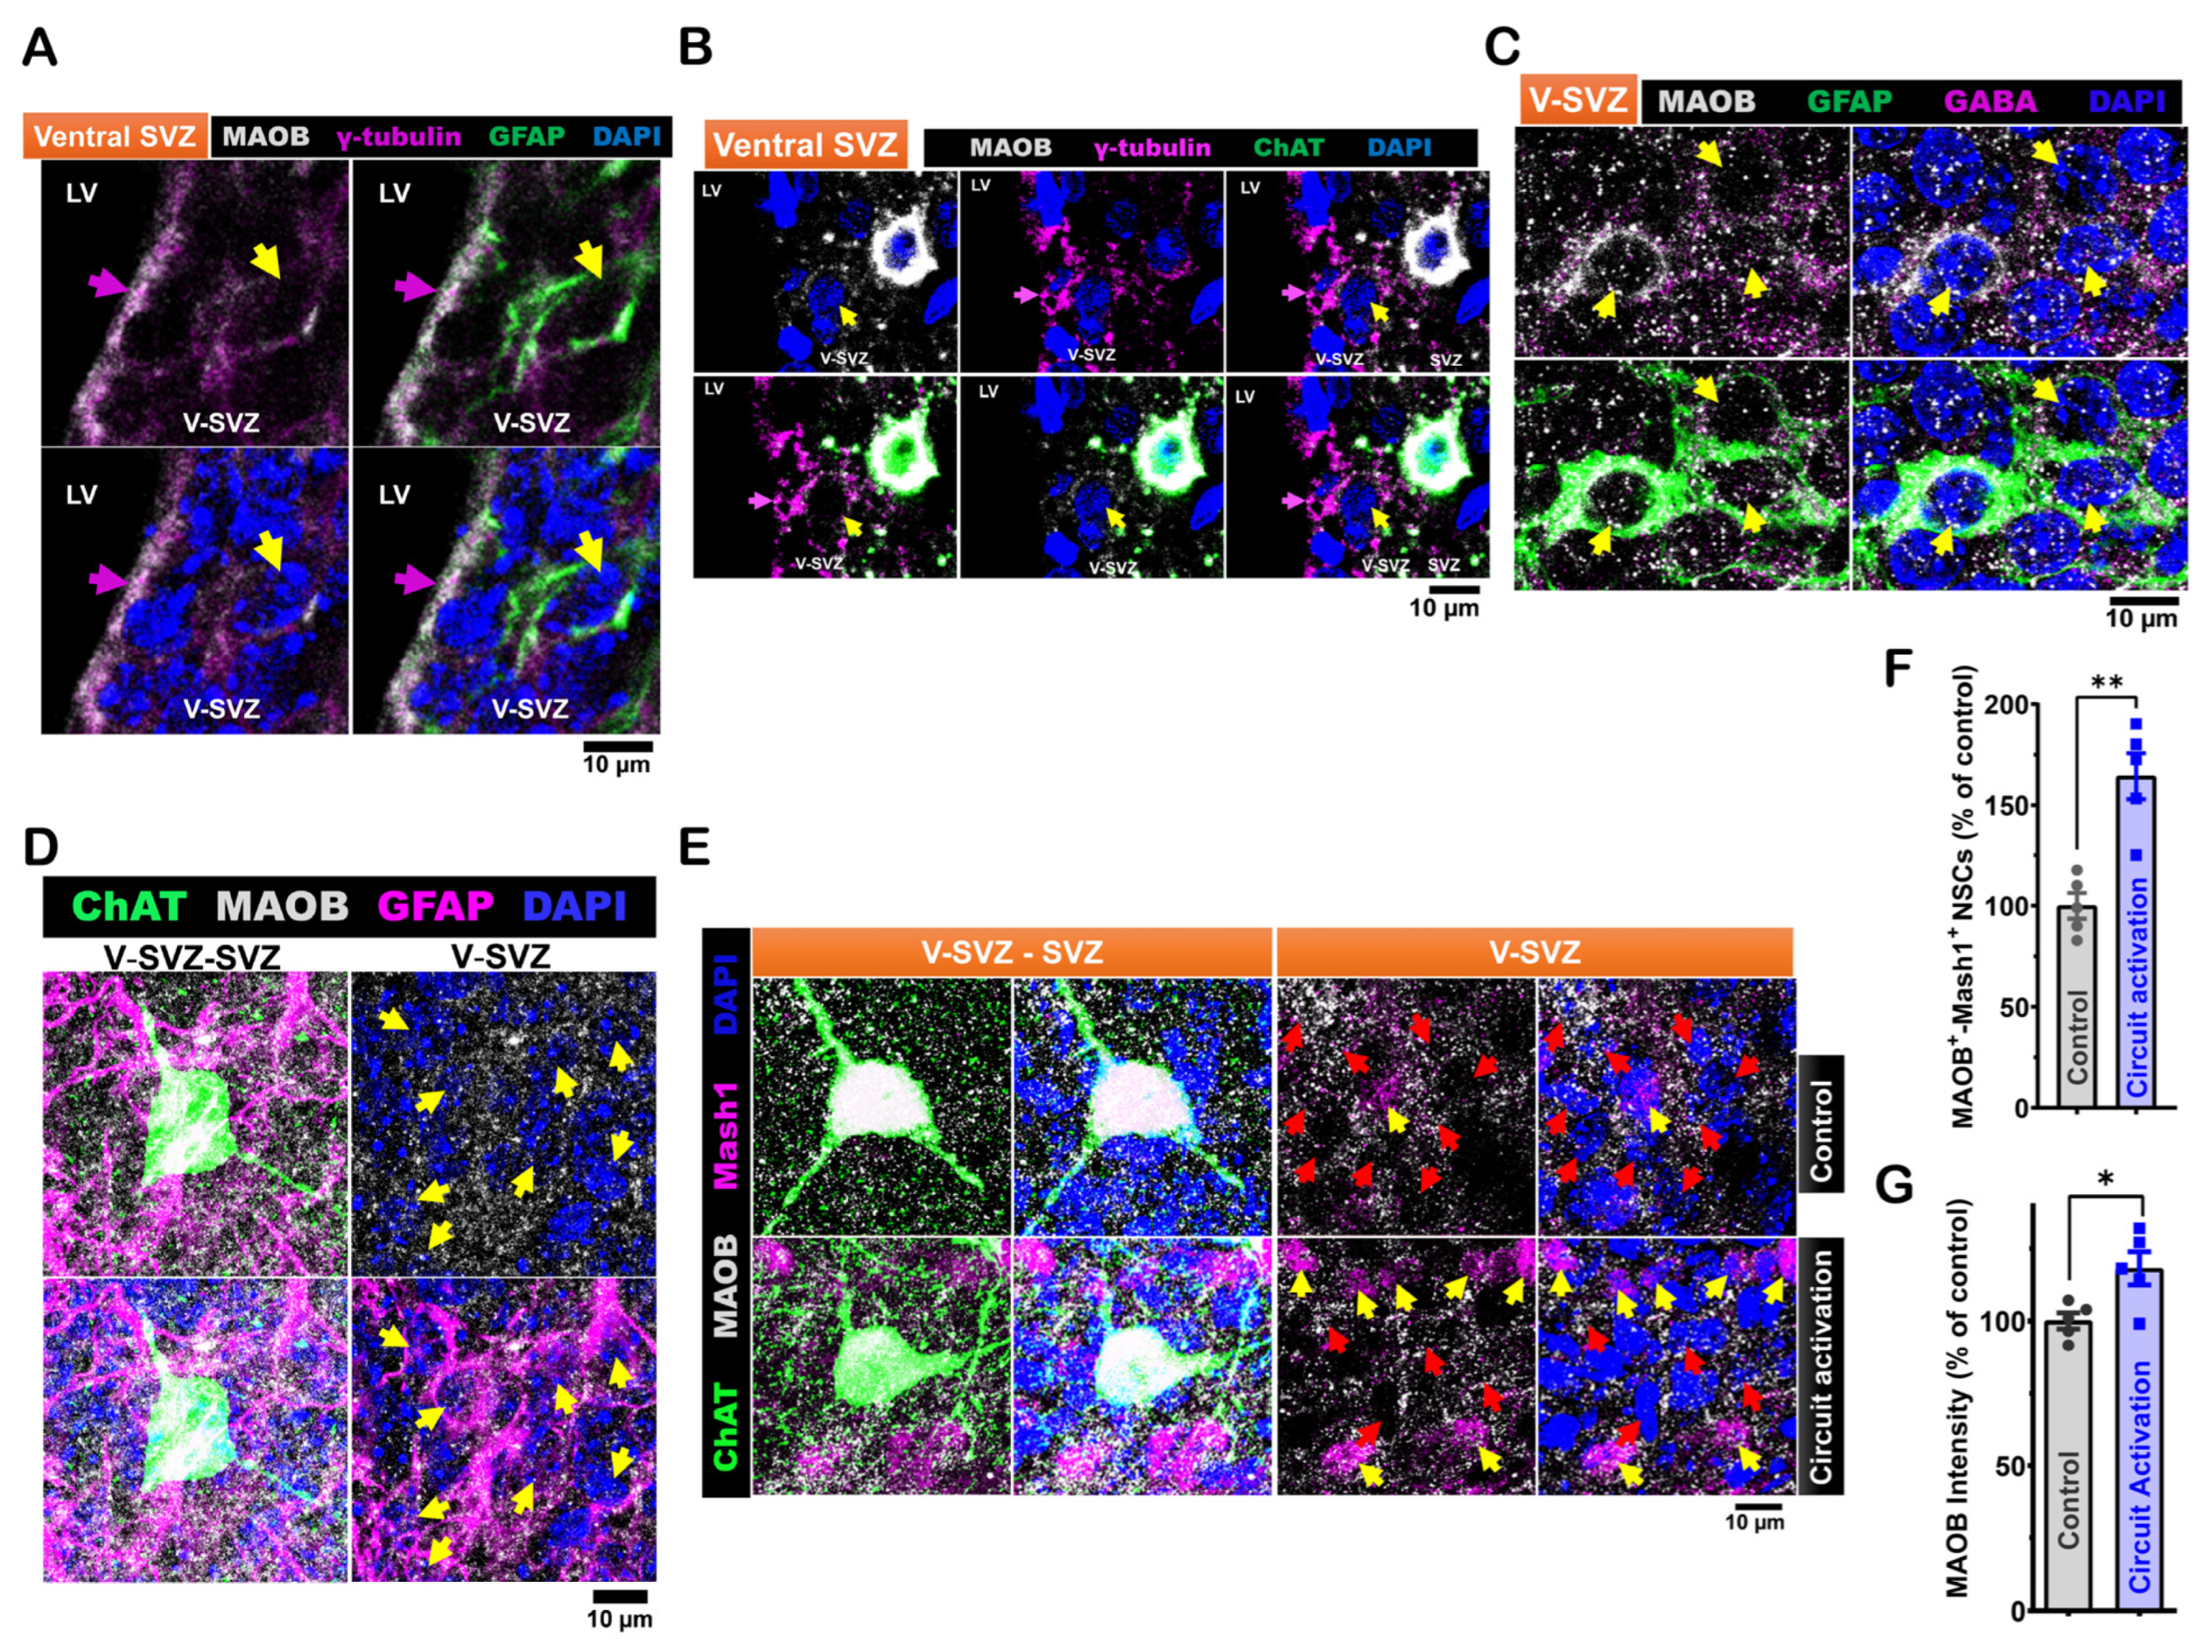
3.2. Expression of MAOB in LV NSCs Is Modulated by ACC-Subep-ChAT⁺ Circuit Activation
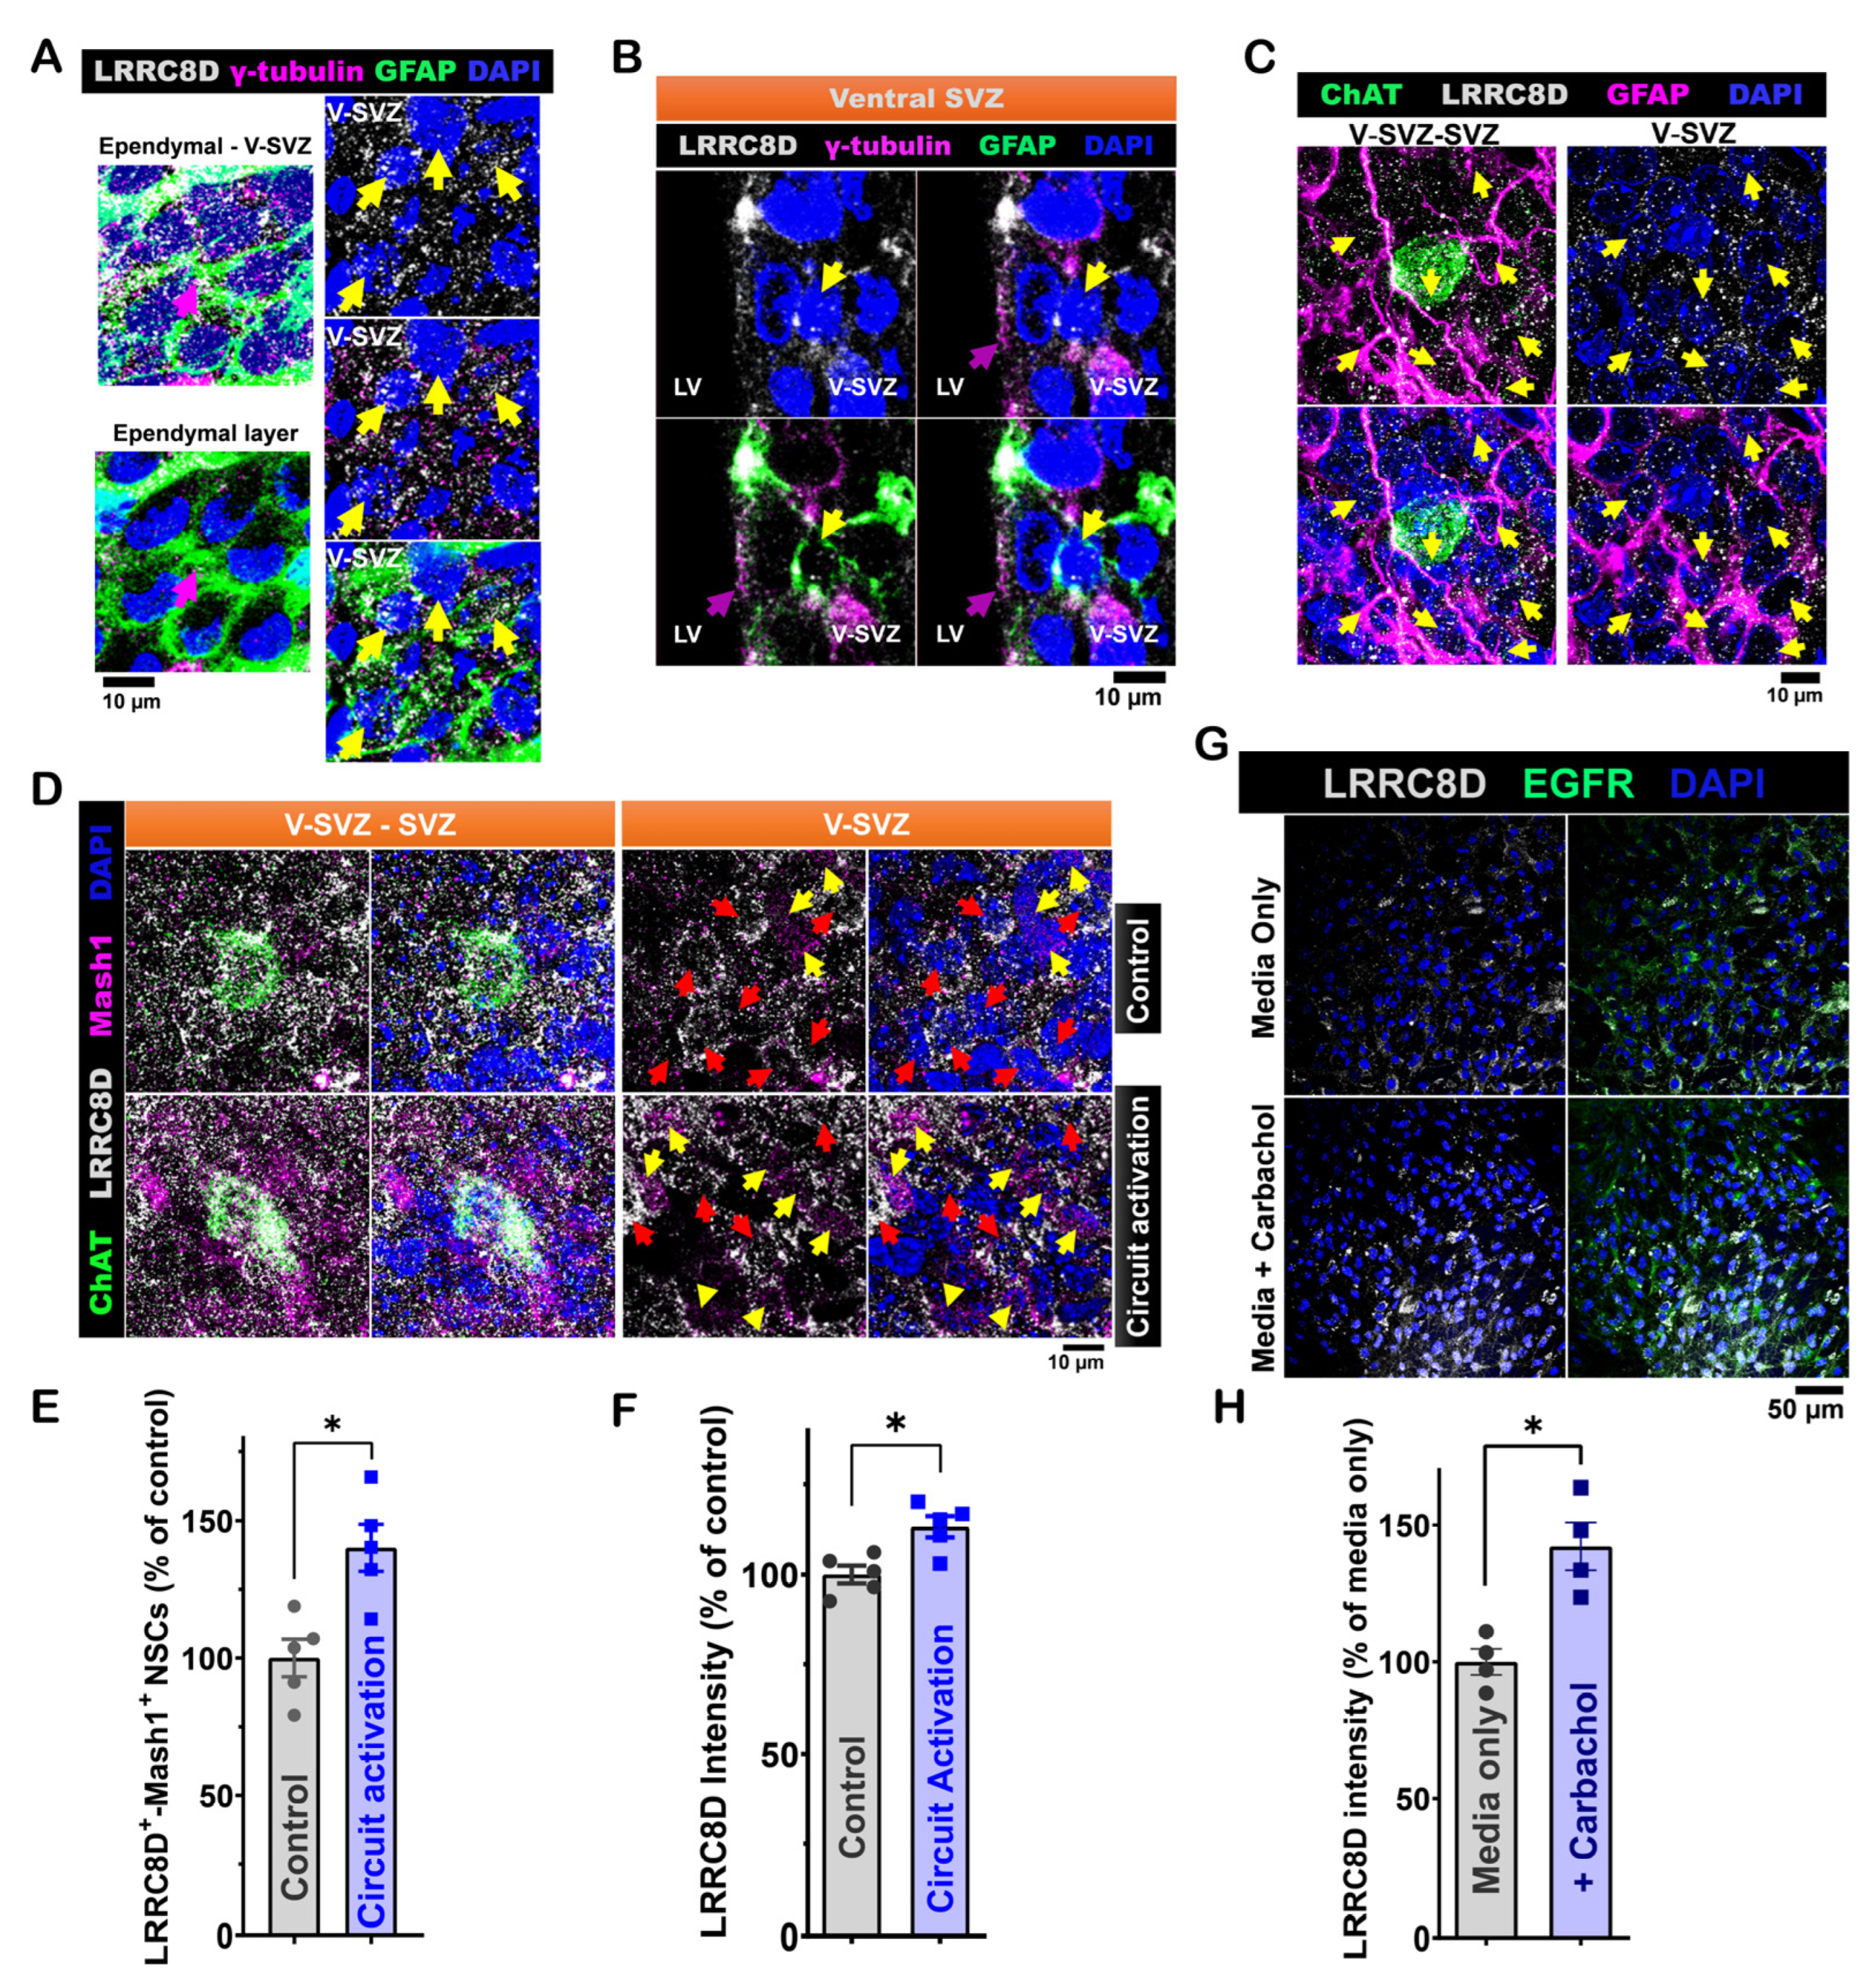
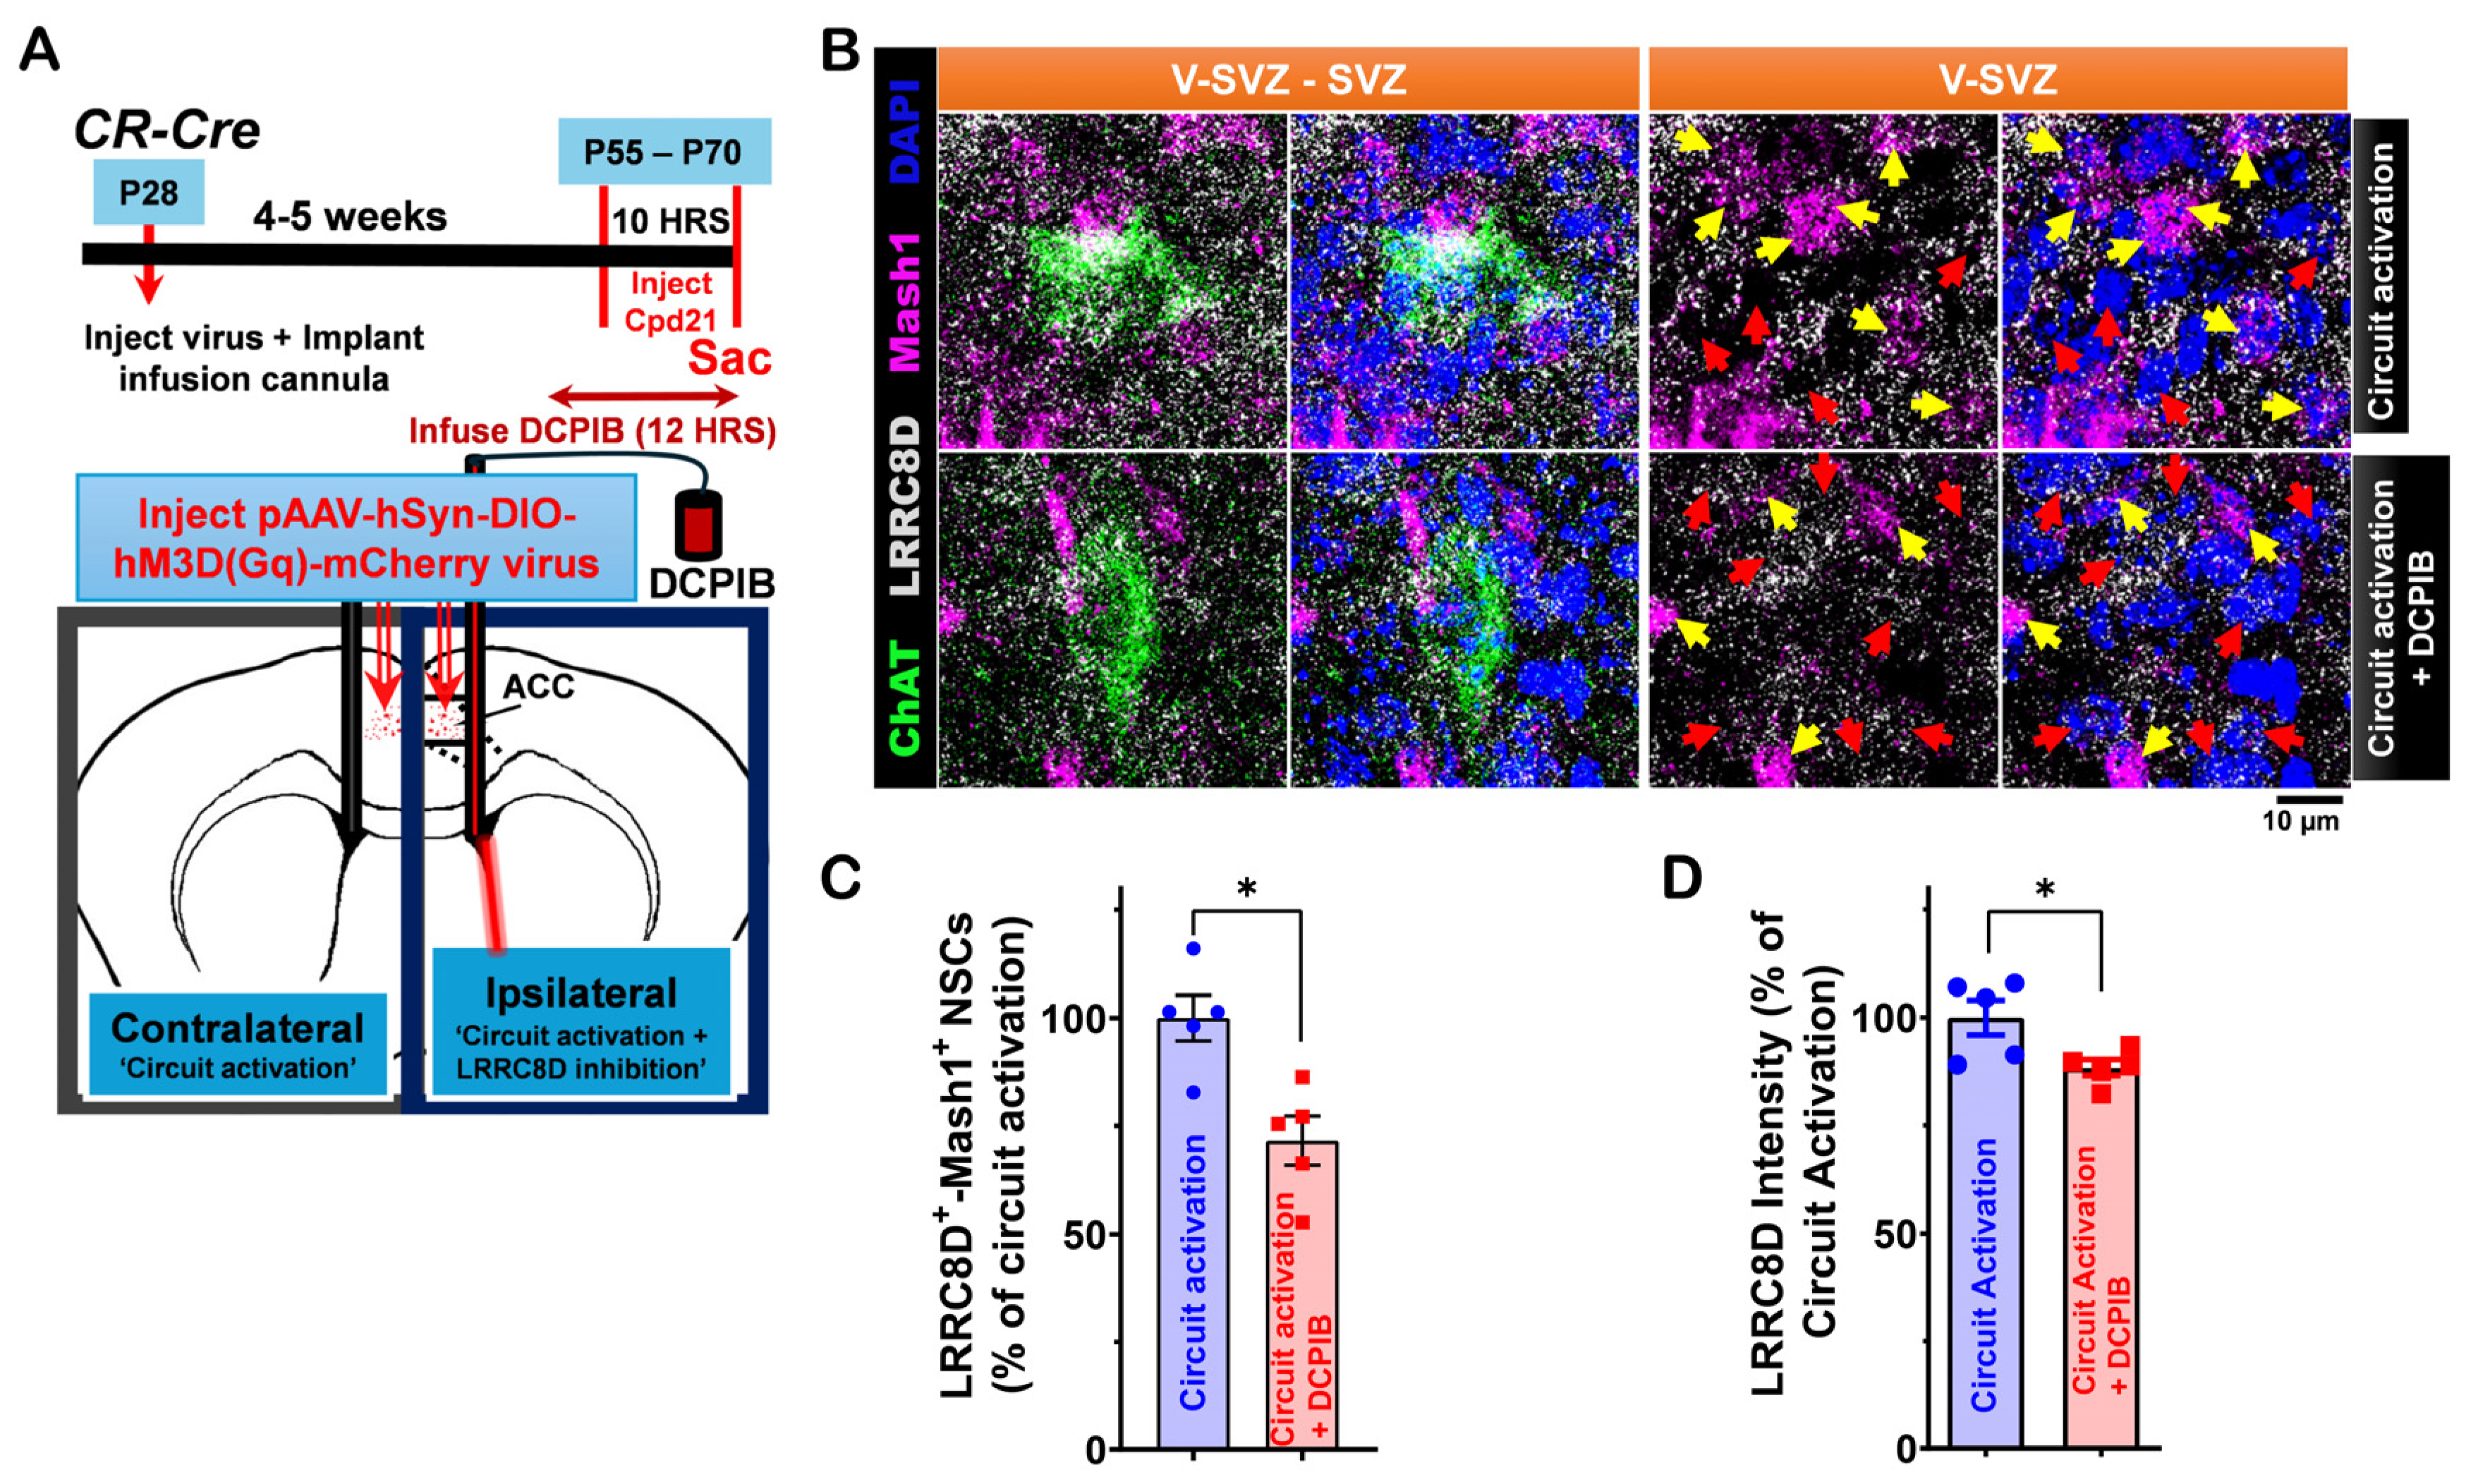
3.3. LRRC8D Expression in LV NSCs and Its Functional Role in ACC-Subep-ChAT+ Circuit-Modulated Proliferation
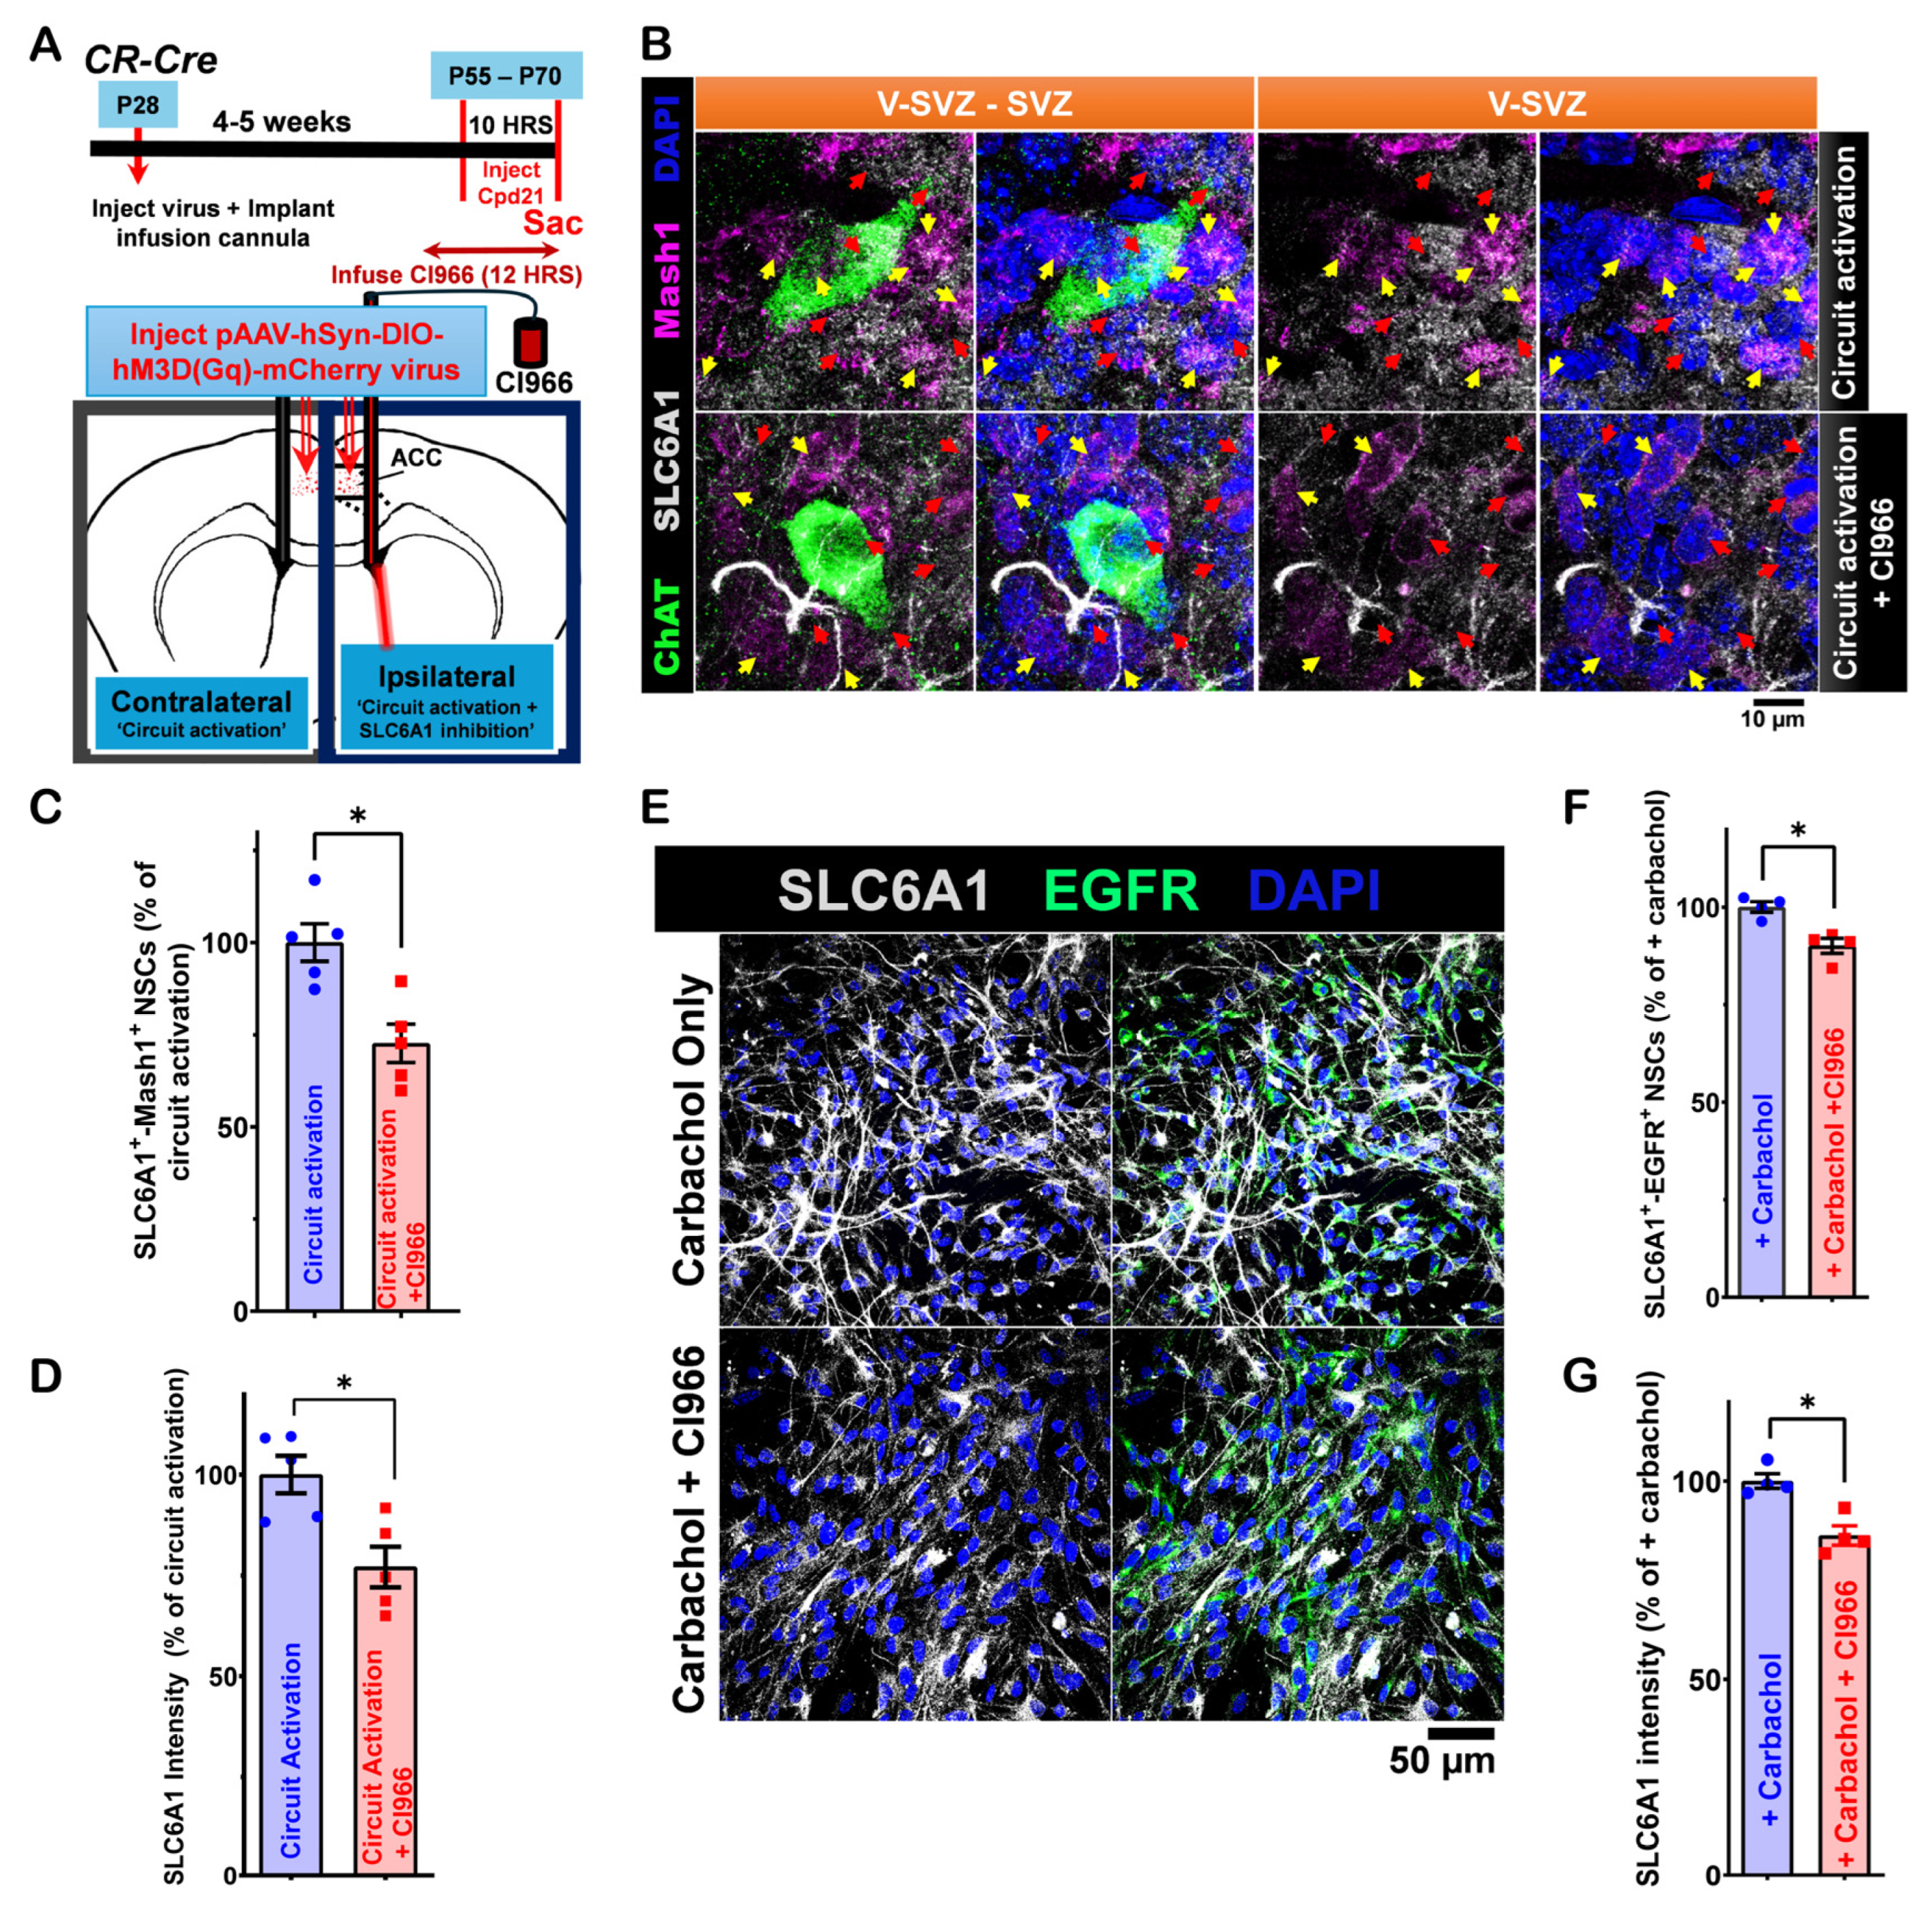
3.4. SLC6A1 Expression and Its Role in Modulating ACC-Subep-ChAT+ Circuit Activity on LV NSCs in the Ventral SVZ
4. Discussion
5. Conclusions
Supplementary Materials
Author Contributions
Funding
Institutional Review Board Statement
Informed Consent Statement
Data Availability Statement
Conflicts of Interest
Abbreviations
| LV NSCs | lateral ventricular neural stem cells |
| GABA | Gamma-aminobutyric acid |
| ACC-subep-ChAT+ | Anterior cingulate cortex-subependymal-ChAT+ |
| MAOB | Monoamine oxidase B |
| GAT-1 | GABA Transporter-1 |
| VRACs | Volume-regulated anion channels |
References
- de Sonnaville, S.; van Strien, M.E.; Middeldorp, J.; Sluijs, J.A.; van den Berge, S.A.; Moeton, M.; Donega, V.; van Berkel, A.; Deering, T.; De Filippis, L.; et al. The adult human subventricular zone: Partial ependymal coverage and proliferative capacity of cerebrospinal fluid. Brain Commun. 2020, 2, fcaa150. [Google Scholar] [CrossRef] [PubMed]
- Baig, S.; Nadaf, J.; Allache, R.; Le, P.U.; Luo, M.; Djedid, A.; Nkili-Meyong, A.; Safisamghabadi, M.; Prat, A.; Antel, J.; et al. Identity and nature of neural stem cells in the adult human subventricular zone. iScience 2024, 27, 109342. [Google Scholar] [CrossRef] [PubMed]
- Lim, D.A.; Alvarez-Buylla, A. The Adult Ventricular-Subventricular Zone (V-SVZ) and Olfactory Bulb (OB) Neurogenesis. Cold Spring Harb. Perspect. Biol. 2016, 8, a018820. [Google Scholar] [CrossRef] [PubMed]
- Lledo, P.M.; Merkle, F.T.; Alvarez-Buylla, A. Origin and function of olfactory bulb interneuron diversity. Trends Neurosci. 2008, 31, 392–400. [Google Scholar] [CrossRef]
- Lledo, P.M.; Saghatelyan, A. Integrating new neurons into the adult olfactory bulb: Joining the network, life-death decisions, and the effects of sensory experience. Trends Neurosci. 2005, 28, 248–254. [Google Scholar] [CrossRef]
- Naffaa, M.M. Neurogenesis dynamics in the olfactory bulb: Deciphering circuitry organization, function, and adaptive plasticity. Neural Regen. Res. 2025, 20, 1565–1581. [Google Scholar] [CrossRef]
- Imai, T. Construction of functional neuronal circuitry in the olfactory bulb. Semin. Cell Dev. Biol. 2014, 35, 180–188. [Google Scholar] [CrossRef]
- Nagayama, S.; Homma, R.; Imamura, F. Neuronal organization of olfactory bulb circuits. Front. Neural Circuits 2014, 8, 98. [Google Scholar] [CrossRef]
- Blasco-Chamarro, L.; Farinas, I. Fine-tuned Rest: Unveiling the Regulatory Landscape of Adult Quiescent Neural Stem Cells. Neuroscience 2023, 525, 26–37. [Google Scholar] [CrossRef]
- Obernier, K.; Alvarez-Buylla, A. Neural stem cells: Origin, heterogeneity and regulation in the adult mammalian brain. Development 2019, 146, dev156059. [Google Scholar] [CrossRef]
- Naffaa, M.M. Neural circuit regulation of postnatal and adult subventricular zone neurogenesis: Mechanistic insights, functional models, and circuit-based neurological disorders. Arch. Stem Cell Ther. 2024, 5, 44–55. [Google Scholar] [CrossRef]
- Naffaa, M.M.; Khan, R.R.; Kuo, C.T.; Yin, H.H. Cortical regulation of neurogenesis and cell proliferation in the ventral subventricular zone. Cell Rep. 2023, 42, 112783. [Google Scholar] [CrossRef] [PubMed]
- Naffaa, M.M.; Yin, H.H. A cholinergic signaling pathway underlying cortical circuit activation of quiescent neural stem cells in the lateral ventricle. Sci. Signal 2024, 17, eadk8810. [Google Scholar] [CrossRef] [PubMed]
- Naffaa, M.M.; Yin, H.H. LV NSCs Carbachol Versus Control. Mendeley Data 2024. [Google Scholar] [CrossRef]
- Ekblom, J.; Jossan, S.S.; Bergstrom, M.; Oreland, L.; Walum, E.; Aquilonius, S.M. Monoamine oxidase-B in astrocytes. Glia 1993, 8, 122–132. [Google Scholar] [CrossRef]
- Yoon, B.E.; Woo, J.; Chun, Y.E.; Chun, H.; Jo, S.; Bae, J.Y.; An, H.; Min, J.O.; Oh, S.J.; Han, K.S.; et al. Glial GABA, synthesized by monoamine oxidase B, mediates tonic inhibition. J. Physiol. 2014, 592, 4951–4968. [Google Scholar] [CrossRef]
- Kilb, W.; Kirischuk, S. GABA Release from Astrocytes in Health and Disease. Int. J. Mol. Sci. 2022, 23, 15859. [Google Scholar] [CrossRef]
- Cho, H.U.; Kim, S.; Sim, J.; Yang, S.; An, H.; Nam, M.H.; Jang, D.P.; Lee, C.J. Redefining differential roles of MAO-A in dopamine degradation and MAO-B in tonic GABA synthesis. Exp. Mol. Med. 2021, 53, 1148–1158. [Google Scholar] [CrossRef]
- Jo, S.; Yarishkin, O.; Hwang, Y.J.; Chun, Y.E.; Park, M.; Woo, D.H.; Bae, J.Y.; Kim, T.; Lee, J.; Chun, H.; et al. GABA from reactive astrocytes impairs memory in mouse models of Alzheimer’s disease. Nat. Med. 2014, 20, 886–896. [Google Scholar] [CrossRef]
- Ghouli, M.R.; Fiacco, T.A.; Binder, D.K. Structure-function relationships of the LRRC8 subunits and subdomains of the volume-regulated anion channel (VRAC). Front. Cell Neurosci. 2022, 16, 962714. [Google Scholar] [CrossRef]
- Lutter, D.; Ullrich, F.; Lueck, J.C.; Kempa, S.; Jentsch, T.J. Selective transport of neurotransmitters and modulators by distinct volume-regulated LRRC8 anion channels. J. Cell Sci. 2017, 130, 1122–1133. [Google Scholar] [CrossRef] [PubMed]
- Broer, S.; Gether, U. The solute carrier 6 family of transporters. Br. J. Pharmacol. 2012, 167, 256–278. [Google Scholar] [CrossRef] [PubMed]
- Bhatt, M.; Gauthier-Manuel, L.; Lazzarin, E.; Zerlotti, R.; Ziegler, C.; Bazzone, A.; Stockner, T.; Bossi, E. A comparative review on the well-studied GAT1 and the understudied BGT-1 in the brain. Front. Physiol. 2023, 14, 1145973. [Google Scholar] [CrossRef] [PubMed]
- Decher, N.; Lang, H.J.; Nilius, B.; Bruggemann, A.; Busch, A.E.; Steinmeyer, K. DCPIB is a novel selective blocker of I(Cl,swell) and prevents swelling-induced shortening of guinea-pig atrial action potential duration. Br. J. Pharmacol. 2001, 134, 1467–1479. [Google Scholar] [CrossRef]
- Friard, J.; Tauc, M.; Cougnon, M.; Compan, V.; Duranton, C.; Rubera, I. Comparative Effects of Chloride Channel Inhibitors on LRRC8/VRAC-Mediated Chloride Conductance. Front. Pharmacol. 2017, 8, 328. [Google Scholar] [CrossRef]
- Suzdak, P.D.; Frederiksen, K.; Andersen, K.E.; Sorensen, P.O.; Knutsen, L.J.; Nielsen, E.B. NNC-711, a novel potent and selective gamma-aminobutyric acid uptake inhibitor: Pharmacological characterization. Eur. J. Pharmacol. 1992, 224, 189–198. [Google Scholar] [CrossRef]
- Kristensen, A.S.; Andersen, J.; Jorgensen, T.N.; Sorensen, L.; Eriksen, J.; Loland, C.J.; Stromgaard, K.; Gether, U. SLC6 neurotransmitter transporters: Structure, function, and regulation. Pharmacol. Rev. 2011, 63, 585–640. [Google Scholar] [CrossRef]
- Park, J.H.; Ju, Y.H.; Choi, J.W.; Song, H.J.; Jang, B.K.; Woo, J.; Chun, H.; Kim, H.J.; Shin, S.J.; Yarishkin, O.; et al. Newly developed reversible MAO-B inhibitor circumvents the shortcomings of irreversible inhibitors in Alzheimer’s disease. Sci. Adv. 2019, 5, eaav0316. [Google Scholar] [CrossRef]
- Planells-Cases, R.; Lutter, D.; Guyader, C.; Gerhards, N.M.; Ullrich, F.; Elger, D.A.; Kucukosmanoglu, A.; Xu, G.; Voss, F.K.; Reincke, S.M.; et al. Subunit composition of VRAC channels determines substrate specificity and cellular resistance to Pt-based anti-cancer drugs. EMBO J. 2015, 34, 2993–3008. [Google Scholar] [CrossRef]
- Goodspeed, K.; Perez-Palma, E.; Iqbal, S.; Cooper, D.; Scimemi, A.; Johannesen, K.M.; Stefanski, A.; Demarest, S.; Helbig, K.L.; Kang, J.; et al. Current knowledge of SLC6A1-related neurodevelopmental disorders. Brain Commun. 2020, 2, fcaa170. [Google Scholar] [CrossRef]


| Marker | Marker Function | Cellular Localization | Cell Type |
|---|---|---|---|
| γ-Tubulin | Essential for mitotic spindle organization | Cytoplasmic and centrosomal, predominantly located at the apical region of quiescent LV NSCs | Quiescent LV NSCs |
| GFAP | Astrocyte and neural stem cell (NSC) marker, indicative of glial properties | Mainly localized in the cytoplasm, associated with cytoskeletal structures | Quiescent LV NSCs, Activated LV NSCs |
| EGFR | Epidermal growth factor receptor, promotes NSC self-renewal and proliferation | Membrane-bound | Quiescent LV NSCs, Activated LV NSCs |
| Mash1 (Ascl1) | Transcription factor that promotes the early stages of neurogenesis | Nuclear | Activated LV NSCs |
| GABA | Inhibitory neurotransmitter | Cytoplasmic, extracellular | Quiescent LV NSCs, Activated LV NSCs |
| MAOB | Enzyme involved in GABA synthesis | Mitochondrial membrane | Quiescent LV NSCs, Activated LV NSCs |
| LRRC8D | Volume-regulated anion channel component, mediates transport | Membrane-bound | Quiescent LV NSCs, Activated LV NSCs |
| SLC6A1 (GAT-1) | GABA transporter, regulates extracellular GABA levels | Membrane-bound proteins and processes of LV NSCs | Quiescent LV NSCs, Activated LV NSCs |
| ChAT | Catalyzes acetylcholine (ACh) synthesis | Cytoplasmic | Subep-ChAT+ Neurons |
| ACh | Neurotransmitter involved in LV NSC activation | Extracellular | Subep-ChAT+ Neurons |
Disclaimer/Publisher’s Note: The statements, opinions and data contained in all publications are solely those of the individual author(s) and contributor(s) and not of MDPI and/or the editor(s). MDPI and/or the editor(s) disclaim responsibility for any injury to people or property resulting from any ideas, methods, instructions or products referred to in the content. |
© 2025 by the authors. Licensee MDPI, Basel, Switzerland. This article is an open access article distributed under the terms and conditions of the Creative Commons Attribution (CC BY) license (https://creativecommons.org/licenses/by/4.0/).
Share and Cite
Naffaa, M.M.; Yin, H.H. Lateral Ventricular Neural Stem Cells Provide Negative Feedback to Circuit Activation Through GABAergic Signaling. Cells 2025, 14, 426. https://doi.org/10.3390/cells14060426
Naffaa MM, Yin HH. Lateral Ventricular Neural Stem Cells Provide Negative Feedback to Circuit Activation Through GABAergic Signaling. Cells. 2025; 14(6):426. https://doi.org/10.3390/cells14060426
Chicago/Turabian StyleNaffaa, Moawiah M., and Henry H. Yin. 2025. "Lateral Ventricular Neural Stem Cells Provide Negative Feedback to Circuit Activation Through GABAergic Signaling" Cells 14, no. 6: 426. https://doi.org/10.3390/cells14060426
APA StyleNaffaa, M. M., & Yin, H. H. (2025). Lateral Ventricular Neural Stem Cells Provide Negative Feedback to Circuit Activation Through GABAergic Signaling. Cells, 14(6), 426. https://doi.org/10.3390/cells14060426