Article

Escherichia coli Increases its ATP Concentration in Weakly Acidic Environments Principally through the Glycolytic Pathway

1
Guangdong Provincial Key Laboratory of Protein Function and Regulation in Agricultural Organisms, College of Life Sciences, South China Agricultural University, Guangzhou 510640, China
2
Guangzhou Institutes of Biomedicine and Health, Chinese Academy of Sciences, Guangzhou 510530, China
3
Guangdong Key Laboratory of IoT Information Technology, School of Automation, Guangdong University of Technology, Guangzhou 510006, China
4
Department of Microbiology, Immunology and Molecular Genetics, University of California, Los Angeles, CA 90095, USA
*
Author to whom correspondence should be addressed.
Genes 2020, 11(9), 991; https://doi.org/10.3390/genes11090991
Submission received: 24 July 2020 / Revised: 22 August 2020 / Accepted: 24 August 2020 / Published: 25 August 2020
(This article belongs to the Special Issue Mechanisms of Microbial Adaptation to Low pH)

Abstract

:
Acid resistance is an intrinsic characteristic of intestinal bacteria in order to survive passage through the stomach. Adenosine triphosphate (ATP), the ubiquitous chemical used to power metabolic reactions, activate signaling cascades, and form precursors of nucleic acids, was also found to be associated with the survival of Escherichia coli (E. coli) in acidic environments. The metabolic pathway responsible for elevating the level of ATP inside these bacteria during acid adaptation has been unclear. E. coli uses several mechanisms of ATP production, including oxidative phosphorylation, glycolysis and the oxidation of organic compounds. To uncover which is primarily used during adaptation to acidic conditions, we broadly analyzed the levels of gene transcription of multiple E. coli metabolic pathway components. Our findings confirmed that the primary producers of ATP in E. coli undergoing mild acidic stress are the glycolytic enzymes Glk, PykF and Pgk, which are also essential for survival under markedly acidic conditions. By contrast, the transcription of genes related to oxidative phosphorylation was downregulated, despite it being the major producer of ATP in neutral pH environments.

1. Introduction

Both commensal and pathogenic enteric bacteria have adapted to resist several hours of exposure to the acidic environment of the human stomach, which has an average pH of 2.0, before entering the more hospitable intestinal tract. Multiple genes and pathways play a role in acid resistance (AR) and the acid tolerance response (ATR) in bacteria [1]. At least four AR systems have been identified in Escherichia coli [2,3,4,5,6], which make use of enzymatic processes to consume protons or produce metabolites to buffer the pH and protect against stress [7,8]. AR1 (oxidative system) requires the sigma factor RpoS [9,10] and the cyclic AMP receptor protein CRP [11]. AR2–AR4 function through amino acid decarboxylation [4,12,13], with AR2, AR3 and AR4 reliant on glutamate (glutamate decarboxylase system) [12,13], arginine (arginine decarboxylase system) and lysine (lysine decarboxylase system) [14,15,16,17], respectively. AR2 is the most effective amino acid-dependent system, requiring two glutamate decarboxylases (GadA and GadB), which are active at an acidic pH, and the antiporter GadC [18,19,20]. The glutaminase and adenosine deaminases were also shown to contribute to AR in E. coli, and these enzymes use their respective substrates to release NH3 into the cytoplasm and raise the intracellular pH [21,22].
Interestingly, we previously published findings demonstrating a relationship in E. coli between intracellular ATP levels and the environmental pH [23]. We found that a high concentration of ATP within the bacterial cell is necessary for survival under extremely acidic conditions [23]. Although ATP levels decreased rapidly when the media was adjusted from a near-physiological pH of 7.5 to 2.5, ATP concentrations were actually found to increase only when cells were pre-adapted to a weakly acidic environment (pH 5.5), which was still permissible to E. coli growth [23].
The mechanism and purpose of this observed effect remain unclear, although there have been several proposed explanations. One possibility is that under stress at low pH, metabolic processes that would otherwise consume ATP are intentionally suppressed or forcibly inhibited by suboptimal enzymatic conditions. Bacterial growth was in fact noted to be reduced at pH 5.5. Alternatively, the production of ATP in weakly acidic environments may be augmented. ATP is produced in E. coli through both oxidative phosphorylation and glycolysis when glucose is present as the carbon source.
In oxidative phosphorylation, F1Fo-ATPase catalyzes the synthesis of ATP from ADP and inorganic phosphate using the electro-chemical gradient of protons across the cellular membrane. The greater pH gradient between the intracellular and extracellular compartments at pH 5.5 could boost the membrane potential and drive further ATP synthesis. Interestingly, when compared to levels at pH 7.5, both the pH gradient and membrane potential between intracellular and extracellular compartments were found to be minimal at a low pH (pH 2–2.5) [2,3,24]. Our previous work had shown that ATPase mutants could still elevate the level of ATP at pH 5.5 [25]. Foster et al. speculated that the ATPase may function as a proton pump and consume ATP to regulate the intracellular pH in E. coli [7]. During glycolysis, one mole of glucose is fermented and at least two moles of ATP are synthesized, which can either be used for biosynthesis or be hydrolyzed by F1Fo-ATPase [26]. These results suggest the possibility that the ATPase consumes ATP to pump out protons in acidic environments, and that another mechanism independent from the ATPase is used to generate ATP.
In glycolysis, glucose is converted to pyruvate through a 10-step pathway with multiple intermediate metabolites (Figure 1). Steps 1 and 3 consume ATP, and steps 7 and 10 catalyze ATP synthesis, resulting in a net balance of 2 ATP per molecule of glucose. The initial step of the glycolysis pathway is catalyzed by glucokinase (Glk), a hexokinase isozyme that facilitates phosphorylation of glucose to glucose-6-phosphate. Step 7 is catalyzed by 3-phosphoglycerate kinase (Pgk) [27,28]. Two isozymes of pyruvate kinase, PykF and PykA, oversee the final step, where phosphoenolpyruvate is converted into pyruvate [29,30,31,32]. Pyruvate is then used in the tricarboxylic acid (TCA) cycle under aerobic conditions to produce additional NADH and succinate for further processing in oxidative phosphorylation. Citrate synthase (GltA) catalyzes an early step in the TCA cycle to condense oxaloacetate and acetyl coenzyme A into citrate and coenzyme A [33,34].
In this study, we attempt to clarify which metabolic pathway or genes encoding enzymes are responsible for the increase in intracellular ATP concentration in E. coli grown in weakly acidic media with glucose as the sole carbon source. This will in turn reveal the mechanisms used by E. coli for adaptation to acidic environments. The expression of genes encoding enzymes responsible for ATP synthesis at different pH levels was analyzed, and the effects on AR and ATP concentration were investigated.

2. Materials and Methods

2.1. Strains, Plasmids, Culture Media and Reagents

The bacterial strains and plasmids used in this study are listed in Table 1. All strains were initially grown at 37 °C in LB medium, then tested in EG medium, which is E medium [35] containing 0.4% glucose [36]. The medium pH was adjusted by the addition of NaOH or HCl. Antibiotics were used at the following concentrations: ampicillin, 100 µg/mL; kanamycin, 30 µg/mL; chloramphenicol, 30 μg/mL. Antibiotics, L-arabinose, N,N’-dicyclohexylcarbodiimide (DCCD) and carbonyl cyanide 3-chlorophenylhydrazone (CCCP) were obtained from Sigma-Aldrich (St. Louis, MO, USA).

2.2. One-Step Inactivation of Chromosomal Genes in E. coli

Gene knock-out mutants in the glycolysis pathway in E. coli were created using conventional Red-mediated recombination [37]. A linear fragment containing the kanamycin or chloramphenicol resistance gene flanked by about 60 base pairs of the target metabolic gene was introduced through electroporation into E. coli strain BW25113, which already carried the Red helper plasmid pKD46. The primers used to amplify these genes are shown in Table 2. L-arabinose (1 mM) was added to the medium and bacteria were incubated at 37 °C for 1 h after electroporation. The mutants were selected on plates of LB medium containing the relevant antibiotic. DNA from individual transformants was isolated and tested by PCR amplification to confirm the integration of the resistance gene, and the Red helper plasmid pKD46 was cured by growth at 42 °C [38]. Primers used for confirmation are shown in Table 2.

2.3. P1 Transduction

The knock-out genes were transferred from BW25113 to W3110 by P1 phage as previously described [39]. The transductants of W3110 were selected by antibiotics.

2.4. Acid Tolerance Response (ATR) and Acid Resistance (AR) Test

For the logarithmic phase ATR test, the survival of wild-type and mutant strains was measured as previously described [23,25]. After overnight culture in LB medium with antibiotics where necessary, the cells were diluted 1000-fold with EG medium at pH 7.5 and cultured at 37 °C until the optical density at 600 nm (OD600) reached 0.3 to 0.4. Cells were collected by centrifugation at 5000× g for 4 min and pellets were suspended in a 2-fold volume of EG medium at pH 5.5 before incubation under micro-aerobic culture conditions for 4 h without shaking. The OD600 reached 0.2–0.3 after a 4 h adaptation at pH 5.5. The adapted cells were washed with fresh EG medium at pH 5.5 and then diluted 100-fold in EG medium at pH 2.5 [40]. After incubation at 37 °C for 1 h or 2 h, the cells were spun down, resuspended in phosphate-buffered saline (137 mM NaCl, 2.7 mM KCl, 4.3 mM Na2HPO4, and 1.4 mM KH2PO4, pH 7.4) and spread on LB agar plates for overnight culture. Colonies were counted, and viability was expressed as the percentage of viable cells out of the total cell number before the acidic challenge. The tests were performed in at least three independent experiments with biological triplicates.
For stationary phase AR assays, cells were grown overnight in LB buffered with either 100 mM morpholinepropanesulfonic acid (MOPS, pH 8) or 100 mM morpholineethanesulfonic acid (MES, pH 5.5) [10]. Cultures were grown in 4 mL of the buffered medium in 15-mm test tubes with shaking (220 rpm) at 37 °C to stationary phase (22 h) followed by 1:1000 dilution into prewarmed (37 °C) pH 2.5 EG. Viable-cell counts were determined at 2 h post-acid challenge by diluting cells in PBS, plating cells onto LB agar, and incubating plates at 37 °C before counting the number of colonies. Values given are representative of the results of triplicate experiments reproducible to within 50%.

2.5. ATP Content Measurement

After culturing as above, the cells were chilled on ice and then centrifuged at 10,000× g for 5 min at 4 °C. The pellets were treated with a solution containing 20 mM Tris-HCl, 50 mM MgSO4, 4 mM EDTA and 50% methanol at pH 7.4 for 30 min at 70 °C and then were centrifuged at 10,000× g for 5 min. The ATP content of the supernatant was measured as described previously by a luminometer (Turner Designs, Inc., Sunnyvale, CA, USA) [23,41,42]. Luciferase and standard ATP were purchased from Sigma.
The measurement was repeated at least three times independently, and the mean value and the standard deviation were calculated.

2.6. RNA Extraction and RNA-seq Analysis

The cells were cultured at pH 7.5 in EG medium until the OD600 reached 0.3–0.4, then spun at 10,000× g for 5 min and transferred into the same volume of fresh EG medium at either pH 7.5 or pH 5.5. After half hour incubation, total RNA was isolated using RNA-Solv reagent (Omega, Norcross, GA, USA) according to the manufacturer’s protocol. The concentration and purity of RNA were determined using the GeneQuant RNA/DNA Calculator (Pharmacia-Biotech, Cambridge, UK). The RNA samples were stored at −80 °C for the RNA-seq assay. The isolated RNA was sequenced on an Illumina HiSeq 2000 at Ribobio Co (Guangzhou, China). Reads contaminated by adapter sequence were removed from the pair end (PE) reads (30 bp) when either of the PE reads was polluted. Low quality reads (phred quality ≤19 in more than 15% of all the read bases) were further filtered out. Any reads that aligned to rRNA sequence were also filtered out. In addition, we removed reads that contained more than 5% Ns. The cleaned reads were aligned to the reference sequences in the National Center for Biotechnology Information (NCBI) database by Rockhopper v2.03 using default parameters. HTSeq v0.6.0 was utilized to calculate the co gen units of each e, and gene expression levels were represented by the Reads per Kilobase per Million reads (RPKM) method, as described by Mortazavi et al. [43]. The RNA-seq analyses were repeated in two independent experiments using three biological replicates. Differentially expressed genes (DEGs) at either pH 5.5 or pH 7.5 were identified using the DEGseq method (software: DESeq2), using a cut off of fold change > 2 and p value < 0.01.

2.7. Gene Ontology Annotation and KEGG Pathway Analysis

Gene Ontology (GO) is comprised of three aspects to describe gene functions: biological process (BP), molecular function (MF) and cellular component (CC). When performing functional enrichment analysis on the DEGs, we considered the BP branch. The Kyoto Encyclopedia of Genes and Genomes (KEGG) PATHWAY database was referenced for their maps of molecular interactions and reaction and relation networks for metabolism.
We used the online web tool DAVID [44] for functional enrichment analysis of GO using the KEGG pathways. EASE score was used to evaluate whether the DEGs were significantly enriched for a specific gene function. Benjamini–Hochberg (BH) method was used to adjust p-values for multiple comparisons. The R software programs fisher.test and p.adjust was also used. The enrichment threshold for p-value significance was set to 0.01.

2.8. Other Methods

The growth curves of all strains were measured by Bioscreen C (Oy Growth Curves Ab Ltd. Helsinki, Finland). Complementation plasmids were cloned as described previously [23]. After overnight culture in LB medium with antibiotics where necessary, the cells were diluted 500-fold with EG medium at pH 7.5 or pH 5.5 and cultured at 37 °C. Protein concentrations were measured by absorption at 595 nm using the Bradford Protein Assay (BioRad, Bradford, UK), with bovine serum albumin as the standard. The mRNA level was measured by qPCR following methods described in previous publications [21]. Primers for qPCR are listed in Table 2.

2.9. Statistics

Data were reported as mean ± standard error of the mean. Statistical significance of difference was determined by using unpaired two-tailed Student’s t-test. A value of p < 0.05 was considered to be statistically significant. One-way ANOVA(Analysis of Variance) followed by Bonferroni’s post hoc test or F-test was used to determine significant differences (p < 0.05) between groups.

3. Results

3.1. Carbonyl Cyanide 3-Chlorophenylhydrazone (CCCP) and N,N′-Dicyclohexylcarbodiimide (DCCD) Affect the ATP Level and Acid Resistance under Different Conditions

We had previously reported that E. coli mutants DK8 (deletions in all subunit genes of the FoF1-ATPase), atpE (deleted subunit c of the FoF1-ATPase) and atpD (deleted subunit β of the FoF1-ATPase) did not show significant changes in intracellular ATP concentrations under weakly acidic conditions [25]. CCCP is a protonophore and an uncoupler of oxidative phosphorylation that disrupts the cell membrane potential [45]. To test the survival of E. coli under different acidic conditions when ATP production via oxidative phosphorylation is inhibited, E. coli strain W3110 was grown in EG medium at pH 7.5 to an OD600 of 0.3 to 0.4. The cells were then steadily adapted to increasing acidic conditions by growing at pH 5.5 for 4 h and then challenging for 1 h at pH 2.5, with the addition of CCCP (30 μM) at different time points (Figure 2A). No viable cells were detected when W3110 was given CCCP during the exposure to a pH of 2.5, whether or not CCCP had also been given at pH 5.5. However, there was no significant effect on survival when CCCP was only added to cells at a pH of 5.5 (Figure 2A). Interestingly, the ATP level was only significantly decreased after the addition of CCCP at pH 7.5, with no significant decreases noted at pH 5.5 (Figure 2B).
DCCD, an inhibitor of F0F1-ATP synthase, binds to the H+-transporting acidic residue of the F0 c subunit, preventing the ATP synthesis activity of F1 [46]. We found that the survival of E. coli under extremely acidic conditions (pH 2.5) was decreased by the addition of increasing amounts of DCCD (Figure 2C). Interestingly, intracellular ATP levels were decreased at pH 7.5, but not significantly affected by DCCD at pH 5.5, except at the highest concentration (0.5 mM) (Figure 2D). Recently, it was reported that DCCD inhibits F0F1-ATPase activity during the fermentation of glycerol through a process dependent on pH and potassium ions [26,47].
These results suggest that under weakly acidic conditions, ATP production via oxidative phosphorylation is either minimal or can easily be compensated through other processes.

3.2. Global Identification and Functional Inference of Acid-Regulated Genes, and Transcription Analysis of Known Glycolysis Genes

We analyzed the changes in the transcription levels of E. coli genes and transcripts, which include most of those with known roles in functional and metabolic pathways, both before and after the adaptation of cells to mildly acidic media [5,13,48]. Our RNA-seq data showed that the majority of gene transcription was upregulated (379 genes) rather than downregulated (261 genes) in E. coli undergoing acid adaptation at pH 5.5. A total of 155 genes were induced by at least two-fold (p < 0.01, FDR < 0.05), and interestingly, 26 of those genes were induced to almost four-fold higher levels than their baseline (Figure 3A, Supplementary Table S1). By contrast, the transcription of 69 genes was decreased by two-fold or more (p < 0.01, FDR < 0.05) (Figure 3A, Supplementary Table S1). Among the induced genes, several belonged to metabolic pathways known to be associated with the AR2, AR3 and AR4 systems (Figure 3B, Supplementary Table S1 and Figure S1). Genes whose transcription was downregulated included ones associated with fatty acid oxidation, the electron transport chain, “energy derivation by oxidation of other organic compounds” and “generation of precursor metabolites producing energy”, indicating that under weakly acidic conditions, E. coli may not rely significantly upon these other systems for energy production (Figure 3C). This includes the sdhC gene, which encodes succinate dehydrogenase complex subunit C, a major component of the TCA cycle (Supplementary Figure S2).
The expression of genes encoding glycolytic enzymes such as the acetyltransferase component of the pyruvate dehydrogenase complex (AceF) was upregulated greater than two-fold, and pyruvate kinase I (PykF) was upregulated almost two-fold (Supplementary Table S1). The expression of genes in the glycolysis pathway was further tested by qPCR. The results showed that under weakly acidic conditions, pykF and glk expression was increased 2- and 1.5-fold, respectively, compared to at a neutral pH (Figure 3D). Other genes in the glycolysis pathway (pykA, pgi, pgk and pfo), and the first TCA cycle gene (gltA), were also upregulated under weakly acidic conditions (Figure 3D).
Altogether, the gene transcription data suggest that the expression of several glycolysis pathway genes increases in weakly acidic environments, and that the increased ATP content is less likely due to the induction of other metabolic pathways or reduced energy consumption.

3.3. Characteristics of E. coli Knockout Mutants in Glycolysis and TCA Cycle Genes

As glycolysis gene transcription was upregulated under weakly acid conditions, we created knockout mutants of key enzymes in the glycolytic pathway whose reactions directly catalyze ATP synthesis (pgk, pykA and pykF), as well as other glycolysis genes (pgi, glk and pfo) and the enzyme responsible for initiating the TCA cycle (gltA) [49]. Using conventional Red-mediated recombination, these genes in E. coli strain BW25113 were replaced with chloramphenicol or kanamycin resistance genes, and clones were selected on plates with the appropriate antibiotic. Individual knockouts were confirmed through PCR amplification.
The growth kinetics of these mutants under different conditions was compared. The ΔgltA and Δglk strains grew slower than the other mutants in EG medium (Figure 4A) at pH 7.5. Although ΔgltA exhibited the slowest growth rate at a neutral pH in EG (Figure 4A,C) and LB media [49], Δglk also grew to a low optical density at 600nm (OD600) in EG media at both pH 7.5 and 5.5 (Figure 4A,B). At pH 5.5, The glk mutant reached an OD600 of only 0.2 with the lowest growth rate (μ) of all the mutants, likely because this key gene is responsible for the first step in the glucose metabolism pathway. The ΔpykA and ΔpykF mutants still grew at pH 7.5 and pH 5.5 in EG medium (Figure 4), but a double-knockout mutant of both genes did not (Figure 4). ΔpykA grew slower than ΔpykF at pH 7.5 (Figure 4A,C), however, this trend was reversed at pH 5.5 (Figure 4B,D). These data indicate that the two pyruvate kinases are necessary for E. coli growth in EG medium, in which glucose is the sole energy source, and that pykF and pykA are particularly active in acidic and neutral pH environments, respectively. In EG medium at pH 5.5, Δpgk reached steady-state slowly, with a final optical density of around 0.4, almost as low as that of ΔpykF, which also shared the same μ value (Figure 4B,D). These results suggest that GltA may be important for E. coli growth. Under mildly acidic conditions, components of the glycolysis pathway (Glk, Pgk and PykF) take on a more important role. Other mutants such as Δpgi and Δpfo showed no effect on the growth of E. coli compared to wild type strain. Our results indicate that the metabolism of glucose by E. coli in different pH environments may be mediated by different glycolytic enzymes.

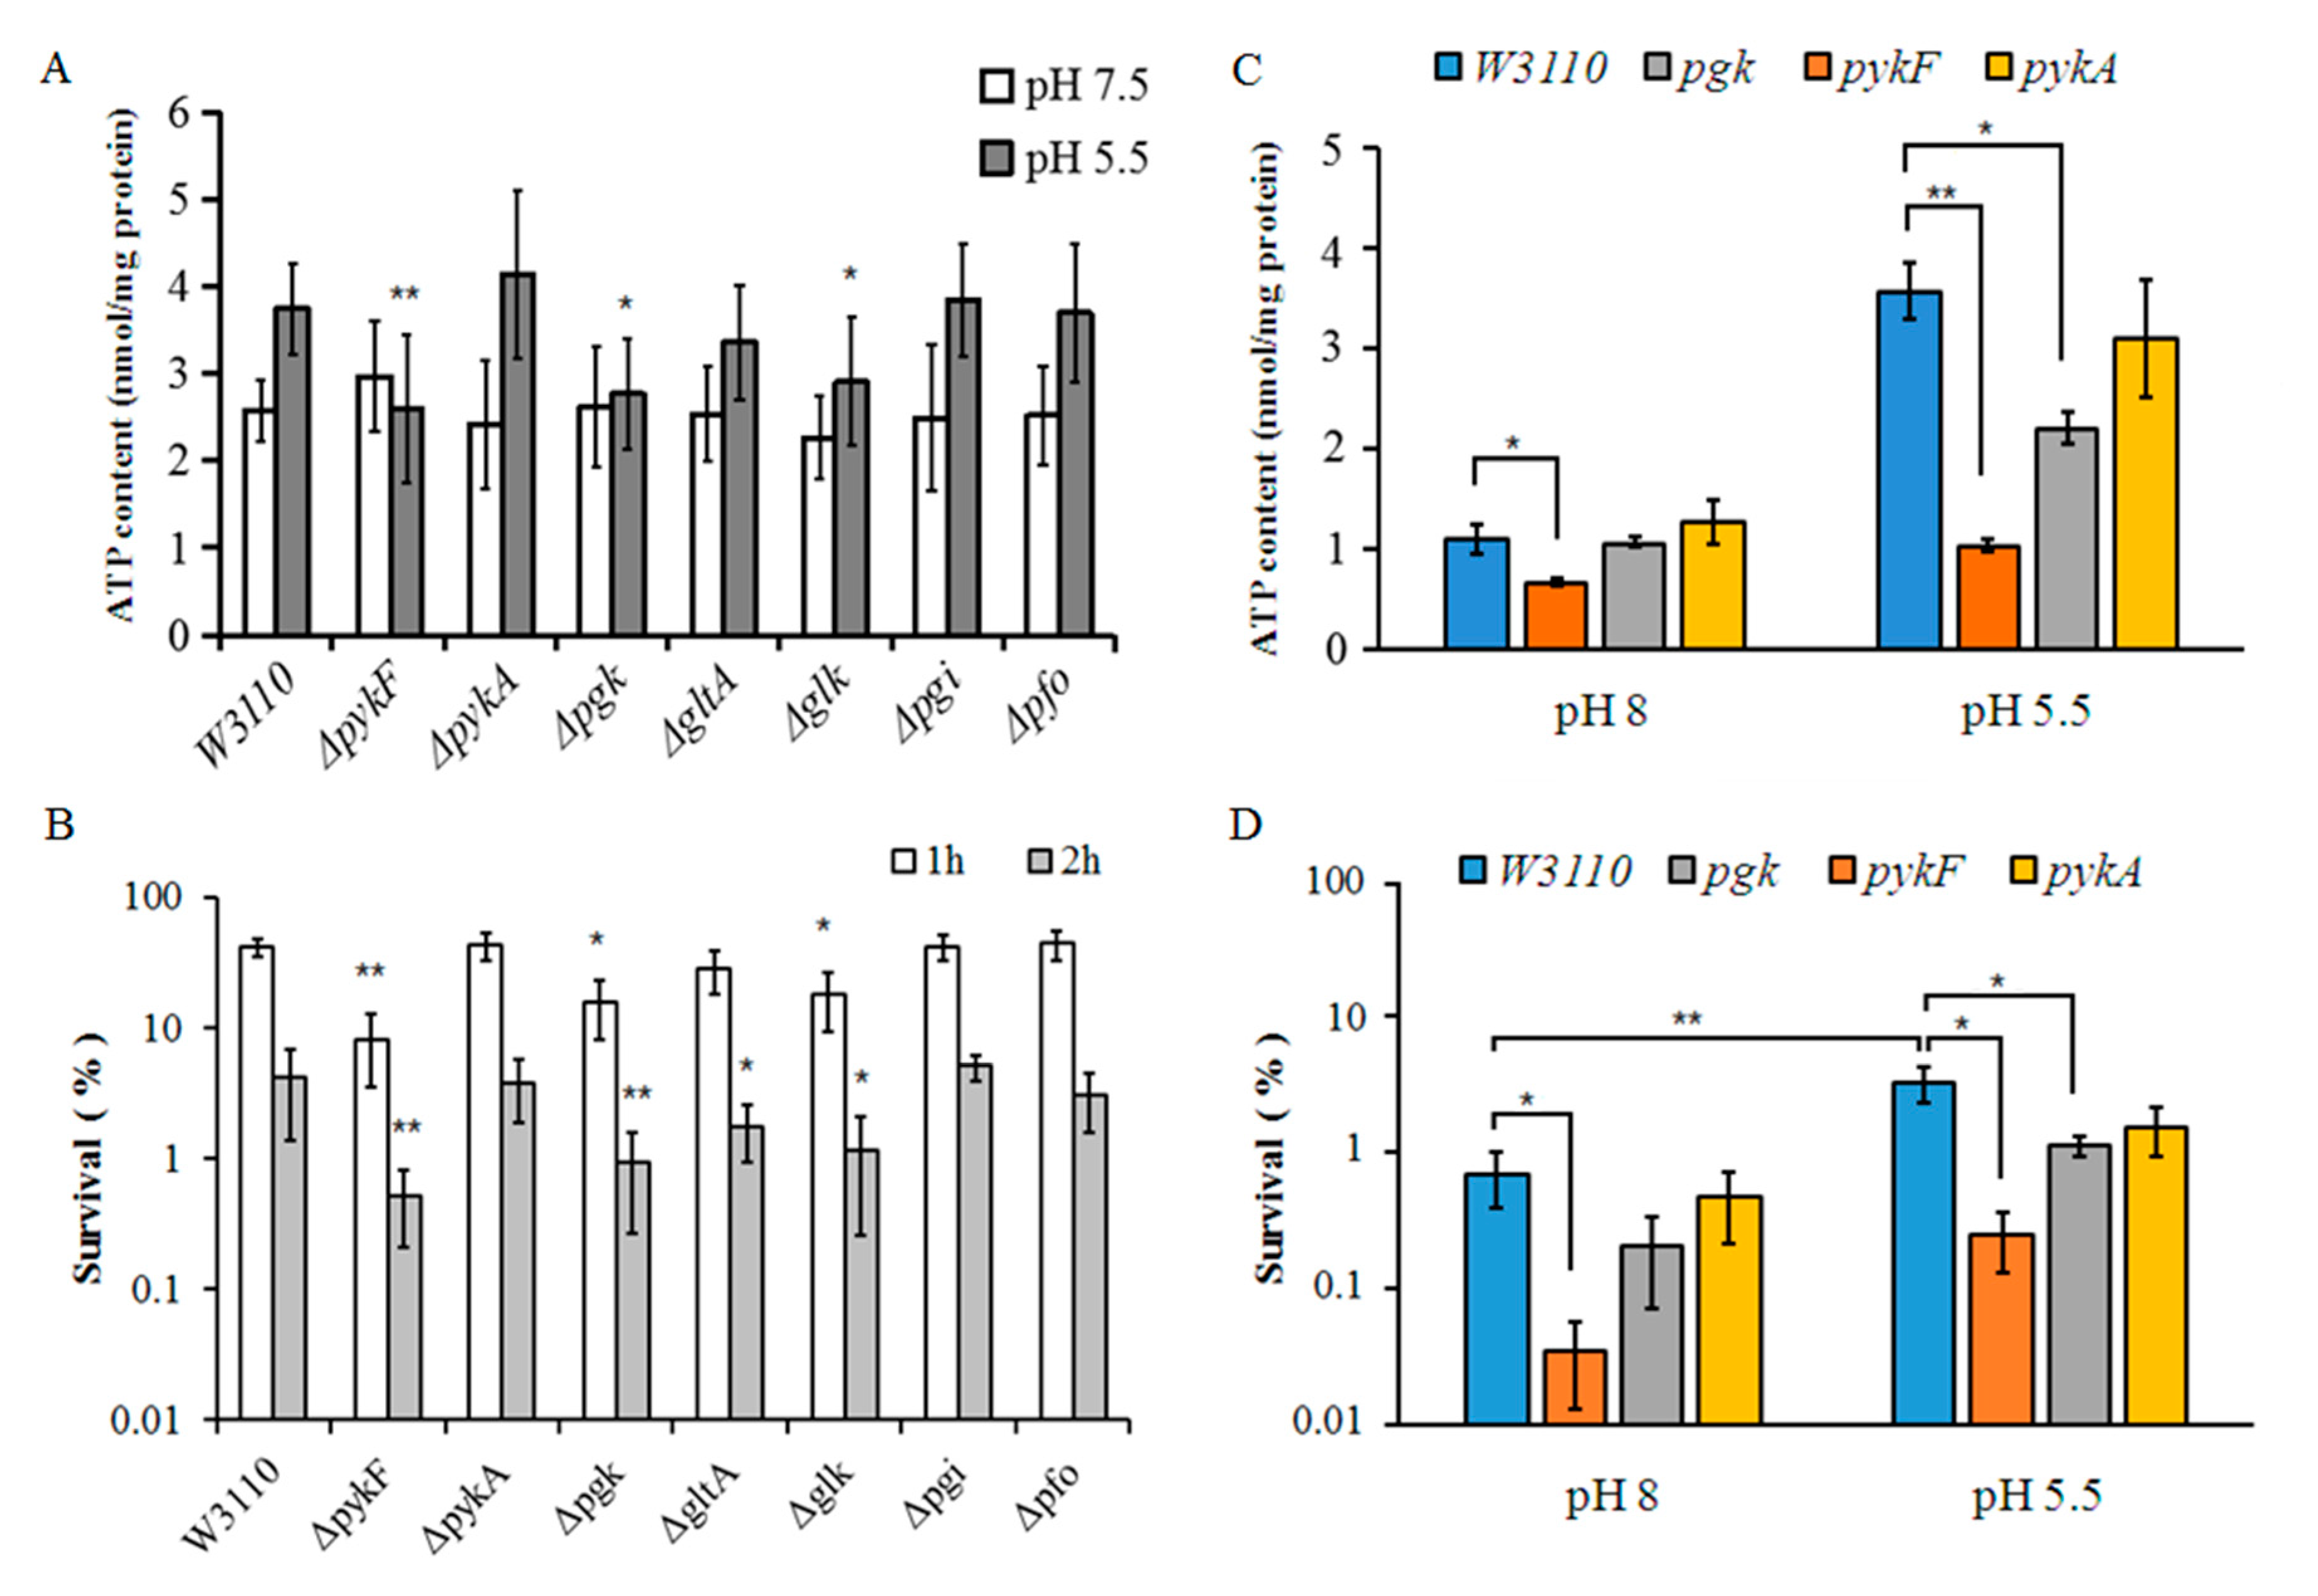
3.4. Comparisons of ATP Levels between Different Mutant Strains under Weakly Acidic Conditions

It was noted that the ATP concentration in E. coli was increased after adaptation to weakly acidic conditions [23]. To investigate which glycolysis pathway genes are important for this process, we compared the ATP content in our knockout mutants and the wild-type strain W3110 at pH 7.5 and pH 5.5 in EG medium (Figure 5A). The increase in ATP after adaptation to pH 5.5 was slightly higher in ΔpykA compared to W3110. The gltA mutant showed a slightly higher ATP content after acid adaptation, however, it did not reach the level seen in W3110.
In contrast to the effect seen in W3110, adaptation to pH 5.5 resulted in a drop in ATP level for deletion mutants Δglk, ΔpykF and Δpgk. The Δglk mutant also showed significantly lower ATP content compared to W3110 at pH 7.5. Complementation using plasmids harboring the pykF and pgk genes resulted in wild-type ATP levels in their respective deletion mutants (Figure 6A).
These results indicate that the glycolysis pathway is the main source of ATP production in E. coli in acidic environments. In addition, the enzymes encoded by pgk and pykF may be important for increasing ATP synthesis under weakly acidic conditions. It is possible that an alternative metabolic system produces ATP in pgk and pykF mutants, but it may be less active or fail to increase ATP under acidic conditions.

3.5. Comparisons of Acid Resistance between Different Mutant Strains

As ATP content is important for E. coli survival in extremely acidic environments, these mutants were also tested for acid resistance. Survival after the acid challenge was reduced in all strains, but compared to the wild-type, the effect was particularly significant in glk, pgk and pykF mutants, with a smaller difference seen in the gltA mutant (Figure 5B). Complementation in mutants, Δpgk and ΔpykF with their respective plasmids restored the level of AR to that of the wild-type strain (Figure 6B). Together with our previous results, these data show that the glycolysis genes glk, pgk and pykF participate in regulating ATP levels in E. coli to enable their survival upon acid challenge.
We next examined whether these genes also affect acid resistance for cells in the stationary phase of growth. When the mutants were grown to stationary phase at pH 8 and then challenged for 2 h at pH 2.5, only ΔpykF showed significantly decreased survival (p < 0.05) (Figure 5C). When the mutants were grown to stationary phase at pH 5.5 before challenging for 2 h at pH 2.5, both the pykF and pgk mutants showed lower survival. We noted that wild-type cells normally had a higher ATP content at pH 5.5 than that at pH 8 at the stationary phase. However, the intracellular ATP level of ΔpykF was significantly decreased in the stationary phase at both pH 8 and pH 5.5 (Figure 5D), while the pgk mutant showed a significantly decreased level only when grown to stationary phase at pH 5.5. These results confirmed that the glycolysis pathway mainly functions to supply ATP at a weakly acidic pH.
To further investigate whether these mutants primarily affect AR and ATP levels through the glycolysis pathway, fructose and pyruvate were used to bypass the glk and pykF mutations. The data showed that 0.2% fructose added to 0.2% glucose could restore ATP levels and cell survival of glk mutants under extremely acidic conditions (Figure 6C,D). However, 0.4% pyruvate added to 0.2% glucose as a carbon source was unable to rescue pykF mutants, and even wild-type W3110 showed lower ATP levels and lower survival (Figure 6D). These results confirm that genes in the glycolysis pathway, particularly those with a role in ATP generation, are responsible for keeping ATP levels elevated in weakly acidic environments.

4. Discussion

Gut bacteria primarily enter the human intestinal tract through the stomach, whose acidic environment might initially be buffered to a pH of up to 6.0 depending what other contents are being digested. After approximately 4 h, the pH gradually decreases to 2.5, granting the bacteria time to activate their acid resistance genes and adapt [50]. During this period of adaptation to weakly acidic conditions, E. coli was found to have an elevated ATP level, which is believed to play an important role in AR [23].
The concentration of ATP in E. coli cells is known to increase in response to certain stresses, such as the change in osmotic pressure and environmental pH [23,51]. The pykA gene was reported to negatively regulate ATP levels under anaerobic conditions [32]. The availability of ATP during adaptation to acidic conditions becomes increasingly more important for survival as the pH decreases [23]. This could be explained by an increased demand for energy as new mechanisms are activated to counteract the hostile environment and keep the cytoplasmic space at a constant pH [52,53]. However, these systems no longer fully compensate after the pH drops below 6, as the intracellular compartment will begin to acidify at that point [53]. For this reason, we selected a pH of 5.5 as our experimental condition for growth under a mildly acidic challenge [54].
Whether the increase in ATP levels during acid adaptation is a direct result of increased production (and if so, by which pathway), or through limiting the energy consumption of nonvital systems, was previously unclear. Our analysis showed that gene transcription was upregulated rather than downregulated in E. coli undergoing acid adaptation, suggesting that the mechanism is not via a reduction in ATP use. Furthermore, genes related to transcription were more upregulated than those related to translation under these conditions. The ATP content also correlated directly with the growth of different mutants and the wild type strain (Figure 4 and Figure 5).
Our results show that the glycolytic enzymes encoded by pykF and pgk provide the primary supply of ATP to E. coli under weakly acidic conditions. In addition, the gene expression level of AceF, a component of the pyruvate dehydrogenase complex, was also increased more than two-fold during acid adaptation. Similarly, the levels of enzymes involved in glucose metabolism pathways, including glucokinase (Glk), as well as the expression of pyruvate ferredoxin oxidoreductase (Pfo), were increased under acidic conditions. The deletion of glk showed significant effects on both AR and the ATP level, likely because Glk mediates the initial step of the glycolysis pathway and is a key enzyme. Its deletion may also affect the downstream ATP production from PykF and Pgk. By contrast, when we treated E. coli with CCCP to disrupt the membrane potential, the ATP level decreased only slightly during acid adaptation, revealing that oxidative phosphorylation is not a major supplier of ATP under these conditions, despite the fact that at near-neutral pH values, it is the main producer of ATP. E. coli treated with DCCD also showed no significant change in ATP level at pH 5.5, which is in agreement with our ATPase mutant data [25]. This was also supported by our RNA-seq data showing that the transcription of genes associated with respiration was downregulated in weakly acidic growth conditions. The transcription of genes in the fatty acid and lipid oxidation pathways, as well as those related to energy derivation by oxidation of other organic compounds or the generation of precursor metabolites, were also downregulated during adaptation to weakly acidic media (Figure 3C).
Our data suggest that glycolysis is the main pathway that supplies ATP at pH 5.5 and the metabolism of glucose by E. coli in different pH environments may be mediated by different glycolytic enzymes. ΔpykA grew slower than ΔpykF at pH 7.5 (Figure 4A), but, this trend was reversed at pH 5.5 (Figure 4B). Δglk grew at the slowest rate in EG media at both pH 7.5 and 5.5, yet it may be supported by other glucose metabolism pathways. For example, Roseman et al. reported that when glucose is taken up by E. coli, it can be converted to glucose 6-phosphate by phosphotransferase [55]. However, this enzyme activity may be inhibited by a low pH.
Our experiments also showed that the addition of pyruvate, the end-product of glycolysis, could not rescue pykF mutants or even wild-type W3110 at pH 5.5 even when 0.2% glucose was present as a carbon source (Figure 6C,D). In fact, it may be that pyruvate itself negatively impacts E. coli survival under extremely acidic conditions. Pyruvate is normally further metabolized to lactic acid, acetic acid, alanine, or acetyl-CoA through the TCA cycle [56,57]. We showed that adaptation to mildly acidic media (pH 5.5) resulted in a two-fold upregulated expression of the aceF pyruvate dehydrogenase gene and the lactate dehydrogenase ldhA gene (Supplementary Table S1). Acetyl-CoA is converted into acetate, coenzyme A, and ATP via the enzymes phosphotransacetylase (Pta) and acetate kinase (AckA). One study showed that the deletion of ackA and pta increased the survival of E. coli [58]. Others have found that when excess glucose is converted to acetate (as also happens with the addition of pyruvate or during phosphate starvation), it can partially uncouple and deplete the proton motive force (PMF), causing cell death under extremely acidic conditions [59,60,61]. In E. coli, The ATPase may pump out protons to regulate the intracellular pH [2], which could also compensate for the decrease in the PMF otherwise mediated by the respiratory chain. In our own experiments, we also observed that the addition of acetate decreased the survival of E. coli in extremely acidic conditions. It remains unclear whether this negative impact on survival is related to decreased efficiency in ATP production or to its direct effects on the PMF. GadY, which encodes a small RNA, has been reported to decrease acetate production [62] and our results showed that GadY was upregulated under weakly acidic conditions (Supplementary Table S1). These data could suggest that pyruvate metabolism under acidic conditions may be through the lactate pathway rather than the TCA cycle or acetate pathway.
It is generally accepted that amino acid decarboxylation can regulate intracellular pH in acidic environments [1,18]. Cells containing more ATP showed a higher intracellular pH (pHi) and greater cell survival in pH 2.5 medium than cells with a low ATP concentration [23]. Amino acids could help maintain the intracellular ATP level and increase cell survival [23]. Proton consumption by hydrogenase-3 in E. coli has been implicated in the ability to survive under extremely acidic and anaerobic conditions [63]. ATP may have multiple effects on acid resistance, with the different ATPases hydrolyzing it and regulating the pHi under different conditions [2,25,26]. We previously reported on a DNA repair system which uses ATP as the substrate, and is necessary for E. coli survival at a very low pH [23]. While the mechanism by which ATP helps E. coli survive extremely acidic environments remains unknown, the importance of maintaining an elevated level while growing under such conditions is clear.
Our analysis revealed that other metabolic processes can also be affected by acidic environments. Apt was highly upregulated, suggesting that adenosine nucleotides may be synthesized more actively under these conditions. Interestingly, this is in line with our previous study showing that PurA and PurB are important for AR [23]. The expression of genes associated with biofilms (MinD) and quorom sensing (LuxS) was also increased (Supplementary Table S1) [64,65], indicating that these processes may also be affected by environmental pH. The expression level of gadX [66] was increased at a weakly acidic pH, which was regulated by RpoS (Supplementary Table S1).

5. Conclusions

In this study, we demonstrated that glk, pykF and pgk were necessary for the rise in ATP under weakly acidic conditions and for survival in markedly acidic environments (typically pH 1.5–3.5). In contrast, the metabolic pathways related to oxidative phosphorylation, fatty acid oxidation and energy derivation by oxidation of other organic compounds were downregulated. The inhibition of oxidative phosphorylation did not affect the ATP increase at pH 5.5. These results showed that glycolysis is the primary source of the elevated ATP levels seen in E. coli grown under weakly acidic conditions.

Supplementary Materials

The following are available online at https://www.mdpi.com/2073-4425/11/9/991/s1, Figure S1: The up- and down-regulated genes in amino acid metabolic pathway, Figure S2: The up- and down-regulated genes in the TCA cycle, Table S1: Folds change of differential expression genes between pH 7.5 and pH 5.5.

Author Contributions

Y.S. designed the study and wrote the manuscript. W.Z., W.S., and T.N. performed the experiments. X.C. analyzed the RNA-seq data. N.Q. revised the manuscript. All authors contributed to read and approved the revised manuscript.

Funding

This work was supported by the National Natural Science Foundation of China (31301019) and grants from the Guangdong province of China (2014A010107024, 2017A030303065, 2018A0303130080).

Acknowledgments

We are grateful to Hiroshi Kobayashi (Graduate School of Pharmaceutical Sciences, Chiba University, Japan) and Haihong Wang (Guangdong Provincial Key Laboratory of Protein Function and Regulation in Agricultural Organisms, College of Life Sciences, South China Agricultural University, Guangzhou, Guangdong, China) for critical reading of this manuscript.

Conflicts of Interest

The authors declare no conflict of interest.

References

  1. Lund, P.; Tramonti, A.; De Biase, D. Coping with low pH: Molecular strategies in neutralophilic bacteria. FEMS Microbiol. Rev. 2014, 38, 1091–1125. [Google Scholar] [CrossRef] [PubMed] [Green Version]
  2. Foster, J.W. Escherichia coli acid resistance: Tales of an amateur acidophile. Nat. Rev. Microbiol. 2004, 2, 898–907. [Google Scholar] [CrossRef] [PubMed]
  3. Hobbs, E.C.; Astarita, J.L.; Storz, G. Small RNAs and small proteins involved in resistance to cell envelope stress and acid shock in Escherichia coli: Analysis of a bar-coded mutant collection. J. Bacteriol. 2010, 192, 59–67. [Google Scholar] [CrossRef] [PubMed] [Green Version]
  4. Leyer, G.J.; Wang, L.L.; Johnson, E.A. Acid adaptation of Escherichia coli O157:H7 increases survival in acidic foods. Appl. Environ. Microbiol. 1995, 61, 3752–3755. [Google Scholar] [CrossRef] [PubMed] [Green Version]
  5. Maurer, L.M.; Yohannes, E.; Bondurant, S.S.; Radmacher, M.; Slonczewski, J.L. pH regulates genes for flagellar motility, catabolism, and oxidative stress in Escherichia coli K-12. J. Bacteriol. 2005, 187, 304–319. [Google Scholar] [CrossRef] [Green Version]
  6. Seo, S.W.; Kim, D.; O′Brien, E.J.; Szubin, R.; Palsson, B.O. Decoding genome-wide GadEWX-transcriptional regulatory networks reveals multifaceted cellular responses to acid stress in Escherichia coli. Nat. Commun. 2015, 6, 7970. [Google Scholar] [CrossRef]
  7. Richard, H.; Foster, J.W. Escherichia coli glutamate- and arginine-dependent acid resistance systems increase internal pH and reverse transmembrane potential. J. Bacteriol. 2004, 186, 6032–6041. [Google Scholar] [CrossRef] [Green Version]
  8. De Biase, D.; Lund, P.A. The Escherichia coli Acid Stress Response and Its Significance for Pathogenesis. Adv. Appl. Microbiol. 2015, 92, 49–88. [Google Scholar]
  9. Castanie-Cornet, M.-P.; Penfound, T.A.; Smith, D.; Elliott, J.F.; Foster, J.W. Control of Acid Resistance in Escherichia coli. J. Bacteriol. 1999, 181, 3525. [Google Scholar] [CrossRef] [Green Version]
  10. Price, S.B.; Cheng, C.M.; Kaspar, C.W.; Wright, J.C.; DeGraves, F.J.; Penfound, T.A.; Castanie-Cornet, M.P.; Foster, J.W. Role of rpoS in acid resistance and fecal shedding of Escherichia coli O157:H7. Appl. Environ. Microbiol. 2000, 66, 632–637. [Google Scholar] [CrossRef] [Green Version]
  11. Castanie-Cornet, M.P.; Foster, J.W. Escherichia coli acid resistance: cAMP receptor protein and a 20 bp cis-acting sequence control pH and stationary phase expression of the gadA and gadBC glutamate decarboxylase genes. Microbiology 2001, 147, 709–715. [Google Scholar] [CrossRef] [PubMed] [Green Version]
  12. Hersh, B.M.; Farooq, F.T.; Barstad, D.N.; Blankenhorn, D.L.; Slonczewski, J.L. A glutamate-dependent acid resistance gene in Escherichia coli. J. Bacteriol. 1996, 178, 3978–3981. [Google Scholar] [CrossRef] [PubMed] [Green Version]
  13. Masuda, N.; Church, G.M. Regulatory network of acid resistance genes in Escherichia coli. Mol. Microbiol. 2003, 48, 699–712. [Google Scholar] [CrossRef] [PubMed]
  14. Meng, S.Y.; Bennett, G.N. Nucleotide sequence of the Escherichia coli cad operon: A system for neutralization of low extracellular pH. J. Bacteriol. 1992, 174, 2659–2669. [Google Scholar] [CrossRef] [Green Version]
  15. Meng, S.Y.; Bennett, G.N. Regulation of the Escherichia coli cad operon: Location of a site required for acid induction. J. Bacteriol. 1992, 174, 2670–2678. [Google Scholar] [CrossRef] [Green Version]
  16. Gong, S.; Richard, H.; Foster, J.W. YjdE (AdiC) is the Arginine: Agmatine antiporter essential for arginine-dependent acid resistance in Escherichia coli. J. Bacteriol. 2003, 185, 4402–4409. [Google Scholar] [CrossRef] [Green Version]
  17. Vazquez-Juarez, R.C.; Kuriakose, J.A.; Rasko, D.A.; Ritchie, J.M.; Kendall, M.M.; Slater, T.M.; Sinha, M.; Luxon, B.A.; Popov, V.L.; Waldor, M.K.; et al. CadA negatively regulates Escherichia coli O157:H7 adherence and intestinal colonization. Infect. Immun. 2008, 76, 5072–5081. [Google Scholar] [CrossRef] [Green Version]
  18. Lu, P.; Ma, D.; Chen, Y.; Guo, Y.; Chen, G.-Q.; Deng, H.; Shi, Y. L-glutamine provides acid resistance for Escherichia coli through enzymatic release of ammonia. Cell Res. 2013, 23, 635–644. [Google Scholar] [CrossRef] [Green Version]
  19. Ma, D.; Lu, P.; Shi, Y. Substrate Selectivity of the Acid-activated Glutamate/γ-Aminobutyric acid (GABA) Antiporter GadC from Escherichia coli. J. Biol. Chem. 2013, 288, 15148–15153. [Google Scholar] [CrossRef] [Green Version]
  20. Tramonti, A.; De Canio, M.; Delany, I.; Scarlato, V.; De Biase, D. Mechanisms of transcription activation exerted by GadX and GadW at the gadA and gadBC gene promoters of the glutamate-Based acid resistance system in Escherichia coli. J. Bacteriol. 2006, 188, 8118. [Google Scholar] [CrossRef] [Green Version]
  21. Sun, Y.; Fukamachi, T.; Saito, H.; Kobayashi, H. Adenosine deamination increases the survival under acidic conditions in Escherichia coli. J. Appl. Microbiol. 2012, 112, 775–781. [Google Scholar] [CrossRef]
  22. Pennacchietti, E.; D′Alonzo, C.; Freddi, L.; Occhialini, A.; De Biase, D. The Glutaminase-Dependent Acid Resistance System: Qualitative and Quantitative Assays and Analysis of Its Distribution in Enteric Bacteria. Front. Microbiol. 2018, 9, 2869. [Google Scholar] [CrossRef] [PubMed] [Green Version]
  23. Sun, Y.; Fukamachi, T.; Saito, H.; Kobayashi, H. ATP requirement for acidic resistance in Escherichia coli. J. Bacteriol. 2011, 193, 3072–3077. [Google Scholar] [CrossRef] [PubMed] [Green Version]
  24. Sato, M.; Machida, K.; Arikado, E.; Saito, H.; Kakegawa, T.; Kobayashi, H. Expression of outer membrane proteins in Escherichia coli growing at acid pH. Appl. Environ. Microbiol. 2000, 66, 943–947. [Google Scholar] [CrossRef] [PubMed] [Green Version]
  25. Sun, Y.; Fukamachi, T.; Saito, H.; Kobayashi, H. Respiration and the F(1)Fo-ATPase enhance survival under acidic conditions in Escherichia coli. PLoS ONE 2012, 7, e52577. [Google Scholar] [CrossRef] [PubMed] [Green Version]
  26. Trchounian, A.; Trchounian, K. Fermentation Revisited: How Do Microorganisms Survive Under Energy-Limited Conditions? Trends Biochem. Sci. 2019, 44, 391–400. [Google Scholar] [CrossRef]
  27. Bardey, V.; Vallet, C.; Robas, N.; Charpentier, B.; Thouvenot, B.; Mougin, A.; Hajnsdorf, E.; Regnier, P.; Springer, M.; Branlant, C. Characterization of the molecular mechanisms involved in the differential production of erythrose-4-phosphate dehydrogenase, 3-phosphoglycerate kinase and class II fructose-1,6-bisphosphate aldolase in Escherichia coli. Mol. Microbiol. 2005, 57, 1265–1287. [Google Scholar] [CrossRef]
  28. Young, T.A.; Skordalakes, E.; Marqusee, S. Comparison of proteolytic susceptibility in phosphoglycerate kinases from yeast and E. coli: Modulation of conformational ensembles without altering structure or stability. J. Mol. Biol. 2007, 368, 1438–1447. [Google Scholar] [CrossRef]
  29. Cunningham, D.S.; Liu, Z.; Domagalski, N.; Koepsel, R.R.; Ataai, M.M.; Domach, M.M. Pyruvate kinase-deficient Escherichia coli exhibits increased plasmid copy number and cyclic AMP levels. J. Bacteriol. 2009, 191, 3041–3049. [Google Scholar] [CrossRef] [Green Version]
  30. Soellner, S.; Rahnert, M.; Siemann-Herzberg, M.; Takors, R.; Altenbuchner, J. Evolution of pyruvate kinase-deficient Escherichia coli mutants enables glycerol-based cell growth and succinate production. J. Appl. Microbiol. 2013, 115, 1368–1378. [Google Scholar] [CrossRef]
  31. Donovan, K.A.; Zhu, S.; Liuni, P.; Peng, F.; Kessans, S.A.; Wilson, D.J.; Dobson, R.C. Conformational Dynamics and Allostery in Pyruvate Kinase. J. Biol. Chem. 2016, 291, 9244–9256. [Google Scholar] [CrossRef] [Green Version]
  32. Zhao, C.; Lin, Z.; Dong, H.; Zhang, Y.; Li, Y. Reexamination of the Physiological Role of PykA in Escherichia coli Revealed that It Negatively Regulates the Intracellular ATP Levels under Anaerobic Conditions. Appl. Environ. Microbiol. 2017, 83, e00316–e00317. [Google Scholar] [CrossRef] [Green Version]
  33. Bhayana, V.; Duckworth, H.W. Amino acid sequence of Escherichia coli citrate synthase. Biochemistry 1984, 23, 2900–2905. [Google Scholar] [CrossRef] [PubMed] [Green Version]
  34. Picossi, S.; Belitsky, B.R.; Sonenshein, A.L. Molecular mechanism of the regulation of Bacillus subtilis gltAB expression by GltC. J. Mol. Biol. 2007, 365, 1298–1313. [Google Scholar] [CrossRef] [PubMed] [Green Version]
  35. Jensen, K.F. The Escherichia coli K-12 “wild types” W3110 and MG1655 have an rph frameshift mutation that leads to pyrimidine starvation due to low pyrE expression levels. J. Bacteriol. 1993, 175, 3401–3407. [Google Scholar] [CrossRef] [PubMed] [Green Version]
  36. Sun, Y.; Zhang, W.; Ma, J.; Pang, H.; Wang, H. Overproduction of alpha-Lipoic Acid by Gene Manipulated Escherichia coli. PLoS ONE 2017, 12, e0169369. [Google Scholar] [CrossRef]
  37. Datsenko, K.A.; Wanner, B.L. One-step inactivation of chromosomal genes in Escherichia coli K-12 using PCR products. Proc. Natl. Acad. Sci. USA 2000, 97, 6640–6645. [Google Scholar] [CrossRef] [Green Version]
  38. Yang, J.; Sun, B.; Huang, H.; Jiang, Y.; Diao, L.; Chen, B.; Xu, C.; Wang, X.; Liu, J.; Jiang, W.; et al. High-efficiency scarless genetic modification in Escherichia coli by using lambda red recombination and I-SceI cleavage. Appl. Environ. Microbiol. 2014, 80, 3826–3834. [Google Scholar] [CrossRef] [Green Version]
  39. Zeph, L.R.; Onaga, M.A.; Stotzky, G. Transduction of Escherichia coli by bacteriophage P1 in soil. Appl. Environ. Microbiol. 1988, 54, 1731–1737. [Google Scholar] [CrossRef] [Green Version]
  40. Lin, J.; Lee, I.S.; Frey, J.; Slonczewski, J.L.; Foster, J.W. Comparative analysis of extreme acid survival in Salmonella typhimurium, Shigella flexneri, and Escherichia coli. J. Bacteriol. 1995, 177, 4097–4104. [Google Scholar] [CrossRef] [Green Version]
  41. Lasko, D.R.; Wang, D.I. In situ fermentation monitoring with recombinant firefly luciferase. Biotechnol. Bioeng. 1993, 42, 30–36. [Google Scholar] [CrossRef] [PubMed]
  42. Maharjan, R.P.; Ferenci, T. Global metabolite analysis: The influence of extraction methodology on metabolome profiles of Escherichia coli. Anal. Biochem. 2003, 313, 145–154. [Google Scholar] [CrossRef]
  43. Mortazavi, A.; Williams, B.A.; McCue, K.; Schaeffer, L.; Wold, B. Mapping and quantifying mammalian transcriptomes by RNA-Seq. Nat. Methods 2008, 5, 621–628. [Google Scholar] [CrossRef] [PubMed]
  44. Huang da, W.; Sherman, B.T.; Lempicki, R.A. Systematic and integrative analysis of large gene lists using DAVID bioinformatics resources. Nat. Protoc. 2009, 4, 44–57. [Google Scholar] [CrossRef]
  45. Ghoul, M.; Pommepuy, M.; Moillo-Batt, A.; Cormier, M. Effect of carbonyl cyanide m-chlorophenylhydrazone on Escherichia coli halotolerance. Appl. Environ. Microbiol. 1989, 55, 1040–1043. [Google Scholar] [CrossRef] [Green Version]
  46. Araki, M.; Hoshi, K.; Fujiwara, M.; Sasaki, Y.; Yonezawa, H.; Senpuku, H.; Iwamoto-Kihara, A.; Maeda, M. Complementation of the Fo c Subunit of Escherichia coli with That of Streptococcus mutans and Properties of the Hybrid FOF1 ATP Synthase. J. Bacteriol. 2013, 195, 4873. [Google Scholar] [CrossRef] [Green Version]
  47. Karapetyan, L.; Valle, A.; Bolivar, J.; Trchounian, A.; Trchounian, K. Evidence for Escherichia coli DcuD carrier dependent FOF1-ATPase activity during fermentation of glycerol. Sci. Rep. 2019, 9, 4279. [Google Scholar] [CrossRef] [Green Version]
  48. Stincone, A.; Daudi, N.; Rahman, A.S.; Antczak, P.; Henderson, I.; Cole, J.; Johnson, M.D.; Lund, P.; Falciani, F. A systems biology approach sheds new light on Escherichia coli acid resistance. Nucleic Acids Res. 2011, 39, 7512–7528. [Google Scholar] [CrossRef] [Green Version]
  49. Richards, G.R.; Patel, M.V.; Lloyd, C.R.; Vanderpool, C.K. Depletion of glycolytic intermediates plays a key role in glucose-phosphate stress in Escherichia coli. J. Bacteriol. 2013, 195, 4816–4825. [Google Scholar] [CrossRef] [Green Version]
  50. Russell, T.L.; Berardi, R.R.; Barnett, J.L.; Dermentzoglou, L.C.; Jarvenpaa, K.M.; Schmaltz, S.P.; Dressman, J.B. Upper gastrointestinal pH in seventy-nine healthy, elderly, North American men and women. Pharm. Res. 1993, 10, 187–196. [Google Scholar] [CrossRef] [Green Version]
  51. Ohwada, T.; Sagisaka, S.; Sato, T. An Exclusive Increase in the Concentration of ATP as a Result of Osmotic Stress in Escherichia coli B. Biosci. Biotechnol. Biochem. 1994, 58, 1512–1513. [Google Scholar] [CrossRef] [Green Version]
  52. Suzuki, T.; Kobayashi, H. Regulation of the cytoplasmic pH by a proton-translocating ATPase in Streptococcus faecalis (faecium). A computer simulation. Eur. J. Biochem. 1989, 180, 467–471. [Google Scholar] [CrossRef] [PubMed]
  53. Krulwich, T.A.; Sachs, G.; Padan, E. Molecular aspects of bacterial pH sensing and homeostasis. Nat. Rev. Microbiol. 2011, 9, 330–343. [Google Scholar] [CrossRef] [PubMed] [Green Version]
  54. Mugikura, S.; Nishikawa, M.; Igarashi, K.; Kobayashi, H. Maintenance of a Neutral Cytoplasmic pH Is Not Obligatory for Growth of Escherichia coli and Streptococcus faecalis at an Alkaline pH. J. Biochem. 1990, 108, 86–91. [Google Scholar] [CrossRef] [PubMed]
  55. Comb, D.G.; Roseman, S. Glucosamine 6-phosphate deaminase from Escherichia coli: Glucosamine 6-phosphate + H2O ⇄ Fructose 6-phosphate + NH3. Methods Enzymol. 1962, 5, 422–426. [Google Scholar]
  56. Lee, M.; Smith, G.M.; Eiteman, M.A.; Altman, E. Aerobic production of alanine by Escherichia coli aceF ldhA mutants expressing the Bacillus sphaericus alaD gene. Appl. Microbiol. Biotechnol. 2004, 65, 56–60. [Google Scholar] [CrossRef]
  57. De Mets, F.; Van Melderen, L.; Gottesman, S. Regulation of acetate metabolism and coordination with the TCA cycle via a processed small RNA. Proc. Natl. Acad. Sci. USA 2019, 116, 1043–1052. [Google Scholar] [CrossRef] [Green Version]
  58. Wu, J.; Li, Y.; Cai, Z.; Jin, Y. Pyruvate-associated acid resistance in bacteria. Appl. Environ. Microbiol. 2014, 80, 4108–4113. [Google Scholar] [CrossRef] [Green Version]
  59. Diez-Gonzalez, F.; Russell, J.B. The ability of Escherichia coli O157:H7 to decrease its intracellular pH and resist the toxicity of acetic acid. Microbiology 1997, 143, 1175–1180. [Google Scholar] [CrossRef] [Green Version]
  60. Moreau, P.L.; Loiseau, L. Characterization of acetic acid-detoxifying Escherichia coli evolved under phosphate starvation conditions. Microb. Cell Fact. 2016, 15, 42. [Google Scholar] [CrossRef] [Green Version]
  61. Bae, Y.M.; Lee, S.Y. Effect of salt addition on acid resistance response of Escherichia coli O157:H7 against acetic acid. Food Microbiol. 2017, 65, 74–82. [Google Scholar] [CrossRef]
  62. Negrete, A.; Shiloach, J. Constitutive expression of the sRNA GadY decreases acetate production and improves E. coli growth. Microb. Cell Fact. 2015, 14, 148. [Google Scholar] [CrossRef] [PubMed] [Green Version]
  63. Noguchi, K.; Riggins, D.P.; Eldahan, K.C.; Kitko, R.D.; Slonczewski, J.L. Hydrogenase-3 contributes to anaerobic acid resistance of Escherichia coli. PLoS ONE 2010, 5, e10132. [Google Scholar] [CrossRef] [PubMed]
  64. Xu, L.; Li, H.; Vuong, C.; Vadyvaloo, V.; Wang, J.; Yao, Y.; Otto, M.; Gao, Q. Role of the luxS quorum-sensing system in biofilm formation and virulence of Staphylococcus epidermidis. Infect. Immun. 2006, 74, 488–496. [Google Scholar] [CrossRef] [PubMed] [Green Version]
  65. Niba, E.T.; Naka, Y.; Nagase, M.; Mori, H.; Kitakawa, M. A genome-wide approach to identify the genes involved in biofilm formation in E. coli. DNA Res. 2007, 14, 237–246. [Google Scholar] [CrossRef]
  66. Tramonti, A.; Visca, P.; De Canio, M.; Falconi, M.; De Biase, D. Functional characterization and regulation of gadX, a gene encoding an AraC/XylS-like transcriptional activator of the Escherichia coli glutamic acid decarboxylase system. J. Bacteriol. 2002, 184, 2603–2613. [Google Scholar] [CrossRef] [Green Version]
Figure 1. Outline of glycolysis and the initiation of the tricarboxylic acid (TCA) cycle. The 10 steps of glycolysis (outlined in red): step 1, hexokinase (Glk); step 2, glucose-6-phosphate isomerase (Pgi); step 3, phosphofructokinase-1 (PfkA); step 4, fructose 6-phosphate, fructose-bisphosphate aldolase (FbaA); triose-phosphate isomerase (TpiA); step 5, glyceraldehyde 3-phosphate dehydrogenase (GapA); step 6, phosphoglycerate kinase (Pgk); step 7, phosphoglycerate mutase (GpmA); step 8, phosphopyruvate hydratase (Eno); step 9, pyruvate kinase (PykA/PykF); step 10, pyruvate dehydrogenase (Pfo). Citrate synthase (GltA) catalyzes the initial step in the TCA cycle. P: phosphate; BP: bisphosphate.
Genes 11 00991 g001
Figure 2. The effect of carbonyl cyanide 3-chlorophenylhydrazone (CCCP) and N,N′-Dicyclohexylcarbodiimide (DCCD) on cells survival and ATP levels in E. coli. (A) W3110 cells were adapted for 4 h at pH 5.5 before challenging for 1 h at pH 2.5. CCCP was added at adaptation (pH 5.5) and challenge (pH 2.5) as indicated (N.D., not detected). (1) Control: W3110 without CCCP at both pH 2.5 and pH 5.5; (2) CCCP was added at pH 5.5, then cells were collected, washed twice and transferred to pH 2.5 for challenge; (3) CCCP was added both at pH 5.5 and pH 2.5; (4) CCCP was added only at pH 2.5. (B) The ATP content was measured after W3110 cells were incubated at pH 5.5 and pH 7.5 for 4 h with and without CCCP (viable cell number~5 × 10⁷/Ml). (C) W3110 cells were adapted for 4 h at pH 5.5 before challenging for 1 h at pH 2.5. DCCD was added at different concentrations as indicated. (D) The ATP content was measured after W3110 cells were incubated at pH 5.5 and pH 7.5 for 4 h with and without DCCD. The average values and standard deviations were obtained from three experiments. Comparisons are made between samples with and without CCCP or DCCD for both survival and ATP content after 1h of challenge. (** p < 0.01; * p < 0.05).
Genes 11 00991 g002
Figure 3. The transcription profile and Gene Ontology (GO) enrichment analysis of differentially expressed genes and gene expression in the glycolysis pathway. (A) Volcano plot representing the significance of the changes in gene expression from adaptation at pH 5.5 to 7.5. The red points represent upregulated genes, while blue points represent downregulated genes (fold change > 2, p < 0.01). The grey dots are the genes not differentially expressed. (B) Gene expression in the glycolysis pathway. The mRNA level of genes was measured by real-time PCR. The relative amount of gene mRNA to 16S rRNA was calculated. The values represent means ± standard deviations of the relative amounts obtained from three independent experiments. (C,D) The numbers of differentially transcribed genes for each GO term (biological process) are plotted. (C) GO terms enriched for upregulated genes. (D) GO terms enriched for downregulated genes. GO statistics were computed using the DAVID database.
Genes 11 00991 g003
Figure 4. Growth characteristics of wild-type W3110 and gene knockout mutants. (A) Growth curves of different E. coli strains in EG medium at pH 7.5. The optical densities at 600 nm (OD600) were measured. (B) Growth curves of different E. coli strains in EG medium at pH 5.5. OD600 values represent the average of three separate experiments. (C) Specific growth rate (µ) of E. coli wild-type and mutants at pH 7.5. (D) Specific growth rate (µ) of E. coli wild-type and mutants at pH 5.5. N.D.: not detected. All OD600 and µ values represent the average of three separate experiments. Comparisons are made between the individual mutants and WT(wild type), asterisk (*) indicates p-value < 0.05, two asterisk (**) indicates p-value < 0.01, three asterisk (***) indicates p-value < 0.001.
Genes 11 00991 g004
Figure 5. ATP concentration and acid resistance in wild-type W3110 and gene knockout mutants. (A) The concentration of ATP isolated from different E. coli strains at different pH values in EG medium. (B) Cells survival in different E. coli mutants and WT strain W3110. The average values and standard deviations obtained from three separate experiments are represented. (C) The concentration of ATP isolated from different E. coli strains at different pH values at stationary phase. (D) Acid resistance in different E. coli mutants and WT strain W3110 at stationary phase. Comparisons are made between the individual mutants and WT for both the survival and ATP content after 1h or 2hr challenge. (** p < 0.01; * p < 0.05).
Genes 11 00991 g005
Figure 6. ATP level and cells survival after complementing or bypassing pgk and pyk knock-out mutations. (A) ATP levels after complementation of pgk and pyk knock-out mutants. (B) AR of pgk and pyk knock-out mutations complemented by plasmids (‘+‘) or not (“no plasmid”). (C) ATP levels at pH 5.5 after bypassing the glk and pykF mutations by using either fructose or pyruvate as the half of carbon source (0.2% glucose and 0.2% fructose or 0.4% pyruvate). (D) AR of cells bypassing the glk and pykF mutations. + Plasmid: W3110 harboring the pBAD24 vector; W3110∆pykF harboring pBAD24 with the pykF gene, and W3110∆pgk harboring pBAD24 with the pgk gene. Fructose: Fructose was added in E medium at a concentration of 0.2% with 0.2% glucose as the carbon source; Pyruvate: Pyruvate was added in E medium at a concentration of 0.4% and 0.2% glucose as the carbon source. N.D.: not detected. The average values and standard deviations obtained from three separate experiments are represented. Comparisons are made as indicated after 2 h challenge: ** p < 0.01; * p < 0.05.
Genes 11 00991 g006
Table 1. Bacterial strains and plasmids used in this study.
Strains or PlasmidsGenotype or DescriptionSource or Reference
Strains
W3110λ F derived from E. coli K-12[34]
BW25113lacIqrrnBT14 ΔlacZWJ16hsdR514
ΔaraBADAH33ΔrhaBADLD78
[36]
SZ001BW25113 pgk::CmrThis study
SZ002BW25113 pykA::CmrThis study
SZ003BW25113 pykF::KmrThis study
SZ004BW25113 pykA:Cmr pykF::KmrThis study
SZ005BW25113 gltA::CmrThis study
SZ006BW25113 pgi::CmrThis study
SZ007BW25113 pfo::CmrThis study
SZ008BW25113 glk::CmrThis study
WB001W3110 pgk::CmrThis study, W3110 × P1 (SZ001)
WB002W3110 pykA::CmrThis study, W3110 × P1 (SZ002)
WB003W3110 pykF::KmrThis study, W3110 × P1 (SZ003)
WB004W3110 gltA::CmrThis study, W3110 × P1 (SZ004)
WB005W3110 pykA::Cmr pykF::KmrThis study, W3110 × P1 (SZ005)
WB006W3110 pgi::CmrThis study, W3110 × P1 (SZ006)
WB007W3110 pfo::CmrThis study, W3110 × P1 (SZ007)
WB008W3110 glk::CmrThis study, W3110 × P1 (SZ008)
Plasmids
pKD3bla, FRT, Cmr[36]
pKD4bla, FRT, Kmr[36]
pKD46bla, araC, gam-bet-exo[36]
(1) Kmr, resistant to kanamycin. Cmr, resistant to chloroamphenicol. (2) X P1, P1 transduction from BW25113.
Table 2. Primers used in this study.
Primer NameSequence(5′→3′)
pykAP1ATTTCATTCGGATTTCATGTTCAAGCAACACCTGGTTGTTTCAGTCAACGGAGTATTACTGTGTAGGCTGGAGCTGCTTCG
pykAP2TGTTGAACTATCATTGAACTGTAGGCCGGATGTGGCGTTTTC
GCCGCATCCGGCAACGTACCATATGAATATCCTCCTTAG
pykFP1GCAGTGCGCCCAGAAAGCAAGTTTCTCCCATCCTTCTCAACTTAAAGACTAAGACTGTCTGTGTAGGCTGGAGCTGCTTCG
pykFP2TTAAATAAAAAAAGCGCCCATCAGGGCGCTTCGATATACAAATTAATTCACAAAAGCAATACATATGAATATCCTCCTTAG
gltAP1TGCGAAGGCAAATTTAAGTTCCGGCAGTCTTACGCAATAAG
GCGCTAAGGAGACCTTAATGTGTAGGCTGGAGCTGCTTCG
gltA P2AAAAATCAACCCGCCATATGAACGGCGGGTTAAAATATTTACAACTTAGCAATCAACCACATATGAATATCCTCCTTAG
pgk P1TTTCAGGTAAGACGCAAGCAGCGTCTGCAAAACTTTTAGAATCAACGAGAGGATTCACCTGTGTAGGCTGGAGCTGCTTCG
pgk P2AAAAATTGCGTGCTCTAAAAGCGCGCTGAAACAAGGGCAGGTTTCCCTGCCCTGTGATTTTCATATGAATATCCTCCTTAG
pgi p1GTGACTGGCGCTACAATCTTCCAAAGTCACAATTCTCAAAATCAGAAGAGTATTGCTATGTGTAGGCTGGAGCTGCTTCG
pgi p2TCAGGCATCGGTTGCCGGATGCGGCGTGAACGCCTTATCCGGCCTACATATCGACGATGACATATGAATATCCTCCTTAG
glk p1ATGACAAAGTATGCATTAGTCGGTGATGTGGGCGGCACCAACGCACGTCTTGCTCTGTGTGTAGGCTGGAGCTGCTTCG
glk p2TACAGAATGTGACCTAAGGTCTGGCGTAAATGTGCACCGGAACCGAGAAGGCCCGGCATATGAATATCCTCCTTAG
pfo p1TTTCGTGCGCCCCTCATTTGCGCAATGTAAGGGTGTCATATGATTACTATTGACGGTAATTGTGTAGGCTGGAGCTGCTTCG
pfo p2TTTAGAATTGGATAATCCTTATCCAGAGCATTTAATCGGTGTT
GCTTTTCATATGAATATCCTCCTTAG
check for pgk KOCCAATGAAGTCAACCTGTTGC
check for gltA KOGATCCAGGTCACGATAACAAC
check for pykA KOGAAGCAACGCTGGCAATTAC
check for pykF KOCTGTAGCAATTGAGCGATG
check for pgi KOCAGAGCGATACTTCGCTACTA
check for glk KOCCGCAATACCCGTTAGCGTT
check for pfo KOCTTCCTCTGATCTTCAAGCC
Km inboxGTGAGATGACAGGAGATCCTG
Cm inboxTCTTGCCCGCCTGATGAATGCTC
RT-glk FCTGTATTGCCATCGCTTGCC
RT-glk RTTACCTTCGACCGGTTCTGC
RT-pgi FTTCATCGCTCCGGCTATCAC
RT-pgi RCCAGGCTGAACGGAGTGATT
RT-pfkA FTACATGGGTGCAATGCGTCT
RT-pfkA RTAACGGCCCATCACTTCCAC
RT-fbaA FACTCCATCAACGCCGTACTG
RT-fbaA RCAGTGGTCAGTGTGCAGGAT
RT-tpiA FGCAAAACGTGGACCTGAACC
RT-tpiA RATGCACAGAACCGGAGTCAG
RT-gapA FTTGACCTGACCGTTCGTCTG
RT-gapA RGAAGTGCAAACTTCGCCGTT
RT-pgk FCTCTCTGCTGCCGGTTGTTA
RT-pgk RGCCTTTGTTGAAGCGAACGT
RT-gpmA FATCATCGCTGCACACGGTAA
RT-gpmA RGCGATCTCGTCAGCATTACC
RT-eno FTGGCGCGAAAACTGTGAAAG
RT-eno RTGAACGCTTTGTTGCCTTCG
RT-pykA FTCGCCTCTGACGTGGTAATG
RT-pykA FGCATCACAGCGTCAGTACCA
RT-pykF FGAACAGCCGTCTCGAGTTCA
RT-pykF RTTAACAAGCTGCGGCACAAC
RT-pfo FTTGCCACACATGCACTCTCT
RT-pfo RCCTGCGGCATGAGATCAAGA
RT-gltA FCGCATCCAATGGCAGTCATG
RT-gltA RTTGCGCGGGTAAACAAATGG
RT-16S FTACCGCATAACGTCGCAAGA
RT-16S RAGTCTGGACCGTGTCTCAGT

