
The Role of the Trabecular Bone Score in the Assessment of Osteoarticular Disorders in Patients with HFE-Hemochromatosis: A Single-Center Study from Poland


Abstract
:1. Introduction
2. Materials and Methods
- Serum calcium (Ca) concentrations, determined by spectrophotometry; the reference standard was 8.9–10.00 mg/dL.
- Serum phosphorus (Pi) concentration, determined by spectrophotometry; the reference standard was 2.3–4.7 mg/dL;
- Serum osteocalcin concentration, determined by the immunochemiluminescence method (ChLIA); the norms were 3.1–13.7 ng/mL;
- Serum vitamin 25-OH-D3 concentration, determined by the ChLIA method; the norms were 30–80 ng/mL;
- Serum intact parathyroid hormone (PTH int) concentration, determined by the ChLIA method; the norms were 4.6–58.1 pg/mL;
- Alkaline phosphatase (FALK) activity, determined by spectrophotometry; the norms were 44–115 U/L;
- Calcium excretion with diurnal urine (uCa), determined by spectrophotometry; the norms were 100–300 mg/24 h.
- DXA result of the femur;
- Age;
- Gender;
- Body weight;
- Growth;
- Clinical risk factors for fractures:
- Previous fracture;
- Broken hip in family history (parents);
- Coexisting diseases, including chronic liver disease;
- Use of glucocorticoids;
- Smoking;
- Alcohol consumption.
Statistical Methods
3. Results
3.1. Description of the Study Group
3.2. Osteoporosis and Parameters of Calcium and Phosphate Metabolism
3.3. Joint Pain
4. Discussion
5. Conclusions
Supplementary Materials
Author Contributions
Funding
Institutional Review Board Statement
Informed Consent Statement
Conflicts of Interest
References
- Sikorska, K.; Bielawski, K.P.; Romanowski, T.; Stalke, P. Hereditary hemochromatosis: The most frequent inherited human disease. Postepy Hig. I Med. Dosw. 2006, 60, 667–676. [Google Scholar]
- Niederau, C.; Fischer, R.; Purschel, A.; Stremmel, W.; Haussinger, D.; Strohmeyer, G. Long-term survival in patients with hereditary hemochromatosis. Gastroenterology 1996, 110, 1107–1119. [Google Scholar] [CrossRef]
- Niederau, C.; Fischer, R.; Sonnenberg, A. Survival and causes of death in cirrhotic and in noncirrhotic patients with primary hemochromatosis. N. Engl. J. Med. 1985, 313, 1256–1262. [Google Scholar] [CrossRef] [PubMed]
- McDonnell, S.M.; Preston, B.L.; Jewell, S.A.; Barton, J.C.; Edwards, C.Q.; Adams, P.C.; Yip, R. A survey of 2851 patients with hemochromatosis. Am. J. Med. 1999, 106, 619–624. [Google Scholar] [CrossRef]
- Milman, N.; Pedersen, P.; Steig, T.; Byg, K.E.; Graudal, N.; Fenger, K. Clinically overt hereditary hemochromatosis in Denmark 1948–1985: Epidemiology, factors of significance for long-term survival, and causes of death in 179 patients. Ann. Hematol. 2001, 80, 737–744. [Google Scholar] [CrossRef] [PubMed]
- Camacho, A.; Funck-Brentano, T.; Simão, M.; Cancela, L.; Ottaviani, S.; Cohen-Solal, M.; Richette, P. Effect of C282Y genotype on self-reported musculoskeletal complications in hereditary hemochromatosis. PLoS ONE 2015, 10, e0122817. [Google Scholar] [CrossRef] [PubMed]
- Richette, P.; Ottaviani, S.; Vicaut, E.; Bardin, T. Musculoskeletal complications of hereditary hemochromatosis: A case-control study. J. Rheumatol. 2010, 37, 2145–2150. [Google Scholar] [CrossRef]
- Kröner, P.T.; Mareth, K.F.; Wijarnpreecha, K.; Palmer, W.C. Hereditary hemochromatosis is associated with increased use of joint replacement surgery: Results of a nationwide analysis. Semin. Arthritis Rheum. 2020, 50, 360–365. [Google Scholar] [CrossRef]
- Kanis, J.A.; Melton, L.J.; Christiansen, C.; Johnston, C.C.; Khaltaev, N. The diagnosis of osteoporosis. J. Bone Miner. Res. 2009, 9, 1137–1141. [Google Scholar] [CrossRef]
- Czerwinski, E.; Osieleniec, J.; Kumorek, A. Frax®–Nowe Narzędzie w Diagnostyce Osteoporozy. Available online: http://www.kcm.pl (accessed on 21 August 2016). (In Polish).
- Cauley, J.A.; El-Hajj Fuleihan, G.; Arabi, A.; Fujiwara, S.; Ragi-Eis, S.; Calderon, A.; Chionh, S.B.; Chen, Z.; Curtis, J.R.; Danielson, M.E.; et al. Official Positions for FRAX® Clinical Regarding International Differences. J. Clin. Densitom. 2011, 14, 240–262. [Google Scholar] [CrossRef]
- Seeman, E. Bone quality: The material and structural basis of bone strength. J. Bone Miner. Metab. 2008, 26, 1–8. [Google Scholar] [CrossRef]
- Hans, D.; Goertzen, A.L.; Krieg, M.-A.; Leslie, W.D. Bone microarchitecture assessed by TBS predicts osteoporotic fractures independent of bone density: The manitoba study. J. Bone Miner. Res. 2011, 26, 2762–2769. [Google Scholar] [CrossRef]
- Silva, B.C.; Leslie, W.D.; Resch, H.; Lamy, O.; Lesnyak, O.; Binkley, N.; McCloskey, E.V.; Kanis, J.A.; Bilezikian, J.P. Trabecular Bone Score: A Noninvasive Analytical Method Based Upon the DXA Image. J. Bone Miner. Res. 2014, 29, 518–530. [Google Scholar] [CrossRef]
- Sikorska, K.; Stalke, P.; Jaskiewicz, K.; Romanowski, T.; Bielawski, K.P. Could iron deposits in hepatocytes serve as a prognostic marker of HFE gene mutations? Hepatogastroenterology 2008, 55, 1024–1028. [Google Scholar]
- European Associacion for the Study of the Liver. EASL Clinical Practice Guidelines for HFE Hemochromatosis. J. Hepatol. 2010, 53, 3–22. [Google Scholar] [CrossRef]
- Patil, I. Visualizations with statistical details: The ‘ggstatsplot’ approach. J. Open Source Softw. 2021, 61, 3167. [Google Scholar] [CrossRef]
- Balogh, E.; Paragh, G.; Jeney, V. Influence of Iron on Bone Homeostasis. Pharmaceuticals 2018, 11, 107. [Google Scholar] [CrossRef] [PubMed] [Green Version]
- Valenti, L.; Varenna, M.; Fracanzani, A.L.; Rossi, V.; Fargion, S.; Sinigaglia, L. Association between iron overload and osteoporosis in patients with hereditary hemochromatosis. Osteoporos. Int. 2009, 20, 549–555. [Google Scholar] [CrossRef] [PubMed]
- Guggenbuhl, P.; Deugnier, A.Y.; Boisdet, A.J.F.; Rolland, A.Y.; Perdriger, A.; Pawlotsky, Y.; Chalès, G. Bone mineral density in men with genetic hemochromatosis and HFE gene mutation. Osteoporos. Int. 2005, 16, 1809–1814. [Google Scholar] [CrossRef] [PubMed]
- Karoli, Y.; Karoli, R.; Fatima, J.; Manhar, M. Study of Hepatic Osteodystrophy in Patients with Chronic Liver Disease. J. Clin. Diagn. Res. JCDR 2016, 10, OC31–OC34. [Google Scholar] [CrossRef] [PubMed]
- Messer, J.G.; Kilbarger, A.K.; Erikson, K.M.; Kipp, D.E. Iron overload alters iron-regulatory genes and proteins, down-regulates osteoblastic phenotype, and is associated with apoptosis in fetal rat calvaria cultures. Bone 2009, 45, 972–979. [Google Scholar] [CrossRef] [PubMed] [Green Version]
- Yamasaki, K.; Hagiwara, H. Excess iron inhibits osteoblast metabolism. Toxicol. Lett. 2009, 191, 211–215. [Google Scholar] [CrossRef] [PubMed]
- Kudo, H.; Suzuki, S.; Watanabe, A.; Kikuchi, H.; Sassa, S.; Sakamoto, S. Effects of colloidal iron overload on renal and hepatic siderosis and the femur in male rats. Toxicology 2008, 246, 143–1477. [Google Scholar] [CrossRef]
- Doyard, M.; Chappard, D.; Leroyer, P.; Roth, M.-P.; Loréal, O.; Guggenbuhl, P. Decreased Bone Formation Explains Osteoporosis in a Genetic Mouse Model of Hemochromatosiss. PLoS ONE 2016, 11, e0148292. [Google Scholar] [CrossRef] [Green Version]
- Jandl, N.M.; Rolvien, T.; Schmidt, T.; Mussawy, H.; Nielsen, P.; Oheim, R.; Amling, M.; Barvenck, F. Impaired Bone Microarchitecture in Patients with Hereditary Hemochromatosis and Skeletal Complications. Calcif. Tissue Int. 2020, 106, 465–475. [Google Scholar] [CrossRef] [Green Version]
- Chow, L.H.; Frei, J.V.; Hodsman, A.B.; VAlberg, L.S. Low serum 25-Hydroxyvitamin D in Hereditary Hemochromatosis: Relation to Iron Status. Gastroenterology 1985, 88, 856–859. [Google Scholar] [CrossRef]
- Charzewska, J.; Chlebna-Sokół, D.; Chybicka, A.; Czech Kowalska, J.; Dobrzańska, A.; Helwich, E.; Imiela, J.R.; Karczmarewicz, E.; Księżyk, J.B.; Lewiński, A.; et al. Aktualne polskie zalecenia dotyczące profilaktyki niedoboru witaminy D. Med. Prakt. Pediatr. 2010, 1, 40–46. (In Polish) [Google Scholar]


| Mean | Me | Min–Max | |
|---|---|---|---|
| Age at study entry (years) | 53.14 | 55 | 25–73 |
| Age at diagnosis (years) | 45.10 | 46 | 23–70 |
| Number of phlebotomies | 25 | 14.5 | 1–178 |
| Maximum ferritin concentration (women ref. standards 15–200 µg/L; men 150–300 µg/L) | 1014 | 800 | 126–3550 |
| Average ferritin concentration (μg/L) | 601.70 | 358 | 60–2183 |
| ALT (0–41 U/L) | 40 | 34 | 12–117 |
| AST (0–40 U/L) | 31.83 | 28 | 8–77 |
| Transferrin saturation (20–40%) | 86.59 | 90 | 60–100 |
| Study Group | Control Group | Difference | ||||||||||
|---|---|---|---|---|---|---|---|---|---|---|---|---|
| N | Mean ± SEM | Q1 | Me | Q3 | N | Mean ± SEM | Q1 | Me | Q3 | Stat | p | |
| BMD femur | 29 | 0.83 ± 0.02 | 0.73 | 0.81 | 0.90 | 19 | 0.82 ± 0.02 | 0.73 | 0.80 | 0.95 | 0.19 a | 0.846 |
| BMD lumbar spine | 28 | 1.01 ± 0.03 | 0.90 | 1.03 | 1.13 | 19 | 1.05 ± 0.04 | 0.91 | 1.08 | 1.18 | 0.67 a | 0.508 |
| BMD forearm | 29 | 0.73 ± 0.02 | 0.65 | 0.74 | 0.82 | 19 | 0,73 ± 0.02 | 0.64 | 0.74 | 0.81 | 0.13 a | 0.897 |
| TBS | 28 | 1.29 ± 0.03 | 1.19 | 1.30 | 1.40 | 19 | 1.38 ± 0.03 | 1.31 | 1.40 | 1.50 | 361 b | 0.040 |
| FRAX major (%) | 29 | 4.71 ± 1.23 | 1.0 | 3.2 | 4.7 | 19 | 2.42 ± 0.54 | 0.75 | 1.4 | 3.45 | 200.5 b | 0.116 |
| FRAX femur (%) | 29 | 0.61 ± 0.19 | 0.1 | 0.3 | 0.6 | 19 | 0.37 ± 0.14 | 0.0 | 0.1 | 0.3 | 210.5 b | 0.166 |
| Ca (mg/dL) | 27 | 9.62 ± 0.07 | 9.3 | 9.7 | 9.9 | 20 | 9.79 ± 0.09 | 9.57 | 9.79 | 10.02 | 336 b | 0.156 |
| Pi (mg/dL) | 27 | 3.11 ± 0.09 | 2.85 | 3.1 | 3.4 | 20 | 3.1 ± 0.14 | 2.67 | 3.05 | 3.6 | 0.06 a | 0.954 |
| 25-OH-D3 (ng/mL) | 27 | 22.5 ± 2.04 | 15.2 | 23 | 29 | 19 | 29.88 ± 2.15 | 23.1 | 30 | 36.35 | 2.49 a | 0.017 |
| FALK (U/L) | 27 | 76.04 ± 7.45 | 50 | 66 | 89 | 20 | 66.05 ± 3.80 | 53.25 | 66 | 78.25 | 261.5 b | 0.863 |
| Calcium urine excretion (mg/24 h) | 24 | 153.1 ± 14.91 | 107.5 | 118.5 | 185 | 19 | 155.2 ± 17.28 | 103 | 138 | 204.5 | 237 b | 0.835 |
| Osteocalcin (ng/mL) | 22 | 5.19 ± 0.63 | 3.05 | 4.1 | 6.35 | 18 | 5.71 ± 0.67 | 3.25 | 4.9 | 6.875 | 229.5 b | 0.399 |
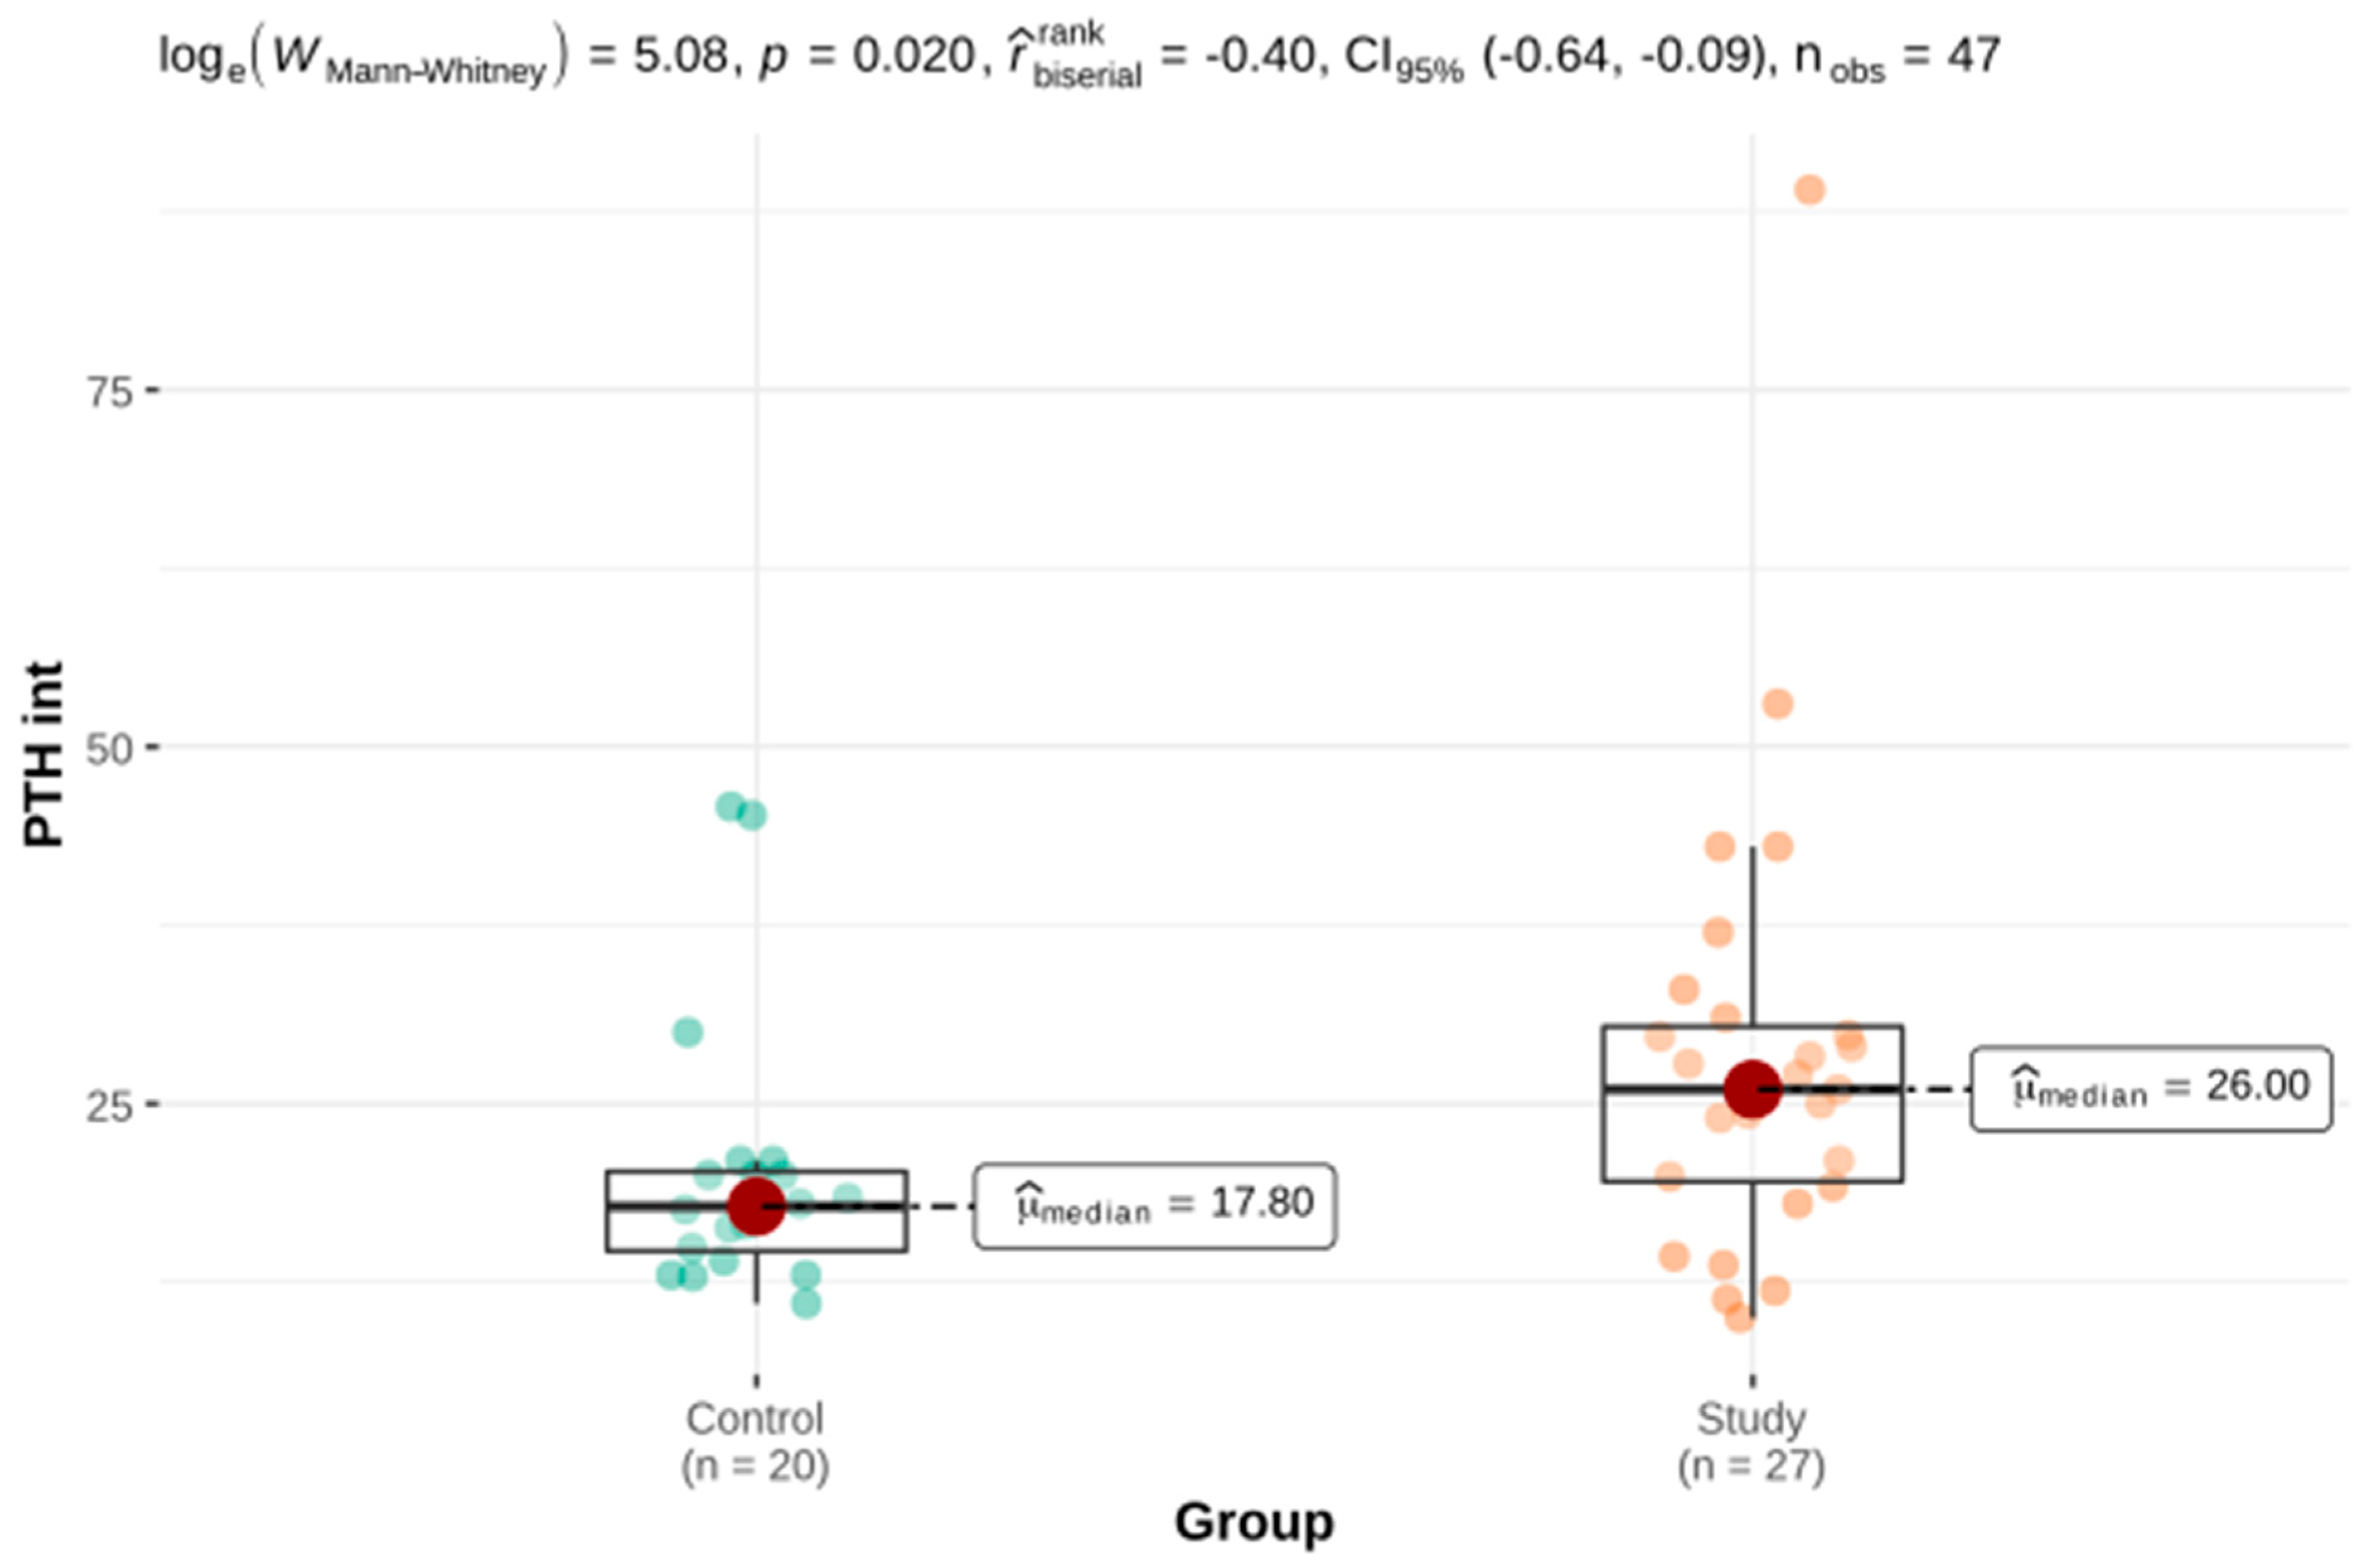
| PTH int (pg/mL) | 27 | 28.31 ± 3.05 | 19.55 | 26 | 30.40 | 20 | 20.3 ± 2.14 | 14.68 | 17.8 | 20.25 | 161.5 b | 0.020 |
| Osteoporosis/Osteopenia | No Osteoporosis/Osteopenia | Difference | ||||||||||
|---|---|---|---|---|---|---|---|---|---|---|---|---|
| N | Mean ± SEM | Q1 | Me | Q3 | N | Mean ± SEM | Q1 | Me | Q3 | U | p | |
| GGTP (U/L) | 12 | 32.75 ± 5.78 | 19.0 | 32.75 | 37.75 | 15 | 47.67 ± 12.29 | 23.5 | 35 | 49.5 | 102 | 0.574 |
| Bilirubin (mg/dL) | 12 | 0.86 ± 0.13 | 0.6 | 0.75 | 0.925 | 15 | 0.78 ± 0.05 | 0.67 | 0.73 | 0.8 | 88 | 0.941 |
| AST (U/L) | 12 | 27.92 ± 3.35 | 21.25 | 24.5 | 30.75 | 16 | 330.06 ± 4.59 | 19.75 | 29.5 | 39 | 109.5 | 0.545 |
| ALT (U/L) | 12 | 33.17 ± 5.99 | 14.75 | 22 | 51.75 | 16 | 43.81 ± 7.78 | 20.75 | 35 | 56.25 | 115.5 | 0.378 |
| Ferritin max (μg/L) | 12 | 1101.6 ± 327.43 | 402.5 | 712.5 | 1065 | 16 | 949 ± 187.46 | 481 | 725 | 1094 | 96.5 | 0.999 |
| Ferritin average (μg/L) | 12 | 604.2 ± 168.96 | 247.8 | 377.5 | 659.5 | 16 | 604.9 ± 149.41 | 289.8 | 337.5 | 568.8 | 99 | 0.907 |
| FALK (U/L) | 12 | 90.25 ± 14.12 | 56.75 | 76 | 94 | 14 | 62.5 ± 6.44 | 48 | 55 | 68.25 | 46.5 | 0.057 |
| Fe (μg/dL) | 12 | 199.7 ± 16.27 | 194.8 | 212 | 224.8 | 16 | 235.2 ± 8.88 | 205 | 238.5 | 261.5 | 131.5 | 0.104 |
| Transferrin sat. (%) | 12 | 87.67 ± 3.49 | 85 | 90.5 | 95.75 | 16 | 85.75 ± 2.99 | 77.5 | 90 | 93.5 | 85.5 | 0.641 |
| PTH int (pg/mL) | 12 | 26.81 ± 3.28 | 17.98 | 27.5 | 34 | 14 | 30.34 ± 5.19 | 21.75 | 26.5 | 28.82 | 80 | 0.857 |
| Ca (mg/dL) | 12 | 9.62 ± 0.12 | 9.375 | 9.65 | 9.925 | 14 | 9.62 ± 0.10 | 9.3 | 9.75 | 9.875 | 81 | 0.897 |
| Pi (mg/dL) | 12 | 3.02 ± 0.13 | 2.825 | 3.05 | 3.15 | 14 | 3.2 ± 0.12 | 2.85 | 3.1 | 3.5 | 100.5 | 0.408 |
| 25-OH-D3 (ng/mL) | 12 | 24.51 ± 2.72 | 16.25 | 25.5 | 30.02 | 14 | 20.67 ± 3.17 | 12.4 | 20.5 | 25.0 | 60 | 0.226 |
Publisher’s Note: MDPI stays neutral with regard to jurisdictional claims in published maps and institutional affiliations. |
© 2021 by the authors. Licensee MDPI, Basel, Switzerland. This article is an open access article distributed under the terms and conditions of the Creative Commons Attribution (CC BY) license (https://creativecommons.org/licenses/by/4.0/).
Share and Cite
Banaszkiewicz, K.; Sikorska, K.; Panas, D.; Sworczak, K. The Role of the Trabecular Bone Score in the Assessment of Osteoarticular Disorders in Patients with HFE-Hemochromatosis: A Single-Center Study from Poland. Genes 2021, 12, 1304. https://doi.org/10.3390/genes12091304
Banaszkiewicz K, Sikorska K, Panas D, Sworczak K. The Role of the Trabecular Bone Score in the Assessment of Osteoarticular Disorders in Patients with HFE-Hemochromatosis: A Single-Center Study from Poland. Genes. 2021; 12(9):1304. https://doi.org/10.3390/genes12091304
Chicago/Turabian StyleBanaszkiewicz, Katarzyna, Katarzyna Sikorska, Damian Panas, and Krzysztof Sworczak. 2021. "The Role of the Trabecular Bone Score in the Assessment of Osteoarticular Disorders in Patients with HFE-Hemochromatosis: A Single-Center Study from Poland" Genes 12, no. 9: 1304. https://doi.org/10.3390/genes12091304