Article

Selection of Suitable Reference Genes for Gene Expression Normalization Studies in Dendrobium huoshanense

1
Department of Biological and Pharmaceutical Engineering, West Anhui University, Lu’an 237012, China
2
Anhui Engineering Laboratory for Conservation and Sustainable Utilization of Traditional Chinese Medicine Resources, West Anhui University, Lu’an 237061, China
3
College of Life Sciences, Anhui Agricultural University, Hefei 230036, China
*
Authors to whom correspondence should be addressed.
These authors contributed equally to this work.
Genes 2022, 13(8), 1486; https://doi.org/10.3390/genes13081486
Submission received: 2 August 2022 / Revised: 15 August 2022 / Accepted: 17 August 2022 / Published: 19 August 2022
(This article belongs to the Section Plant Genetics and Genomics)

Abstract

:
Dendrobium huoshanense is a kind of precious herb with important medicinal and edible value in China, which is widely used in traditional Chinese medicine for various diseases. Recent studies have paid close attention to the genetic expression of the biosynthetic pathway of the main active components (polysaccharides, alkaloids, and flavonoids), and real-time polymerase chain reaction (qPCR) is one of the most widely used methods for doing so. However, so far, no reference gene selections have been reported in D. huoshanense. In this study, 15 reference gene candidates (GAPDH, eIF, EF-1α, PP2A, UBCE, RPL5, TBP, APT1, MDH, PTBP3, PEPC, CYP71, NCBP2, TIP41, and F-box) were selected and evaluated for their expression stability in D. huoshanense under various experimental conditions, including in different tissues (root, stem, and leaf), abiotic stresses (oxidative, drought, cold, and UV), and hormone treatment (methyl jasmonate) using three statistical programs (geNorm, NormFinder, and BestKeeper). Then, the RefFinder program was employed to comprehensively validate the stability of the selected reference genes. Finally, the expression profiles of the CESA and GMPP genes were further analyzed, and these results indicated that TBP, NCBP2, and CYP71 were the top three most stable reference genes after comprehensive comparison, which could be used as stable reference genes for normalizing the genes expression in D. huoshanense. This study described here provides the first data regarding on reference gene selection in D. huoshanense, which will be extremely beneficial for future research on the gene expression normalization in D. huoshanense.

1. Introduction

D. huoshanense, as named by C.Z. Tang and S.J. Cheng, is a perennial epiphytic herb listed in Chinese Pharmacopoeia as having high edible and medicinal value; it belongs to the Dendrobium genus of Orchidaceae [1]. The wild D. huoshanense has been in an extremely endangered state, caused by the low natural reproduction rate and long-term destructive picking [2]. However, it has been greatly protected and industrialized through tissue culture and artificial cultivation technology [3]. As one of the most important traditional Chinese medicines, it is also known as “soft gold”, and has been used as tonic for centuries [4,5]. Its stem is used as the medicinal part and it is generally considered that the plants with more juice and sticky teeth are the best [1]. For thousands of years, it was widely used as an ingredient in herbal medicines for nourishing yin and clearing heat, benefiting the stomach, and generating fluid [6]. The major active components of D. huoshanense are polysaccharides, flavonoids, sesquiterpenes, phenols, etc. [3,7,8,9]. Many pharmacological experiments showed that it has the effect of enhancing immunity, anti-oxidation, anti-aging, anti-tumor, and that it plays a role in reducing blood sugar, protecting the liver, etc. [10,11,12]. However, the research on the gene expression of D. huoshanense is still not deep enough. Some key genes involved in the biosynthetic pathways of important components are unclear or remain theorized [13,14,15,16,17]. Even though some studies have carried out quantitative research on gene expression, the use of internal reference genes is usually selected by experience. For example, in the quantitative studies of gene expression levels in D. huoshanense or related Dendrobium species, Actin [14], Tubulin [15], 18S rRNA [16], 5.8S RNA [18], ASS, and APH1L [19] were randomly used as reference genes for the normalization of candidate target genes, respectively.
In recent years, plenty of studies have carried out gene and protein research on the biosynthetic pathway of D. huoshanense [13,14,15,16,17,20,21]. With the development of next-generation sequencing (NGS) technology, it has become simpler and faster to analyze the distribution of mRNA and their expression levels in the biosynthetic pathway of this plant [22]. In addition, another analysis method, qPCR, is quietly popular in gene expression research, based on its high sensitivity, quantitative accuracy, throughput capability, and low cost using specific reference genes [23,24,25]. However, this quantitative result will naturally be disturbed by many factors, such as genome contamination, RNA quality, primer specificity, and amplification efficiency [26]. In order to guarantee accurate results and eliminate errors, one or more stable and acceptable reference genes are necessary.
Reference genes frequently come from common housekeeping genes, such as glyceraldehyde-3-phosphate dehydrogenase (GAPDH) [27], actin (ACT) [28], α-tubulin (α-TUB) [29], ribosomal RNA (18S rRNA) [30], and elongation factor 1α (EF-1α) [31]. They are usually used to calibrate qPCR results, so a stable reference gene is needed for qPCR. Nevertheless, several studies indicated that the expression levels of these traditional housekeeping genes varied widely in various experimental conditions among many species [32,33,34,35,36,37,38]. Consequently, selecting a stable and suitable reference gene has become increasingly crucial. However, there are no systematic studies for the selection of reference genes in D. huoshanense under external conditions (abiotic stress and hormone treatments). The research on the biosynthetic pathway mechanisms of the polysaccharides, alkaloids, and flavonoids of D. huoshanense is the main concern of researchers in this field. Although previous studies have described some candidate genes related to D. huoshanense [13,14,15,16,17,39], it is still necessary to find appropriate reference genes for further enhancing the detection of different gene expression levels of D. huoshanense under different experimental conditions by using qPCR.
Selecting out the stable reference genes of plant species is very important in gene expression research on the biosynthetic pathway of their main components [27,28,29,30,31,32,33,34,35,36,37,38]. In this study, based on the traditional housekeeping gene identity and the reports of plant stable internal reference genes in the literature [40,41,42], 15 candidate reference genes from D. huoshanense, namely GAPDH, eIF, EF-1α, PP2A, UBCE, RPL5, TBP, APT1, MDH, PTBP3, PEPC, CYP71, NCBP2, TIP41, and F-box, were assessed their expression stability by qPCR under abiotic stresses, namely oxidative (H2O2), drought (PEG), cold (4 °C), UV radiation (UV), and hormone treatment (methyl jasmonate (MeJA)), as well as in different tissues (root, stem, and leaf). Next, geNorm [43], NormFinder [44], and BestKeeper [45] were preliminarily employed to analyze the gene expression stability, and RefFinder (https://www.heartcure.com.au/reffinder/ (accessed on 1 August 2021)) was then used to comprehensively reassess the candidate genes. Finally, two genes related to polysaccharide biosynthesis, guanosine diphosphate (GDP)-mannose pyrophosphorylase (GMPP) [20] and cellulose synthase (CESA) [46], were selected to test and verify the stability of the selected internal reference genes. Our report of the selection of suitable reference genes for gene expression normalization studies in D. huoshanense continues to support that one or more stable and acceptable reference genes is very necessary to guarantee accurate results and eliminate errors. This study is the first systematic study of stable reference genes in D. huoshanense, which is helpful to promote the molecular research of D. huoshanense, especially in terms of gene expression involved in the biosynthesis of polysaccharides, alkaloids, flavonoids, etc.

2. Materials and Methods

2.1. Plant Materials

The plants used in the experiment were potted and planted in the greenhouse of the medicinal botanical garden of West Anhui University, which were identified as D. huoshanense by Professor Bangxing Han from West Anhui University. One-year-old D. huoshanense plants were used as experimental subjects. Specifically, the roots, stems and leaves of fresh D. huoshanense were used as samples of different tissues. For oxidative stress, the plant leaves were treated with 50 mM hydrogen peroxide (H2O2) once for 24 h. For drought treatment, 200 mL 25% PEG 6000 was used to treat plants every day for seven consecutive days. For temperature treatment, the plants were placed in a light incubator at 4 °C for two days. For UV treatment, the plants were exposed 15 cm from the UV light source (Philips TUV 30 W, 92 μW/cm2, 253 nm) for 15 min of radiation [47], and then a dark culture for 2 days. For hormone treatment, plant leaves were sprayed once with 25 mM MeJA and sampled after 6 h. All collected samples were quickly washed with distilled water and immediately frozen in liquid nitrogen and stored at −80 °C until RNA was extracted. Each group of samples had three biological replicates, and untreated D. huoshanense was used as control.

2.2. Total RNA Extraction and cDNA Synthesis

The total RNA of the cryopreservation samples from the refrigerator at −80 °C was extracted using an EASYspin Plus Complex Plant RNA kit (Aidlab, China), referring to the manufacturer’s instructions, and DNA was eliminated with DNase I (Aidlab, China). The purity and concentration of RNA samples were detected using 1% agarose gel electrophoresis and a Synergy H1 multifunction microplate detector (BioTek, American), respectively. Additionally, 0.2 μg of total RNA with a 260/280 ratio between 1.9 and 2.1 was used to synthesize first-strand cDNA using HiScript® II Q RT SuperMix for qPCR (Vazyme, Nanjing, China) in accordance with the manufacture’s manual, and then the sample was diluted five times for qPCR analyses.

2.3. Selection of Candidate Reference Genes and Primers Design

Here, a total of 15 genes were selected as candidate reference genes by comparison with the TAIR database (http://www.arabidopsis.org (accessed on 7 February 2021)) using protein sequences of common housekeeping genes (GAPDH, eIF, EF-1α, PP2A, UBCE, RPL5, TBP, APT1, MDH, PTBP3, PEPC, CYP71, NCBP2, TIP41, and F-box) from Arabidopsis thaliana L. as templates. Then, the local BLAST program of BioEdit was employed to obtain the nucleotide sequences of putative D. huoshanense homologs based on the transcriptome data (access No. is PRJNA577972), and the information on 15 gene sequences of D. huoshanense was shown in Table S1. Next, Primer Premier 5 software was applied to design all the primers using the following principle: (1) the primer sequence length is 18–24 bp; (2) the amplification length is 80–300 bp; (3) the melting temperature (Tm) is 58–62 °C; (4) the GC content is 40–60%. Finally, all primers were synthesized by General Biol Company (Anhui, China) and checked by regular PCR products with 2% agarose gel electrophoresis before qPCR analysis. The melting curve was obtained to further determine primer specificity under the reaction condition at 95 °C for 15 s, 60 °C for 60 s, and 95 °C for 15 s using an AceQ qPCR SYBR Green Master Mix (Vazyme, Nanjing, China). The PCR efficiency (E) and correlation coefficient (R2) of each gene was obtained directly from the StepOneTM Real-time PCR system (Applied Biosystems, Waltham, MA, USA) according to a standard curve generated from the 5-fold dilution cDNA series. All the information of the gene-specific primer pairs used in this study is listed in Table 1.

2.4. qPCR Analysis

According to the introduction of the AceQ qPCR SYBR Green Master Mix, the qPCR reaction system was conducted in a 20 µL mixture with 10 µL AceQ SYBR Green Master Mix (High ROX Premixed), 0.2 µM of forward and reverse primers, 2 µL diluted cDNA template mentioned in item 2.2, and 7.2 µL of RNase-free ddH2O. The reaction condition followed the illustration from the manufacturer, which is 95 °C for 5 min for pre-denaturation, 40 cycles of 95 °C for 10 s for denaturation, and 60 °C for 30 s for annealing/extension. All experiments were performed with three independent biological and technical repetitions.

2.5. Gene Expression Stability Analysis

In order to evaluate the stability of each candidate gene under various experimental conditions, including different tissues (root, stem, and leaf), abiotic stresses (oxidation, drought, cold, and UV) and hormone treatment (MeJA), three different algorithms, geNorm, NormFinder, and BestKeeper, were employed to carry out statistical analysis. Specifically, geNorm calculated the expression stability values (M) and pairwise variation comparison (Vn/Vn + 1). NormFinder assessed the reliability of reference genes based on their variations in both the intra-group and inter-group. Different to geNorm and NormFinder, which needed the 2−∆Ct value [43,44], BestKeeper directly used the Ct values to rank the gene expression stability by calculating CV ± SD (coefficient of variation ± standard deviation) to choose the most stable genes.

2.6. Comprehensive Analysis and Validation of Selected Reference Genes

Firstly, the website tool RefFinder (https://www.heartcure.com.au/reffinder/ (accessed on 1 August 2021)) was used to comprehensively reassess the results of the candidate genes stability analysis from the geNorm, NormFinder, and BestKeeper softwares. Then, in order to examine the reliability of the selected reference genes, the two most stable and one least stable internal reference genes were used for normalizing the expression levels of two target genes (GMPP and CESA) [20,46] related to polysaccharide biosynthesis in different tissues and hormone treatment. Sample collections and experiments were conducted as mentioned above. The expression levels of two target genes were normalized by the 2−∆∆Ct method [48].

3. Results

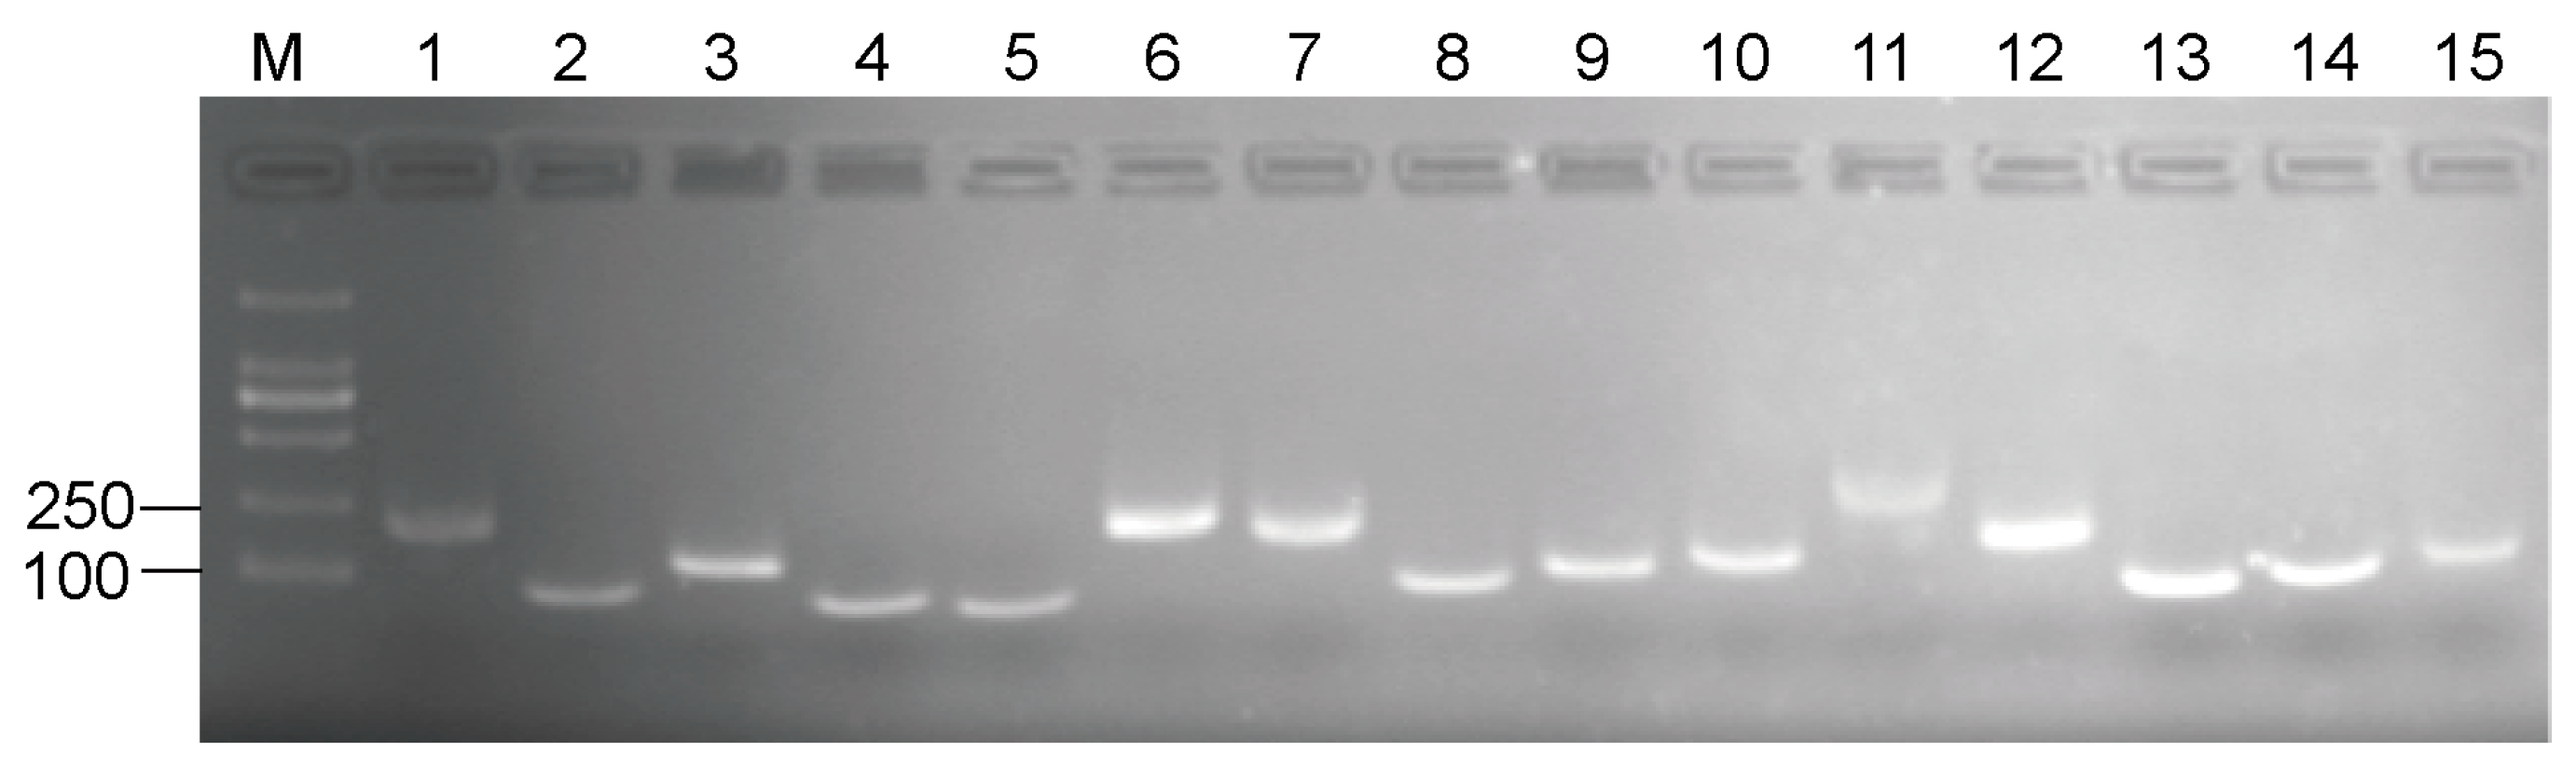
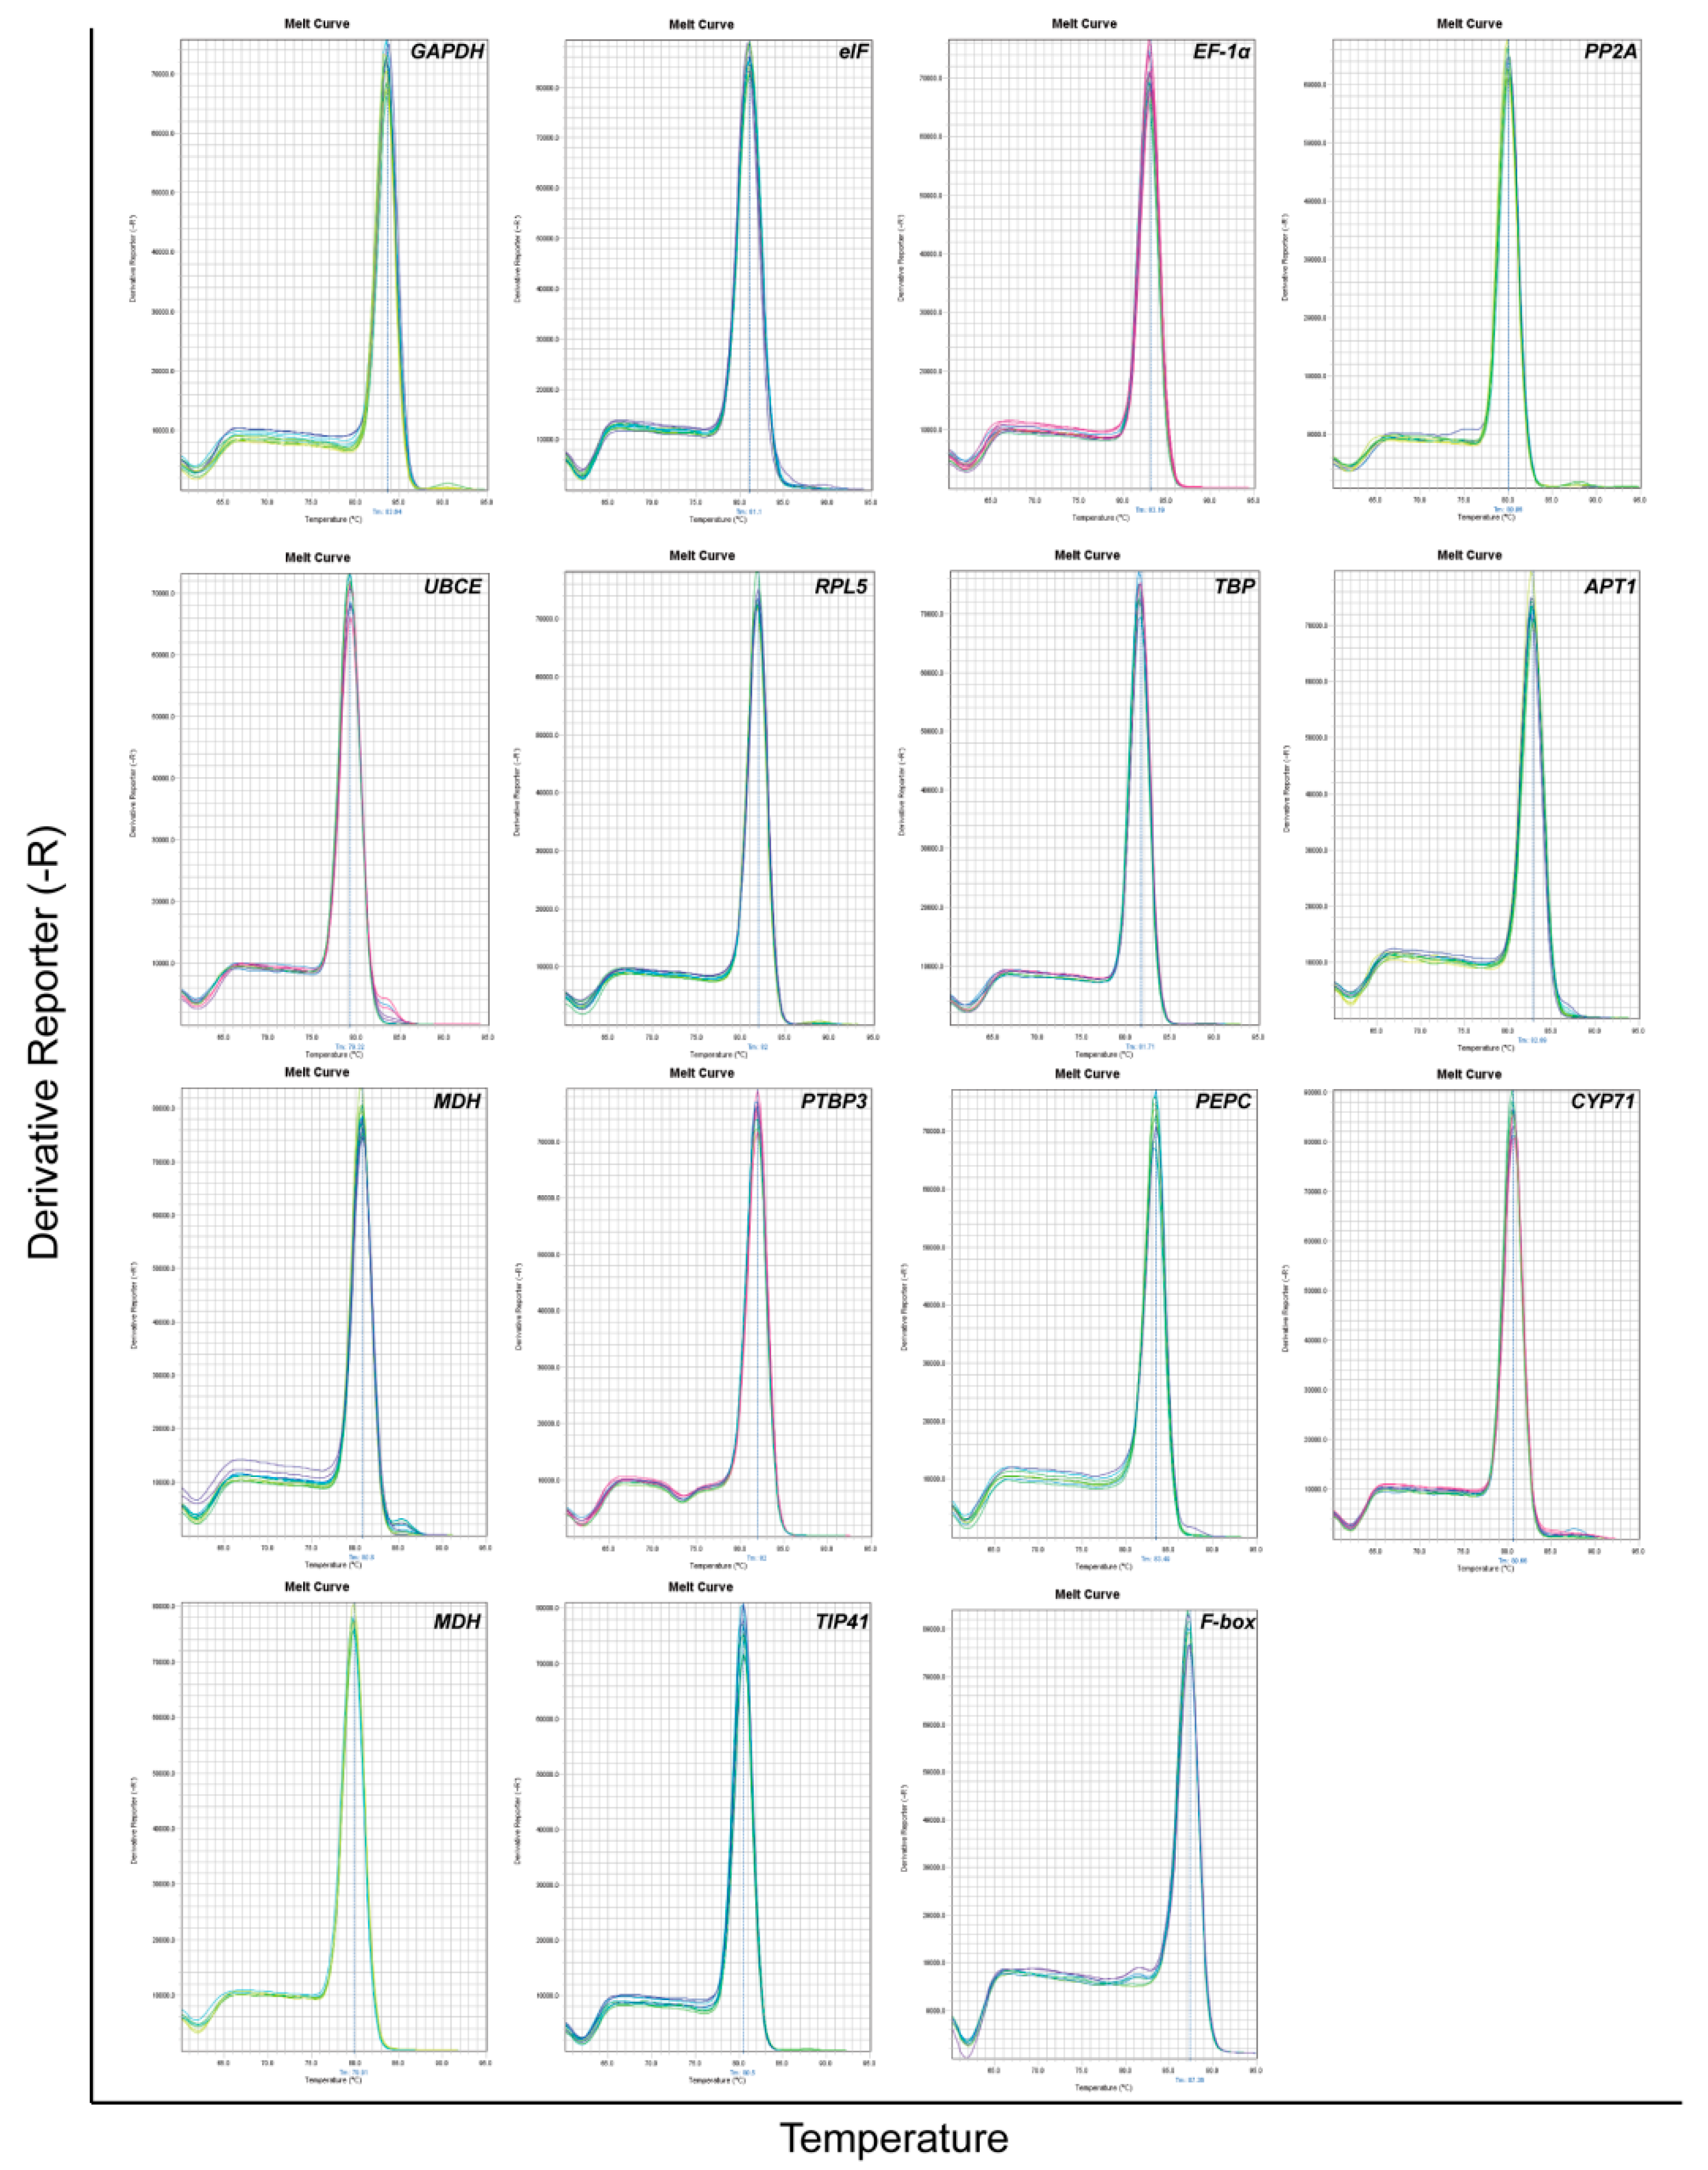
3.1. Primer Specificity Verification and PCR efficiency

To investigate the reference gene of D. huoshanense, 15 candidate genes (GAPDH, eIF, EF-1α, PP2A, UBCE, RPL5, TBP, APT1, MDH, PTBP3, PEPC, CYP71, NCBP2, TIP41, and F-box) were chosen based on previous studies [36,37] and the TAIR database. The specific amplification of primer pairs of all candidate reference genes was firstly checked by regular PCR, which exhibited a single PCR band meet the expected size in 2.0% agarose gel electrophoresis analysis (Figure 1). Moreover, the melting curve analysis showed a single amplification peak which further confirmed the specificity of the genes (Figure 2). According to the standard curve of each internal reference gene obtained by diluting cDNA in a 5-fold gradient, the amplification efficiency ranged from 90.502% for PEPC to 104.77% for TBP, and all the correlation coefficients (R2) were greater than 0.990 (Table 1).

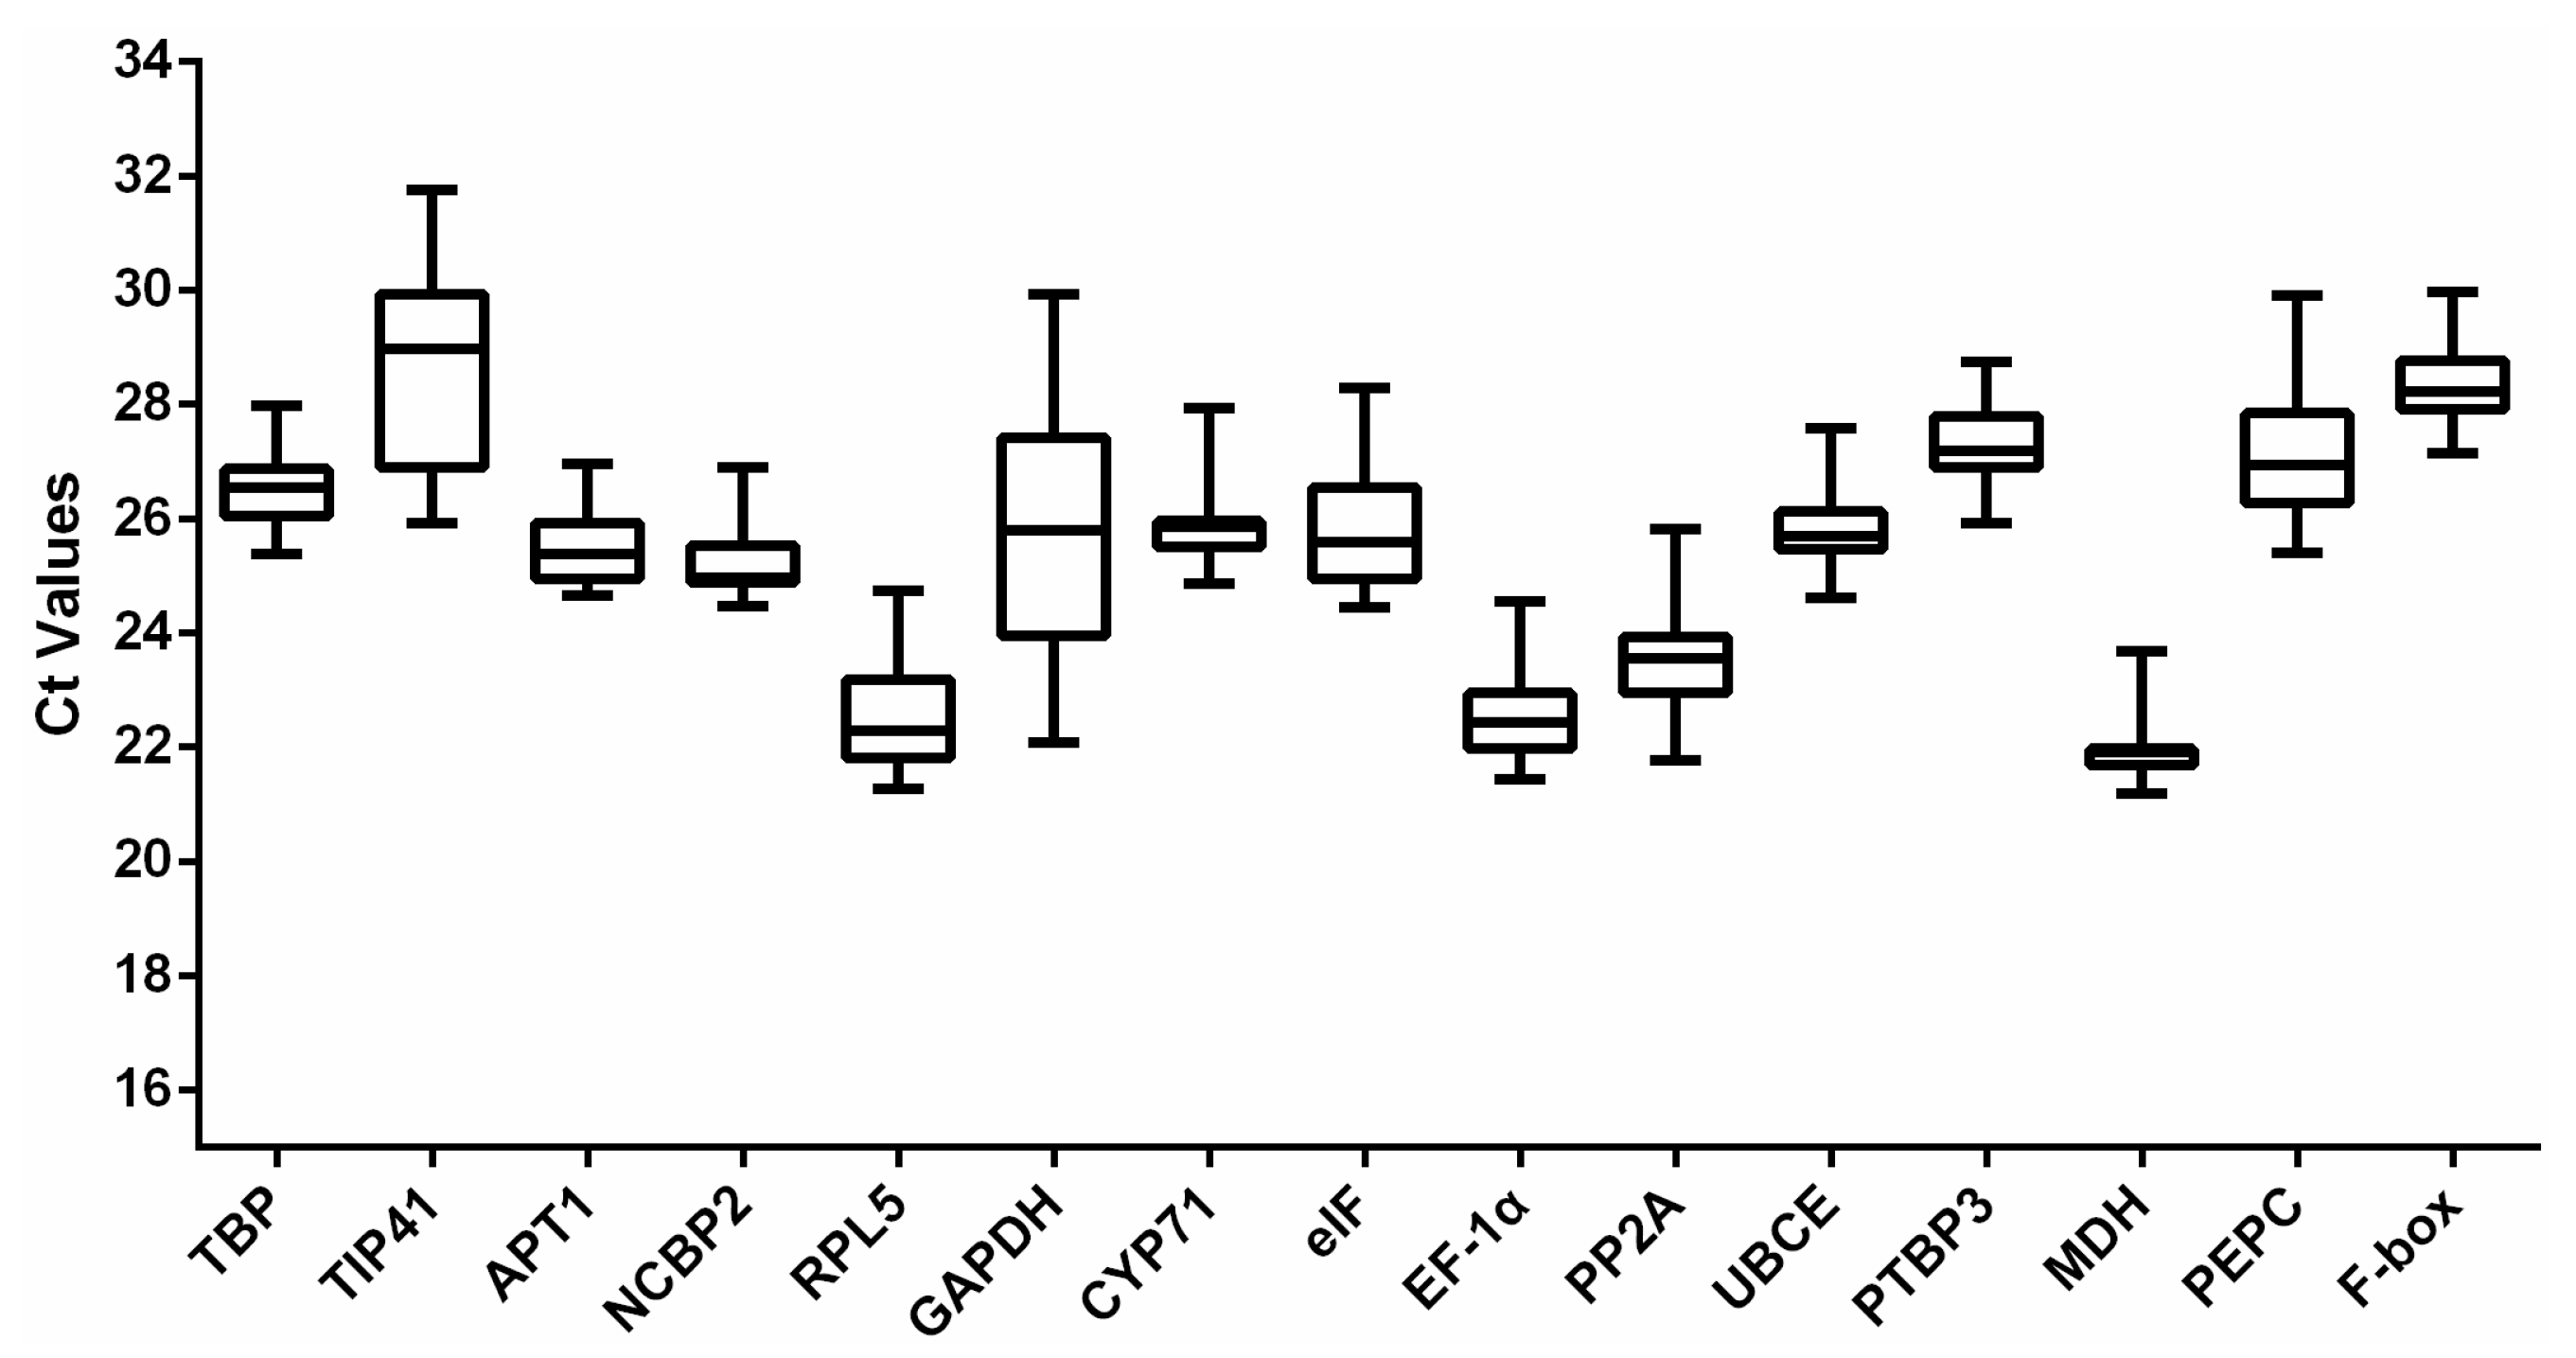
3.2. Expression Profile of the Reference Genes

The raw Ct values of the reference genes were collected and are exhibited in Figure 3. It can be observed that the number of cycles correspond to the threshold of fluorescence level which can be detected. The average Ct values of the 15 reference genes ranged from 22.00 to 28.58. According to the average Ct values, it can be judged that the expression abundance of 15 internal reference genes from high to low was MDH > RPL5 > EF-1α > PP2A > NCBP2 > APT1 > GAPDH > eIF > UBCE > CYP71 > TBP > PEPC > PTBP3 > F-box > TIP41. Low Ct values correspond to high gene expression abundance, so the expression abundance of MDH was the highest and TIP41 was the lowest. Here, TBP, APT1, NCBP2, and MDH, have relatively narrow Ct variation ranges, indicating that their expression levels may be more stable. However, considering the complexity and diversity of the plant growth environment, the stability of the selected internal reference genes still needs to be further investigated under different environmental conditions.

3.3. The Analysis of Expression Stability of Candidate Reference Genes

In order to improve the accuracy of analysis, three frequently used algorithms, namely geNorm, NormFinder, and BestKeeper, were separately employed to further assess the stability of candidate reference genes under different treatments and tissues.

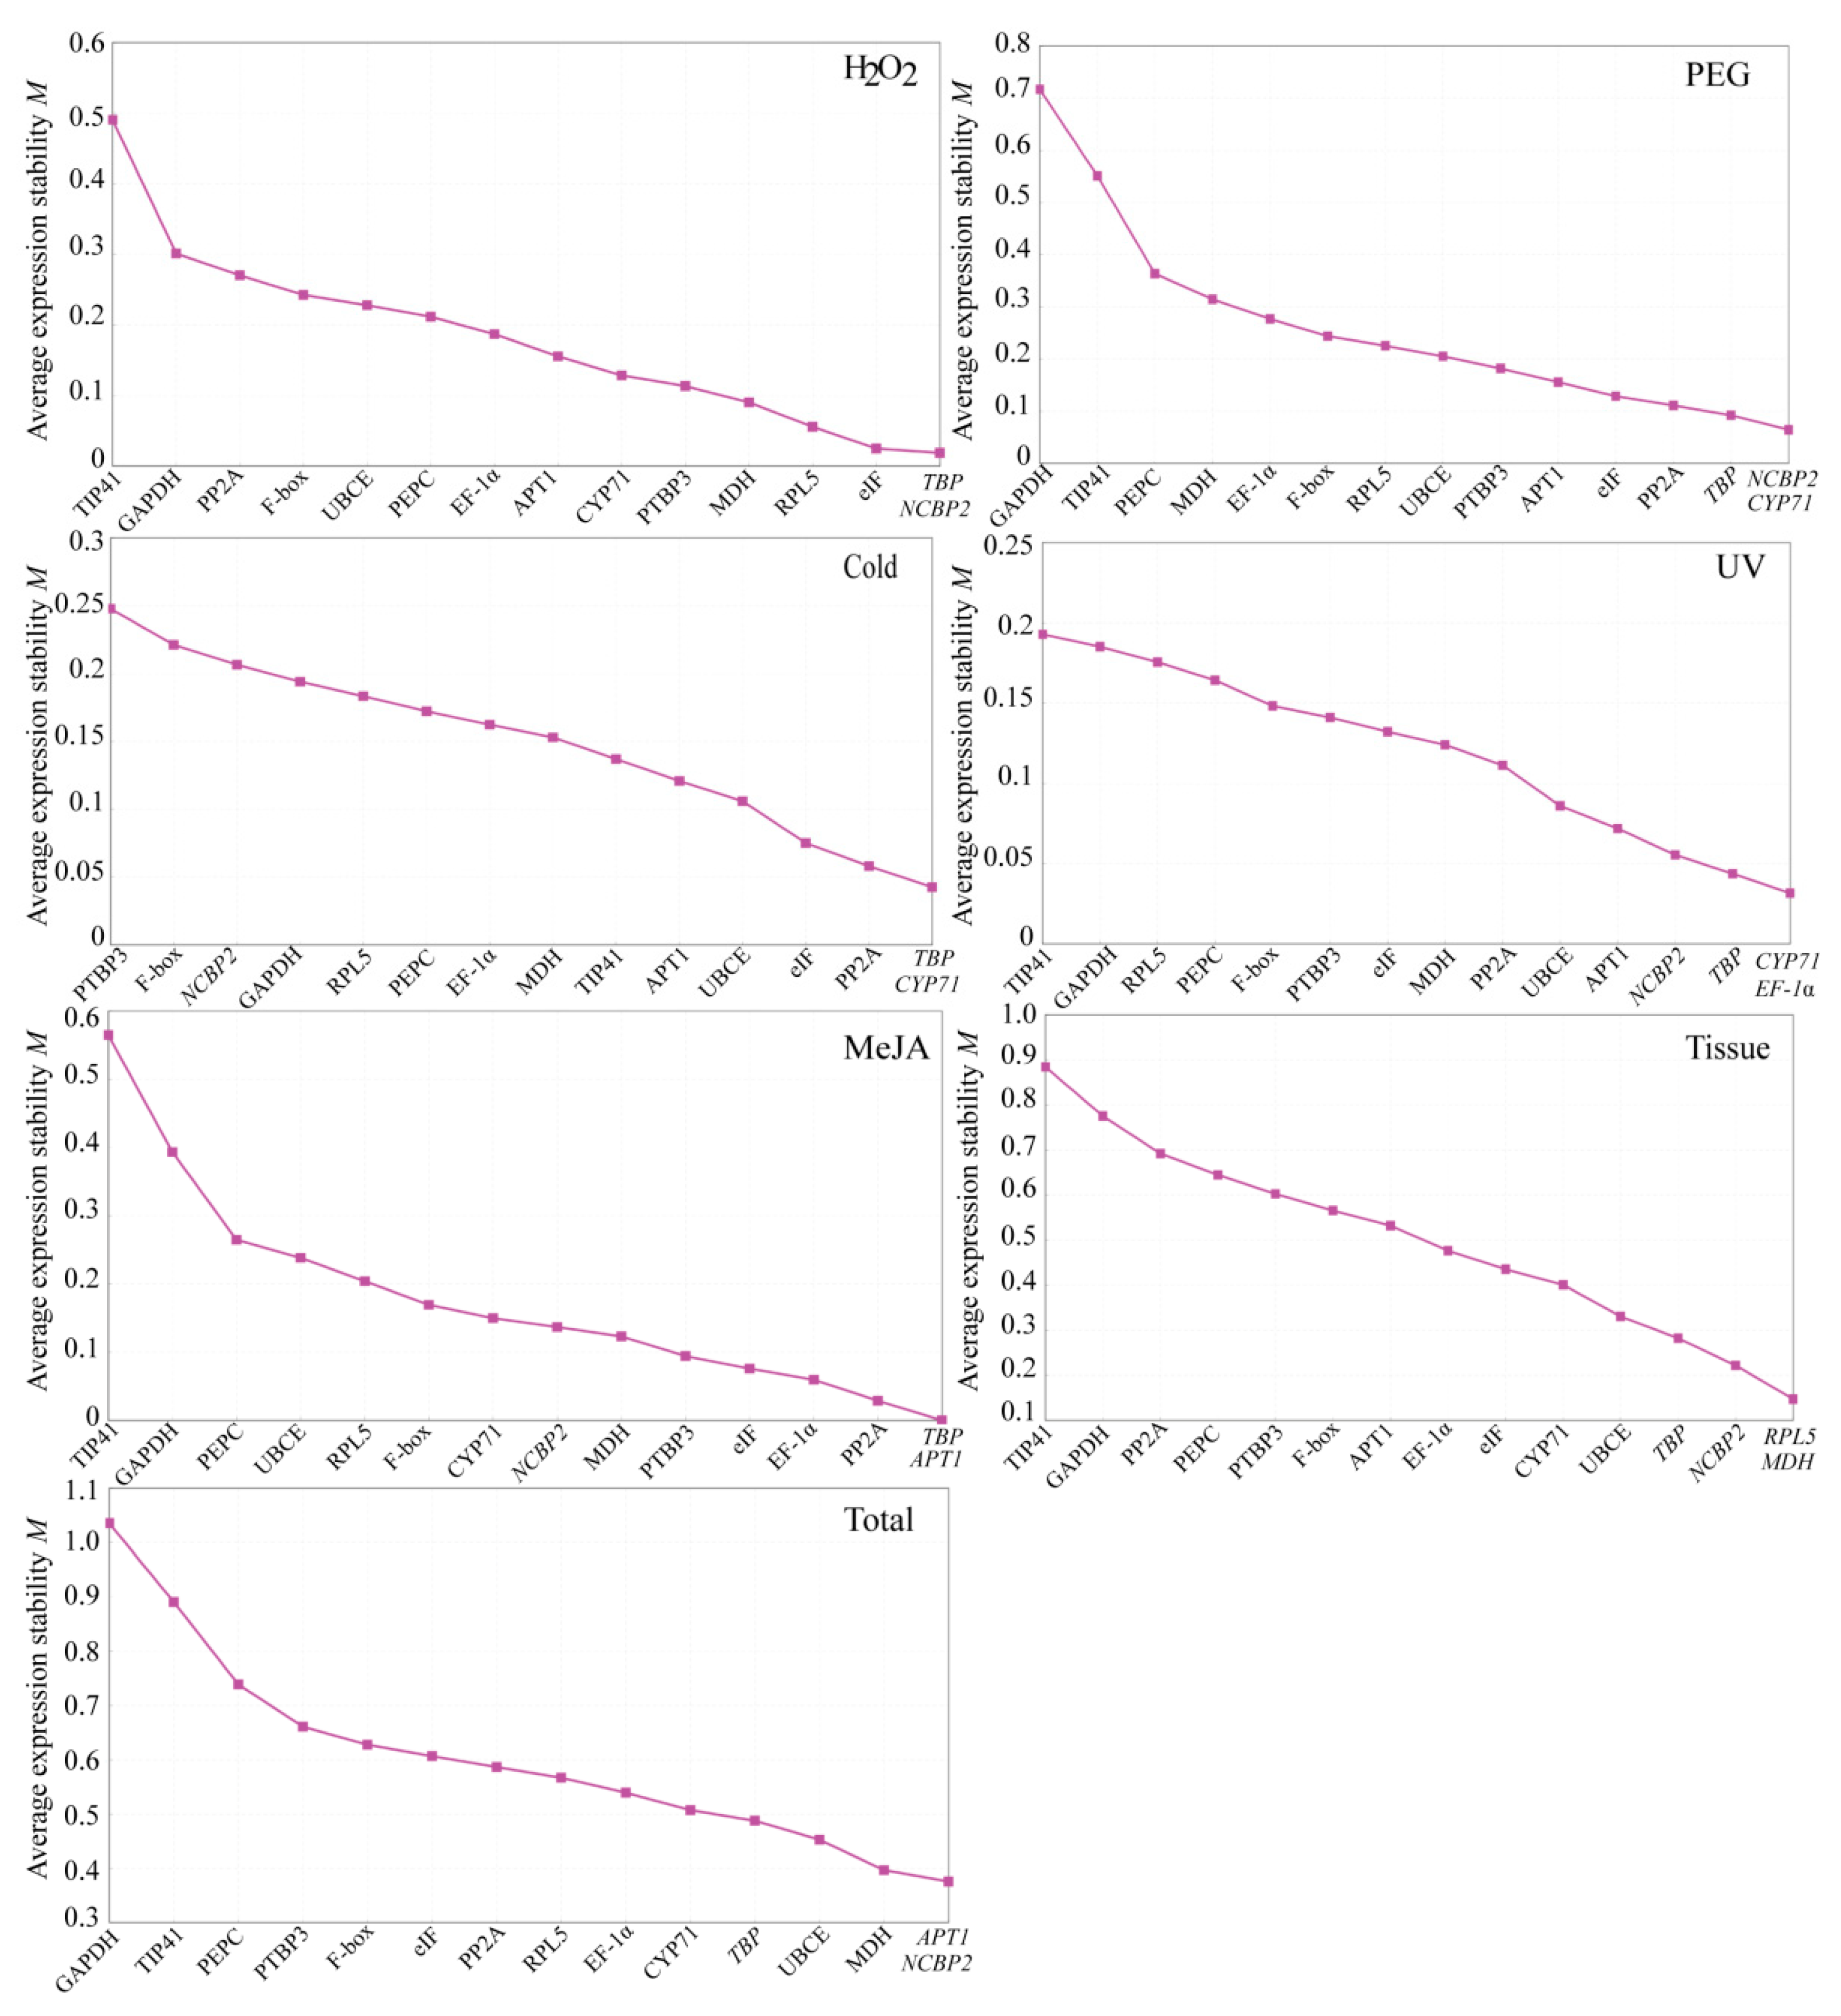
3.3.1. geNorm Analysis

In geNorm analysis, measurement (M) values of expression stability of each reference gene is generated for each pair of genes. This ranks the expression stability by M values, and the lower M value represents the higher stability of gene expression. Generally, if M > 1.5, it could be regarded as an unsuitable reference gene. As shown in Figure 4, the stability trend of the 15 candidate internal reference genes in the tissue group, MeJA group, and different abiotic stress groups were arranged from high to low by the geNorm analysis, and the most stable internal reference genes given by all groups had some differences. Concretely, the five most stable internal reference genes in each group were as follows: TBP > NCBP2 > eIF > RPL5 > MDH for the H2O2 group; NCBP2 > CYP71 > TBP > PP2A > eIF for the PEG group; TBP > CYP71 > PP2A > eIF > UBCE for the cold group; CYP71 > EF-1α > TBP > NCBP2 > APT1 for the UV group; TBP > APT1 > PP2A > EF-1α > eIF for the MeJA group; RPL5 > MDH > NCBP2 > TBP > UBCE for the tissue group; APT1 > NCBP2 > MDH > UBCE > TBP for the total group. More uniformly, for all samples, except for PTBP3 and F-box in the cold group, the two most unstable genes in other groups were TIP41 and GAPDH. In addition, geNorm can also recommend the required number of optimal internal reference genes according to the value of the pairwise variation (Vn/Vn + 1). When Vn/Vn + 1 is less than 0.15, the optimal number of reference genes is n [43]. According to this standard, the V2/V3 values are lower than 0.15 in all groups, so it is considered that the optimal number of internal reference genes is 2 (Figure 5), indicating that 2 reference genes can be sufficient for gene normalization.

3.3.2. NormFinder Analysis

The NormFinder can directly evaluate the stability of reference genes, based on the variance in intra- and inter-group, to calculate the normalization factors using ANOVA. Generally, the lower stability value also reflects better stability of the corresponding reference gene expression. As shown in Table 2 from the top to the bottom, the stability values of reference genes are listed from the lowest to the highest with the NormFinder analysis. In detail, the most stable internal reference genes could be discovered clearly in all experimental conditions. The five most stable internal reference genes in each group were as follows: TBP > NCBP2 > eIF > RPL5 > PTBP3 for the H2O2 group; NCBP2 > CYP71 > TBP > PP2A > eIF for the PEG group; TBP > CYP71 > PP2A > APT1 > UBCE for the cold group; EF-1α > CYP71 > NCBP2 > TBP > UBCE for the UV group; TBP > APT1 > PP2A > EF-1α > eIF for the MeJA group; MDH > NCBP2 > RPL5 > UBCE > TBP for the tissue group; NCBP2 > MDH > APT1 > UBCE > TBP for the total group. According to the comprehensive analysis, TBP can be regarded as a most stable reference gene, similar to the results with the geNorm analysis. In addition to the unstable expression of NCBP2 in the cold and MeJA group, it was also very stable in other groups. Furthermore, the two most unstable genes (GAPDH and TIP41) in each group were consistent with the results of the geNorm analysis apart from the cold group. Combined with the analysis results of geNorm, we can judge the best combinations of the two internal reference genes in each group as follows: TBP + NCBP2 for the H2O2 group; NCBP2 + CYP71 for the PEG group; TBP + CYP71 for the cold group; CYP71 + EF-1α for the UV group; TBP + APT1 for the MeJA group; RPL5 + MDH for the tissue group; APT1 + NCBP2 for the total group.

3.3.3. BestKeeper Analysis

BestKeeper is an Excel-based program that directly uses the raw Ct values without conversion to calculate coefficient of variation (CV) and standard deviation (SD) of the reference gene from each experimental group, so as to compare their stability [45]. The smaller CV ± SD value, the more stable the reference gene. If the SD value is greater than 1, it is generally considered that this gene is unstable and should be discarded. All analysis results are shown in Table 3, and the stable arrangement of each gene is somewhat different from that of geNorm and NormFinder. Specifically, the five most stable internal reference genes in each group were as follows: TBP > RPL5 > NCBP2 > eIF > PTBP3 for the H2O2 group; NCBP2 > CYP71 > TBP > eIF > PP2A for the PEG group; EF-1α > UBCE > CYP71 > APT1 > TBP for the cold group; EF-1α > CYP71 > TBP > UBCE > NCBP2 for the UV group; eIF > EF-1α > TBP > APT1 > NCBP2 for the MeJA group; PTBP3 > PEPC > UBCE > TBP > EF-1α for the tissue group; MDH > TBP > PTBP3 > UBCE > CYP71 for the total group. However, for most treatments, TBP or NCBP2 still showed good stability, basically consistent with the geNorm and NormFinder analyses. In addition, except for the Cold group, GAPDH and TIP41 were still more unstable than others, a result which was nearly close to the results of geNorm and NormFinder analysis.

3.4. Comprehensive Analysis and Validation of Reference Genes

Considering the differences in stability analysis from the first three programs, we further used the online comprehensive ranking platform RefFinder, which used geNorm, Normfinder, BestKeeper, and the comparative ΔCt method to verify the rankings of candidate reference genes [49] (Table 4). The geometric mean of the attributed weight from the stable value of each gene was calculated by RefFinder, and the smaller the value, the more stable the internal parameter gene. The ranking order of the top five most stable and unstable candidate reference genes acquired by RefFinder were basically the same as the results provided by geNorm and Normfinder, which is slightly different from the results of BestKeeper. For example, in all treatment groups, the first two most unstable genes generated by RefFinder were basically the same as the first three most unstable genes calculated by geNorm, Normfinder, and BestKeeper. Moreover, the stability ranking order of the 15 reference genes was counted in Table S2 to better observe the rankings of the 4 software analysis results, which suggested that TBP, NCBP2, and CYP71 could be the 3 best stable genes in D. huoshanense under the different conditions.
Then, in order to further verify the reliability of the screened stable internal reference genes, the expression of two genes (CESA and GMPP) related to polysaccharide biosynthesis pathway in different tissues (root, stem, and leaf) and MeJA treatment for stem were analyzed by qPCR with the unstable reference gene (TIP41), three stable reference genes (RPL5, MDH, and TBP), and their combinations as reference genes based on the comprehensive rankings mentioned in Table S2. The results showed that, when RPL5, MDH and RPL5 + MDH were used as internal reference genes, the expression levels of CESA and GMPP were slightly different in the root, stem, and leaf samples. Among them, the expression levels of CESA were stem > root > leaf, and the expression levels of GMPP were stem > leaf > root (Figure 6A). However, when the unstable internal reference gene TIP41 was used, the relative expression levels of CESA and GMPP in root and stem were significantly different from the quantitative results of RPL5, MDH, and RPL5 + MDH (Figure 6B). Likewise, when the stable APT1 or TBP was selected as internal reference gene, it was obvious that the relative quantitative results of CESA or GMPP in the stem were similar, and while using the unstable internal reference gene TIP41, the relative quantitative results of CESA or GMPP in stem were significantly different (Figure 6C).

4. Discussion

D. huoshanense has attracted many researchers because of its broad pharmacological activity [9]. Our research group on D. huoshanense has carried out a series of studies on the field resource protection, tissue culture and cultivation, chemical component separation and identification, bioactivity analysis and action mechanism, and new drug and product development [3,5,10,39,50,51,52,53], and also completed its whole genome sequencing [54]. In addition, the transcriptome sequencing of D. huoshanense had been reported several times in other research groups [13,14,15,16,17]. Since the main active components of similar plants have been gradually known, many studies also mainly focused on exploring and understanding the biological control [55] and biosynthetic pathways of polysaccharides, alkaloids and flavonoids, etc. [13,14,15,16,17].
The gene expression level has an inevitable and important role in the biosynthesis of secondary metabolites and related gene function mining. Due to its high sensitivity and specificity, qPCR is often used for high-throughput analysis at the level of gene transcription. To obtain accurate and reliable results for the data, a stable and suitable reference gene is required. In fact, in the quantitative studies of the genetic expression of D. huoshanense or its related species, multiple genes were randomly used as internal reference genes [14,15,16,17,18,19], which would cause errors in the analysis results. To our knowledge, there are still no systematical studies on reference genes in D. huoshanense. Moreover, there are three main cultivation methods of D. huoshanense including facility cultivation, under forest cultivation, and simulative habitat cultivation [3]. Among these, the simulative habitat cultivation of D. huoshanense has the comprehensive effects of “excellent environment”, “excellent shape”, “high quality”, and “excellent effect” [3], which is similar to the report of Dendrobium officinale [56]. This cultivation method has almost no manual intervention in the growth process, and is mainly faced with various environmental stress factors, such as UV, temperature, and drought. In order to further study the molecular mechanism of the effects of environmental factors on the quality of D. huoshanense, it is necessary to screen the internal reference genes that can be stably expressed in different tissues, and under the main abiotic stress conditions (oxidation, drought, temperature, and ultraviolet radiation) and hormone stress. Thus, we set up six treatments in this study, and the results also confirmed the necessity of this configuration. Therefore, we comprehensively analyzed the expression levels and stability of 15 candidate reference genes under corresponding conditions.
All raw Ct values of D. huoshanense samples under different abiotic conditions, hormone treatment, and in different tissues were acquired from qPCR and processed using geNorm, NormFinder, and BestKeeper for ranking the reference genes. According to the results of this study, the 15 candidate reference genes firstly exhibited a relatively reliable range for expression profiles from 22.00 to 28.58, revealing that the selected candidate genes were able to offer an accurate normalization. Based on the relatively narrow Ct variation ranges, TBP, APT1, NCBP2, and MDH might be tentatively considered as the better stable reference genes (Figure 3). Obviously, this results on the rankings of 15 candidate reference genes were somewhat different from the outcomes calculated by geNorm, NormFinder, and BestKeeper, which indicated that it is necessary to use multiple procedures to obtain the best results (Figure 4, Table 2 and Table 3), and also revealed that none of the 15 reference genes could be stably expressed for meeting all conditions in D. huoshanense. Next, three Excel-based programs were further employed to estimate the stability of the candidate genes, and their results showed some differences in ranking order because their analysis principle and emphasis are different. In the analysis of geNorm and NormFinder, the five most stable genes given by them were basically the same, while the difference was their different stability ranking order. However, the analysis results of BestKeeper are different from those of geNorm and NormFinder, mainly due to the CV and SD values, which are the key factors for determining the stability ranking of reference genes obtained by BestKeeper. This discrepancy was acceptable because the results of the three methods showed some consistency in selecting the five most stable genes. Eventually, the above three analysis results were synthesized by RefFinder, and the five most stable genes were close to those given by geNorm and NormFinder. Combining the results of these four software analysis (Table S2), the five most stable genes were as follows: TBP > NCBP2 > RPL5 > eIF > PTBP3 in the H2O2 group; NCBP2 > CYP71 > TBP > PP2A > eIF in the PEG group; TBP > CYP71 > PP2A > UBCE > APT1 in the cold group; EF-1α > CYP71 > TBP > NCBP2 > UBCE in the UV group; TBP > APT1 > eIF > EF-1α > PP2A in MeJA group; TBP > UBCE > MDH > RPL5 > NCBP2 in the tissue group; MDH > TBP > UBCE > NCBP2 > APT1 in the total group. Accordingly, these results demonstrated that TBP, NCBP2, and CYP71 could be comprehensively regarded as the top three stable reference genes in D. huoshanense. Unexpectedly, although GAPDH is a commonly used reference gene, its expression in D. huoshanense showed fairly poor expression stability under all experimental conditions in our research, which meant that it could not be used as a stable reference gene for qPCR analysis. However, it was regarded as the best reference gene in D. catenatum [57], Diabrotica undecimpunctata [58], and Corydalis yanhusuo [59]. Similarly, although TIP41 is not suitable as an internal reference gene in this study, its expression presented high stability in Momordica charantia [60]. These results further illustrated that there is no universally applicable reference gene with invariant expression, and that the selection of stable reference genes remain indispensable. Furthermore, in qPCR analysis, multiple reference genes are better than a single reference gene for normalization. According to the pairwise variation results (Figure 5), the combination of two reference genes should be enough to meet the demand for the normalization in different tissues and under all the experimental conditions (Figure 6).
In order to further confirm the suitability of the selected reference genes, two pairs of the most stable genes (RPL5 and MDH, and APT1 and TBP) and their combinations and one least stable gene (TIP41) were selected for the normalization of CESA [46] and GMPP [20] involved in the polysaccharide biosynthesis of D. huoshanense under MeJA treatments and in various tissues. Noticeably, when the selected stable reference gene pairs or their combinations were standardized alone, there were only slight differences in the relative expression levels of CESA and GMPP between different tissues and MeJA treatment. However, when using the least stable reference gene, a significantly different result was found in the relative expression levels of CESA and GMPP between different tissues and MeJA treatments, indicating that the selection and confirmation of appropriate and stable reference genes is particularly critical before they are used for a set of samples.

5. Conclusions

To the best of our knowledge, our study is the first to systematically explore and evaluate the expression stability of 15 reference genes from D. huoshanense under different abiotic stress factors, hormone treatment, and in different tissues. The results indicated that TBP, NCBP2, and CYP71 could be regarded as the optimal reference genes based on their better stability in different conditions when analyzed by four commonly used programs (geNorm, NormFinder, BestKeeper, and RefFinder). Furthermore, the two unstable genes of each group were basically identical according to the comprehensive ranking order from the four programs at their relevant conditions. Finally, the validation experiments on the expression analysis of CESA and GMPP further accentuated that it is necessary to screen stable reference genes for the normalization of gene expression analysis by qPCR under different conditions. This study will be useful to increase the accuracy of gene expression analysis by qPCR and promote future research on gene functions in D. huoshanense and related Dendrobium species. Therefore, this research should also arouse great interest in researchers engaged in the mining of key genes in plant secondary metabolic pathways, inspiring further effort in plant molecular research and natural product biosynthesis pathway analysis.

Supplementary Materials

The following are available online at https://www.mdpi.com/article/10.3390/genes13081486/s1, Table S1: Information of 15 candidate reference genes and two target genes selected for evaluation and validation in D. huoshanense. Table S2: Expression stability rankings of the 15 candidate reference genes estimated by geNorm, NormFinder, BestKeeper and RefFinder. Figure S1: Standard curves of 15 candidate reference genes and two target genes were directly generated by StepOneTM Real-time PCR system.

Author Contributions

Conceptualization, B.H. and Y.C.; methodology, S.Y. and H.L.; software, H.L. and C.T.; validation, C.T. and W.W.; formal analysis, C.S. and F.G.; investigation, W.W.; resources, P.W. and T.X.; data curation, D.L.; writing—original draft preparation, S.Y. and H.L.; writing—review and editing, B.H. and Y.C.; visualization, W.W. and H.L.; supervision, B.H., Y.C. and S.Y.; All authors have read and agreed to the published version of the manuscript.

Funding

This research was supported by China Agriculture Research System of MOF and MARA, Key Project at Central Government Level: The ability establishment of sustainable use for valuable Chinese medicine resources (2060302), the Natural Science Foundation of Anhui Province (2208085QH266), Postdoctoral Science Foundation of West Anhui University (WXBSH2021002), High level talent project of West Anhui University (WGKQ2021024).

Institutional Review Board Statement

Not applicable.

Informed Consent Statement

Not applicable.

Data Availability Statement

The data presented in this study are openly available in GeneBank.

Conflicts of Interest

The authors declare no conflict of interest.

References

  1. Zhao, X.M. Supplement to Compendium of Materia Medica; China Press of Chinese Traditional Medicine: Beijing, China, 2007. [Google Scholar]
  2. Wu, C.F.; Gui, S.H.; Huang, Y.C.; Dai, Y.F.; Shun, Q.S.; Huang, K.W.; Tao, S.C.; Wei, G. Characteristic fingerprint analysis of Dendrobium huoshanense by ultra-high performance liquid chromatography-electrospray ionization-tandem mass spectrometry. Anal. Methods 2016, 8, 3802–3808. [Google Scholar] [CrossRef]
  3. Yi, S.Y.; Kang, C.Z.; Wang, W.; Song, X.W.; Xu, T.; Lu, H.B.; Luo, S.L.; Liu, D.; Guo, L.P.; Han, B.X. Comparison of planting modes of Dendrobium huoshanense and analysis of advantages of simulated cultivation. Zhongguo Zhong Yao Za Zhi 2021, 46, 1864–1868. [Google Scholar]
  4. Chang, C.C.; Ku, A.F.; Tseng, Y.Y.; Yang, W.B.; Fang, J.M.; Wong, C.H. 6,8-Di-C-glycosyl flavonoids from Dendrobium huoshanense. J. Nat. Prod. 2010, 73, 229–232. [Google Scholar] [CrossRef]
  5. Zhao, Y.J.; Han, B.X.; Peng, H.S.; Wang, X.; Chu, S.S.; Dai, J.; Peng, D.Y. Identification of “Huoshan shihu” Fengdou: Comparative authentication of the Daodi herb Dendrobium huoshanense and its related species by macroscopic and microscopic features. Microsc. Res. Tech. 2017, 80, 712–721. [Google Scholar] [CrossRef]
  6. Xing, X.H.; Cui, S.W.; Nie, S.P.; Phillips, G.O.; Goff, H.D.; Wang, Q. A review of isolation process, structural characteristics, and bioactivities of water-soluble polysaccharides from Dendrobium plants. Bioact. Carbohydr. Diet. Fibre 2013, 1, 131–147. [Google Scholar] [CrossRef]
  7. Ng, T.B.; Liu, J.; Wong, J.H.; Ye, X.; Wing, S.S.C.; Tong, Y.; Zhang, K.Y. Review of research o1n Dendrobium, a prized folk medicine. Appl. Microbiol. Biotechnol. 2012, 93, 1795–1803. [Google Scholar] [CrossRef]
  8. Mudiam, M.K.R.; Jin, Q.; Jiao, C.; Sun, S.; Song, C.; Cai, Y.; Lin, Y.; Fan, H.; Zhu, Y. Metabolic analysis of medicinal Dendrobium officinale and Dendrobium huoshanense during different growth years. PLoS ONE 2016, 11, e0146607. [Google Scholar]
  9. Gao, L.L.; Wang, F.; Hou, T.T.; Geng, C.Y.; Xu, T.; Han, B.X.; Liu, D. Dendrobium huoshanense C.Z.Tang et S.J.Cheng: A review of its traditional uses, phytochemistry, and pharmacology. Front. Pharmacol. 2022, 13, 920823. [Google Scholar] [CrossRef]
  10. Gu, F.L.; Huang, R.S.; He, X.M.; Chen, N.F.; Han, B.X.; Deng, H. Dendrobium huoshanense polysaccharides prevent inflammatory response of ulcerative colitis rat through inhibiting the NF-κB signaling pathway. Chem. Biodivers. 2021, 18, e2100130. [Google Scholar] [CrossRef]
  11. Liu, B.; Shang, Z.Z.; Li, Q.M.; Zha, X.Q.; Wu, D.L.; Yu, N.J.; Han, L.; Peng, D.Y.; Luo, J.P. Structural features and anti-gastric cancer activity of polysaccharides from stem, root, leaf and flower of cultivated Dendrobium huoshanense. Int. J. Biol. Macromol. 2020, 143, 651–664. [Google Scholar] [CrossRef]
  12. Wang, Y.H. Traditional uses, chemical constituents, pharmacological activities, and toxicological effects of Dendrobium leaves: A review. J. Ethnopharmacol. 2021, 270, 113851. [Google Scholar] [CrossRef] [PubMed]
  13. Han, R.C.; Xie, D.M.; Tong, X.H.; Zhang, W.; Liu, G.; Peng, D.Y.; Yu, N.J. Transcriptomic landscape of Dendrobium huoshanense and its genes related to polysaccharide biosynthesis. Acta Soc. Bot. Pol. 2018, 87, 1–11. [Google Scholar] [CrossRef] [Green Version]
  14. Yuan, Y.D.; Yu, M.Y.; Jia, Z.H.; Song, X.E.; Liang, Y.Q.; Zhang, J.C. Analysis of Dendrobium huoshanense transcriptome unveils putative genes associated with active ingredients synthesis. BMC Genom. 2018, 19, 978. [Google Scholar] [CrossRef] [PubMed]
  15. Han, R.C.; Liu, L.L.; Liu, J.L.; Xie, D.M.; Peng, D.Y.; Yu, N.J. Cloning and quantitative expression analysis of GMPP gene from Dendrobium huoshanense. Zhongguo Zhong Yao Za Zhi 2019, 44, 1552–1557. [Google Scholar]
  16. Zhou, P.N.; Pu, T.Z.; Gui, C.; Zhang, X.Q.; Gong, L. Transcriptome analysis reveals biosynthesis of important bioactive constituents and mechanism of stem formation of Dendrobium huoshanense. Sci. Rep. 2020, 10, 2857. [Google Scholar] [CrossRef] [PubMed] [Green Version]
  17. Yuan, Y.D.; Zuo, J.J.; Zhang, H.Y.; Li, R.Z.; Yu, M.Y.; Liu, S. Integration of transcriptome and metabolome provides new insights to flavonoids biosynthesis in Dendrobium huoshanense. Front. Plant Sci. 2022, 13, 850090. [Google Scholar] [CrossRef]
  18. Valoroso, M.C.; De Paolo, S.; Iazzetti, G.; Aceto, S. Transcriptome-wide identification and expression analysis of DIVARICATA-and RADIALIS-like genes of the Mediterranean Orchid Orchis italica. Genome Biol. Evol. 2017, 9, 1418–1431. [Google Scholar] [CrossRef] [Green Version]
  19. An, H.; Zhu, Q.; Pei, W.; Fan, J.; Liang, Y.; Cui, Y.; Lv, N.; Wang, W. Whole-transcriptome selection and evaluation of internal reference genes for expression analysis in protocorm development of Dendrobium officinale Kimura et Migo. PLoS ONE 2016, 11, e0163478. [Google Scholar] [CrossRef]
  20. Yi, Y.Q.; Liu, L.L.; Zhou, W.Y.; Peng, D.Y.; Han, R.C.; Yu, N.J. Characterization of GMPP from Dendrobium huoshanense yielding GDP-D-mannose. Open Life Sci. 2021, 16, 102–107. [Google Scholar] [CrossRef]
  21. Wu, J.; Meng, X.X.; Jiang, W.M.; Wang, Z.J.; Zhang, J.; Meng, F.; Yao, X.Y.; Ye, M.J.; Yao, L.; Wang, L.H.; et al. Qualitative proteome-wide analysis reveals the diverse functions of lysine crotonylation in Dendrobium huoshanense. Front. Plant Sci. 2022, 13, 822374. [Google Scholar] [CrossRef]
  22. De Magalhães, J.P.; Finch, C.E.; Janssens, G. Next-generation sequencing in aging research: Emerging applications, problems, pitfalls and possible solutions. Ageing Res. Rev. 2010, 9, 315–323. [Google Scholar] [CrossRef] [Green Version]
  23. Wong, M.L.; Medrano, J.F. Real-time PCR for mRNA quantitation. Biotechniques 2005, 39, 75–85. [Google Scholar] [CrossRef] [PubMed]
  24. Nolan, T.; Hands, R.E.; Bustin, S.A. Quantification of mRNA using real-time RT-PCR. Nat. Protoc. 2006, 1, 1559–1582. [Google Scholar] [CrossRef] [PubMed]
  25. Wen, L.; Tan, B.; Guo, W.W. Estimating transgene copy number in precocious trifoliate orange by TaqMan real-time PCR. Plant Cell Tissue Organ Cult. 2012, 109, 363–371. [Google Scholar] [CrossRef]
  26. Dheda, K.; Huggett, J.F.; Chang, J.S.; Kim, L.U.; Bustin, S.A.; Johnson, M.A.; Rook, G.A.; Zumla, A. The implications of using an inappropriate reference gene for real-time reverse transcription PCR data normalization. Anal. Biochem. 2005, 344, 141–143. [Google Scholar] [CrossRef]
  27. Liang, W.; Zou, X.; Carballar-Lejarazú, R.; Wu, L.; Sun, W.; Yuan, X.; Wu, S.; Li, P.; Ding, H.; Ni, L.; et al. Selection and evaluation of reference genes for qRT-PCR analysis in Euscaphis konishii Hayata based on transcriptome data. Plant Methods 2018, 14, 42. [Google Scholar] [CrossRef]
  28. Hou, S.; Zhao, T.; Yang, D.; Li, Q.; Liang, L.; Wang, G.; Ma, Q. Selection and validation of reference genes for quantitative RT-PCR analysis in Corylus heterophylla Fisch × Corylus avellana L. Plants 2021, 10, 159. [Google Scholar] [CrossRef]
  29. Li, Y.; Liang, X.; Zhou, X.; Wu, Z.; Yuan, L.; Wang, Y.; Li, Y. Selection of reference genes for qRT-PCR analysis in medicinal plant Glycyrrhiza under abiotic stresses and hormonal treatments. Plants 2020, 9, 1441. [Google Scholar] [CrossRef]
  30. Wu, Y.; Zhang, C.; Yang, H.; Lyu, L.; Li, W.; Wu, W. Selection and validation of candidate reference genes for gene expression analysis by RT-qPCR in Rubus. Int. J. Mol. Sci. 2021, 22, 10533. [Google Scholar] [CrossRef]
  31. Dong, X.M.; Zhang, W.; Zhang, S.B. Selection and validation of reference genes for quantitative real-time PCR analysis of development and tissue-dependent flower color formation in Cymbidium lowianum. Int. J. Mol. Sci. 2022, 23, 738. [Google Scholar] [CrossRef]
  32. Yang, Z.; Zhang, R.; Zhou, Z. Identification and validation of reference genes for gene expression analysis in Schima superba. Genes 2021, 12, 732. [Google Scholar] [CrossRef]
  33. Zhang, Y.; Zhu, L.; Xue, J.; Yang, J.; Hu, H.; Cui, J.; Xu, J. Selection and verification of appropriate reference genes for expression normalization in Cryptomeria fortunei under abiotic stress and hormone treatments. Genes 2021, 12, 791. [Google Scholar] [CrossRef]
  34. He, Y.; Zhong, Y.; Bao, Z.; Wang, W.; Xu, X.; Gai, Y.; Wu, J. Evaluation of Angelica decursiva reference genes under various stimuli for RT-qPCR data normalization. Sci. Rep. 2021, 11, 18993. [Google Scholar] [CrossRef]
  35. Wang, B.; Duan, H.; Chong, P.; Su, S.; Shan, L.; Yi, D.; Wang, L.; Li, Y. Systematic selection and validation of suitable reference genes for quantitative real-time PCR normalization studies of gene expression in Nitraria tangutorum. Sci. Rep. 2020, 10, 15891. [Google Scholar] [CrossRef]
  36. Yi, S.Y.; Lin, Q.W.; Zhang, X.J.; Wang, J.; Miao, Y.Y.; Tan, N.H. Selection and validation of appropriate reference genes for quantitative RT-PCR Analysis in Rubia yunnanensis Diels based on transcriptome data. Biomed Res. Int. 2020, 2020, 5824841. [Google Scholar] [CrossRef] [Green Version]
  37. Zhang, Z.; Li, C.; Zhang, J.; Chen, F.; Gong, Y.; Li, Y.; Su, Y.; Wei, Y.; Zhao, Y. Selection of the reference gene for expression normalization in Papaver somniferum L. under abiotic stress and hormone treatment. Genes 2020, 11, 124. [Google Scholar] [CrossRef] [Green Version]
  38. Song, H.; Mao, W.; Duan, Z.; Que, Q.; Zhou, W.; Chen, X.; Li, P. Selection and validation of reference genes for measuring gene expression in Toona ciliata under different experimental conditions by quantitative real-time PCR analysis. BMC Plant Biol. 2020, 20, 450. [Google Scholar] [CrossRef]
  39. Song, C.; Ma, J.B.; Li, G.H.; Pan, H.Y.; Zhu, Y.F.; Jin, Q.; Cai, Y.P.; Han, B.X. Natural composition and biosynthetic pathways of alkaloids in medicinal Dendrobium species. Front. Plant Sci. 2022, 13, 850949. [Google Scholar] [CrossRef]
  40. Ulrich, M.N.; Muñiz-Padilla, E.; Corach, A.; Hopp, E.; Tosto, D. Validation of reference genes for quantitative PCR in Johnsongrass (Sorghum halepense L.) under glyphosate stress. Plants 2021, 10, 1555. [Google Scholar] [CrossRef]
  41. Duan, M.; Wang, J.; Zhang, X.; Yang, H.; Wang, H.; Qiu, Y.; Song, J.; Guo, Y.; Li, X. Identification of optimal reference genes for expression analysis in Radish (Raphanus sativus L.) and its relatives based on expression stability. Front. Plant Sci. 2017, 8, 1605. [Google Scholar] [CrossRef] [Green Version]
  42. Song, Y.; Wang, Y.; Guo, D.; Jing, L. Selection of reference genes for quantitative real-time PCR normalization in the plant pathogen Puccinia helianthi Schw. BMC Plant Biol. 2019, 19, 20. [Google Scholar] [CrossRef]
  43. Vandesompele, J.; De Preter, K.; Pattyn, F.; Poppe, B.; Van Roy, N.; De Paepe, A.; Speleman, F. Accurate normalization of real-time quantitative RT-PCR data by geometric averaging of multiple internal control genes. Genome Biol. 2002, 3, research0034.1. [Google Scholar] [CrossRef] [Green Version]
  44. Andersen, C.L.; Jensen, J.L.; Ørntof, T.F. Normalization of real-time quantitative reverse transcription-PCR data: A model based variance estimation approach to identify genes suited for normalization, applied to bladder and colon cancer data sets. Cancer Res. 2004, 64, 5245–5250. [Google Scholar] [CrossRef] [Green Version]
  45. Pfaf, M.W.; Tichopad, A.; Prgomet, C.; Neuvians, T.P. Determination of stable housekeeping genes, diferentially regulated target genes and sample integrity: BestKeeper–Excel-based tool using pair-wise correlations. Biotechnol. Lett. 2004, 26, 509–515. [Google Scholar] [CrossRef]
  46. Zhang, J.; He, C.; Wu, K.; da Silva, J.A.T.; Zeng, S.; Zhang, X.; Yu, Z.; Xia, H.; Duan, J. Transcriptome analysis of Dendrobium officinale and its application to the identification of genes associated with polysaccharide synthesis. Front. Plant Sci. 2016, 7, 5. [Google Scholar] [CrossRef] [Green Version]
  47. Sun, H.P.; Li, F.; Ruan, Q.M.; Zhong, X.H. Identification and validation of reference genes for quantitative real-time PCR studies in Hedera helix L. Plant Physiol. Biochem. 2016, 108, 286–294. [Google Scholar] [CrossRef]
  48. Pfaffl, M.W. A new mathematical model for relative quantification in real-time RT-PCR. Nucleic Acids Res. 2001, 29, e45. [Google Scholar] [CrossRef]
  49. Zhuang, H.H.; Fu, Y.P.; He, W.; Wang, L.; Wei, Y.H. Selection of appropriate reference genes for quantitative real-time PCR in Oxytropis ochrocephala Bunge using transcriptome datasets under abiotic stress treatments. Front. Plant Sci. 2015, 6, 475. [Google Scholar] [CrossRef] [Green Version]
  50. Deng, Y.; Chen, L.X.; Han, B.X.; Wu, D.T.; Cheong, K.; Chen, N.F.; Zhao, J.; Li, S.P. Qualitative and quantitative analysis of specific polysaccharides in Dendrobium huoshanense by using saccharide mapping and chromatographic methods. J. Pharm. Biomed. Anal. 2016, 129, 163–171. [Google Scholar] [CrossRef]
  51. Chen, S.T.; Dai, J.; Song, X.W.; Jiang, X.P.; Zhao, Q.; Sun, C.B.; Chen, C.W.; Chen, N.D.; Han, B.X. Endophytic microbiota comparison of Dendrobium huoshanense root and stem in different growth years. Planta Med. 2020, 86, 967–975. [Google Scholar] [CrossRef]
  52. Li, Z.Q.; Zhou, H.Q.; Ouyang, Z.; Dai, J.; Yue, Q.; Wei, Y.; Han, B.X. Comparison of active ingredients and protective effects of Dendrobium huoshanense of different growth years on acute liver injury. Zhongguo Zhong Yao Za Zhi 2021, 46, 298–305. [Google Scholar] [PubMed]
  53. Wan, J.Q.; Gong, X.H.; Wang, F.X.; Wen, C.W.; Wei, Y.; Han, B.X.; Ouyang, Z. Comparative analysis of chemical constituents by HPLC-ESI-MSn and antioxidant activities of Dendrobium huoshanense and Dendrobium officinale. Biomed. Chromatogr. 2022, 36, 7–18. [Google Scholar] [CrossRef] [PubMed]
  54. Han, B.X.; Jing, Y.; Dai, J.; Zheng, T.; Gu, F.L.; Zhao, Q.; Zhu, F.C.; Song, X.W.; Deng, H.; Wei, P.P.; et al. A chromosome-level genome assembly of Dendrobium huoshanense using long reads and Hi-C data. Genome Biol. Evol. 2020, 12, 2486–2490. [Google Scholar] [CrossRef] [PubMed]
  55. Riseh, R.S.; Skorik, Y.A.; Thakur, V.K.; Pour, M.M.; Tamanadar, E.; Noghabi, S.S. Encapsulation of plant biocontrol bacteria with alginate as a main polymer material. Int. J. Mol. Sci. 2021, 22, 11165. [Google Scholar] [CrossRef]
  56. Yuan, Y.D.; Tang, X.G.; Jia, Z.H.; Li, C.; Ma, J.Y.; Zhang, J.C. The effects of ecological factors on the main medicinal components of Dendrobium officinale under different cultivation modes. Forests 2020, 11, 94. [Google Scholar] [CrossRef] [Green Version]
  57. Jiang, M.; Xu, S.Z.; Wen, G.S.; Zhao, C.L. Validation of seven housekeeping genes as reference ones for qRT-PCR normalization in Dendrobium catenatum. Russ. J. Plant Physiol. 2017, 64, 497–508. [Google Scholar] [CrossRef]
  58. Basu, S.; Pereira, A.; Pinheiro, D.; Wang, H.; Valencia-Jiménez, A.; Siegfried, B.; Louis, J.; Zhou, X.; Velez, A. Evaluation of reference genes for real-time quantitative PCR analysis in southern corn rootworm, Diabrotica undecimpunctata howardi (Barber). Sci. Rep. 2019, 9, 10703. [Google Scholar] [CrossRef]
  59. Bao, Z.Z.; Zhang, K.D.; Lin, H.F.; Li, C.J.; Zhao, X.R.; Wu, J.; Nian, S.H. Identification and selection of reference genes for quantitative transcript analysis in Corydalis yanhusuo. Genes 2020, 11, 130. [Google Scholar] [CrossRef] [Green Version]
  60. Wang, Z.L.; Xu, J.Y.; Liu, Y.H.; Chen, J.Y.; Lin, H.F.; Huang, Y.L.; Bian, X.H.; Zhao, Y.C. Selection and validation of appropriate reference genes for real-time quantitative PCR analysis in Momordica charantia. Phytochemistry 2019, 164, 1–11. [Google Scholar] [CrossRef]
Figure 1. Specificity of primer pairs of all candidate reference genes for qPCR amplification. Here, M represents the DNA size marker. Lanes 1–15 are as follows: TBP, UBCE, NCBP2, eIF, APT1, RPL5, GAPDH, EF-1α, F-box, TIP41, PEPC, PP2A, MDH, PTBP3, and CYP71.
Genes 13 01486 g001
Figure 2. Specificity of primer pairs of qPCR amplification. Melting curves of 15 candidate reference genes exhibiting only single peaks.
Genes 13 01486 g002
Figure 3. The comparison of raw cycle threshold (Ct) of the 15 candidate reference genes in different samples. The box graph indicates the 25th and 75th percentiles, with the lines in the center of the boxes indicate the medians. The whisker caps represent the maximum and minimum values, respectively.
Genes 13 01486 g003
Figure 4. The rankings of the average expression stability values (M) of 15 reference genes using geNorm. Lower M values indicate more stable gene expression.
Genes 13 01486 g004
Figure 5. The pairwise variation values (Vn/Vn + 1) of all candidates calculated using the geNorm to confirm the optimal number of reference genes for qPCR data accurate normalization; the threshold used was 0.15, below which the inclusion of an additional reference gene is not necessary.
Genes 13 01486 g005
Figure 6. Relative expression levels of CESA and GMPP normalized by the selected reference genes in different tissues (root, stem, and leaf) and methyl jasmonate (MeJA) treatment. (A) The CESA expression level on different tissues; (B) The GMPP expression level in different tissues; (C) The CESA and GMPP expression level in the stem under MeJA treatment (* p < 0.05; Here, N.S. indicates no significant difference). The error bars represent the mean ± SD of three biological replicates.
Genes 13 01486 g006
Table 1. Candidate genes and primer pairs used for qPCR normalization in D. huoshanense.
Gene
Symbol
Gene NameArabidopsis
Homolog
Locus
Primer Sequence (5′–3′)Amplicon Length (bp *)Primers Tm * (°C)E * (%)R2 *
GAPDHGlyceraldehyde-3-phosphate dehydrogenaseAT1G16300.1F: TGCTTACGGCGATTACTTCC27958.2/58.696.9790.994
R: CTTCCAATACGACCAAAACCAT
eIFEukaryotic translation initiation factorAT3G60240.2F: CCATTCCATCTGTCCCCCC12161.8/60.197.1010.998
R: GGACCCCTAAACGGAAAACATA
EF-1αElongation factor 1-α-likeAT1G07920.1F: GCCCAACCGATAAGCCACT13859.8/59.192.4030.997
R: TGAGTCCAGTAGGTCCGAAGG
PP2ASerine/threonine protein phosphatase 2AAT3G2580.1F: CGCTGCTCTTGGAAAACTGT21058.0/59.096.7710.998
R: ACTTCTGCCTCATTATCACGGA
UBCEUbiquitin conjugating enzyme E2AT1G50490.1F: AATAGATGGAGGCAAGGGAACT12359.0/59.0102.920.997
R: TTGGGATGGAAACAGGAGGT
RPL5Ribosomal protein L5AT5G39740.1F: CGATTTGTTGTGCGATTTACG27059.5/59.497.7040.996
R: CCTCCTGCTTTCTGCTGGTT
TBPTATA box binding protein likeAT1G55520.1F: GGCATCCTTCTGGTATTGTCC25258.5/58.4104.770.998
R: TACGAGCATACTTCCGAGCAG
APT1Adenine phosphoribosyltransferase 1AT1G27450.1F: ATGGCGTCCGTGGATGAA11459.8/58.893.6360.999
R: CAGCAGCAGCGTCGTGATA
MDHMalate dehydrogenaseAT5G43330.1F: TTGCTGATGATGAGTGGCTGAG14261.0/59.598.4030.991
R: CCAAGGACCCAATCACGAAT
PTBP3Polypyrimidine tract binding protein homolog 3AT1G43190.1F: CACCTGACACCCGTGAGTTTG20960.9/61.293.9380.998
R: TTGCCTCTTACCATTCACCTCTATC
PEPCPhosphoenolpyruvate carboxykinaseAT4G37870.1F: TGACATCATCCACAAGCATAGACA28360.5/59.490.5020.995
R: GAAACACCATTATCACTCCAGCA
CYP71Cyclophilin 71AT3G44600.1F: TGAATGGGTCTACAAACAAGGAG22758.7/59.692.8060.993
R: GCAATGTTGTAGGGCTCCAGTA
NCBP2nuclear cap binding protein subunit 2AT5G44200.1F: GACTCCCTGTGGCTTTTGCT14659.2/59.4100.380.999
R: GACCCCATTGTCTTCCTTCTTC
TIP41TIP41-like proteinAT4G34270.1F: TGGCAGCGAAGCAGTAGAAC20060.2/60.8101.450.996
R: GAACTTTTACGGTCAAGAGGGAT
F-boxF-box proteinAT5G39450.1F: TTTCCCCGCAGTTTTCACG16958.9/58.8102.650.990
R: TTGGAACCTTCAGGCGGACT
GMPPGDP-mannose pyrophosphorylaseAT1G74910.1F: GAATGTTCCGAAGCCGTTGT13058.9/58.694.4651
R: AGCAAACTCCCGTTCCTCAT
CESAcellulose synthase AAT3G03050.1F: CTTTGTTTCAACTGCTGACCCT19358.8/58.294.5400.999
R: ACGACAGAAAGGAACCCATAGA
* Here, bp, Tm, E, and R2 mean base pair, melting temperature, PCR efficiency, and correlation coefficient, respectively. Standard curves of 15 candidate reference genes and two target genes were shown in Figure S1.
Table 2. Expression stability rank of 15 candidate reference genes by NormFinder.
RankH2O2PEGColdUVMeJATissueTotal
1TBP(0.006)NCBP2(0.022)TBP(0.013)EF-1α(0.012)TBP(0.015)MDH(0.145)NCBP2(0.143)
2NCBP2(0.006)CYP71(0.022)CYP71(0.029)CYP71(0.023)APT1(0.015)NCBP2(0.147)MDH(0.205)
3eIF(0.009)TBP(0.029)PP2A(0.043)NCBP2(0.037)PP2A(0.015)RPL5(0.162)APT1(0.258)
4RPL5(0.027)PP2A(0.029)APT1(0.055)TBP(0.046)EF-1α(0.027)UBCE(0.236)UBCE(0.280)
5PTBP3(0.038)eIF(0.033)UBCE(0.068)UBCE(0.050)eIF(0.032)TBP(0.283)TBP(0.293)
6MDH(0.047)UBCE(0.067)eIF(0.089)APT1(0.052)PTBP3(0.041)CYP71(0.289)CYP71(0.307)
7CYP71(0.091)APT1(0.099)TIP41(0.114)PTBP3(0.089)MDH(0.070)F-box(0.336)PP2A(0.349)
8APT1(0.175)PTBP3(0.130)EF-1α(0.114)F-box(0.119)NCBP2(0.089)APT1(0.336)EF-1α(0.355)
9EF-1α(0.216)RPL5(0.190)GAPDH(0.126)PEPC(0.122)CYP71(0.144)eIF(0.339)RPL5(0.381)
10UBCE(0.218)MDH(0.231)PEPC(0.129)MDH(0.127)F-box(0.194)PTBP3(0.440)eIF(0.381)
11F-box(0.238)F-box(0.239)MDH(0.131)RPL5(0.130)RPL5(0.235)EF-1α(0.447)F-box(0.394)
12PEPC(0.250)EF-1α(0.310)NCBP2(0.163)PP2A(0.131)PEPC(0.238)PEPC(0.575)PTBP3(0.507)
13PP2A(0.264)PEPC(0.387)RPL5(0.170)eIF(0.142)UBCE(0.262)PP2A(0.593)PEPC(0.724)
14GAPDH(0.300)TIP41(1.214)F-box(0.202)TIP41(0.146)GAPDH(0.844)GAPDH(0.803)TIP41(1.22)
15TIP41(1.18)GAPDH(1.23)PTBP3(0.274)GAPDH(0.149)TIP41(1.15)TIP41(1.04)GAPDH(1.31)
Table 3. Expression stability values (CV ± SD) of internal reference genes calculated by BestKeeper.
RankH2O2PEGColdUVMeJATissueTotal
1TBPNCBP2EF-1αEF-1αeIFPTBP3MDH
0.13 ± 0.030.10 ± 0.020.47 ± 0.100.21 ± 0.050.37 ± 0.091.42 ± 0.391.62 ± 0.36
2RPL5CYP71UBCECYP71EF-1αPEPCTBP
0.15 ± 0.030.20 ± 0.050.53 ± 0.140.34 ± 0.080.40 ± 0.092.02 ± 0.561.65 ± 0.44
3NCBP2TBPCYP71TBPTBPUBCEPTBP3
0.17 ± 0.040.21 ± 0.060.53 ± 0.140.36 ± 0.100.55 ± 0.142.06 ± 0.541.73 ± 0.47
4eIFeIFAPT1UBCEAPT1TBPUBCE
0.21 ± 0.050.40 ± 0.110.59 ± 0.150.40 ± 0.090.57 ± 0.142.09 ± 0.561.90 ± 0.49
5PTBP3PP2ATBPNCBP2NCBP2EF-1αCYP71
0.39 ± 0.100.47 ± 0.110.77 ± 0.200.42 ± 0.100.62 ± 0.152.11 ± 0.491.92 ± 0.50
6MDHAPT1NCBP2PTBP3MDHF-boxNCBP2
0.59 ± 0.130.62 ± 0.160.82 ± 0.210.42 ± 0.120.64 ± 0.142.32 ± 0.662.03 ± 0.51
7CYP71UBCEGAPDHMDHPTBP3NCBP2F-box
0.60 ± 0.150.67 ± 0.170.84 ± 0.210.44 ± 0.110.64 ± 0.172.69 ± 0.692.18 ± 0.62
8APT1PTBP3PTBP3PEPCPP2ACYP71APT1
0.94 ± 0.240.73 ± 0.200.84 ± 0.220.45 ± 0.110.67 ± 0.152.96 ± 0.782.27 ± 0.58
9UBCERPL5PP2AAPT1CYP71APT1EF-1α
0.97 ± 0.250.97 ± 0.230.91 ± 0.210.45 ± 0.120.85 ± 0.213.09 ± 0.802.68 ± 0.61
10F-boxF-boxTIP41RPL5F-boxMDHeIF
0.98 ± 0.271.06 ± 0.300.93 ± 0.280.52 ± 0.110.94 ± 0.263.12 ± 0.702.76 ± 0.71
11PEPCMDHRPL5PP2APEPCRPL5PP2A
1.06 ± 0.291.54 ± 0.340.98 ± 0.210.52 ± 0.141.21 ± 0.323.27 ± 0.762.84 ± 0.67
12EF-1αEF-1αMDHF-boxUBCEeIFPEPC
1.15 ± 0.251.77 ± 0.401.06 ± 0.230.57 ± 0.161.47 ± 0.393.34 ± 0.883.12 ± 0.84
13GAPDHPEPCeIFeIFRPL5GAPDHRPL5
1.19 ± 0.321.81 ± 0.481.09 ± 0.271.05 ± 0.261.61 ± 0.353.92 ± 1.093.27 ± 0.74
14PP2ATIP41F-boxTIP41GAPDHTIP41TIP41
1.45 ± 0.345.01 ± 1.401.27 ± 0.361.10 ± 0.253.89 ± 0.994.97 ± 1.405.40 ± 1.54
15TIP41GAPDHPEPCGAPDHTIP41PP2AGAPDH
5.01 ± 1.445.49 ± 1.451.96 ± 0.281.13 ± 0.254.72 ± 1.315.28 ± 1.266.99 ± 1.81
Table 4. Expression stability of candidate internal reference genes by RefFinder.
RankH2O2PEGColdUVMeJATissueTotal
1TBP(1.41)CYP71(1.41)TBP(1.97)EF-1α(1.63)APT1(1.41)MDH(1.68)MDH(1.41)
2RPL5(2.00)NCBP2(1.57)CYP71(2.45)CYP71(2.45)TBP(2.34)RPL5(2.71)NCBP2(1.57)
3NCBP2(2.21)TBP(2.45)PP2A(2.99)NCBP2(3.83)EF-1α(2.63)NCBP2(3.35)UBCE(3.72)
4eIF(3.22)PP2A(3.94)UBCE(3.13)APT1(3.98)PP2A(3.46)UBCE(3.94)TBP(3.76)
5PTBP3(5.00)eIF(4.73)APT1(5.05)TBP(4.79)eIF(3.98)TBP(4.47)CYP71(4.82)
6MDH(6.24)APT1(6.70)EF-1α(5.48)PEPC(5.42)MDH(5.66)PTBP3(5.90)APT1(5.01)
7CYP71(6.74)UBCE(6.70)eIF(6.24)UBCE(6.45)PTBP3(6.45)EF-1α(6.48)PP2A(7.65)
8APT1(8.24)PTBP3(7.48)GAPDH(7.65)PTBP3(8.37)NCBP2(7.74)CYP71(6.82)EF-1α(8.00)
9EF-1α(8.97)RPL5(9.00)TIP41(8.57)RPL5(8.66)CYP71(9.00)F-box(7.61)PTBP3(8.49)
10UBCE(9.97)F-box(10.2)MDH(9.06)MDH(9.84)F-box(10.0)eIF(8.53)RPL5(9.67)
11PEPC(11.2)MDH(11.5)NCBP2(9.16)F-box(10.1)RPL5(11.2)APT1(9.19)eIF(10.2)
12F-box(11.5)EF-1α(11.7)PEPC(11.5)PP2A(10.4)PEPC(12.2)PEPC(9.64)F-box(10.5)
13PP2A(13.2)PEPC(13.0)RPL5(12.5)TIP41(10.6)UBCE(12.5)PP2A(13.2)PEPC(13.0)
14GAPDH(13.7)TIP41(14.0)PTBP3(12.7)GAPDH(11.0)GAPDH(14.0)GAPDH(13.7)TIP41(14.0)
15TIP41(15.0)GAPDH(15.0)F-box(14.2)eIF(12.3)TIP41(15.0)TIP41(15.0)GAPDH(15.0)
Publisher’s Note: MDPI stays neutral with regard to jurisdictional claims in published maps and institutional affiliations.

