Project Report

Genome-Wide Analysis and Expression of the GRAS Transcription Factor Family in Avena sativa

Heilongjiang Provincial Key Laboratory of Oilfield Applied Chemistry and Technology, College of Bioengineering, Daqing Normal University, Daqing 163712, China
*
Author to whom correspondence should be addressed.
Genes 2023, 14(1), 164; https://doi.org/10.3390/genes14010164
Submission received: 28 November 2022 / Revised: 3 January 2023 / Accepted: 4 January 2023 / Published: 6 January 2023
(This article belongs to the Special Issue Genome-Wide Identifications: Recent Trends in Genomic Studies)

Abstract

:
The GRAS transcription factor is an important transcription factor in plants. In recent years, more GRAS genes have been identified in many plant species. However, the GRAS gene family has not yet been studied in Avena sativa. We identified 100 members of the GRAS gene family in A. sativa (Avena sativa), named them AsGRAS1~AsGRAS100 according to the positions of 21 chromosomes, and classified them into 9 subfamilies. In this study, the motif and gene structures were also relatively conserved in the same subfamilies. At the same time, we found a great deal related to the stress of cis-acting promoter regulatory elements (MBS, ABRE, and TC-rich repeat elements). qRT-PCR suggested that the AsGRAS gene family (GRAS gene family in A. sativa) can regulate the response to salt, saline–alkali, and cold and freezing abiotic stresses. The current study provides original and detailed information about the AsGRAS gene family, which contributes to the functional characterization of GRAS proteins in other plants.

1. Introduction

GRAS transcription factors are important transcription factors in plants, and the GRAS gene family is named after GAI, RGA, and SCR [1]. GRAS proteins consist of variable N-terminals and the highly-conserved C-terminal. The GRAS family members have special GRAS domains and high homology at the C-terminal [2]. The C-terminal GRAS domain plays an important role in regulating gene expression. The C-terminus includes a few ordered motifs, namely LRI, VHIID, LHRII, LRII, PFYRE, LHRI, and SAW [1].
GRAS genes play important roles in regulating the responses to abiotic stresses in plants. Transgenic BnLAS Arabidopsis thaliana plants had higher drought tolerances than wild type plants [3]. The PeSCL7 gene of Populus euphratica was transferred into A. thaliana (Arabidopsis thaliana), which improved the drought resistance and salt tolerance of transgenic plants [4]. Overexpression of OsGRAS23 increases drought resistance and oxidative stress resistance and reduces hydrogen peroxide accumulation [5]. VaPAT1 enhances the cold tolerance of grapes by promoting JA biosynthesis [6].
A. sativa is an economic grass family of Poaceae. Cultivated A. sativa exists as an allohexaploid (AACCDD, 2n  =  6x  =  42), and A. sativa has the potential to replace animal-based foods because of its low carbon footprint and great health benefits [7]. Information about the high-quality A. sativa allohexaploid genome was published in 2021 [8]. This result also sets the functional characterization of studying the genome-wide analysis of the oat GRAS gene family. Oats will be crucial crops for the future and can support crop diversification in response to changing climatic circumstances. Oats are less demanding on soil and they grow well in saline soils; moreover, oats have a strong drought tolerance [9]. Energy expenditure (glycolysis) and biosynthesis (starch and sugar metabolism) were increased in A. sativa under abiotic stress [10]. At the same time, the production of A. sativa decreased and the average grain weight per plant reduced under abiotic stress [11].
In recent years, more GRAS genes have been identified in many plant species, such as alfalfa (Medicago sativa), Mignonette (Melilotus albus), millet (Setaria italica), poplar tree (Populus), Tartary buckwheat (Fagopyrum tataricum), and pepper (Capsicum annuum L.) [12,13,14,15,16,17], but GRAS has not yet been studied in A. sativa. In this study, we performed a further analysis of the GRAS gene family genome in A. sativa. We used bioinformatic methods to analyze the gene structures, homologous evolutionary relationships, and gene sequences of AsGRAS. The results of our study will help further the investigations into the evolutionary relationships and homologous structures of the GRAS gene families and provide a theoretical basis for the functional analysis of GRAS proteins under abiotic stress.

2. Materials & Methods

2.1. AsGRAS Gene Family Identification

We obtained the sequence of members of the A. sativa GRAS family from the PlantTFDB database website (http://planttfdb.gao-lab.org/ accessed on 1 November 2022). To find candidate GRAS genes, we performed an extensive search and comparison identification for the GRAS domain in A. sativa using the blast search and HMMER software (http://hmmer.org accessed on 1 November 2022). We identified the molecular weight (MW), isoelectric point (pI), and length of each GRAS protein through the online ExPASy program (http://www.expasy.org/tools/accessed on 1 November 2022) [18]. Detailed information on the GRAS protein in A. sativa is shown in Table S1.

2.2. Analysis of A. sativa GRAS Gene Evolution

The identified AsGRAS proteins were combined with the well-sorted A. thaliana and O. sativa (Oryza sativa) GRAS proteins and aligned using Clustalx. In addition, we used MEGA7 [19] software to construct the phylogenetic tree. The AsGRAS genes were further divided into different subfamilies based on the homology with GRAS genes in A. thaliana and O. sativa.

2.3. Analysis of the Conserved Motif and Gene Structure

To predict the conservative domains of genes, we used the CD-search tool (https://www.ncbi.nlm.nih.gov/cdd/ accessed on 1 November 2022) in NCBI. We extracted exons and introns of the GRAS family from the genome annotation information of A. sativa, and submitted them to the website tool GSDS for analysis and display. We predicted the matrix of GRAS proteins of A. sativa by using the MEME online program [20]. Moreover, we used the TBtools software [21] to comprehensively analyze the conserved motif and gene structure.

2.4. Chromosome Localization and Gene Replication Analysis of GRAS Genes

We used Blast software [22] to compare A. thaliana and O. sativa and selected gene pairs of more than 75% similarity. Then we used Circos software [23] to construct the collinearity plot. Replications of GRAS genes were identified and supplemented by using the PGDD database (http://chibba.agtec.uga.edu/duplication/accessed on 1 November 2022) [23].

2.5. Cis-Elements Analysis

To understand the GRAS gene family, we analyzed the cis-acting promoter regulatory elements of GRAS in A. sativa. We detected the sequences within 1500 (bp) upstream of the initiation codons (ATG) for the promoter analysis and looked for these sequences in the oat genome. The cis-elements were searched for through the PlantCARE database in promoters (http://bioinformatics.psb.ugent.be/webtools/plantcare/html/ accessed on 1 November 2022).

2.6. Gene Regulatory Network Analysis of the AsGRAS

We used Blast to compare A. thaliana and O. sativa, selected the protein sequences of the GRAS transcription factor in the A. sativa genome database, and localized them in the A. thaliana Information Resource Database to determine the protein sequences of A. thaliana GRAS. We used the PAIR website (http://www.cls.zju.edu.cn/pair/ accessed on 1 November 2022) to predict interactions between GRAS and other proteins and a network of interactions in Cytoscape software [24] was exhibited.

2.7. Collinearity Analysis of the A. sativa GRAS Gene Families

We used MCScanX technology to look for potential homologous gene pairs (E < 1e−5, top 5 matched pairs). By Blast, comparing the gene sequences of A. sativa and A. thaliana with O. sativa, the collinearity between oats and these two species was sought.

2.8. Plant Material and Treatments

A. sativa (CV Qinqiong) was used in this study. In the greenhouse, seeds were planted in a 3:1 (w/w) mixture of soil and sand, germinated, and irrigated with a half-strength Hoagland solution once every 2 days [25]. The seedlings were grown in a night temperature of 18 °C and a day temperature of 24 °C (salt and saline), relative humidity of 60–80%, a 14/10 h photoperiod (daytime, 06:00–20:00), and a light intensity of 200–230 μmol m−2 s−2. After 4 weeks, the whole germinated seedlings were treated with 150 mM NaCl solution (salt) and 150 mM Na2CO3 and NaHCO3 (saline), at 8 °C (cold), and 4 °C (freeze). Control and treated seedlings were harvested for 6, 12, 24, and 48 h after treatment. Samples were immediately frozen (the whole germinated seedlings) in liquid nitrogen and stored at −80 °C until used for RNA extraction.

2.9. Expression Levels under Stress Treatments

The experimental procedure complied with MIQE guidelines. According to the manufacturer’s protocol, total RNA was extracted from whole seedlings by using RNA to prepare pure plant kits. We stained with a 1.0% (w/v) agarose gel to assess the RNA quality and removed the DNA contamination with DNaseI treatment. The generated cDNA was stored at −80 °C. Primers were designed by the Primer website (https://www.sangon.com/in_vitro_diagnostic_primers_and_probes.html accessed on 1 November 2022). Moreover, 28 primers were forecasted by the NCBI primer design tool in Table S2 (https://www.ncbi.nlm.nih.gov/tools/primer-blast accessed on 1 November 2022), and 28 AsGRASs were quantified under salt, saline–alkali, cold, and freezing abiotic stress; we used SPSS software to analyze differently significant expressions (p < 0.05) and the expressions of these genes were analyzed under 4 stresses.

3. Results

3.1. AsGRAS Gene Family Identification and Analysis of Physiochemical Properties

We found 100 GRAS proteins in A. sativa through the identification and analysis of the GRAS gene family (Table S1). We predicted that among the 100 GRAS proteins, the lengths of aminophenol ranged from 160 (AsGRAS82) to 1477 aa (AsGRAS51), molecular weights ranged from 2406.74 to 7016.67 Da, and isoelectric points ranged from 3.01 (AsGRAS47, AsGRAS57, and AsGRAS58) to 12.08 (AsGRAS18).

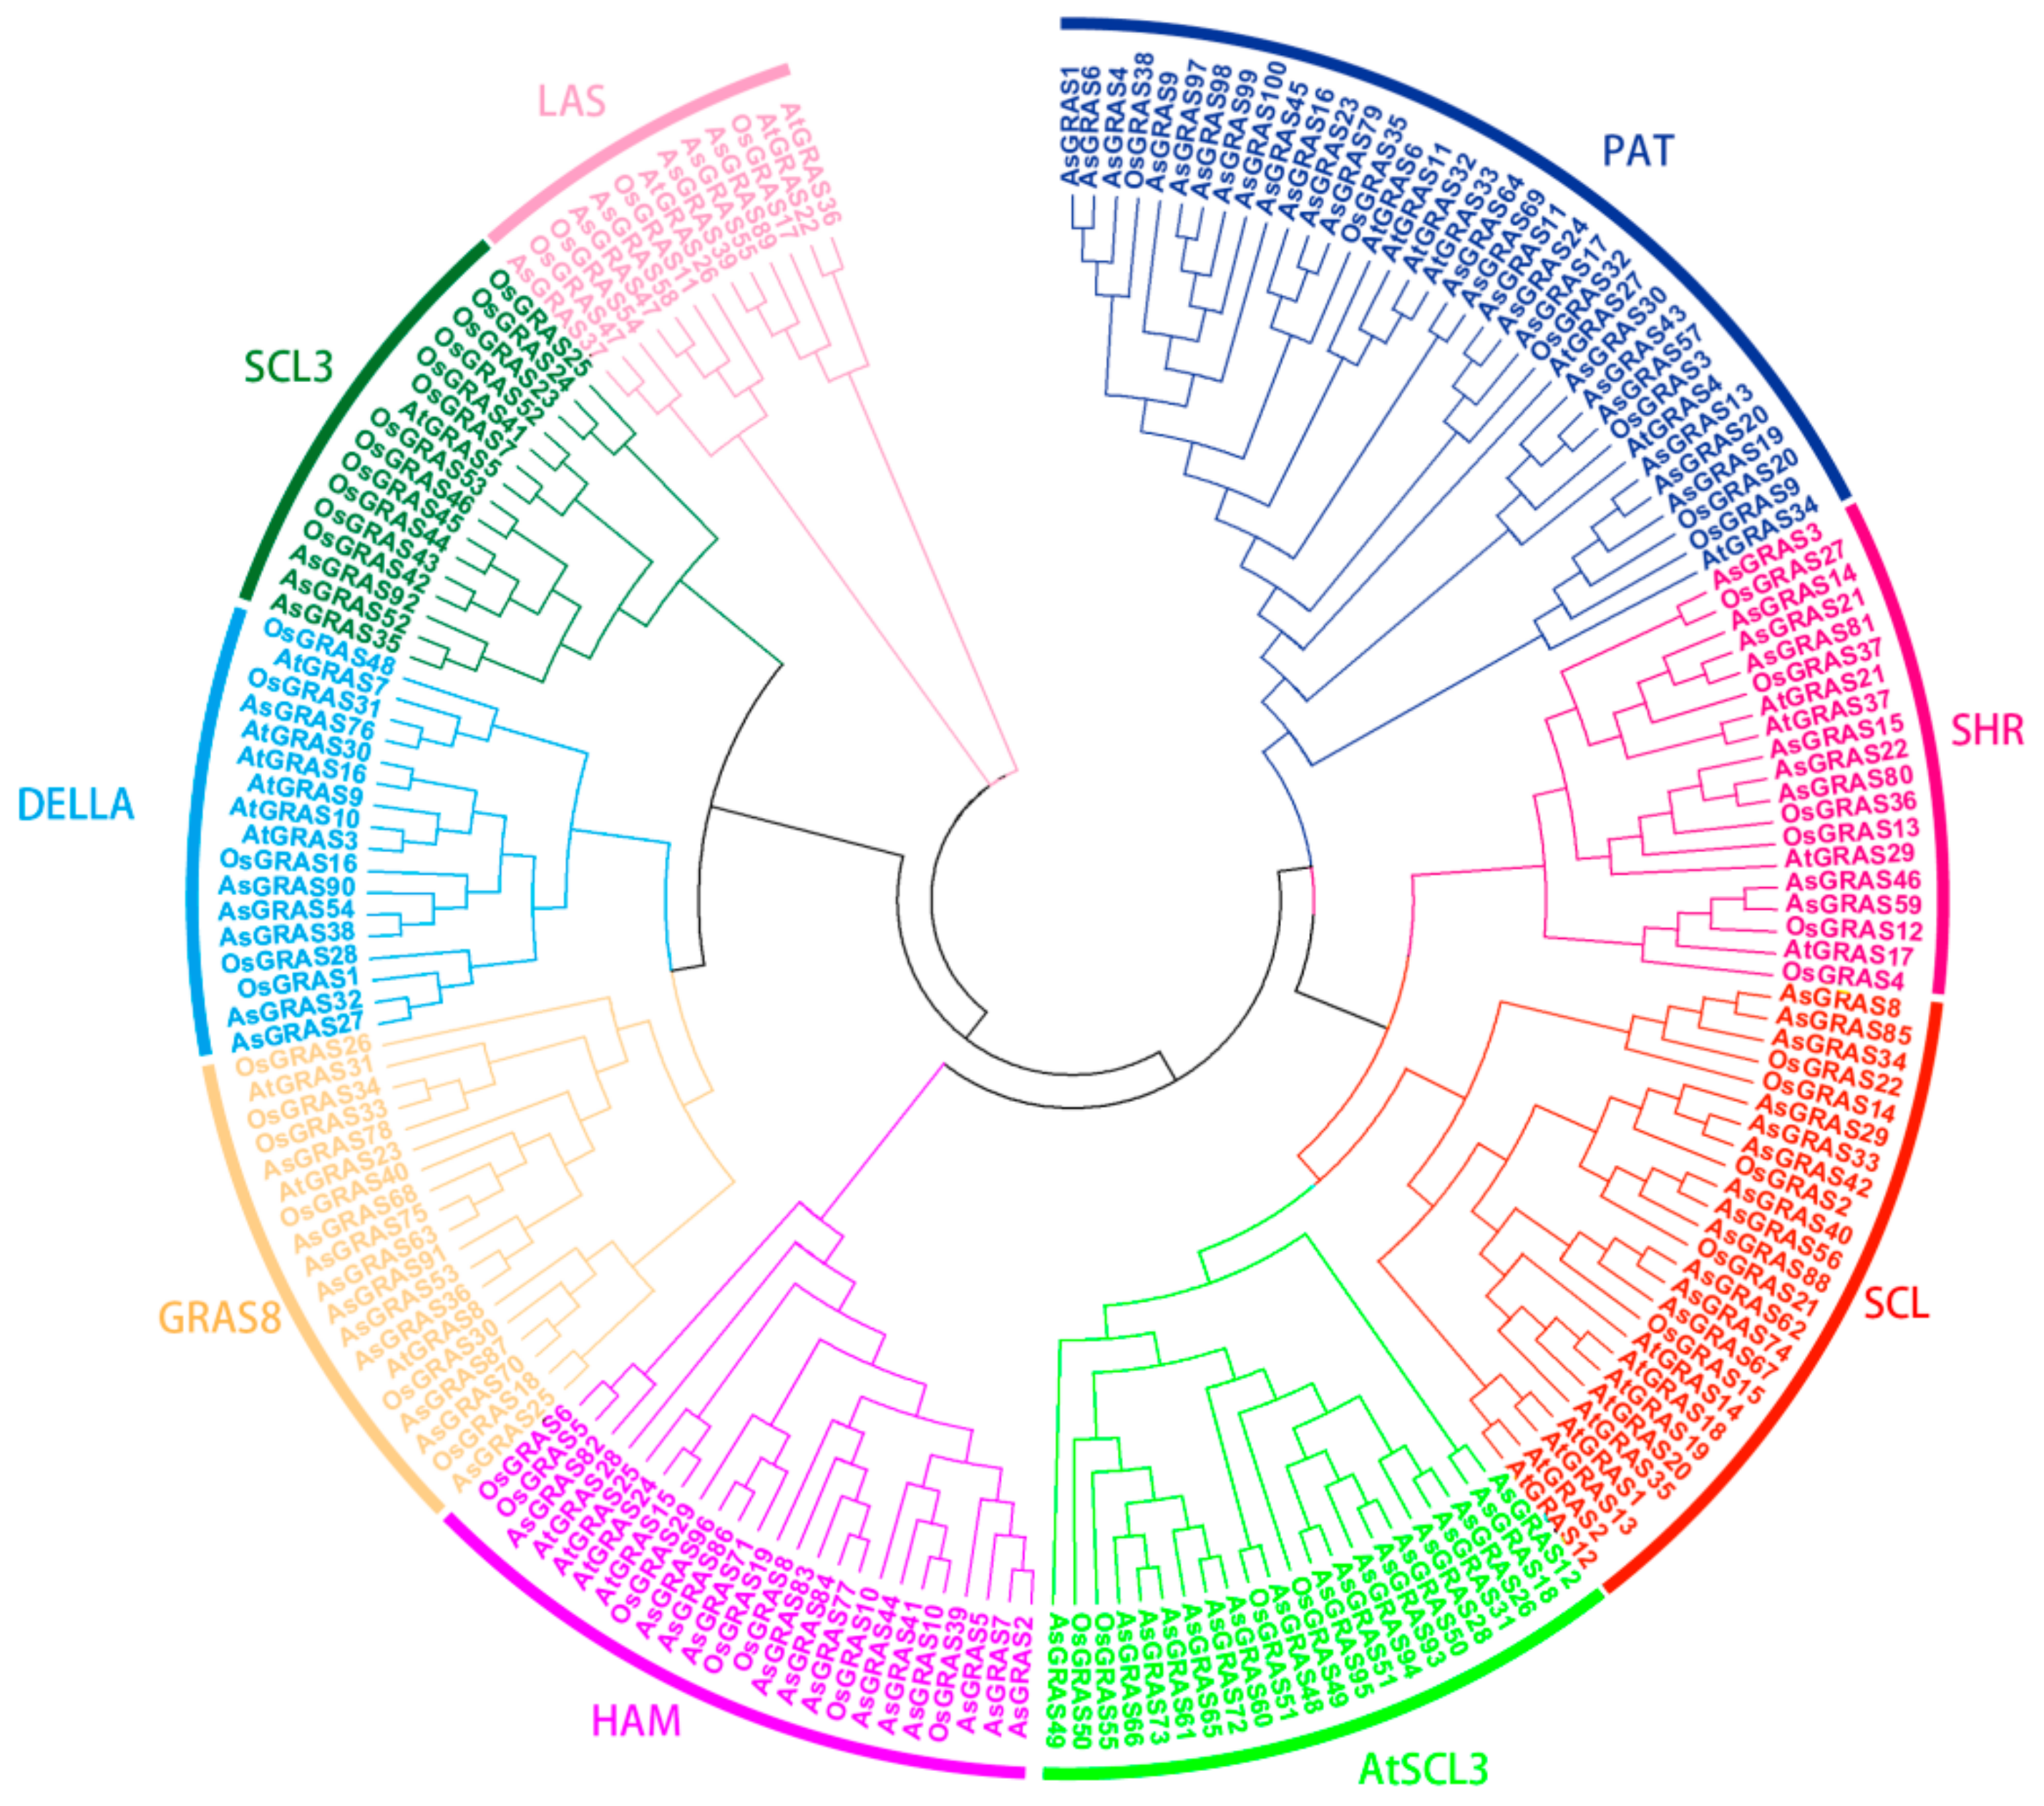
3.2. Analysis of the A. sativa GRAS Gene Family Members and Gene Family Evolution

To study the classification of GRAS gene family members, we constructed a phylogenetic tree of GRAS protein sequences from A. thaliana (37), O. sativa (55), and A. sativa (100) (Figure 1). Regarding the classification according to the GRAS gene family members of A. thaliana, the GRAS protein sequences were divided into nine subfamilies (PAT, SHR, SCL, AtSCL3, HAM, GRAS8, DELLA, SCL3, and LAS) of A. sativa. Among them, the PAT subfamily had the most members, containing 23 genes and accounting for 23%; the SCL21 subfamily had the fewest members, containing 3 genes and accounting for 3%.

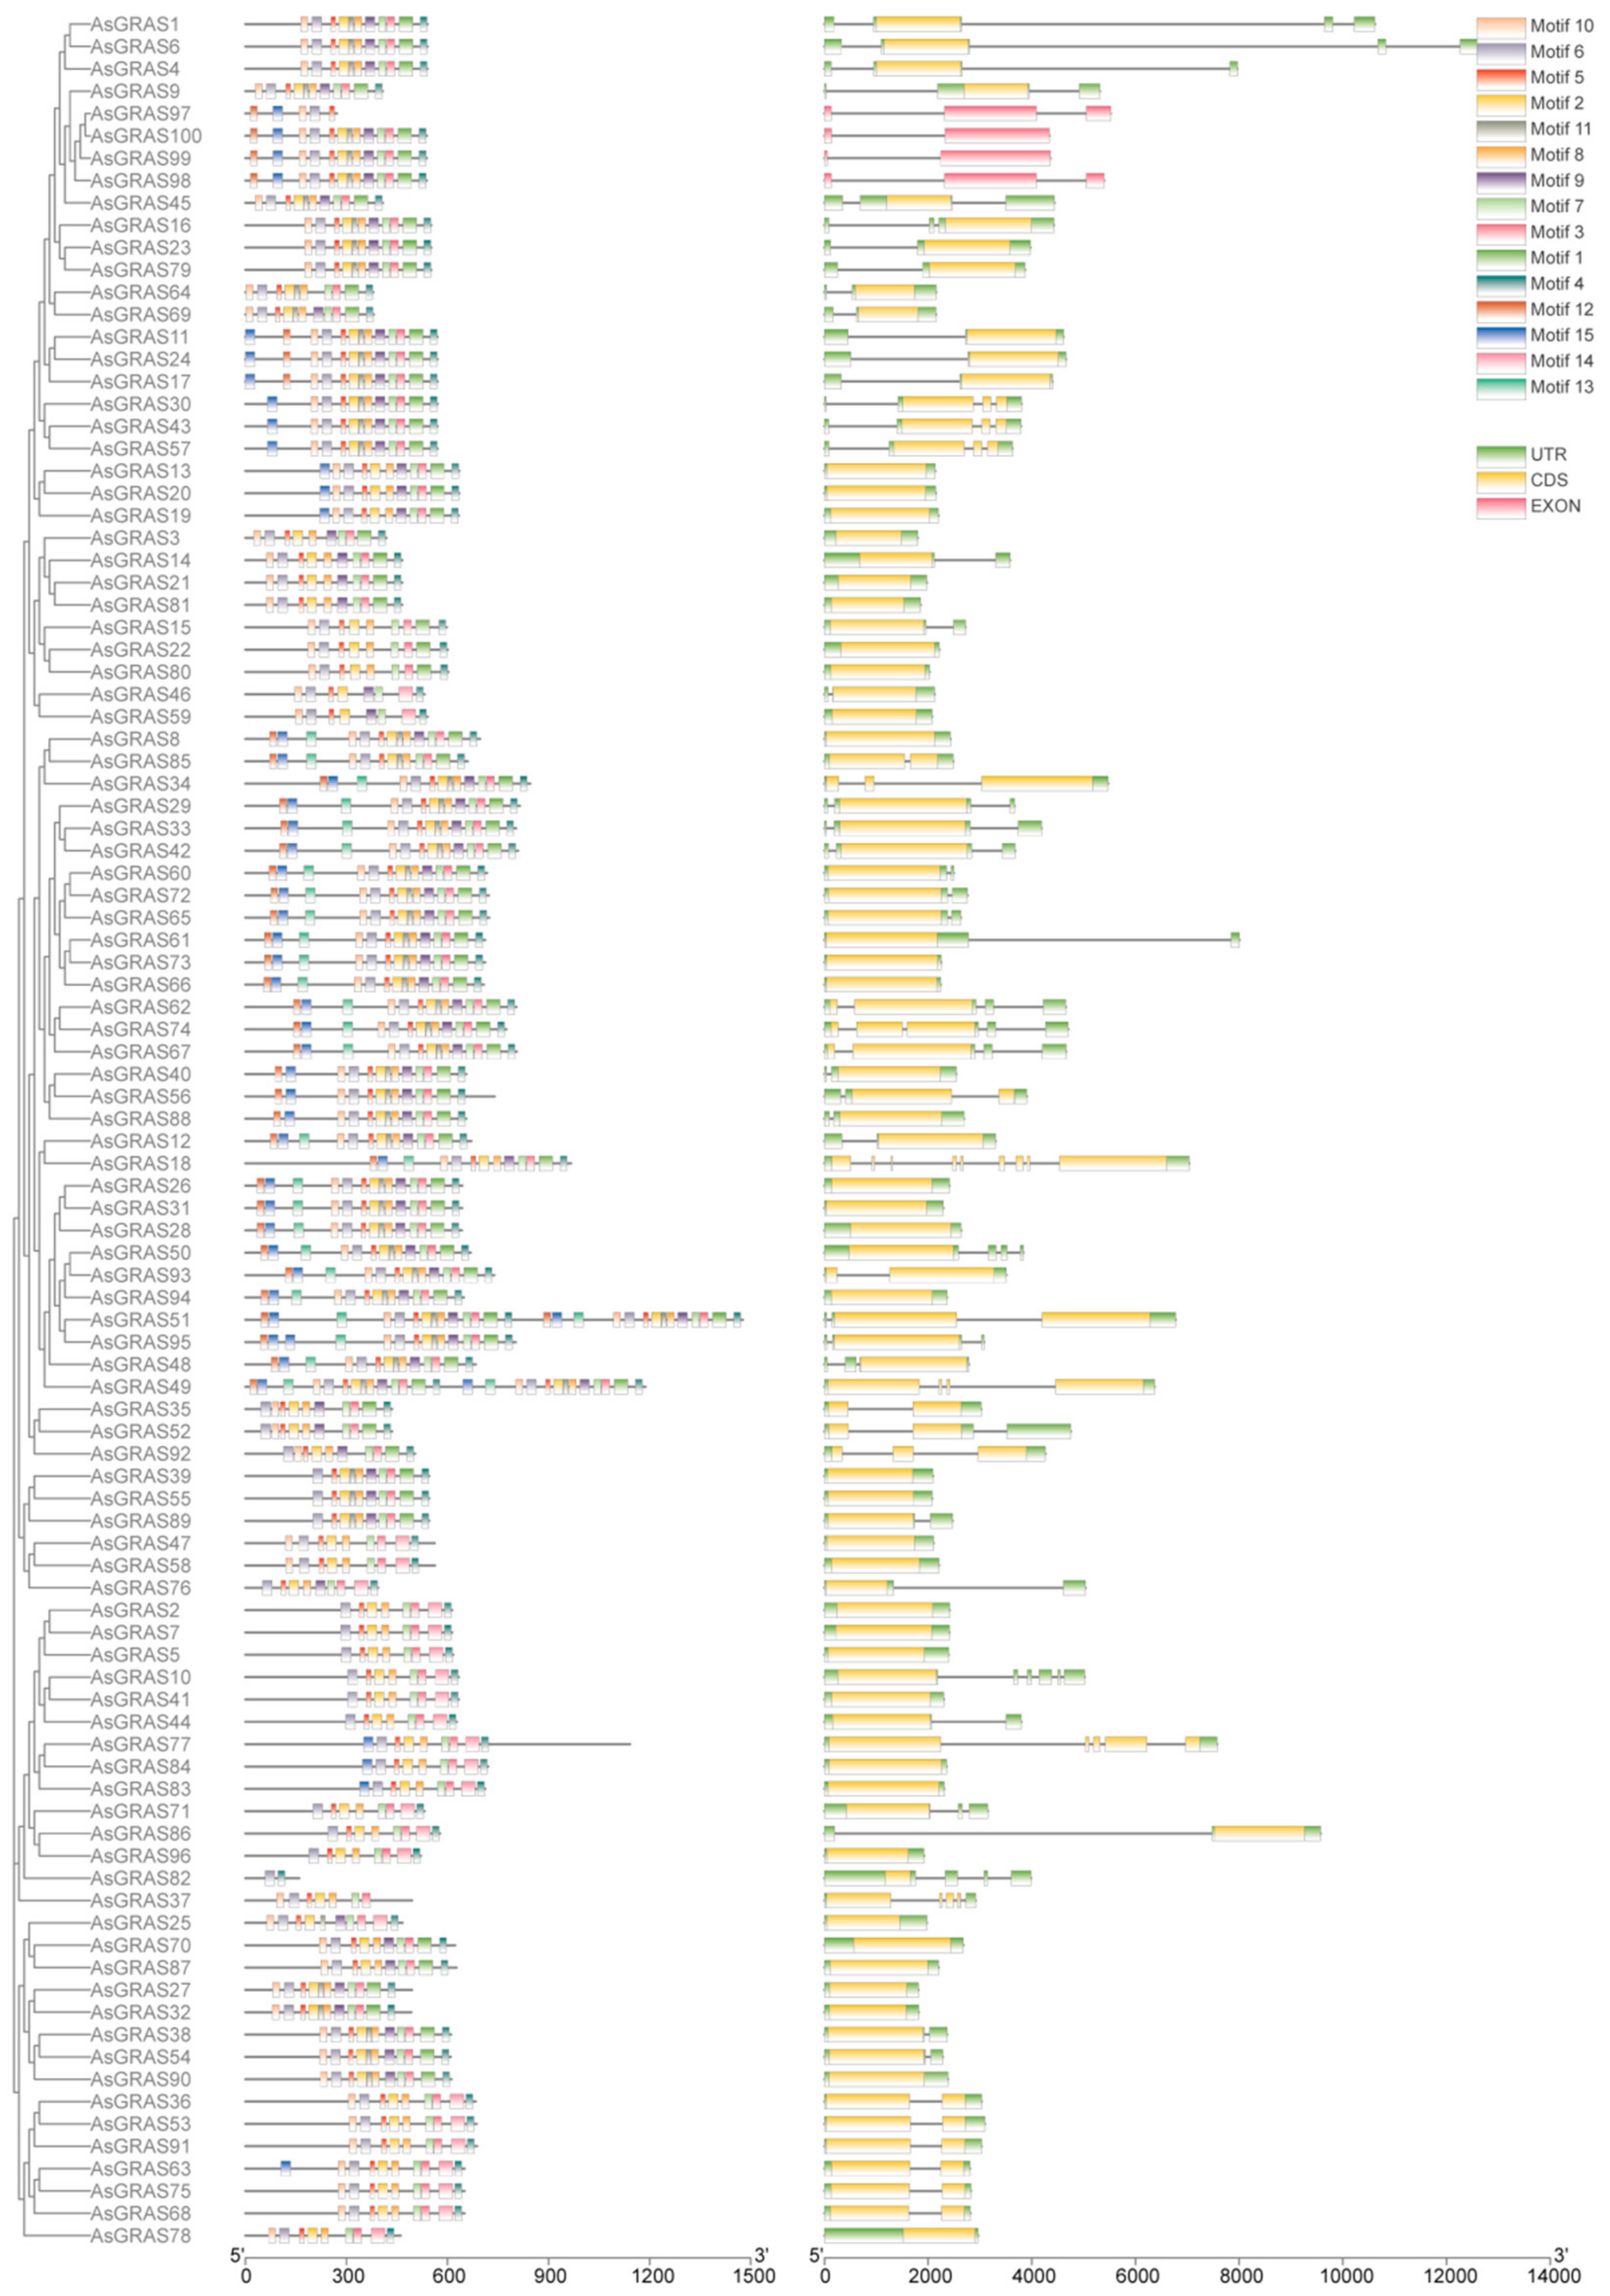
3.3. A. sativa GRAS Gene Family Motif Analysis and Gene Structure Analysis

The AsGRAS gene family gene structure map (Figure 2) shows that 15 motifs were identified in GRAS genes, and motif 6 appeared in every subfamily. Most of the members contained motifs 1–11 except the HAM, GRAS8, and DELLA subfamilies, indicating that this domain is more conserved in this subfamily. The HAM subfamily contains motifs 1–4, 6–10, and 12; the GRAS8 subfamily contains motifs 2–4, 6–8, and 12; and the DELLA subfamily contains motifs 2–4, 6–8, 12, and 14.
GRAS gene family members have exon structures, with 34 members without intron structures, accounting for 34%, mainly concentrating in the SHR and PAT subfamilies, and the GRAS8 subfamily has more introns than the remaining subfamily. AsGRAS18 contains the most introns with a count of 8. The PAT subfamily has no introns, except AsGRAS13, AsGRAS20, and AsGRAS19, and the remaining 20 members have introns that are relatively long. Although most members of the SCL subfamily contain introns, the introns are very short. The GRAS8 subfamily contains introns except for four family members (AsGRAS25, AsGRAS70, AsGRAS87, and AsGRAS78) without introns.

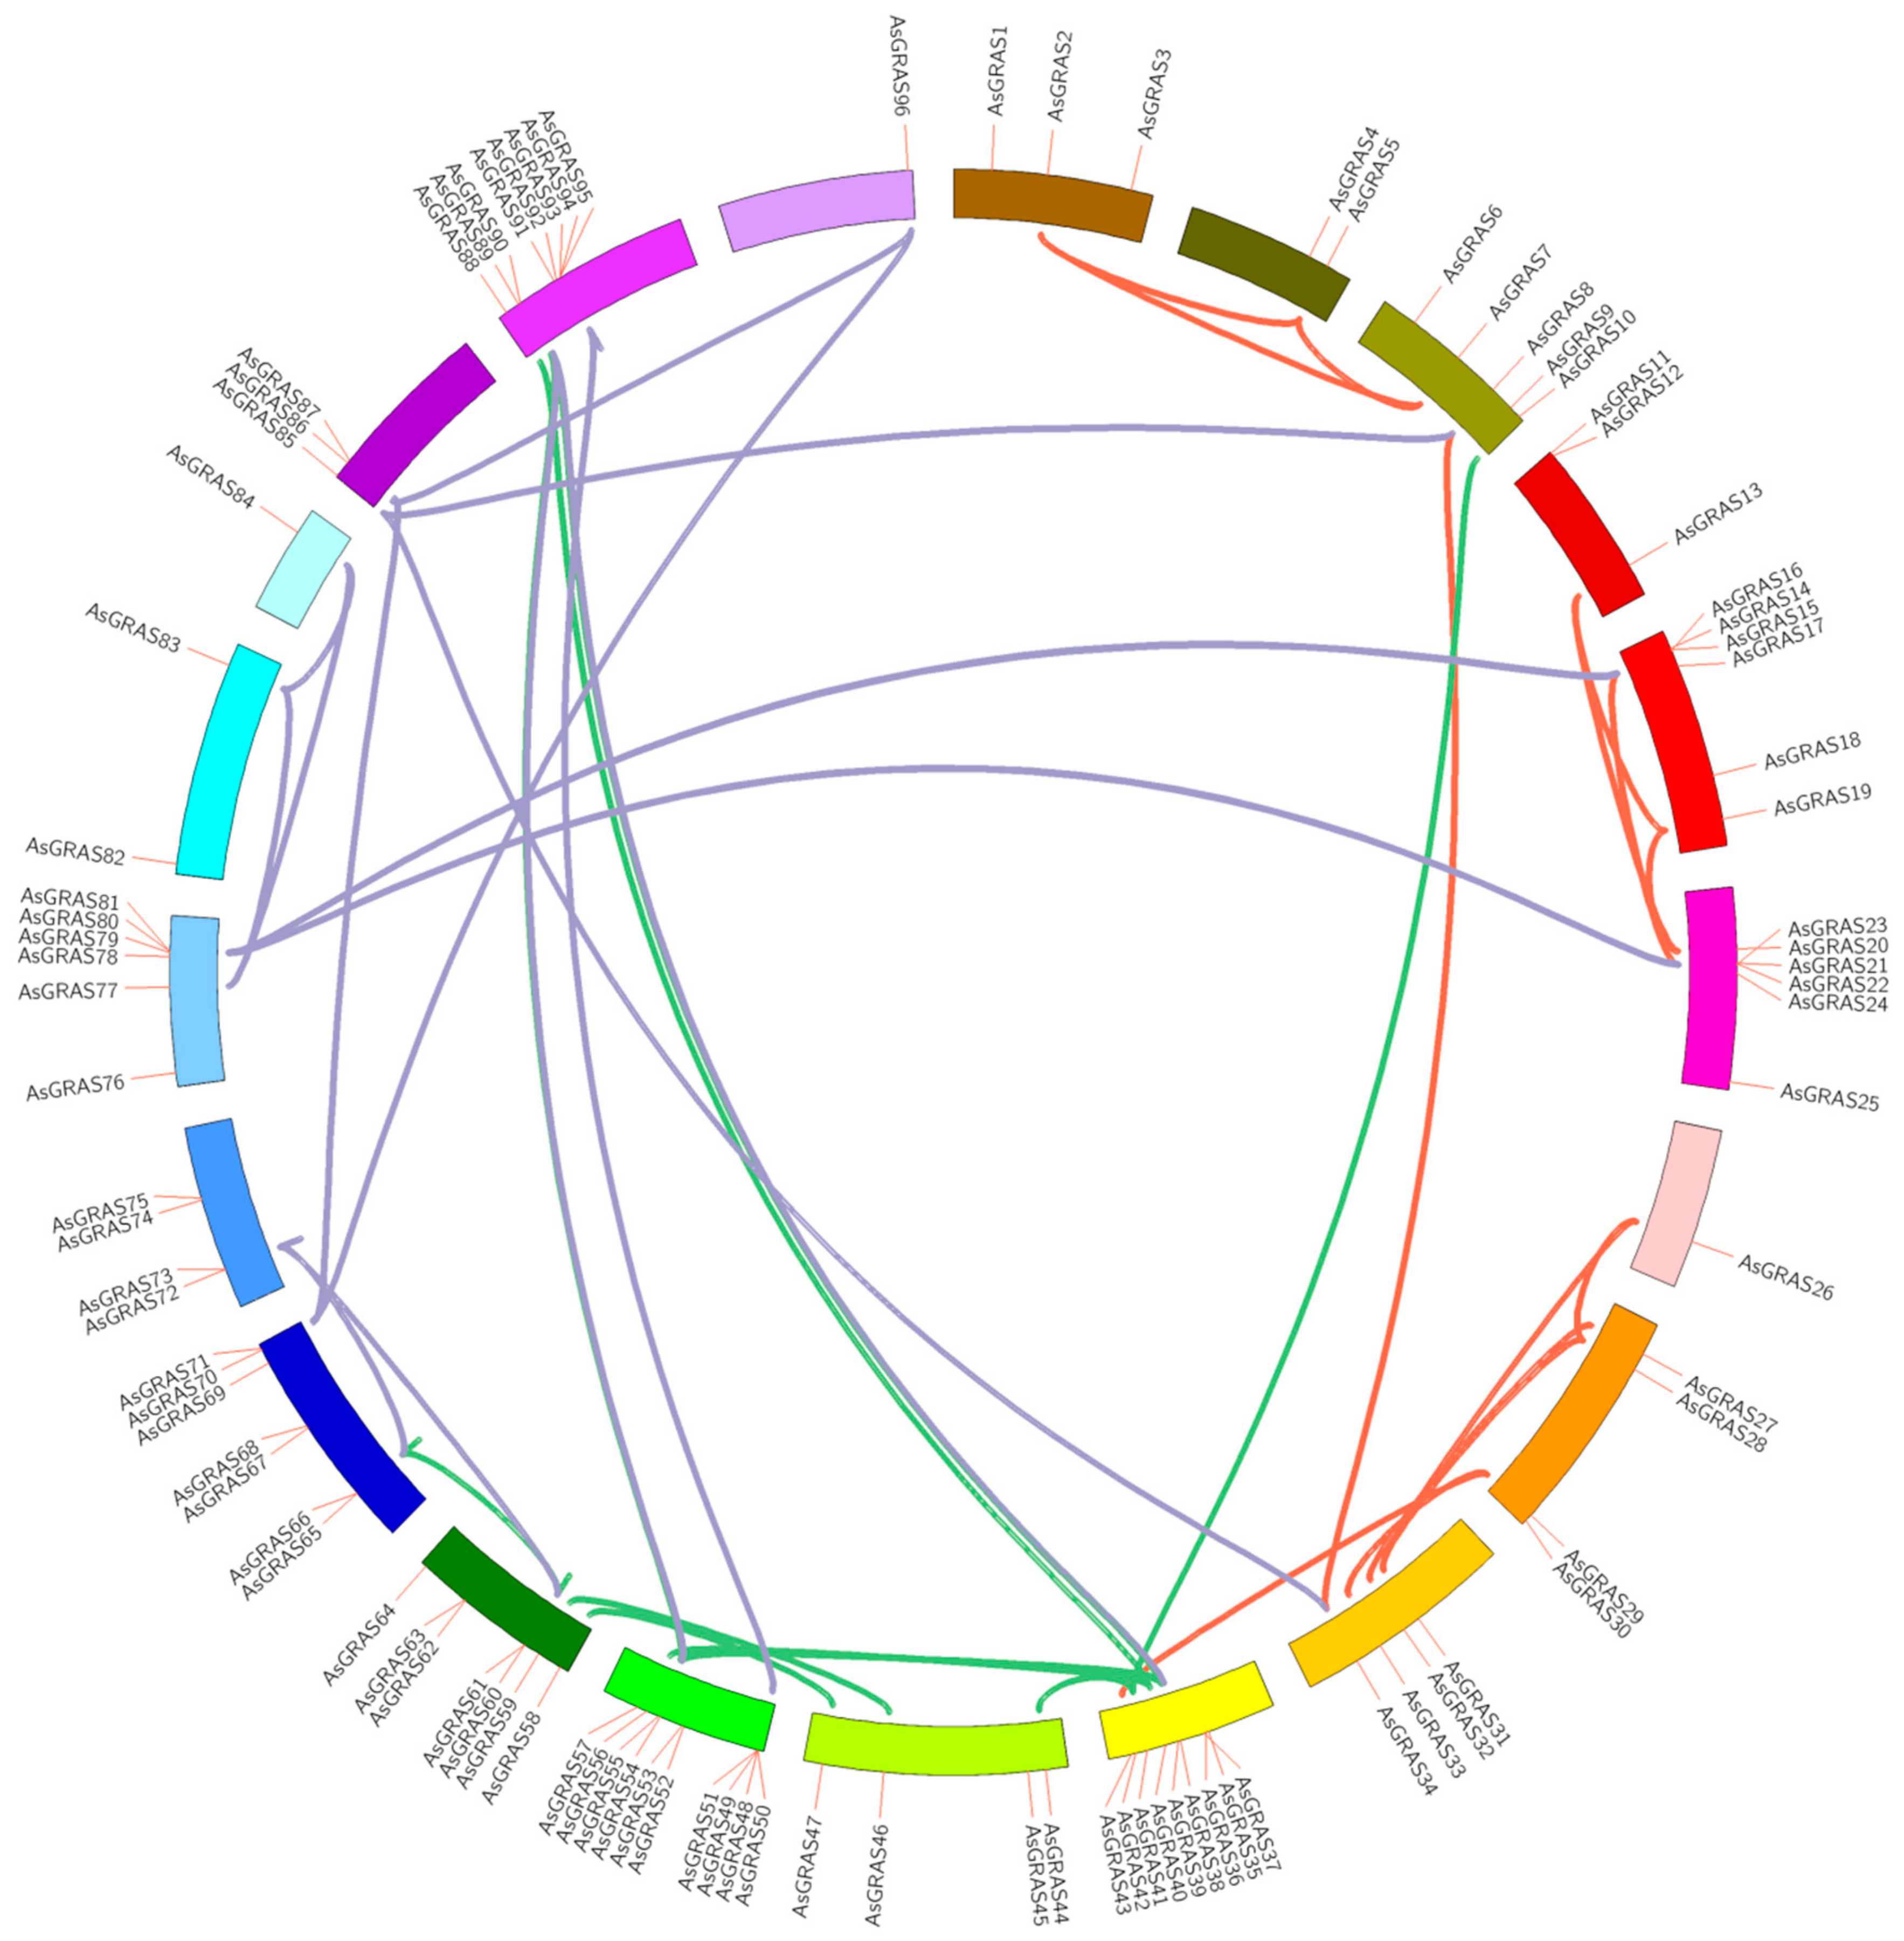
3.4. Location and Gene Duplication of the Chromosomes of the A. sativa GRAS Gene Family

According to the AsGRAS gene duplication map (Figure 3), the GRAS genes were randomly identified on each chromosome. We found that 100 GRAS genes were mapped to 21 chromosomes. The 12th chromosome had the largest number of gene members on the chromosome, including 10 members, and the highest gene duplication in chromosomes 10, 12, and 20, followed by chromosomes 7, 8, and 9. Among them, there are four gene clusters (Figure 3): AsGRAS37~43, AsGRAS50~57, AsGRAS78~81, and AsGRAS91~95.

3.5. Analysis of the Promoter Elements of the A. sativa GRAS Gene Family

One hundred AsGRAS cis-acting promoter regulatory elements were analyzed, and the elements associated with the stress responses were determined (Figure S1). In this study, four elements were related to the stress responses (MBS, MBSI, ABRE, and TC-rich repeats). Among them, MBS elements and MBSI elements are involved in multiple environmental stresses in plants, ABREs are involved in the abscisic acid response to abiotic stress, and TC-rich repeat elements are involved in the stress response. On the other hand, some other response elements were found, including G-Box photoresponse elements, GARE-motif hormone (gibberellin) response original elements, LTR endogenous retroviral elements, MRE metal response elements, P-Box electronic response elements, and RY-element seed-specific regulatory elements. Thus, it is concluded that the GRAS gene can combine with these elements to regulate A. sativa growth.

3.6. Gene Regulatory Network Analysis of the A. sativa GRAS Gene Family

We constructed an interaction network map of GRAS proteins through the relationship between A. sativa and A. thaliana (Figure 4). Among these proteins, the PAT1 subfamily proteins play vital roles in the early stages of the phytochrome signaling pathway. The SHR and SCR proteins are members of the GRAS family of transcription factors and can directly control SCR transcription. The results show that AsGRAS transcription factors have complex interaction relationships.

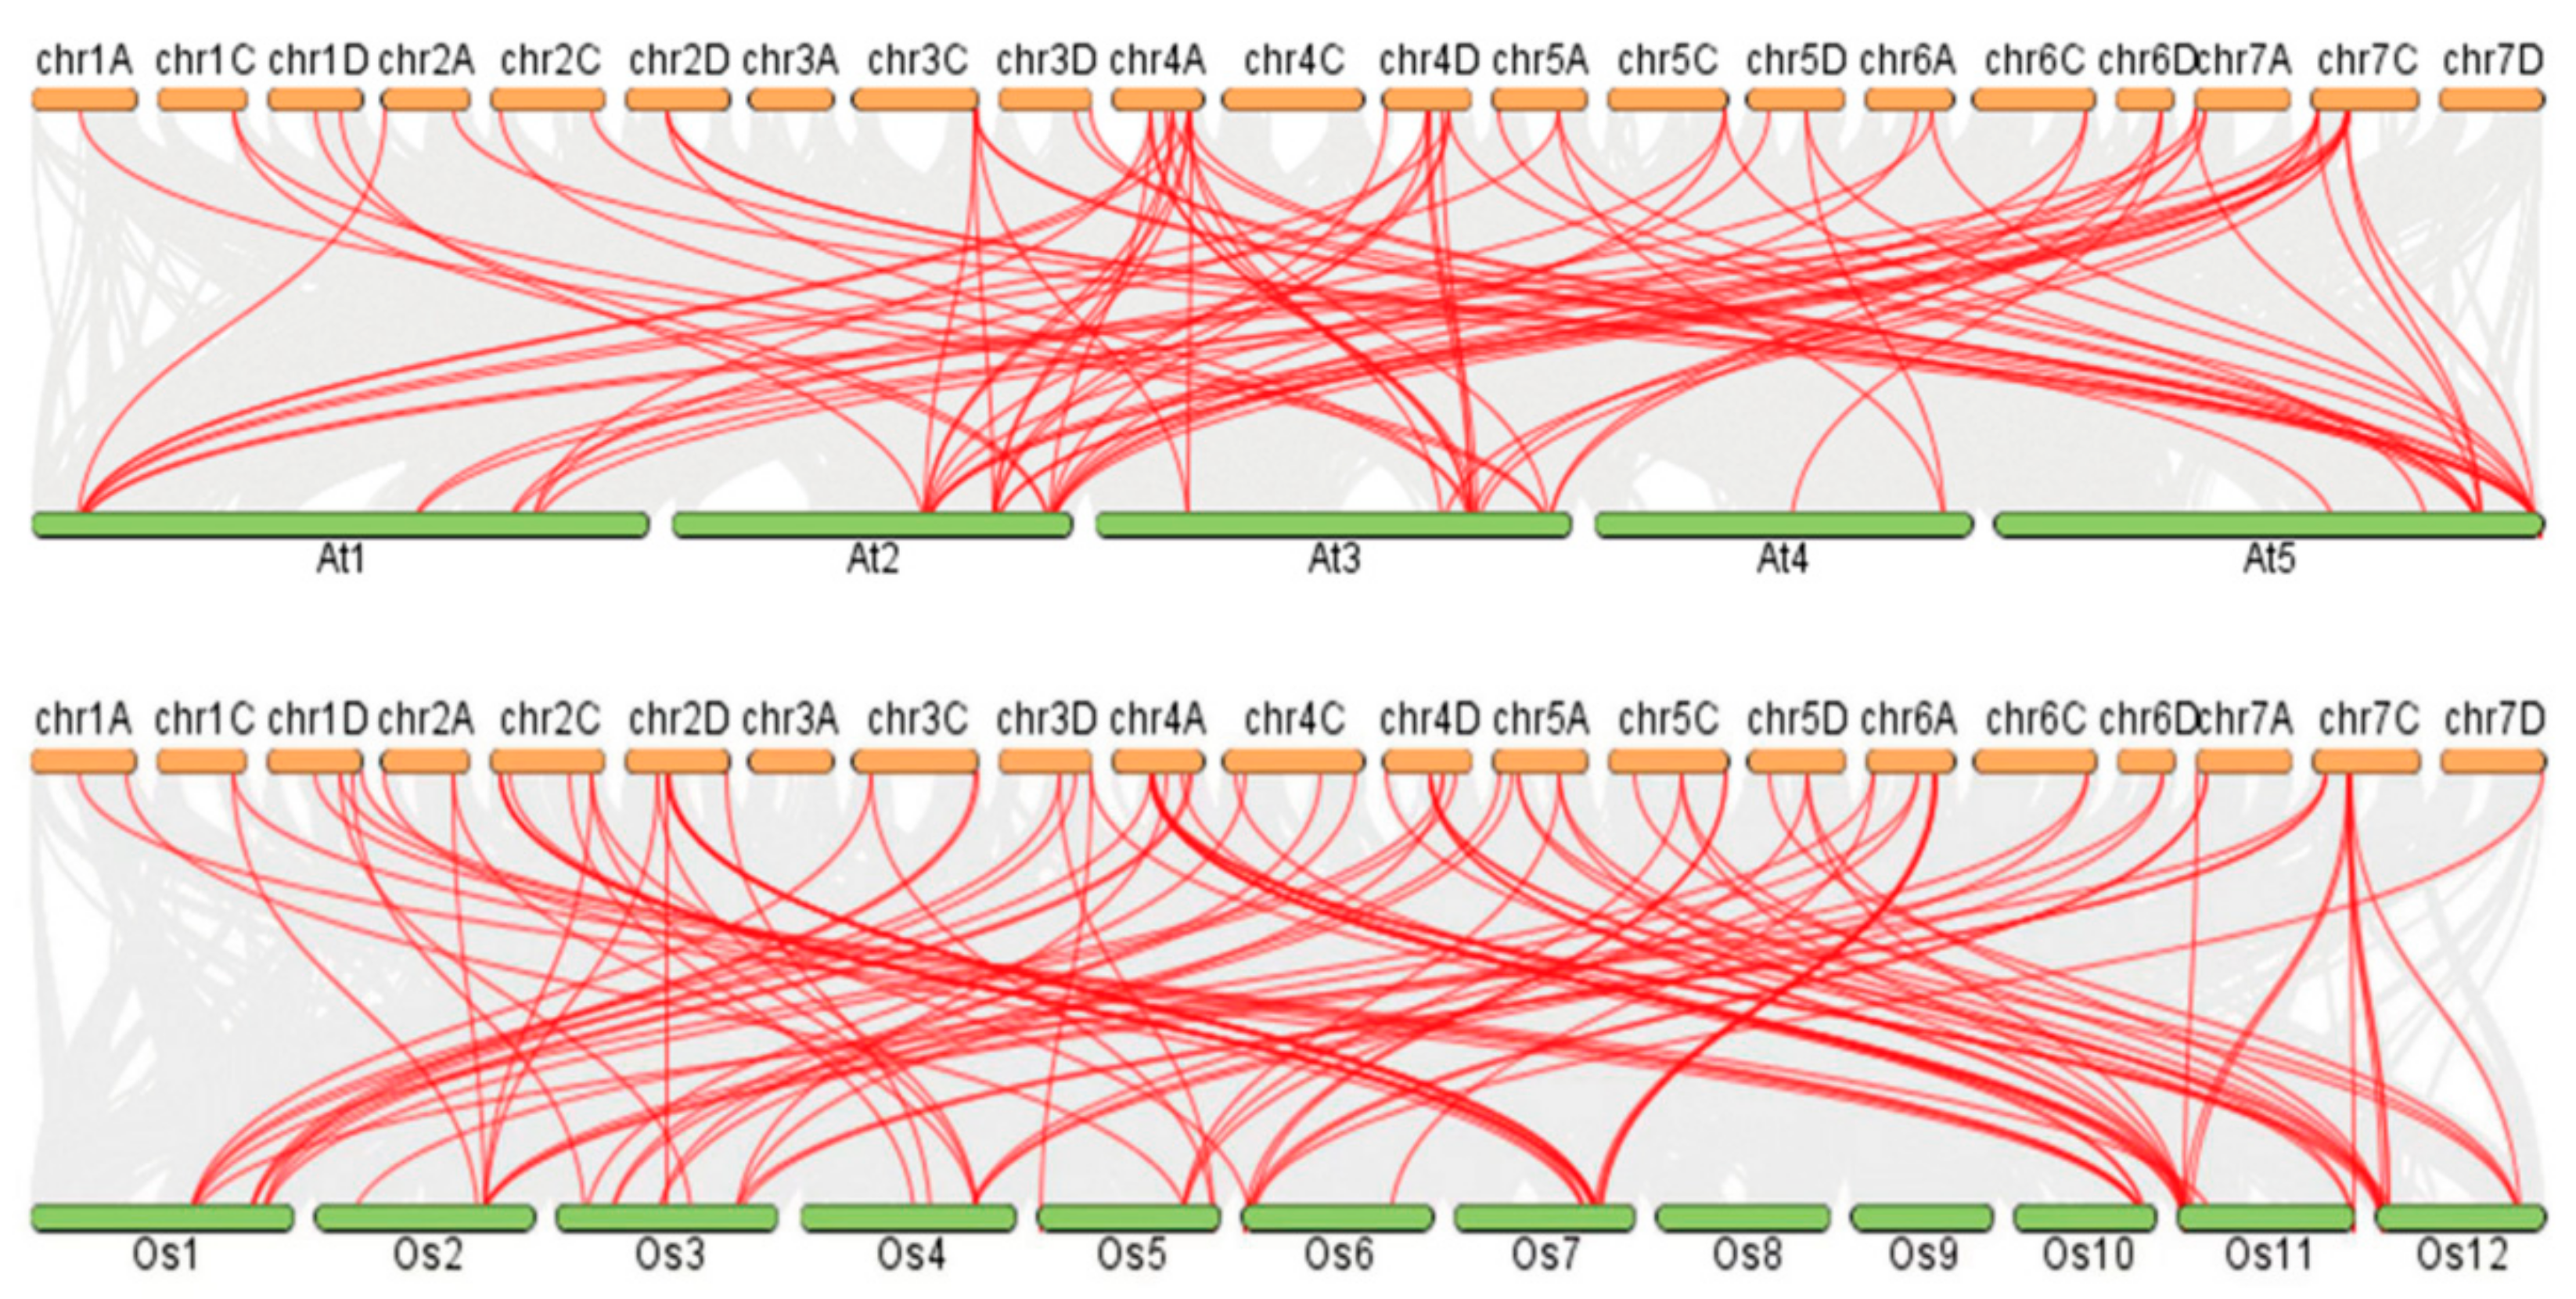
3.7. Collinearity Analysis of the A. sativa GRAS Gene Families

By analyzing the collinearity map of GRAS genes (Figure 5), we found that the homologous genes of A. sativa and O. sativa were distributed on 12 chromosomes, and the homologous genes of A. sativa and A. thaliana were distributed on 5 chromosomes. AsGRAS and OsGRAS have 85 homologous genes, and AsGRAS and AtGRAS have 69 homologous genes. In A. thaliana, Group A has the highest homology and 26 homologous genes, and Group C has the lowest homology and 26 homologous genes. In O. sativa, Group C has the highest homology and 30 homologous genes, and Group A has the lowest homology and 26 homologous genes.

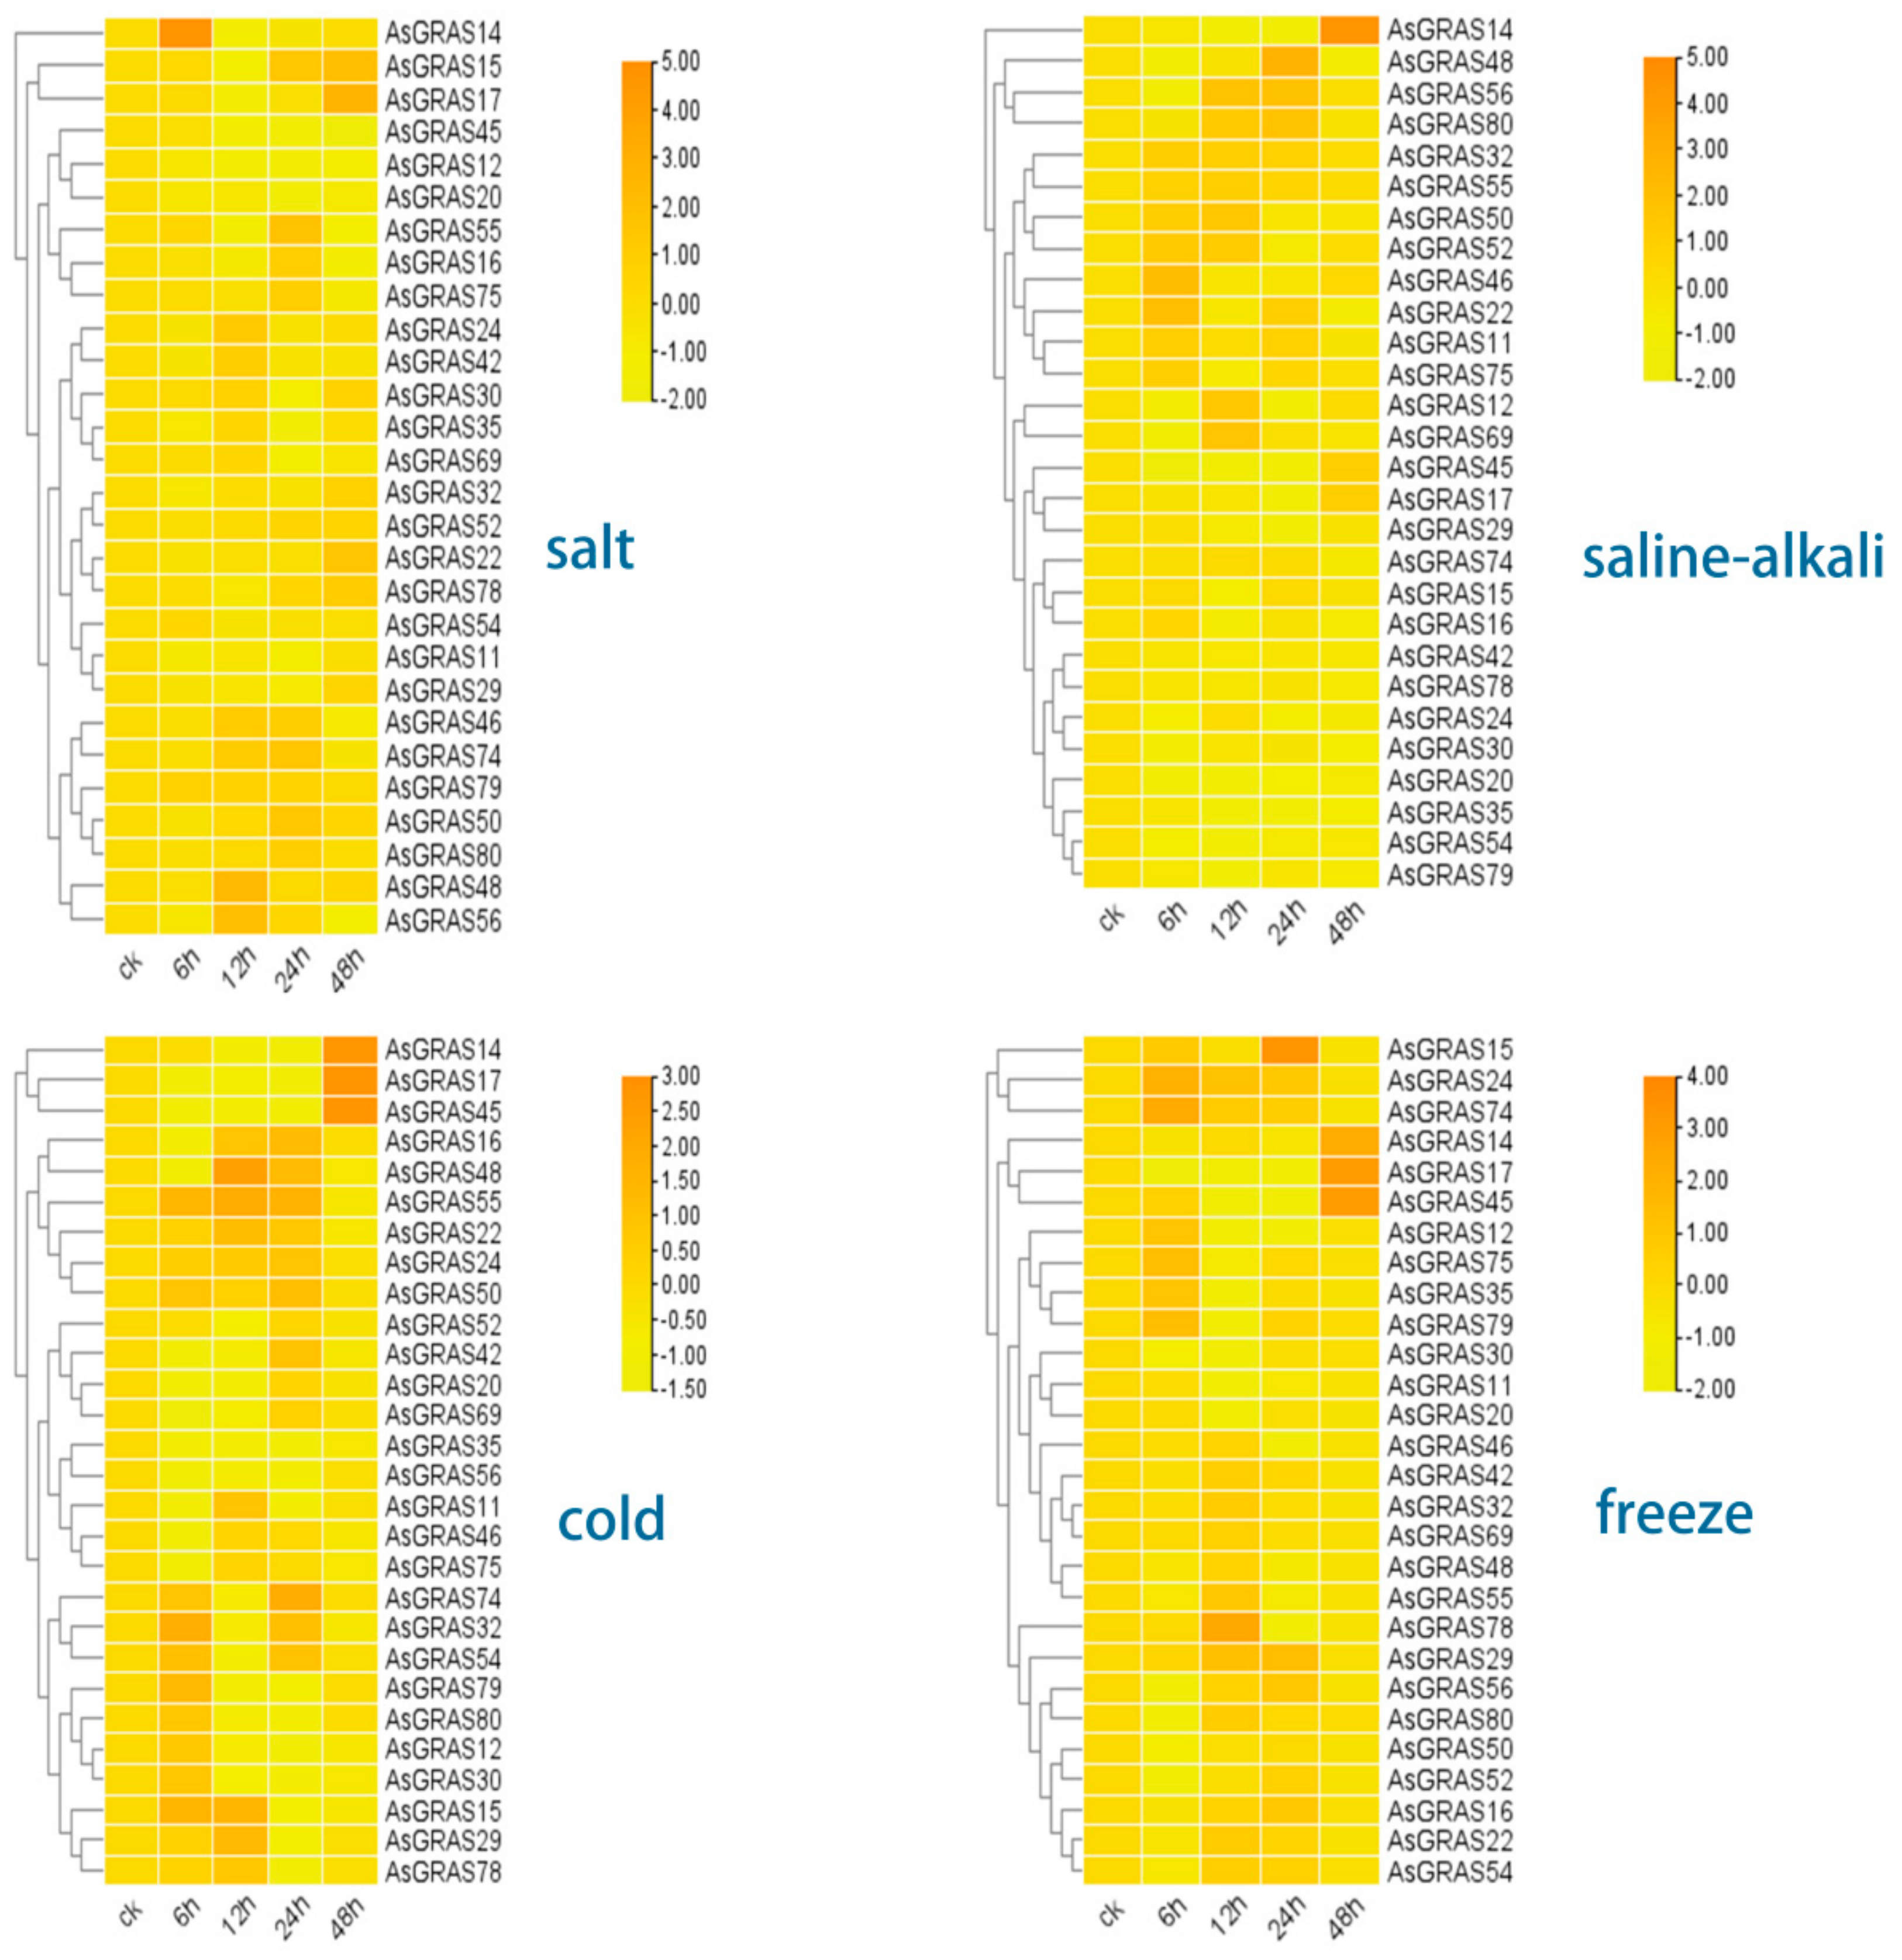
3.8. Response and Expression Pattern of A. sativa GRAS Family Genes under 4 Abiotic Stresses (Salt, Saline–Alkali, Cold, and Freezing Stress Conditions)

We selected 28 genes, the expression profiles of which verified their expression patterns under 4 stresses (Figure 6). The results showed that AsGRAS15, AsGRAS17, AsGRAS22, AsGRAS24, and AsGRAS32 expressed the same pattern under salt stress and were upregulated at 12 h. AsGRAS15 and AsGRAS17 expressions were upregulated at 48 h, AsGRAS22 and AsGRAS32 at 24 h, and AsGRAS24 at 6 h.
AsGRAS11, AsGRAS12, AsGRAS14, AsGRAS20, and AsGRAS32 were upregulated in early expressions under saline stress, AsGRAS12, AsGRAS20, and AsGRAS32 expressions were upregulated at 24 h, AsGRAS11 at 12 h, and AsGRAS14 at 48 h.
The results showed that AsGRAS11, AsGRAS14, and AsGRAS17 were obviously upregulated at 48 h under cold stress conditions; AsGRAS16, AsGRAS22, AsGRAS24, and AsGRAS29 were significantly upregulated at 24 h.
Under freezing stress conditions, AsGRAS14 and AsGRAS17 expressions were upregulated at 48 h, AsGRAS15, AsGRAS29, and AsGRAS32 expressions were upregulated at 12 h, and AsGRAS16, AsGRAS22, and AsGRAS32 expressions were significantly upregulated.

4. Discussion

We found 100 AsGRAS members in this study, and the length of the AsGRAS protein ranged from 2406.74 to 7016.67. The molecular weights of the proteins of tomato, Medicago truncatula, and sweet potato ranged from 14,089.3 to 98,029.8, from 7939.17 to 129,425.86, and from 42,500.97 to 157,318.47, respectively [26,27,28]. The results show that the molecular weight of the protein of AsGRAS is less than that of the other plants, and the diversity is lower.
In the GRAS gene family, gene duplication is an important method of gene expansion in this family. In this study, the most duplication events were observed in the SCL subfamily of A. sativa, the most duplication events were observed in the SCL subfamily of barley and O. sativa [29,30]; the most duplication events were observed in the SHR subfamily of Medicago truncatula [27]; and the most duplication events were observed in the Pt20 subfamily of the tomato [26]. These results show that duplication events of different subfamilies occupy different main positions in different plants and further verify that gene duplication events in Gramineae were dominated by SCL subfamilies.
In general, the intronless genes are most likely caused by horizontal gene transfer from intronless ancient prokaryotes, duplication of existing intronless genes, or reverse transcription of intron-containing genes [31]. In previous studies, a large proportion of GRAS gene families lacked introns. In this study, we found that 34% of AsGRAS genes were intronless. A large number of GRAS genes are also generally absent in some other plants, such as barley (74.2%), Medicago truncatula (88%), tomato (77.4%), and A. thaliana (67.6%) [26,27,29,30]. In addition, we found that only 20% of intron genes were involved in duplication events. In the other species, for example, only 4, 6, and 1 intron genes were involved in the duplication events of A. thaliana, O. sativa, and the tomato [26,30,30]. According to these results, we speculate that genes with introns in the GRAS gene family have fewer events involved in gene duplication, and intronless genes are involved in more events in gene duplication, this is because many genes without introns are involved in gene duplication events.
In this study, AsGRAS11, AsGRAS16, and AsGRAS17 in the PAT subfamily were significantly upregulated under cold stress, and AsGRAS11 and AsGRAS20 were significantly upregulated under salt–alkali stress. Zhang (2018) found that the Gh_D01G0564 and Gh_A04G0196 genes in the PAT1 subfamily were significantly increased under salt, drought, cold, and high-temperature stresses in cotton [32]; Yuan (2016) found that the over-expression of the VaPAT1 gene in A. thaliana significantly increased plant resistance to abiotic stress in Syringa amurensis [33]. This study shows that the PAT subfamily in the GRAS gene family is significantly affected by abiotic stress.
In the present protein interaction regulatory network of the AsGRAS gene family, we found that the PAT subfamily proteins interact with proteins such as SCL21, and there is an interactive relationship between AsGRAS16 and AsGRAS12. In barley, the PAT1 subfamily proteins (HvGRAS41 and HvGRAS50) may interact with these proteins (HvGRAS11) in SCL21 under ethylene reaction, and the PAT1 subfamily members are significantly highly expressed in inflorescence lemma, anatomical inflorescences, inflorescence axis, developmental tillers, and inflorescence [29]. In addition, GRAS proteins can also interact and participate in abiotic stress regulation mechanisms. According to the qRT-PCR analysis in this study, we showed that AsGRAS16, a member of the PAT subfamily, can regulate the response to abiotic stresses, such as cold (8 °C) and freezing conditions (4 °C), and AsGRAS14 can respond to the induction of salinity stress, and its expression is upregulated under salinity stress. In sweet potatoes, the PAT1 protein (IbGRAS71) and SHR protein (IbGRAS4) are induced under both salt and drought stresses and may participate in stress tolerance or growth and development through complex protein interaction networks [28]. From this result, we conclude that PAT1 subfamily proteins have important functions in the GRAS gene family, and multiple stress-responsive GRAS genes may play multiple key roles in regulating abiotic stress-signaling cascades through a potentially complex interaction network.

5. Conclusions

In this study, we analyzed various bioinformatic data on the GRAS evolutionary relationships, gene structure, gene duplication, and promoter analysis of the GRAS gene family in A. sativa. In this study, through a comprehensive and systematic analysis of the GRAS gene family, 100 members of the GRAS gene family were named (AsGRAS1~AsGRAS100) based on their IDs in the genome. According to the GRAS subfamily classification in A. thaliana, the GRAS gene family is divided into 9 subfamilies, which include most members from the PAT subfamily (containing 23 genes) and the least members from the SCL3 subfamily (containing 3 genes). The GRAS genes derived from the same evolutionary clade were found to have similar genes and structures. GRAS transcription factors not only participate in the regulation of plant growth and development but also respond to biological stress. The results of this study provide the complete members of the AsGRAS transcription factor family and their sequence characteristics, which can provide some reference and theoretical basis for further analysis of the structural characteristics and functional verification of the AsGRAS family members.

Supplementary Materials

The following supporting information can be downloaded at: https://www.mdpi.com/article/10.3390/genes14010164/s1, Figure S1: AsGRAS gene family identification and physiochemical properties; Table S1: cis-element of the GRAS promoter; Table S2: List of primers used in qRT-PCR.

Author Contributions

L.L. and N.C. conceived and designed the experiments; L.L. and N.C. performed the experiments; L.L. and M.L. participated in the data collection and analysis; L.L., M.L., J.Z., X.W., L.Q. and G.R. drafted the paper and prepared the figures; L.L., M.L. and H.Y. revised the manuscript. All authors have read and agreed to the published version of the manuscript.

Funding

This work was supported by a grant from the Daqing Normal University Doctoral Research Fund China (no. 21ZR05) and the Heilongjiang Natural Science Foundation Joint Guiding Project (LH2022C001).

Institutional Review Board Statement

Not applicable.

Informed Consent Statement

Informed consent was obtained from all subjects involved in the study.

Data Availability Statement

Not applicable.

Conflicts of Interest

The authors declare no conflict of interest.

References

  1. Pysh, L.D.; Wysocka-Diller, J.W.; Camilleri, C.; Bouchez, D.; Benfey, P.N. The GRAS gene family in Arabidopsis sequence characterization and basic expression analysis of the SCARECROW-LIKE genes. Plant J. 1999, 18, 111–119. [Google Scholar] [CrossRef] [PubMed]
  2. Heery, D.M.; Kalkhoven, E.; Hoare, S.; Parker, M.G. A signature motif in transcriptional co-activators mediates binding to nuclear receptors. Nature 1997, 387, 733–736. [Google Scholar] [CrossRef] [PubMed]
  3. Yang, M.; Yang, Q.; Fu, T.; Zhou, Y. Overexpression of the Brassica napus bnlas gene in Arabidopsis affects plant development and increases drought tolerance. Plant Cell Rep. 2011, 30, 373–388. [Google Scholar] [CrossRef] [PubMed]
  4. Ma, H.S.; Xia, X.L.; Yin, W.L. Cloning and analysis of SCL7 gene from Populus euphratica. J. Beijing For. Univ. 2011, 33, 1–10. [Google Scholar]
  5. Xu, K.; Chen, S.; Li, T.; Ma, X.; Liang, X.; Ding, X.; Liu, H.; Luo, L. OsGRAS23, a rice gras transcription factor gene, is involved in drought stress response through regulating expression of stress-responsive genes. BMC Plant Biol. 2015, 15, 141. [Google Scholar] [CrossRef] [Green Version]
  6. Wang, Z.; Wong, D.C.J.; Wang, Y.; Xu, G.; Ren, C.; Liu, Y.; Kuang, Y.; Fan, P.; Li, S.; Xin, H.; et al. GRAS-domain transcription factor PAT1 regulates jasmonic acid biosynthesis in grape cold stress response. Plant Physiol. 2021, 186, 1660–1678. [Google Scholar] [CrossRef] [PubMed]
  7. Kamal, N.; Tsardakas Renhuldt, N.; Bentzer, J.; Gundlach, H.; Haberer, G.; Juhász, A.; Lux, T.; Bose, U.; Tye-Din, J.A.; Lang, D.; et al. The mosaic oat genome gives insights into a uniquely healthy cereal crop. Nature 2022, 606, 113–119. [Google Scholar] [CrossRef]
  8. Peng, Y.; Yan, H.; Guo, L.; Deng, C.; Wang, C.; Wang, Y.; Kang, L.; Zhou, P.; Yu, K.; Dong, X.; et al. Reference genome assemblies reveal the origin and evolution of allohexaploid oat. Nat. Genet. 2022, 54, 1248–1258. [Google Scholar] [CrossRef]
  9. Ergashovich, K.A.; Tokhirovna, J.O. Ecophysiological Properties of White Oats. In Proceedings of the International Conference on Innovations in Sciences, Education and Humanities, Rome, Italy, 10 December 2021. [Google Scholar]
  10. Xu, Z.; Chen, X.; Lu, X.; Zhao, B.; Yang, Y.; Liu, J. Integrative analysis of transcriptome and metabolome reveal mechanism of tolerance to salt stress in oat (Avena sativa L.). Plant Physiol. Biochem. 2021, 160, 315–328. [Google Scholar] [CrossRef] [PubMed]
  11. Zhao, G.Q.; Ma, B.L.; Ren, C.Z. Salinity Effects on Yield and Yield Components of Contrasting Naked Oat Genotypes. J. Plant Nutr. 2009, 32, 1619–1632. [Google Scholar] [CrossRef]
  12. Zhang, H.; Liu, X.; Wang, X.; Sun, M.; Song, R.; Mao, P.; Jia, S. Genome-Wide Identification of GRAS Gene Family and Their Responses to Abiotic Stress in Medicago sativa. Int. J. Mol. Sci. 2021, 22, 7729. [Google Scholar] [CrossRef]
  13. Wang, S.; Duan, Z.; Yan, Q.; Wu, F.; Zhou, P.; Zhang, J. Genome–Wide Identification of the GRAS Family Genes in Melilotus albus and Expression Analysis under Various Tissues and Abiotic Stresses. Int. J. Mol. Sci. 2022, 23, 7403. [Google Scholar] [CrossRef] [PubMed]
  14. Fan, Y.; Wei, X.; Lai, D.; Yang, H.; Feng, L.; Li, L.; Niu, K.; Chen, L.; Xiang, D.; Ruan, J.; et al. Genome-wide investigation of the GRAS transcription factor family in foxtail millet (Setaria italica L.). MC Plant Biol. 2021, 21, 508. [Google Scholar] [CrossRef] [PubMed]
  15. Han, S.; Jiao, Z.; Niu, M.X.; Yu, X.; Huang, M.; Liu, C.; Wang, H.L.; Zhou, Y.; Mao, W.; Wang, X.; et al. Genome-Wide Comprehensive Analysis of the GASA Gene Family in Populus. Int. J. Mol. Sci. 2021, 22, 12336. [Google Scholar] [CrossRef]
  16. Liu, M.; Huang, L.; Ma, Z.; Sun, W.; Wu, Q.; Tang, Z.; Bu, T.; Li, C.; Chen, H. Genome-wide identification, expression analysis and functional study of the GRAS gene family in Tartary buckwheat (Fagopyrum tataricum). BMC Plant Biol. 2019, 19, 342. [Google Scholar] [CrossRef] [Green Version]
  17. Liu, B.; Sun, Y.; Xue, J.; Jia, X.; Li, R. Genome-wide characterization and expression analysis of GRAS gene family in pepper (Capsicum annuum L.). PeerJ 2018, 6, e4796. [Google Scholar] [CrossRef] [PubMed] [Green Version]
  18. Ling, L.; Zhang, W.; An, Y.; Du, B.; Wang, D.; Guo, C. Genome-wide analysis of the TCP transcription factor genes in five legume genomes and their response to salt and drought stresses. Funct. Integr. Genom. 2020, 20, 537–550. [Google Scholar] [CrossRef]
  19. Kumar, S.; Stecher, G.; Tamura, K. MEGA7: Molecular Evolutionary Genetics Analysis Version 7.0 for Bigger Datasets. Mol. Biol. Evol. 2016, 33, 1870–1874. [Google Scholar] [CrossRef] [Green Version]
  20. Bailey, T.L.; Williams, N.; Misleh, C.; Li, W.W. MEME: Discovering and analyzing DNA and protein sequence motifs. Nucleic Acids Res. 2006, 34, W369–W373. [Google Scholar] [CrossRef]
  21. Chen, C.; Chen, H.; Zhang, Y.; Thomas, H.R.; Frank, M.H.; He, Y.; Xia, R. TBtools: An Integrative Toolkit Developed for Interactive Analyses of Big Biological Data. Mol. Plant 2020, 13, 1194–1202. [Google Scholar] [CrossRef]
  22. Ye, J.; McGinnis, S.; Madden, T.L. BLAST: Improvements for better sequence analysis. Nucleic Acids Res. 2006, 34, W6–W9. [Google Scholar] [CrossRef] [PubMed]
  23. Krzywinski, M.; Schein, J.; Birol, I.; Connors, J.; Gascoyne, R.; Horsman, D.; Jones, S.J.; Marra, M.A. Circos: An information aesthetic for comparative genomics. Genome Res. 2009, 19, 1639–1645. [Google Scholar] [CrossRef] [PubMed] [Green Version]
  24. Shannon, P.; Markiel, A.; Ozier, O.; Baliga, N.S.; Wang, J.T.; Ramage, D.; Amin, N.; Schwikowski, B.; Ideker, T. Cytoscape: A software environment for integrated models of biomolecular interaction networks. Genome Res. 2003, 13, 2498–2504. [Google Scholar] [CrossRef] [PubMed]
  25. Hoagland, D.R.; Arnon, D.I. The water culture method for growing plants without soil. Circ. Calif. Agric. Exp. Stn. 1950, 347, 1–38. [Google Scholar]
  26. Huang, W.; Xian, Z.; Kang, X.; Tang, N.; Li, Z. Genome-wide identification, phylogeny and expression analysis of GRAS gene family in tomato. MC Plant Biol. 2015, 15, 209. [Google Scholar] [CrossRef] [Green Version]
  27. Zhang, H.; Cao, Y.; Shang, C.; Li, J.; Wang, J.; Wu, Z.; Ma, L.; Qi, T.; Fu, C.; Bai, Z.; et al. Genome-wide characterization of GRAS family genes in Medicago truncatula reveals their evolutionary dynamics and functional diversification. PLoS ONE 2017, 12, e0185439. [Google Scholar] [CrossRef] [Green Version]
  28. Zhang, C.; Liu, S.; Liu, D.; Guo, F.; Yang, Y.; Dong, T.; Zhang, Y.; Ma, C.; Tang, Z.; Li, F.; et al. Genome-wide survey and expression analysis of GRAS transcription factor family in sweetpotato provides insights into their potential roles in stress response. BMC Plant Biol. 2022, 22, 232. [Google Scholar] [CrossRef]
  29. To, V.T.; Shi, Q.; Zhang, Y.; Shi, J.; Shen, C.; Zhang, D.; Cai, W. Genome-Wide Analysis of the GRAS Gene Family in Barley (Hordeum vulgare L.). Genes 2020, 11, 553. [Google Scholar] [CrossRef]
  30. Tian, C.; Wan, P.; Sun, S.; Li, J.; Chen, M. Genome-wide analysis of the GRAS gene family in rice and Arabidopsis. Plant Mol. Biol. 2004, 54, 519–532. [Google Scholar] [CrossRef]
  31. Zou, M.; Guo, B.; He, S. The Roles and Evolutionary Patterns of Intronless Genes in Deuterostomes. Comp. Funct. Genom. 2011, 2011, 680673. [Google Scholar] [CrossRef] [Green Version]
  32. Zhang, B.; Liu, J.; Yang, Z.E.; Chen, E.Y.; Zhang, C.J.; Zhang, X.Y.; Li, F.G. Genome-wide analysis of GRAS transcription factor gene family in Gossypium hirsutum L. BMC Genom. 2018, 19, 348. [Google Scholar] [CrossRef] [PubMed]
  33. Yuan, Y.; Fang, L.; Karungo, S.K.; Zhang, L.; Gao, Y.; Li, S.; Xin, H. Overexpression of VaPAT1, a GRAS transcription factor from Vitis amurensis, confers abiotic stress tolerance in Arabidopsis. Plant Cell Rep. 2016, 35, 655–666. [Google Scholar] [CrossRef] [PubMed]
Figure 1. Phylogenetic tree of Avena sativa GRAS family members.
Genes 14 00164 g001
Figure 2. Gene structure analysis of the Avena sativa GRAS gene family.
Genes 14 00164 g002
Figure 3. Analysis of the promoter elements of the GRAS gene family in Avena sativa.
Genes 14 00164 g003
Figure 4. Avena sativa GRAS protein interaction network diagram.
Genes 14 00164 g004
Figure 5. The collinearity map of GRAS genes.
Genes 14 00164 g005
Figure 6. The expression patterns of GRAS genes under 4 stresses (salt, saline–alkali, cold, and freezing stress conditions).
Genes 14 00164 g006
Disclaimer/Publisher’s Note: The statements, opinions and data contained in all publications are solely those of the individual author(s) and contributor(s) and not of MDPI and/or the editor(s). MDPI and/or the editor(s) disclaim responsibility for any injury to people or property resulting from any ideas, methods, instructions or products referred to in the content.

