Article

The Complete Chloroplast Genomes of Blepharoglossum elegans and B. grossum and Comparative Analysis with Related Species (Orchidaceae, Malaxideae)

1
Key Laboratory of South China Agricultural Plant Molecular Analysis and Genetic Improvement, South China Botanical Garden, Chinese Academy of Sciences, Guangzhou 510650, China
2
Guangdong Provincial Key Laboratory of Applied Botany, South China Botanical Garden, Chinese Academy of Sciences, Guangzhou 510650, China
3
University of Chinese Academy of Sciences, Beijing 100049, China
*
Author to whom correspondence should be addressed.
Genes 2023, 14(5), 1069; https://doi.org/10.3390/genes14051069
Submission received: 20 March 2023 / Revised: 26 April 2023 / Accepted: 4 May 2023 / Published: 11 May 2023
(This article belongs to the Section Plant Genetics and Genomics)

Abstract

:
Blepharoglossum is a rare orchid genus of the Malaxidinae primarily distributed in tropical Pacific islands, with several species occurring in the Taiwan and Hainan Islands of China. Currently, the monophyletic status of Blepharoglossum has been challenged, and the phylogenetic relationships among its allied groups have remained unresolved with traditional DNA markers. In this study, we initially sequenced and annotated the chloroplast (cp) genomes of two Blepharoglossum species, Blepharoglossum elegans (Lindl.) L. Li and Blepharoglossum grossum (Rchb.f.) L. Li. These cp genomes of Blepharoglossum share the typical quadripartite and circular structure. Each of the genomes encodes a total of 133 functional genes, including 87 protein-coding genes (CDS), 38 tRNA genes and 8 rRNA genes. By comparing the sequence differences between these two cp genomes, it was found that they are relatively conserved in terms of overall gene content and gene arrangement. However, a total of 684 SNPs and 2664 indels were still identified, with ycf1, clpP, and trnK-UUU protein-coding genes having the highest number of SNPs and indels. In further comparative analyses among the six cp genomes in Malaxidinae, significant sequence divergences were identified in the intergenic regions, namely rps16–trnQ-UUG, trnS-GCU–trnG-GCC, rpoB–trnC-GCA, trnE-UUC–trnT-GGU, trnF-GAA–trnV-UAC, atpB–rbcL, petA–psbJ, psbE–petL, psbB–psbT, trnN-GUU–rpl32, trnV-GAC–rps7, and rps7–trnL-CAA, and five coding regions, including matK, and rpoC2, ycf1, and two ycf2 genes. Phylogenetic analysis indicated that Blepharoglossum and Oberonia form a highly supported sister group relationship. Our results are consistent with previous studies and present increased resolution among major clades.

1. Introduction

The orchid genus Blepharoglossum (Schltr.) L. Li of Malaxidinae (Orchidaceae, Malaxideae), includes species previously ascribed to Liparis Rich. s.l. or Cestichis Thouars ex Pfitzer [1,2]. The most recent phylogenetic study on 50 species of Malaxideae presented a phylogeny of Cestichs and allied genera using ITS and matK sequence data [3]. Blepharoglossum was placed as sister to Oberonia Lindl. with weak support. Based on morphological characters, they observed a clear difference with regard to their rachis characters. Blepharoglossum species have terete rachises; in contrast, species of Cestichis and Stichorkis Thouars possess slightly or strongly flattened rachises. In addition, Blepharoglossum species have a deeply bilobed lip apex with margins that are lobulated and ciliolate to deeply lacerate. Based on these findings, Blepharoglossum was elevated to full generic status. Blepharoglossum comprises approximately 39 species that are mostly distributed in tropical Asia–Pacific islands, including Peninsular Malaysia, Borneo, Sumatra, Java, Sulawesi, the Philippines, Papua New Guinea, New Caledonia, and Fiji, with some species found in Myanmar, Thailand, Vietnam, and Taiwan and Hainan Islands in China [3,4].
The Blepharoglossum is a precious orchid genus, whose species are all listed in Appendix I of the Convention on International Trade in Endangered Species Wild Fauna and Flora (CITES). Due to the destruction of its habitat and people’s enthusiasm for the mining of orchid plants, it is further lacking resources. In Flora of China, the Blepharoglossum encompasses 5 distinct species, namely B. condylobulbon (Rchb.f.) L. Li, B. elegans (Lindl.) L. Li, B. fissilabrum (T. Tang and F.T. Wang) L. Li, B. grossum (Rchb.f.) L. Li, and B. latifolium (Lindl.) L. Li. Despite the fact that they serve as an important resource for orchids, the cp genomes of these five species have not been previously characterized. Therefore, it is imperative to conduct a comprehensive analysis to explore the sequence variability within the cp genome of this genus, as it holds significant implications for conservation efforts. Moreover, there is still uncertainty regarding the intergeneric relationships within Malaxidinae at present. Although the Blepharoglossum was previously and for a long time placed as Liparis s.l. or Cestichis due to the resemblances in floral morphology, the molecular systematics and morphology evidence indicated that the Blepharoglossum clade and other Liparis alliances had distant relationships and significantly different characteristics. Thus, it had been separated from epiphytic Liparis s.l. and elevated to a generic status in recent years [3]. Nevertheless, the taxonomic status of Blepharoglossum and the phylogenetic relationships within its relevant groups have been controversial due to their limited resolution with traditional sequences from one or a few markers in previous studies that await stronger evidence to support them. This is probably because its relatives have a notoriously complicated taxonomy. Therefore, the development of more effective genetic resources on the basis of high-resolution molecular markers is necessary for further phylogenetic studies of Blepharoglossum.
The chloroplast (cp) genomes have been extensively employed in various areas of research, such as in species identification, evolutionary assessments, and in the development of molecular markers [5,6,7]. Research has demonstrated that cp genomes offer distinct advantages for resolving the phylogenetic relationships of angiosperms, primarily due to their high-copy nature, structural simplicity, and highly conserved gene content [8,9]. In Orchidaceae, for instance, some genera exhibit unresolved phylogenetic relationships and uncertain monophyletic status with traditional sequences from a single or few markers, such as nrDNA-ITS and matK. However, the cp genome data have demonstrated remarkable advantages in resolving the developmental relationships and systematic positions of complex taxa, resulting in significant improvements in accuracy and reliability [10,11]. Moreover, a comparative analysis of cp genomes presents a promising avenue for investigating sequence variations and identifying mutation hotspots. The identification of such regions from cp genomes can serve as informative molecular markers for species delimitation and genetic analyses of populations [12,13].
In this study, we sequenced and assembled the complete cp genomes of two Blepharoglossum species, B. elegans and B. grossum, which have not been previously characterized. We then analyzed their differences and compared sequence features with those of four other species in allied genera within Malaxidinae. The aims of this investigation were two-fold: (1) to elucidate and contrast the cp genomes of Blepharoglossum, identifying variations among these six species, and (2) to reconstruct a robust phylogenetic tree of Blepharoglossum and its closely related taxa using cp genome sequences, thereby elucidating their phylogenetic relationships and verifying their taxonomic status within Malaxidinae. Our cp genome data presented here will provide an informative and valuable genomic resource for facilitating species authentication and evolutionary analysis in the Orchidaceae.

2. Materials and Methods

2.1. Sampling and DNA Extraction

The samples of B. elegans and B. grossum were obtained from the living collections of the greenhouse of South China Botanical Garden, Chinese Academy of Sciences (SCBG, CAS, 23°10.858′ N, 113°21.136′ E, 27 m), which were introduced from the field populations in Hainan, China in 2021. The voucher specimens had been lodged at the herbarium of South China Botanical Garden (IBSC), under collection numbers YWT042 (B. grossum) and YWT043 (B. elegans). Total genomic DNA was extracted from fresh leaf tissues using a Plant Genomic DNA kit (Tsingke Biological Technology, Beijing, China) following the manufacturer’s instructions.

2.2. DNA Library Preparation and Sequencing

The total DNA was fragmented and used to set up short-insert libraries and the qualified libraries were sequenced with PE150 bp on the DNBseq-2000RS platform at Beijing Genomics Institute (Wuhan, China). There was ~3.0 Gb total amount of data and about 20× sequencing depth. Then we used SOAPnuke software [14] to filter the low-quality data of the generated paired-end raw reads to obtain clean data, which could be used for subsequent analysis. Filtering standard: remove reads with an N base content exceeding 5%; remove reads with a low quality (mass value less than or equal to 5) base count of 50%; remove reads contaminated with adapter.

2.3. Chloroplast Genome Assembly and Annotations

Clean data were used for assembling the complete cp genomes by using GetOrganelle v1.6.2e [15]. We downloaded several cp genomes closest to Blepharoglossum from NCBI GenBank database as reference sequences for assembly, i.e., Liparis auriculata Blume ex Miq. (GenBank accession no.: MN200365), Liparis bootanensis Griff. (GenBank accession no.: MN627759), Liparis nervosa (Thunb.) Lindl. (GenBank accession no.: MN641753), and Liparis pingtaoi (G.D. Tang, X.Y. Zhuang and Z.J. Liu) J.M.H. Shaw (GenBank accession no.: MN627758). The assembled cp genomes were annotated with PGA [16], then manually adjusted and confirmed using Geneious R9.0.2 [17]. The circular cp genome maps were visualized by OrganellarGenomeDRAW (OGDRAW) version 1.3.1 [18]. Utilizing Geneious R9.0.2, we identified the number of single-nucleotide polymorphisms (SNPs) and insertions–deletions (Indels) that existed between the two Blepharoglossum species under analysis, using B. grossum as a reference sequence.

2.4. Genome Comparison and Phylogenetic Identification

In addition to the newly sequenced genomes of two Blepharoglossum species noted above, we downloaded four published sequences of their allies from the NCBI database, i.e., L. bootanensis (GenBank accession no.: MN627759), L. viridiflora (Blume) Lindl. (GenBank accession no.: MW691170), Stichorkis gibbosa (Finet) J.J. Wood (GenBank accession no.: OM759993), and Oberonia seidenfadenii (H.J. Su) Ormerod (GenBank accession no.: MN414241) in order to identify the genetic and genomic features among different genomes. The location of genes on the IR/SC boundaries were visualized by IRscope [19]. The divergent regions were accessed using mVISTA online program in Shuffle-LAGAN mode with the cp genome sequence of O. seidenfadenii selected as a reference [20].
To gain a more thorough understanding of the intergeneric relationships between Blepharoglossum and related genera, we reconstructed the phylogenetic tree of Malaxidinae based on 25 cp genome data representing 24 species. In addition to the 2 newly sequenced Blepharoglossum cp genomes, another 23 cp genomes were obtained from the NCBI GenBank database. Sequences of three species, i.e., Epipactis purpurata Sm., Neottia japonica (Blume) Szlach., and Cephalanthera humilis X.H. Jin, were selected as outgroups based on earlier phylogenetic studies [21]. All the 25 genome sequences were aligned and adjusted using the plug-in MAFFT Alignment in Geneious R9.0.2. We constructed the phylogenetic tree using IQ-TREE [22]. The best-fit model was GTR + F + I + G4 in this analysis and we validated it by 1000 SH-aLRT tests and ultrafast tests bootstrap approach (UFboot) [23,24]. The generated phylogenetic tree was visualized through the utilization of Figtree software. Each branch of the phylogenetic tree contains SH-aLRT and UFboot support rates. If SH-aLRT ≥ 80% and UFboot ≥ 95%, it is considered to have received good support and the branch results are reliable.

3. Results and Discussion

3.1. Chloroplast Genome Features

The chloroplast genome sequences of B. elegans and B. grossum that were obtained in this study have been deposited in the NCBI GenBank database under the accession numbers OP859143 and OP859144, respectively. Both Blepharoglossum cp genomes exhibited the typical circular and quadripartite structure characteristic of most angiosperms (Figure 1), which consists of a pair of inverted repeat regions (IRa and IRb) that are separated by a large single copy (LSC) and a small single copy (SSC). The cp genome sequences of Blepharoglossum are 156,813 bp (B. elegans) and 157,549 bp (B. grossum) in size. The cp genome of B. elegans was extremely similar to that of B. grossum. The length of the LSC regions are 84,984 bp (B. elegans) and 85,588 bp (B. grossum), the SSC regions are 17,731 bp (B. elegans) and 17,765 bp (B. grossum), and the IR regions are 27,049 bp (B. elegans) and 27,098 bp (B. grossum), respectively (Table 1). The complete set of 133 genes, comprising 87 protein-coding sequences (CDS), 38 transfer RNA genes (tRNAs), and 8 ribosomal RNA genes (rRNAs), were encoded by each of the genomes (Table 2). Except for O. seidenfadenii, the length and gene content of the cp genomes of the other five species varied little and were very close. Among these cp genomes of 6 species, the longest was 158,325 bp in L. bootanensis and the shortest was 143,062 bp in O. seidenfadenii. The main variations among them are the length of the SSC and IR regions. Corresponding to the smaller size, the cp genome of O. seidenfadenii was annotated with only 120 genes, including 74 protein-coding genes, 38 tRNA, and 8 rRNA (Table 1).

3.2. SNPs and Indels Detection between B. grossum and B. elegans

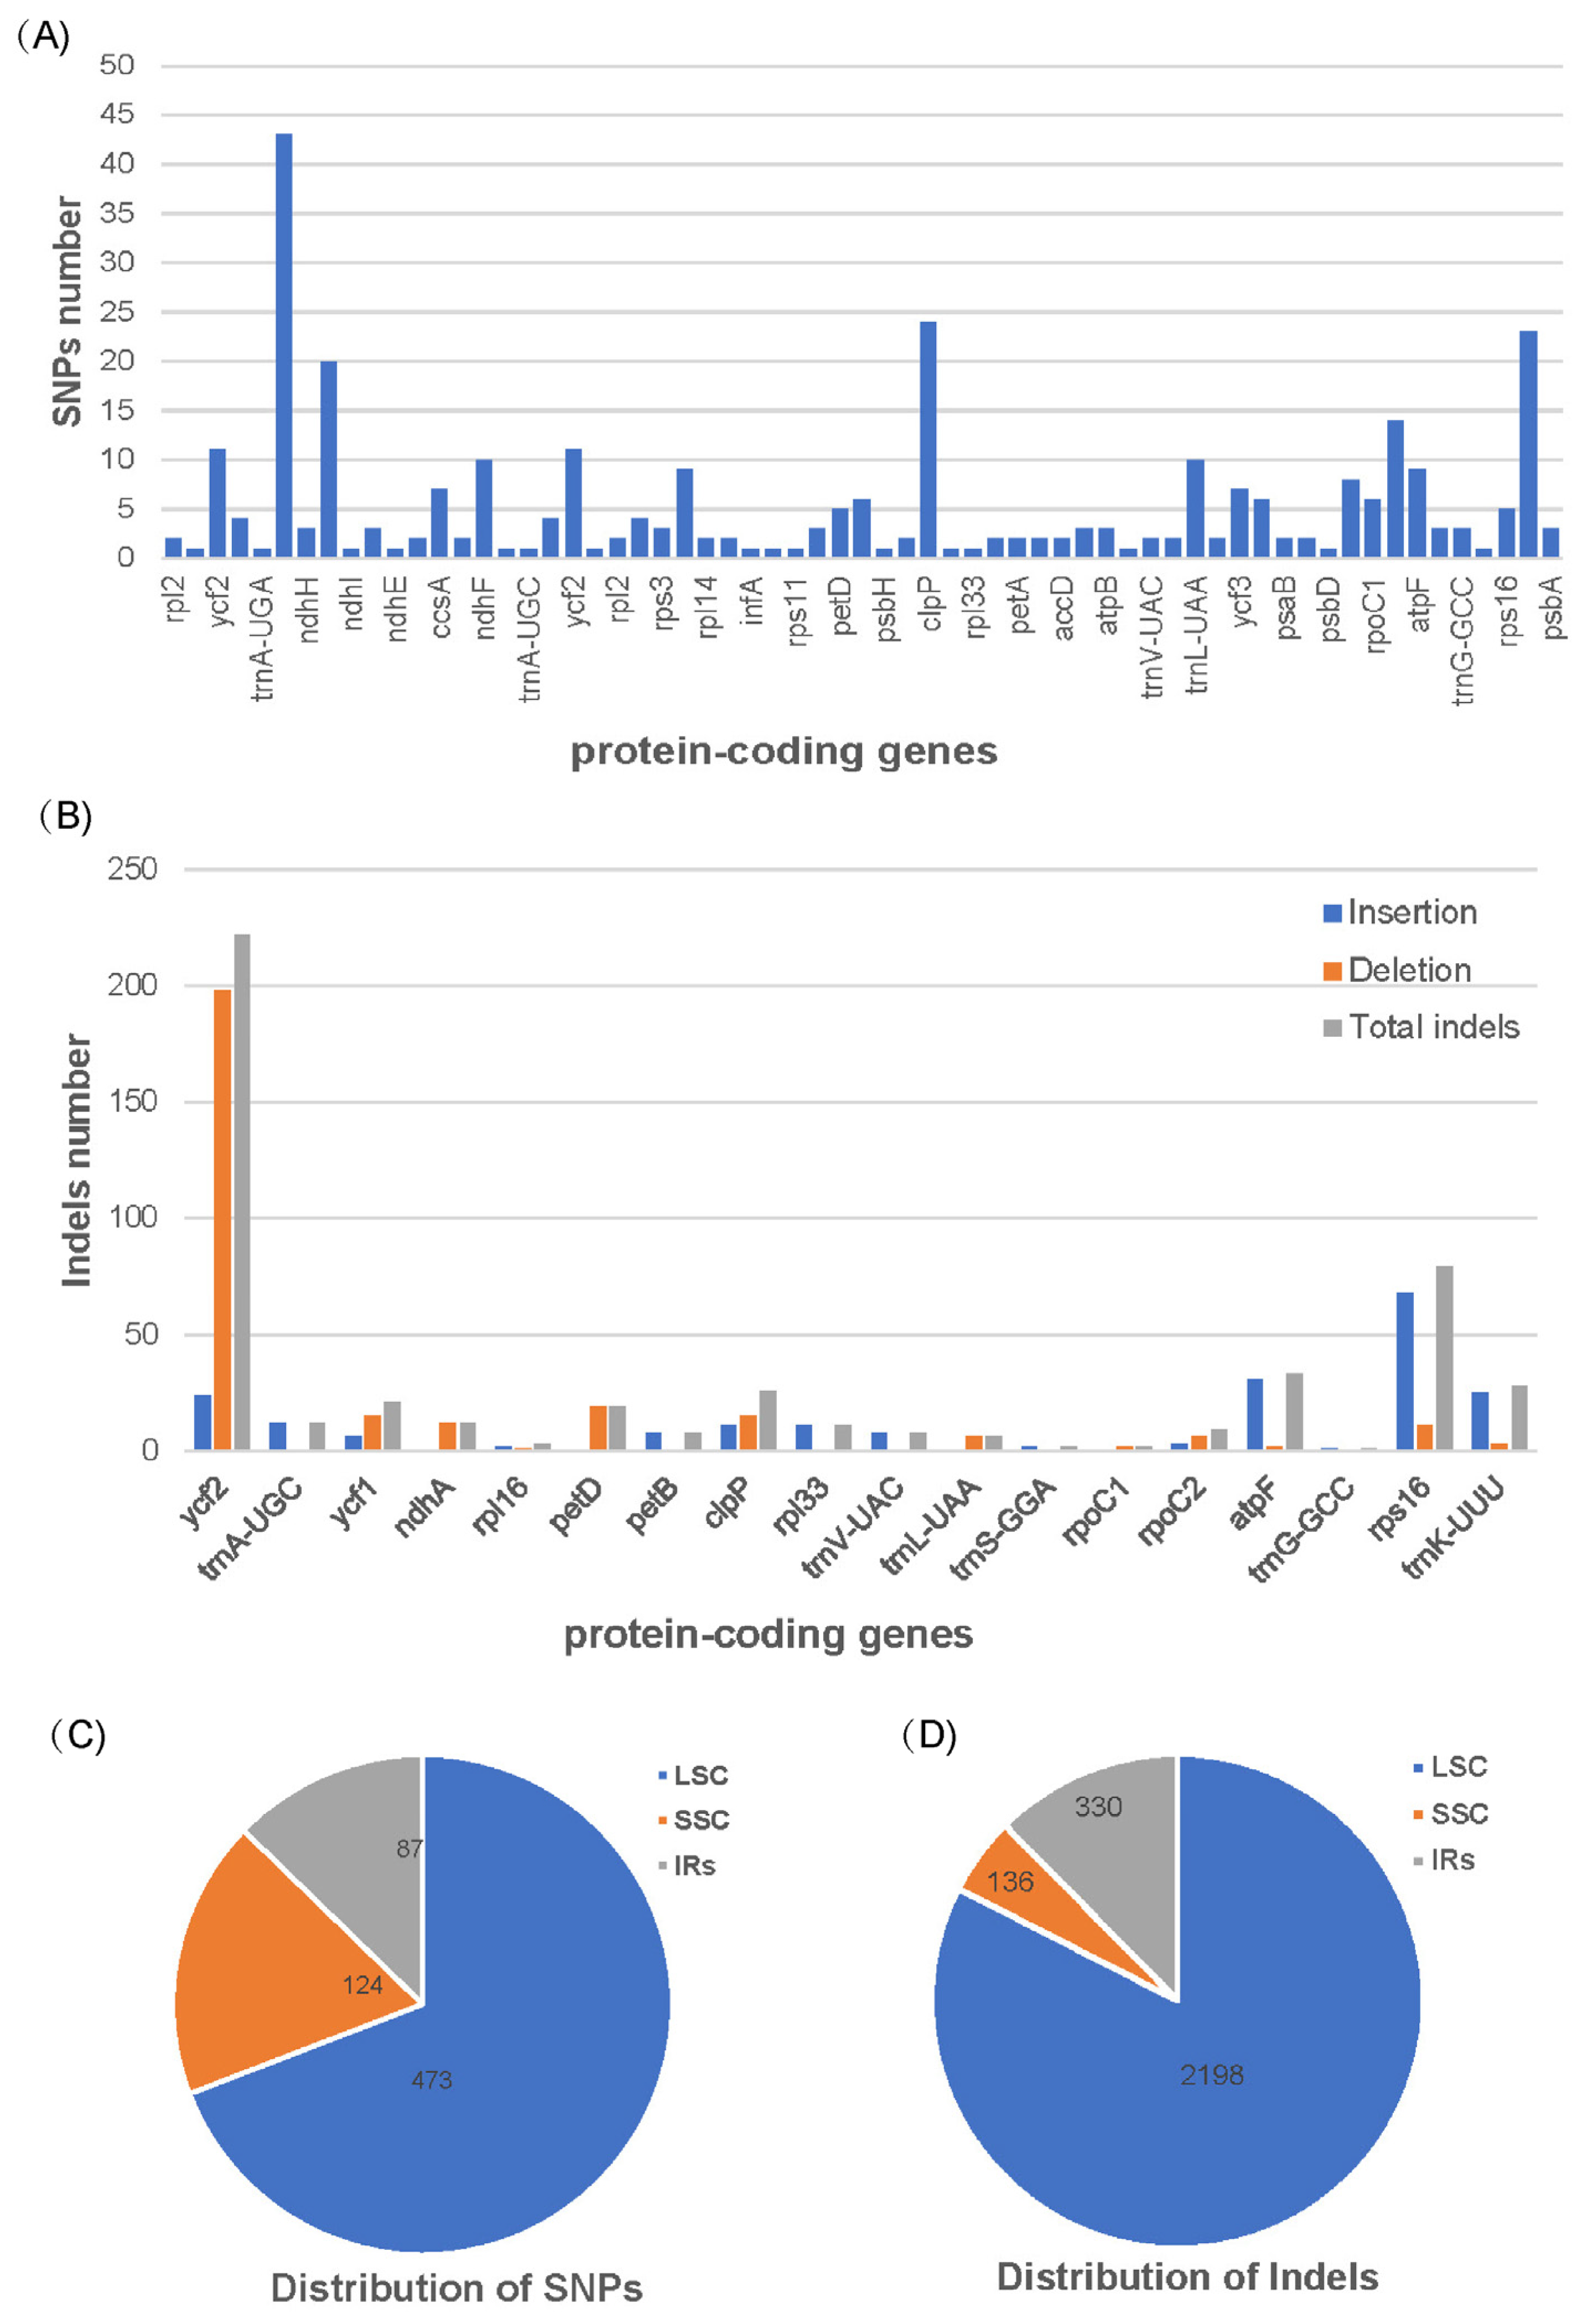
To further explore the genetic disparities of the two Blepharoglossum plastomes, SNPs (single nucleotide polymorphisms) and indels (insertions/deletions) were identified with the cp genome of B. grossum as a reference. Compared to the B. grossum reference genome, 684 SNPs and 2664 indels were detected in B. elegans (Tables S1 and S2). In total, there are 321 SNPs in 63 protein-coding genes (CDS) and 364 SNPs in intergenic regions (IGS) detected between the cp genomes of B. elegans and B. grossum (Table 3). In terms of protein-coding genes, the number of SNPS is maximal in the ycf1, ndhA, clpP, and trnK-UUU genes, with 43, 20, 24, and 23, respectively (Figure 2A). A total of 964 insertions and 1700 deletions were detected between the two cp genomes of Blepharoglossum species (Table S2). The results showed that 2162 indels (752 insertions and 1210 deletions) were located in intergenic spacer regions, while the other 502 indels (212 insertions and 290 deletions) were distributed in 18 protein-coding genes, including ycf2, trnA-UGC, ycf1, ndhA, rpl16, petD, petB, clpP, rpl33, trnV-UAC, trnL-UAA, trnS-GGA, rpoC1, rpoC2, atpF, trnG-GCC, rps16, and trnK-UUU (Figure 2B). Among them, indels were mostly found in the ycf2, ycf1, clpP, atpF, rps16, and trnK-UUU genes, corresponding to 222, 21, 26, 33, 79, and 28 respectively. The distributions of SNPs and indels is shown in Figure 2C,D. The number of SNPs located in the LSC, SSC and IRs regions accounted for 69.2%, 18.1%, and 12.7%, respectively. The number of indels in the LSC, IRs and SSC regions accounted for 82.5%, 12.4% and 5.1%, respectively.
Overall, the distribution patterns of SNPs and indels in the two cp genomes are similar, with a large number of variations present in the LSC region and relatively few polymorphic sites in the SSC and IRs regions. Furthermore, the majority of mutations in these genomes existed in the non-coding regions, mainly concentrated in the intergenic spacer regions, and some coding regions also contained a considerable number of mutation sites. These SNPs and the indels identified herein provide a reliable estimate of genome-wide genetic variations of the two Blepharoglossum species.

3.3. Details of the IR Contraction and Expansion

The IR/SC boundary regions and adjacent genes were compared among the chloroplast genomes of Blepharoglossum and its allies (L. bootanensis, L. viridiflora, S. gibbosa, and O. seidenfadenii). In all these cp genomes, the rpl22 gene crossed the LSC/IRb border. The IRa/LSC junction was located between rps19 and psbA, and variation between psbA and the Ira/LSC border ranged from 85 bp to 185 bp (Figure 3). However, the IR/SSC boundaries in these genomes exhibited obvious differences. The ndhF gene was found to be absent at the IRb/SSC boundary in O. seidenfadenii. In particular, with the exception of O. seidenfadenii, the ycf1 gene crossed the SSC/IRa junction in all compared species and extended 5375 bp–5534 bp into the IRa regions, creating a pseudogene (ψycf1), with the fragments varying from 1055 bp to 1159 bp in the IRb region. In contrast, the ycf1 gene of O. seidenfadenii was nearly completely situated in the SSC region, extending only 2 bp to the IR region, and thus, no pseudogene was created at the border. Furthermore, overlaps between the ψycf1 fragment and the ndhF gene were detected at the IRb/SSC junction. In B. elegans, B. grossum, and S. gibbosa, the ndhF gene was located 65 bp–68 bp away from IRb/SSC, whereas in L. bootanensis and L. viridiflora, it was only 9 bp away, which also had a 9 bp overlap with ψycf1.
Previous studies have revealed that the ndhF gene has been pseudogenized or lost in most orchid cp genomes, which is correlated with shifts in the position of the junction of the IR/SC regions [25,26,27]. The expansion and contraction of IR boundary regions or gene loss could account for size variations in cp genomes [27,28]. Compared to the other five cp genomes, the cp genomes size in O. seidenfadenii was considerably shorter. The IR regions of O. seidenfadenii was only 24,278 bp in length, while the IR regions of the other species examined were much longer, approximately 27,000 bp in length (Table 2). The ndhF gene in the O. seidenfadenii cp genome is apparently lost. Gene loss could contribute to the adaptive evolution in response to a changing environment [29].

3.4. Comparative Analysis of the Chloroplast Genomes

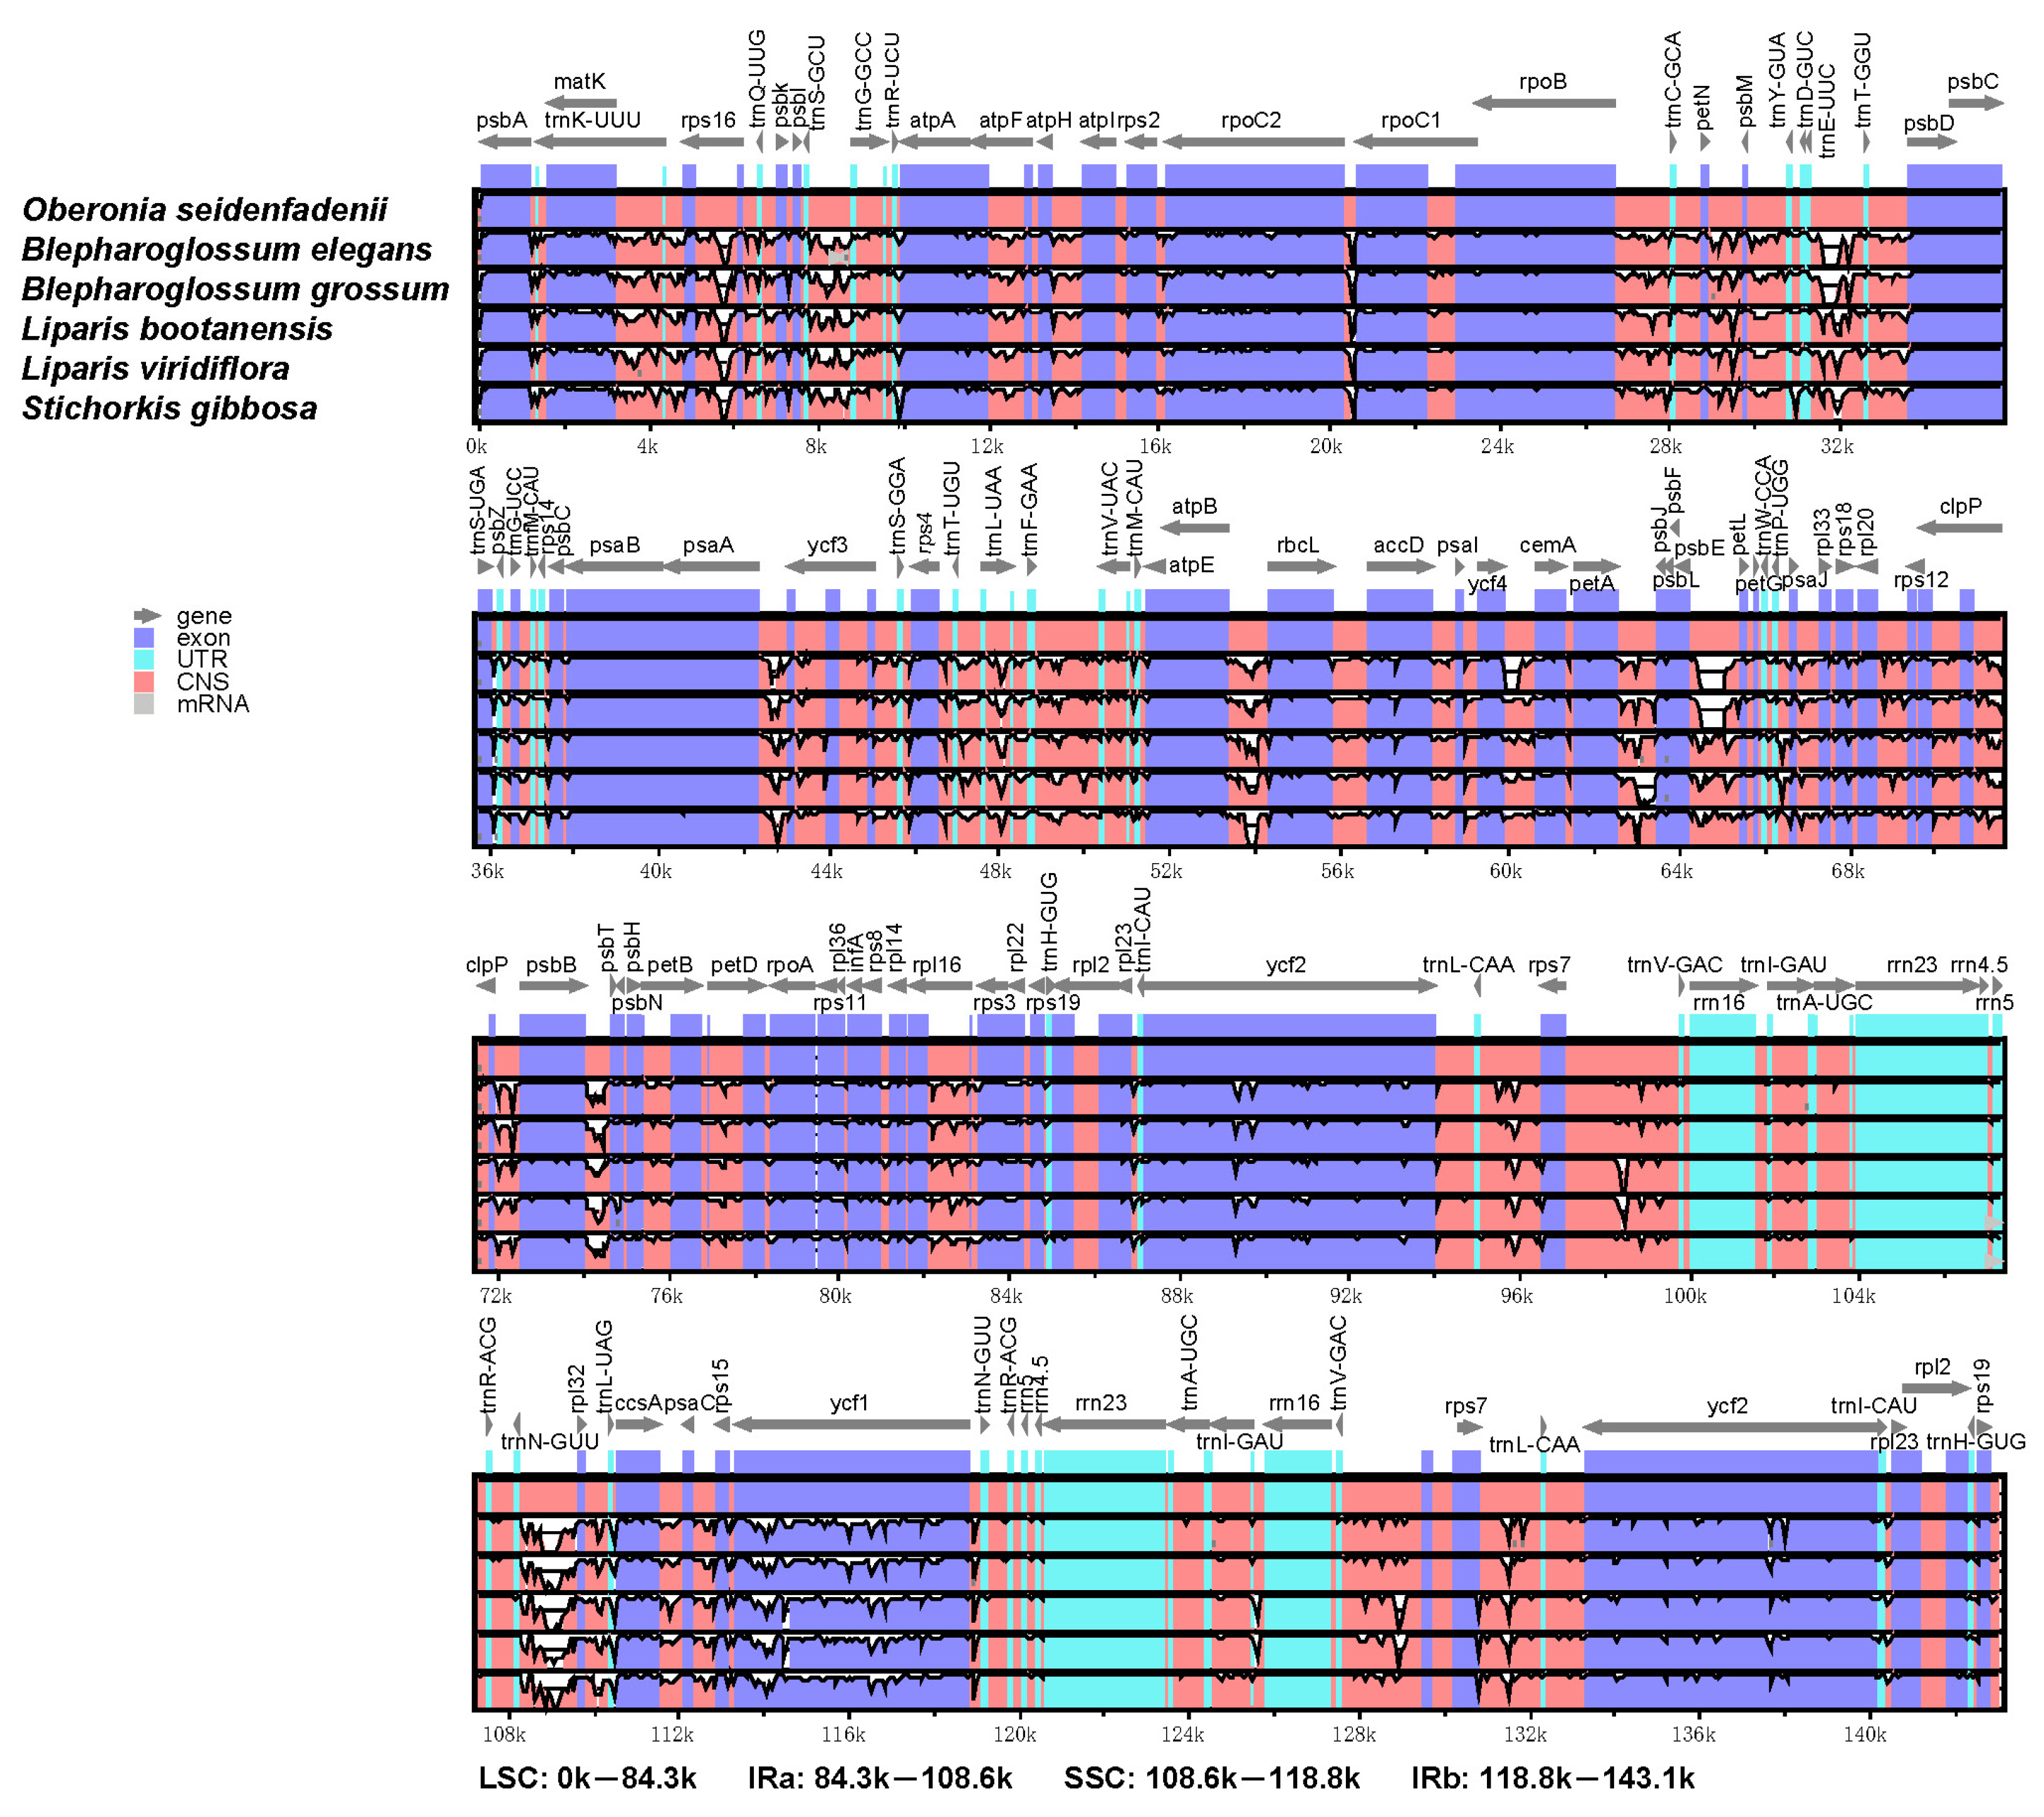
The sequences of the two Blepharoglossum cp genomes, together with four other published cp genomes of related species, were aligned and compared using mVISTA with the annotated O. seidenfadenii cp genome (GenBank accession no.: MN414241) as a reference. Our analyses showed that higher divergences were distributed in the non-coding regions compared to the protein-coding regions. Expectedly, significant divergences were identified within non-coding intergenic spacer (IGS) regions. Additionally, for both coding and non-coding regions, the LSC and SSC regions exhibited higher sequence variations than the two IR regions. Notably, we found two separate deletions of about 240 bp in the psbE–petL region and 473 bp in the trnE-UUC–trnT-GGU region for both of B. elegans and B. grossum cp genomes. In addition, B. elegans carried a unique deletion of 400 bp in the ycf4–cemA intergenic region. Most of the genetic variabilities were identified in the intergenic spacers, such as rps16–trnQ-UUG, trnS-GCU–trnG-GCC, rpoB–trnC-GCA, trnE-UUC–trnT-GGU, trnF-GAA–trnV-UAC, atpB–rbcL, petA–psbJ, psbE–petL, psbB–psbT, trnN-GUU–rpl32, trnV-GAC–rps7, and rps7–trnL-CAA. Somewhat higher sequence variations in the coding regions were observed, including rpoC2, ycf1, and two ycf2 genes (Figure 4). The significant divergences detected in both the intergenic spacer regions and the genes align with similar findings from other cp genomes of orchid species [27,30], which could be used as potential molecular markers.

3.5. Phylogenetic Analysis

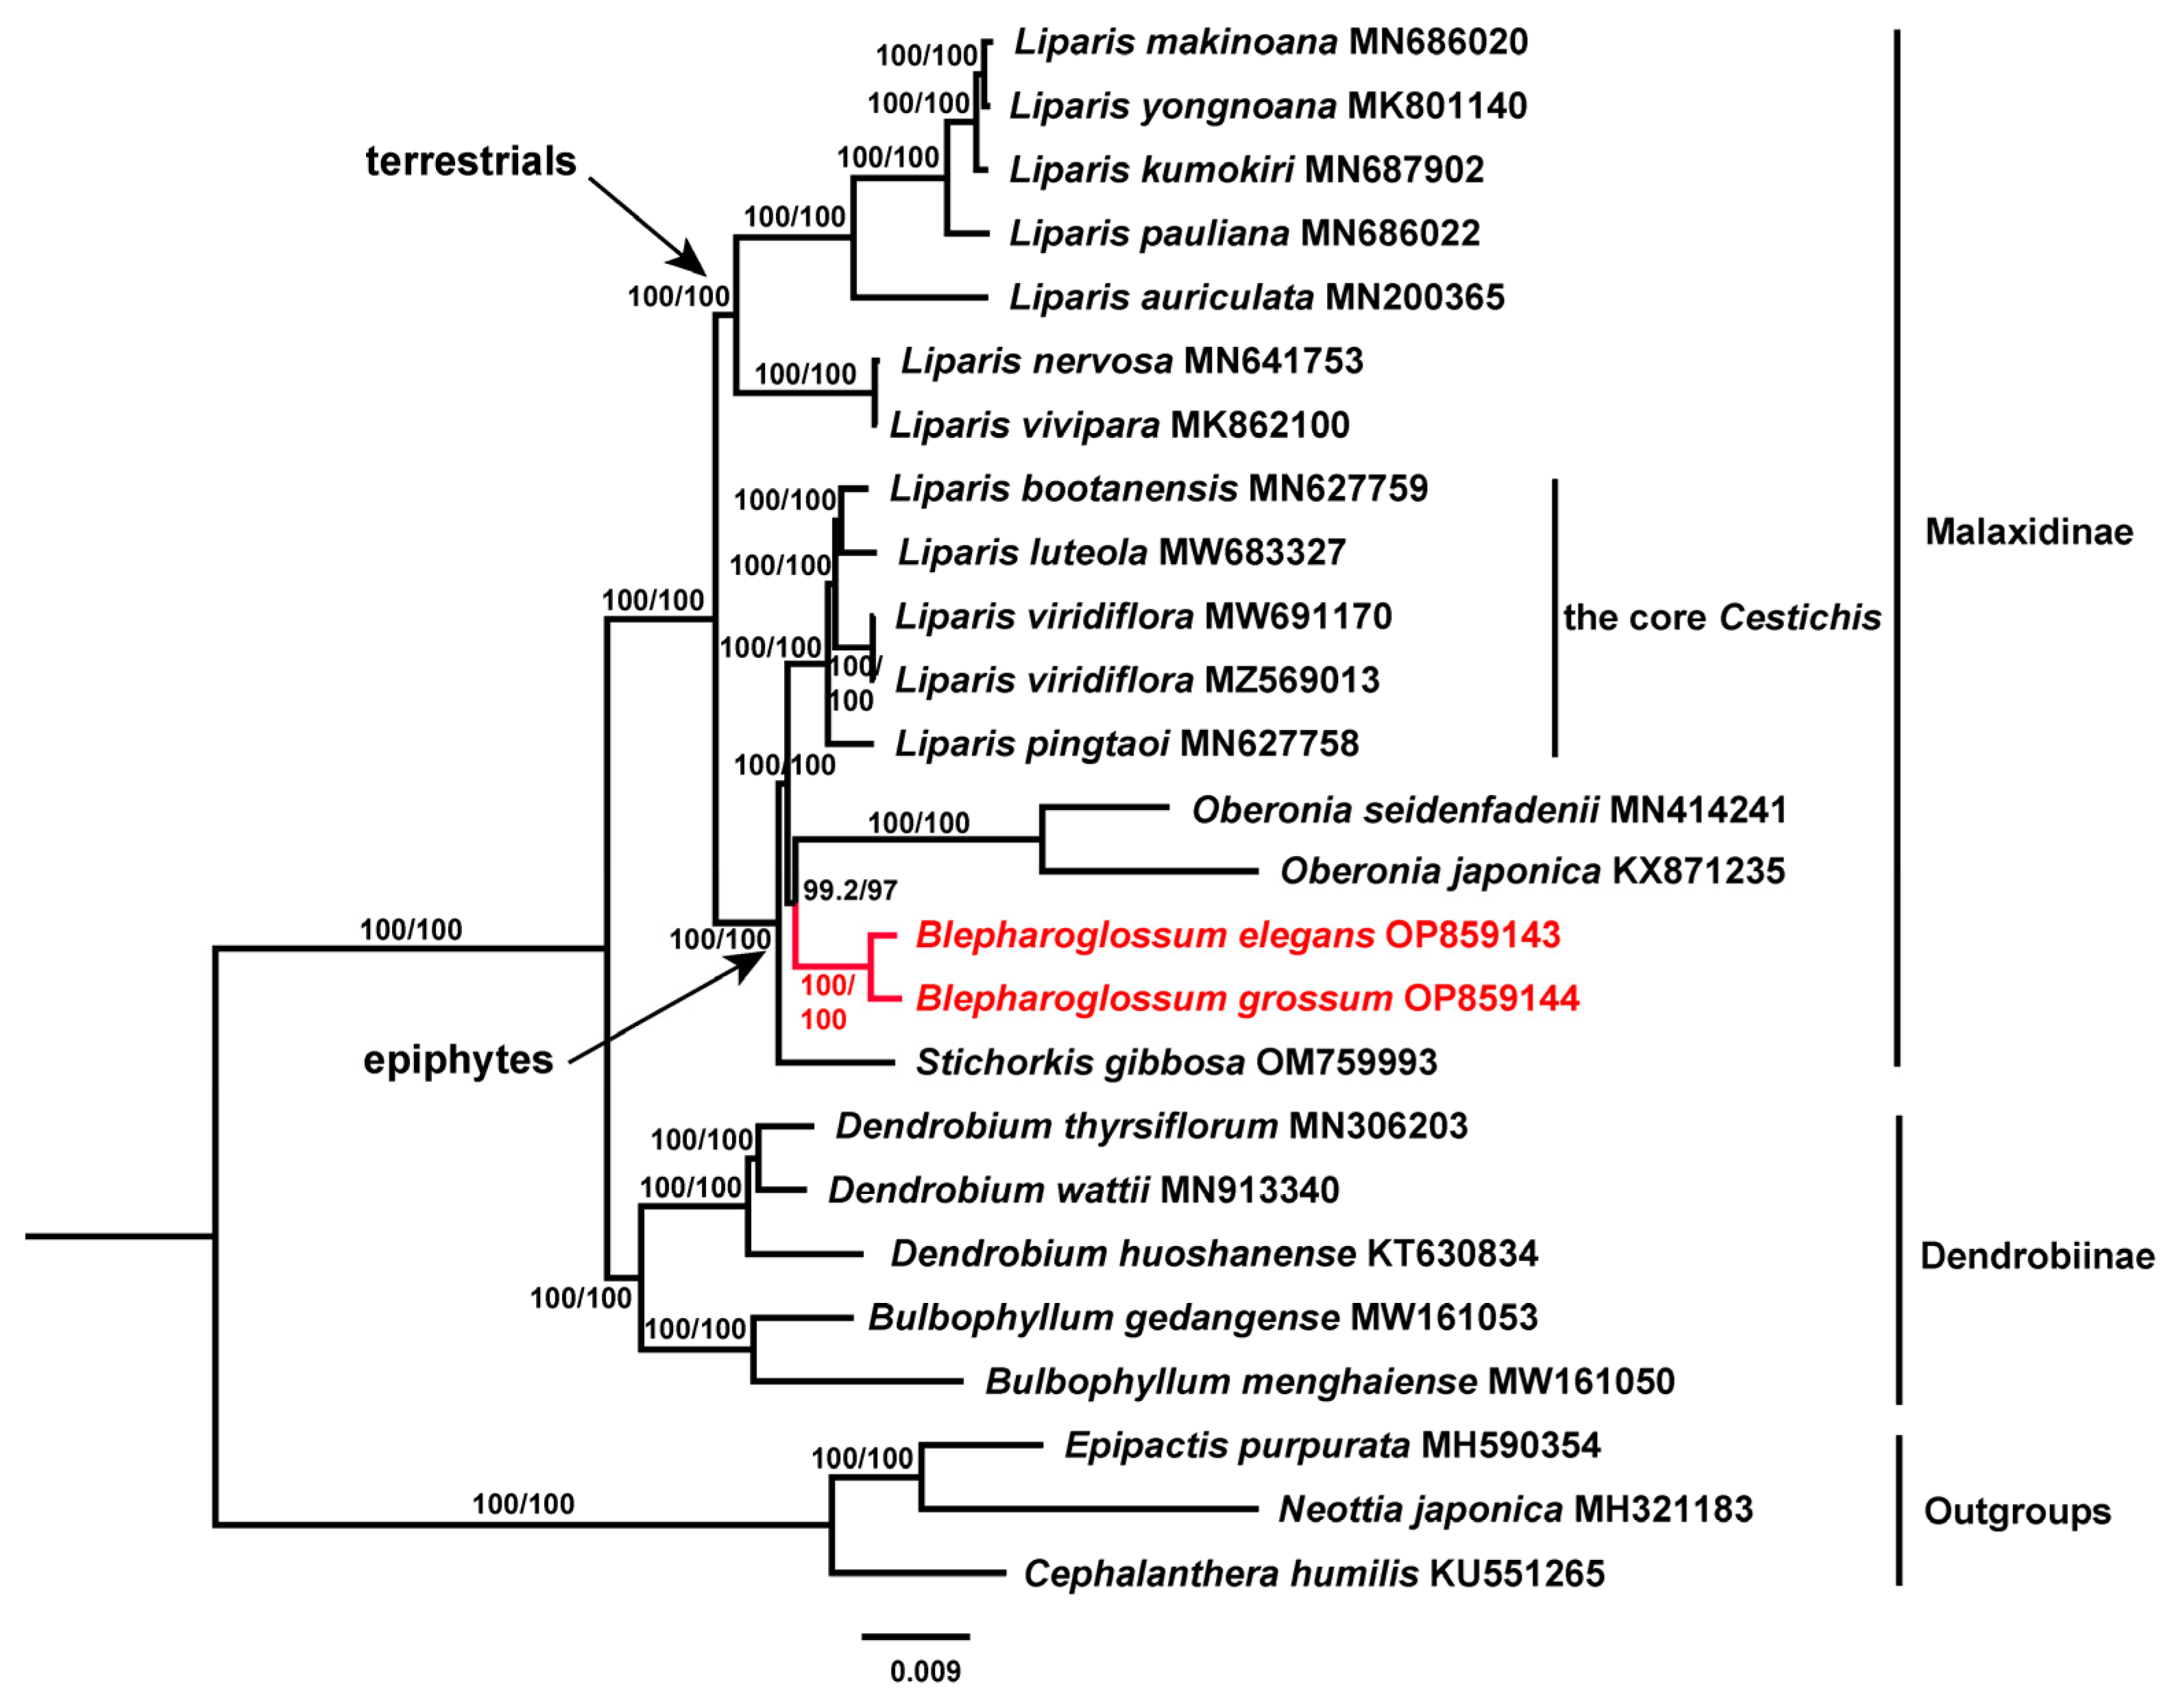
Overall, the topology of the phylogenetic tree inferred from our maximum likelihood (ML) analyses was largely consistent with those from previous studies using molecular data from a few markers of nuclear and plastid regions [3,31,32]; however, the full cp genome sequences produced a more resolved and better-supported phylogeny (Figure 5). Similarly, the members of Malaxidinae in this study were clearly clustered into two distinct lineages corresponding to the epiphytes and terrestrials. The two representatives of Blepharoglossum formed a well-supported monophyletic lineage, sister to Oberonia with high support. Our results revealed that Blepharoglossum and Oberonia were more closely related to each other than to any other groups traditionally recognized within the Malaxidinae. The epiphytic Liparis alliance was reconfirmed to form a polyphyletic assemblage of three distant lineages (the core Cestichis, Stichorkis, and Blepharoglossum) that have evolved independently.

4. Conclusions

This study first shed light on the structure and content of the complete chloroplast genomes of two Blepharoglossum species. A total of 4 genes (ycf1, ndhA, clpP, and trnK-UUU) exhibited more than 20 SNPs, while 6 genes (ycf2, ycf1, clpP, atpF, rps16, and trnK-UUU) had indel numbers exceeding 20, which suggests that these genes could serve as promising molecular markers for studying Blepharoglossum, aiding in practical applications such as resource conservation and species identification. We also offered information on the sequence divergences in these cp genomes and the four other published Malaxidinae cp genomes. Among these 6 cp genomes, genomic divergences were detected as promising DNA barcodes, including 12 intergenic regions and 5 protein-coding genes. In particular, two separate deletions occurred in the two Blepharoglossum cp genomes which were not found in the other allies. The positions of the IR/SSC boundaries associated with the ycf1 genes and the ndhF genes were quite variable for these six cp genomes. Additionally, the phylogeny inferred from the complete cp genomes greatly improved the phylogenetic resolution of the Stichorkis and Blepharoglossum clades and will likely contribute to our knowledge of the generic circumscription within Malaxidinae.

Supplementary Materials

The following supporting information can be downloaded at: https://www.mdpi.com/article/10.3390/genes14051069/s1. Table S1: SNPs detected between the B. elegans and B. grossum chloroplast genomes; Table S2: Indels detected between the B. elegans and B. grossum chloroplast genomes.

Author Contributions

W.Y. performed the experiments and data analyses under the guidance of L.L., and prepared the draft of the manuscript. L.L. proposed amendments and addenda to the first draft and provided funding support. S.Z., K.W. and L.F. engaged in useful discussion and revised the manuscript. All authors have read and agreed to the published version of the manuscript.

Funding

This research was funded by the National Natural Science Foundation of China [32070224] and Project by the Forestry Administration of Guangdong Province (National Botanical Garden Construction).

Institutional Review Board Statement

Not applicable.

Informed Consent Statement

Not applicable.

Data Availability Statement

The genome sequence data of B. elegans and B. grossum of this study are openly available in NCBI GenBank database (https://www.ncbi.nlm.nih.gov/, accessed on 1 March 2023) under accession numbers of OP859143 and OP859144, respectively.

Acknowledgments

We sincerely thank Mingzhong Huang (Tropical Crops Genetic Resources Institute, CATA) for his assistance in the preparation of the samples.

Conflicts of Interest

The authors declare no conflict of interest.

References

  1. Schlechter, R. Die Orchidaceen von Deutsch-Neu-Guinea. Repertorium specierum novarum regni vegetabilis; Paul Parey: Berlin, Germany, 1914; pp. i–lxvi, 181–220. [Google Scholar]
  2. Jones, D.L.; Clements, M.A. Miscellaneous nomenclature notes and changes in Australian, New Guinea and New Zealand Orchidaceae. Orchiadian 2005, 15, 22–42. [Google Scholar]
  3. Li, L.; Chung, S.W.; Li, B.; Zeng, S.J.; Yan, H.F.; Li, S.J. New insight into the molecular phylogeny of the genus Liparis s.l. (Orchidaceae: Malaxideae) with a new generic segregate: Blepharoglossum. Plant Syst. Evol. 2020, 306, 54. [Google Scholar] [CrossRef]
  4. Ormerod, P.; Juswara, L. Notes on some Malesian Orchidaceae III. Harv. Pap. Bot. 2021, 26, 197–201. [Google Scholar] [CrossRef]
  5. Olmstead, R.; Palmer, J. Chloroplast DNA systematics: A review of methods and data analysis. Am. J. Bot. 1994, 81, 1205–1224. [Google Scholar] [CrossRef]
  6. Yang, J.B.; Tang, M.; Li, H.T.; Zhang, Z.R.; Li, D.Z. Complete chloroplast genome of the genus Cymbidium: Lights into the species identification, phylogenetic implications and population genetic analyses. BMC Evol. Biol. 2013, 13, 84. [Google Scholar] [CrossRef]
  7. Vieira, L.d.N.; Faoro, H.; Rogalski, M.; Fraga, H.; Cardoso, R.L.A.; Souza, E.M.; Pedrosa, F.O.; Nodari, R.; Guerra, M.P. The complete chloroplast genome sequence of Podocarpus lambertii: Genome structure, evolutionary aspects, gene content and SSR detection. PLoS ONE 2014, 9, e90618. [Google Scholar] [CrossRef]
  8. Daniell, H.; Lin, C.S.; Yu, M.; Chang, W.J. Chloroplast genomes: Diversity, evolution, and applications in genetic engineering. Genome Biol. 2016, 17, 134. [Google Scholar] [CrossRef]
  9. Viljoen, E.; Odeny, D.A.; Coetzee, M.P.A.; Berger, D.K.; Rees, D.J.G. Application of chloroplast phylogenomics to resolve species relationships within the plant genus Amaranthus. J. Mol. Evol. 2018, 86, 216–239. [Google Scholar] [CrossRef]
  10. Liu, D.K.; Tu, X.D.; Zhao, Z.; Zeng, M.Y.; Zhang, S.; Ma, L.; Zhang, G.Q.; Wang, M.M.; Liu, Z.J.; Lan, S.R.; et al. Plastid phylogenomic data yield new and robust insights into the phylogeny of Cleisostoma–Gastrochilus clades (Orchidaceae, Aeridinae). Mol. Phylogenet. Evol. 2020, 145, 106729. [Google Scholar] [CrossRef]
  11. Han, S.Y.; Wang, R.B.; Hong, X.; Wu, C.L.; Zhang, S.J.; Kan, X.Z. Plastomes of Bletilla (Orchidaceae) and phylogenetic implications. Int. J. Mol. Sci. 2022, 23, 10151. [Google Scholar] [CrossRef]
  12. Han, Y.W.; Duan, D.; Ma, X.F.; Jia, Y.; Liu, Z.L.; Zhao, G.F.; Li, Z.H. Efficient identification of the forest tree species in Aceraceae using DNA barcodes. Front. Plant Sci. 2016, 7, 1707. [Google Scholar] [CrossRef] [PubMed]
  13. Song, F.; Li, T.; Burgess, K.S.; Feng, Y.; Ge, X.J. Complete plastome sequencing resolves taxonomic relationships among species of Calligonum L. (Polygonaceae) in China. BMC Plant Biol. 2020, 20, 261. [Google Scholar] [CrossRef] [PubMed]
  14. Chen, Y.X.; Chen, Y.S.; Shi, C.M.; Huang, Z.B.; Zhang, Y.; Li, S.K.; Li, Y.; Ye, J.; Yu, C.; Li, Z.; et al. SOAPnuke: A MapReduce acceleration-supported software for integrated quality control and preprocessing of high-throughput sequencing data. GigaScience 2017, 7, gix120. [Google Scholar] [CrossRef] [PubMed]
  15. Jin, J.J.; Yu, W.B.; Yang, J.B.; Song, Y.; de Pamphilis, C.W.; Yi, T.S.; Li, D.Z. GetOrganelle: A fast and versatile toolkit for accurate de novo assembly of organelle genomes. Genome Biol. 2020, 21, 241. [Google Scholar] [CrossRef]
  16. Qu, X.J.; Moore, M.J.; Li, D.Z.; Yi, T.S. PGA: A software package for rapid, accurate, and flexible batch annotation of plastomes. Plant Methods 2019, 15, 50. [Google Scholar] [CrossRef]
  17. Kearse, M.D.; Moir, R.; Wilson, A.; Stones-Havas, S.; Cheung, M.; Sturrock, S.; Buxton, S.; Cooper, A.; Markowitz, S.; Duran, C.; et al. Geneious Basic: An integrated and extendable desktop software platform for the organization and analysis of sequence data. Bioinformatics 2012, 28, 1647–1649. [Google Scholar] [CrossRef]
  18. Greiner, S.; Lehwark, P.; Bock, R. OrganellarGenomeDRAW (OGDRAW) version 1.3.1: Expanded toolkit for the graphical visualization of organellar genomes. Nucleic Acids Res. 2019, 47, W59–W64. [Google Scholar] [CrossRef]
  19. Amiryousefi, A.; Hyvönen, J.; Poczai, P. IRscope: An online program to visualize the junction sites of chloroplast genomes. Bioinformatics 2018, 34, 3030–3031. [Google Scholar] [CrossRef]
  20. Frazer, K.A.; Pachter, L.; Poliakov, A.; Rubin, E.M.; Dubchak, I. VISTA: Computational tools for comparative genomics. Nucleic Acids Res. 2004, 32, W273–W279. [Google Scholar] [CrossRef]
  21. van den Berg, C.; Goldman, D.H.; Freudenstein, J.V.; Pridgeon, A.M.; Cameron, K.M.; Chase, M.W. An overview of the phylogenetic relationships within Epidendroideae inferred from multiple DNA regions and recircumscription of Epidendreae and Arethuseae (Orchidaceae). Am. J. Bot. 2005, 92, 613–624. [Google Scholar] [CrossRef]
  22. Nguyen, L.T.; Schmidt, H.A.; von Haeseler, A.; Minh, B.Q. IQ-TREE: A fast and effective stochastic algorithm for estimating maximum likelihood phylogenies. Mol. Biol. Evol. 2015, 32, 268–274. [Google Scholar] [CrossRef] [PubMed]
  23. Guindon, S.; Dufayard, J.F.; Lefort, V.; Anisimova, M.; Hordijk, W.; Gascuel, O. New algorithms and methods to estimate maximum-likelihood phylogenies: Assessing the performance of PhyML 3. 0. Syst. Biol. 2010, 59, 307–321. [Google Scholar] [CrossRef] [PubMed]
  24. Minh, B.Q.; Nguyen, M.A.; von Haeseler, A. Ultrafast approximation for phylogenetic bootstrap. Mol. Biol. Evol. 2013, 30, 1188–1195. [Google Scholar] [CrossRef] [PubMed]
  25. Kim, H.T.; Kim, J.S.; Moore, M.J.; Neubig, K.M.; Williams, N.H.; Whitten, W.M.; Kim, J.H. Seven new complete plastome sequences reveal rampant independent loss of the ndh gene family across Orchids and associated instability of the inverted repeat/small single-copy region boundaries. PLoS ONE 2015, 10, e0142215. [Google Scholar] [CrossRef]
  26. Niu, Z.T.; Xue, Q.Y.; Zhu, S.Y.; Sun, J.; Liu, W.; Ding, X.Y. The complete plastome sequences of four Orchid species: Insights into the evolution of the Orchidaceae and the utility of plastomic mutational hotspots. Front. Plant Sci. 2017, 8, 715. [Google Scholar] [CrossRef] [PubMed]
  27. Nanjala, C.; Wanga, V.O.; Odago, W.; Mutinda, E.S.; Waswa, E.N.; Oulo, M.A.; Mkala, E.M.; Kuja, J.; Yang, J.X.; Dong, X.; et al. Plastome structure of 8 Calanthe s.l. species (Orchidaceae): Comparative genomics, phylogenetic analysis. BMC Plant Biol. 2022, 22, 387. [Google Scholar] [CrossRef]
  28. Asaf, S.; Khan, A.L.; Khan, M.A.; Waqas, M.; Kang, S.M.; Yun, B.W.; Lee, I.J. Chloroplast genomes of Arabidopsis halleri ssp. gemmifera and Arabidopsis lyrata ssp. petraea: Structures and comparative analysis. Sci. Rep. 2017, 7, 7556. [Google Scholar] [CrossRef]
  29. Albalat, R.; Cañestro, C. Evolution by gene loss. Nat. Rev. Genet. 2016, 17, 379–391. [Google Scholar] [CrossRef]
  30. Han, C.; Ding, R.; Zong, X.; Zhang, L.; Chen, X.; Qu, B. Structural characterization of Platanthera ussuriensis chloroplast genome and comparative analyses with other species of Orchidaceae. BMC Genom. 2022, 23, 84. [Google Scholar] [CrossRef]
  31. Cameron, K.M. Leave it to the leaves: A molecular phylogenetic study of malaxideae (Epidendroideae, Orchidaceae). AM. J. Bot. 2005, 92, 1025–1032. [Google Scholar] [CrossRef]
  32. Tang, G.D.; Zhang, G.Q.; Hong, W.J.; Liu, Z.J.; Zhuang, X.Y. Phylogenetic analysis of Malaxideae (Orchidaceae: Epidendroideae): Two new species based on the combined nrDNA ITS and chloroplast matK sequences. Guihaia 2015, 35, 447–463. [Google Scholar]
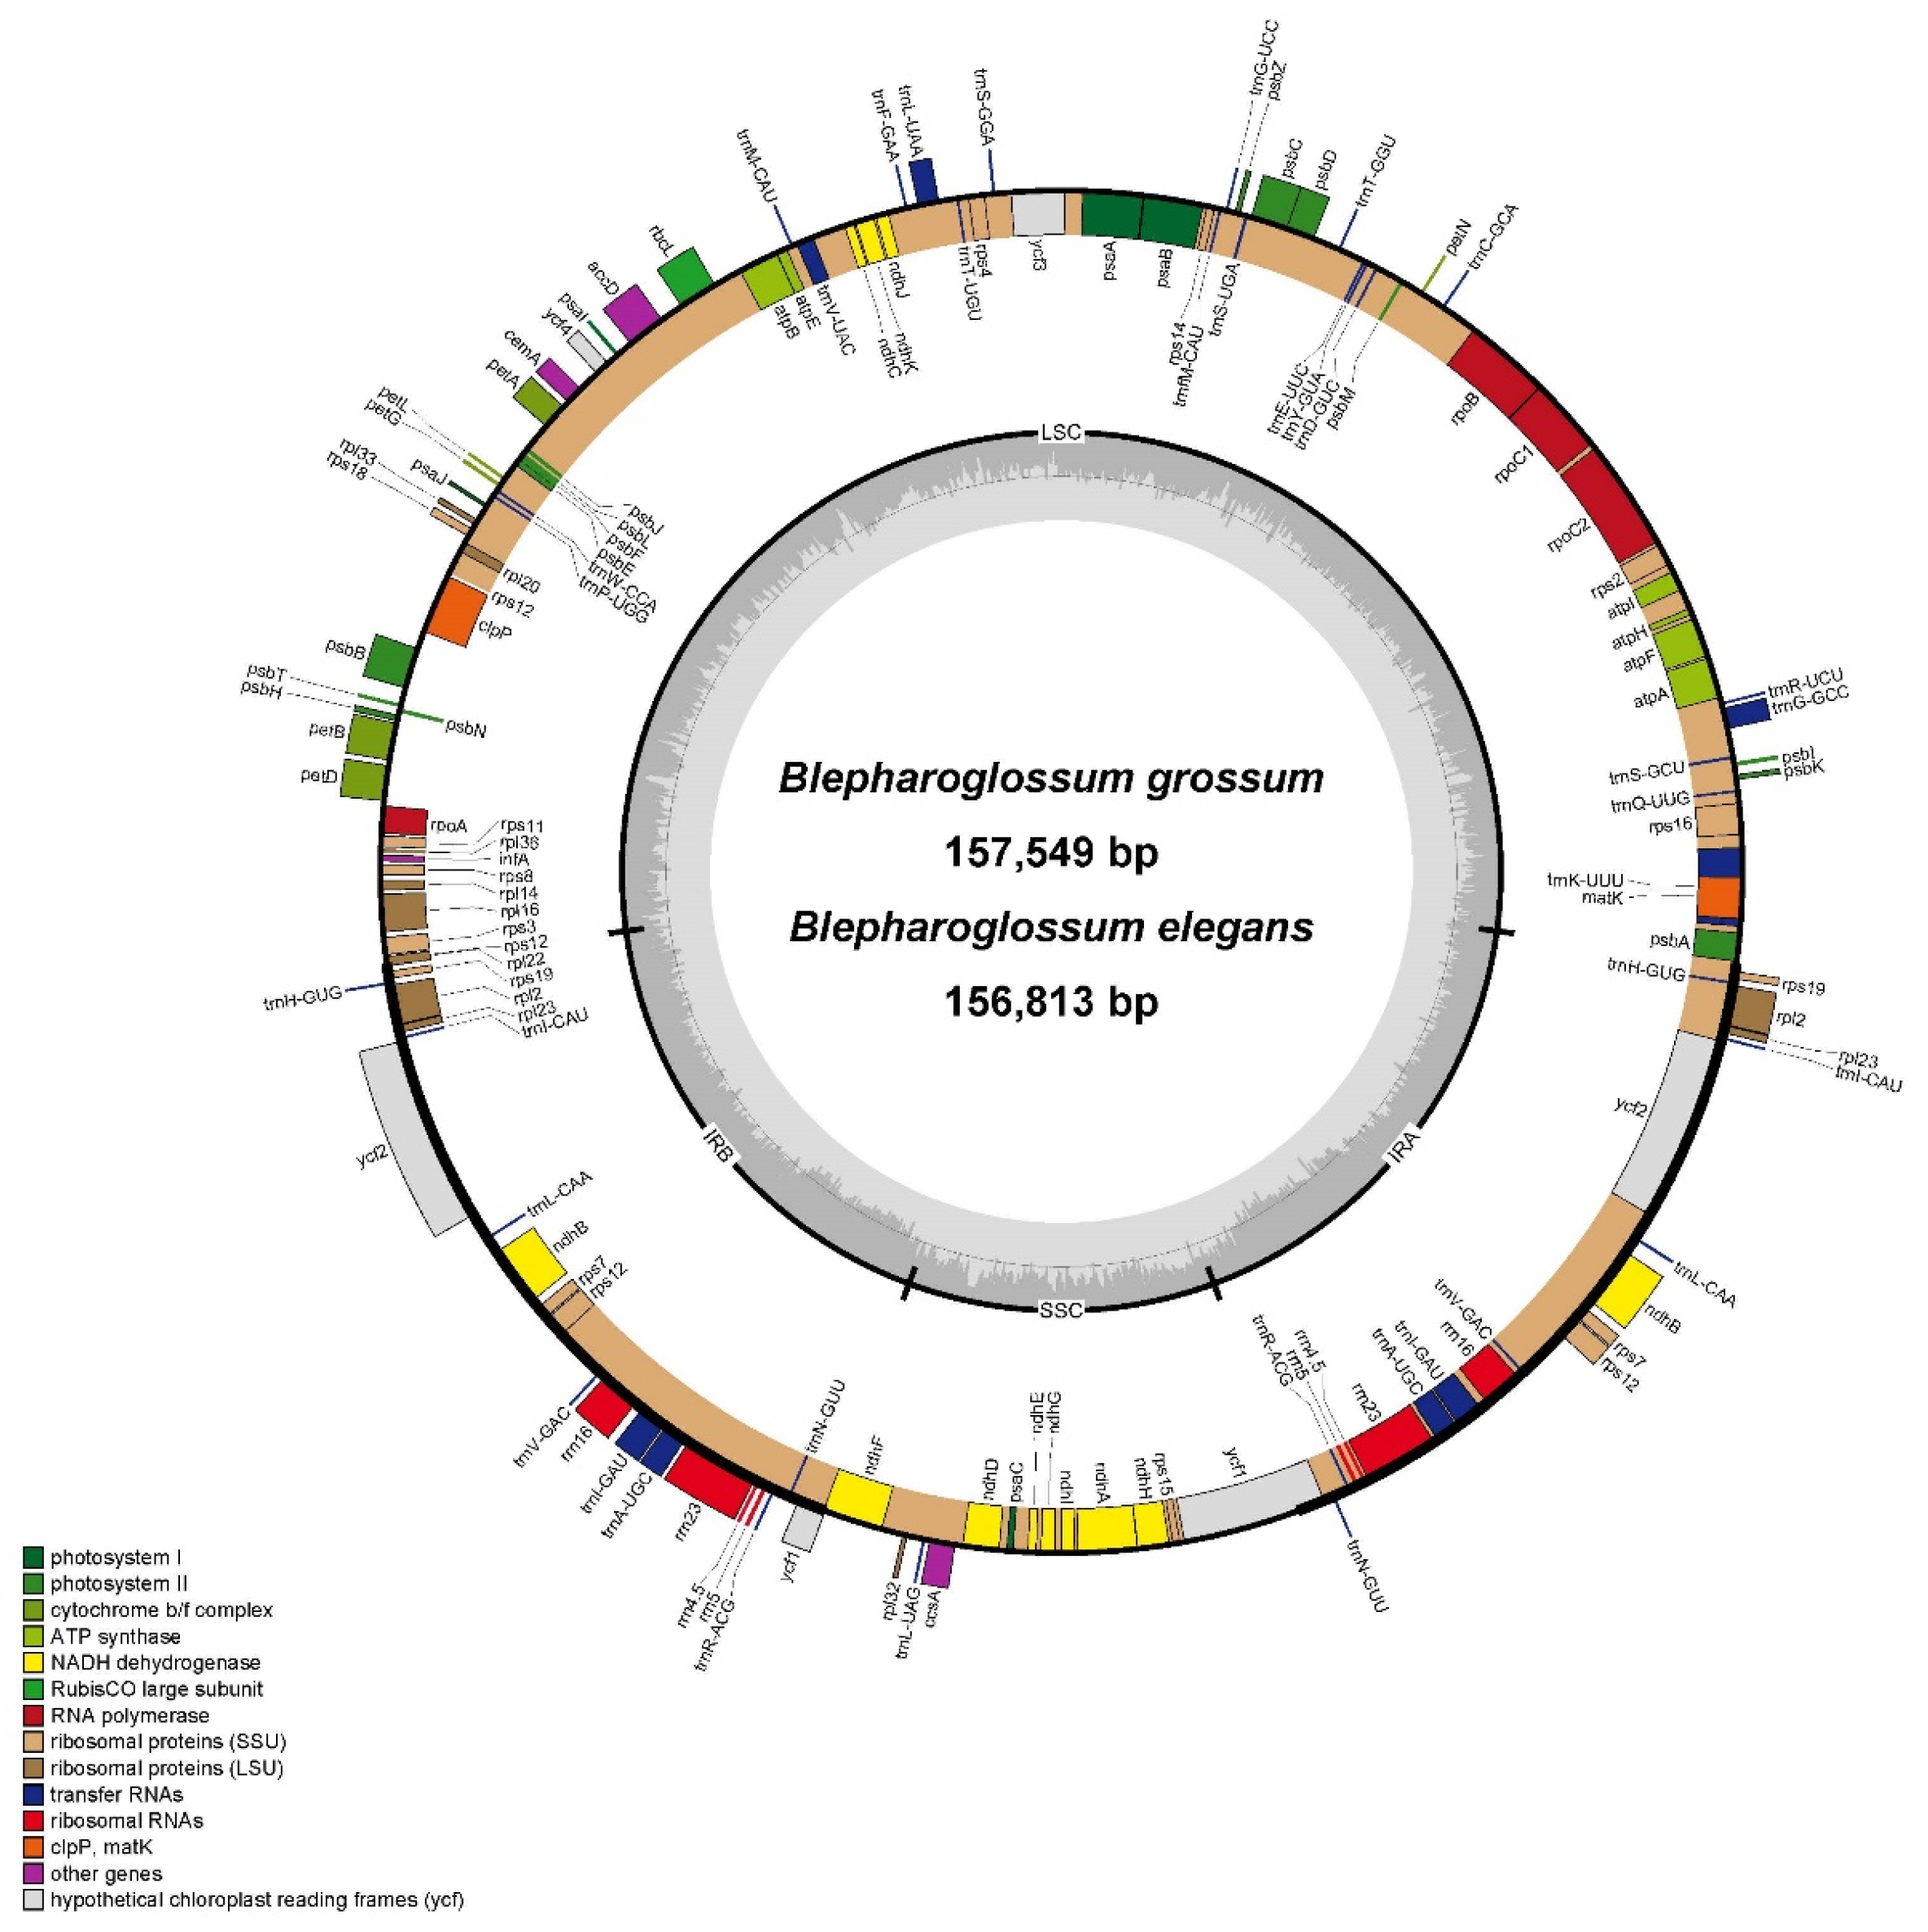
Figure 1. Gene map of chloroplast genomes from B. elegans and B. grossum. The genes transcribed in the clockwise direction are depicted inside the circle, while those transcribed in the counterclockwise direction are shown outside. Functional groups of genes are distinguished by different colors. The darker gray color in the inner circle represents the GC content, while the lighter gray color corresponds to the AT content.
Genes 14 01069 g001
Figure 2. SNPs and indels statistics between B. grossum and B. elegans. (A) SNPs number in various protein-coding genes. (B) Insertion, deletion, and total indel statistics in various protein-coding genes. (C) Location of SNPs. (D) Location of Indels.
Genes 14 01069 g002
Figure 3. Comparison of border positions of LSC, SSC, and IRs regions among the six cp genomes. The diagram depicts genes as boxes, with the distance between the genes and the boundaries indicated by the number of bases, unless the gene coincides with the boundary. Gene extensions are displayed above the boxes. JLB, JSB, JSA, and JLA correspond to boundaries of LSC/IRb, SSC/IRb, SSC/IRa, and LSC/IRa, respectively.
Genes 14 01069 g003
Figure 4. Global alignment of chloroplast genomes of the six species by mVISTA using O. seidenfadenii as the reference. Genome regions are color coded. Blue and red areas indicate untranslated regions (UTR) and the conserved non-coding sequences (CNS) regions, respectively.
Genes 14 01069 g004
Figure 5. The maximum likelihood (ML) phylogenetic tree constructed based on complete cp genome sequences, showing the phylogenetic relationships of Blepharoglossum and its related genera in Malaxidinae. Red color indicates taxa of Blepharoglossum. Branch support values are shown in order SH-aLRT/UFboot.
Genes 14 01069 g005
Table 1. Summary of the chloroplast genome characteristics of six Malaxidinae species.
Species B. elegansB. grossumL. bootanensisL. viridifloraS. gibbosaO. seidenfadenii
GenBank IDdataOP859143OP859144MN627759MW691170OM759993MN414241
Length (bp)Total156,813157,549158,325158,258158,056143,062
LSC84,98485,58886,58486,66886,28084,282
SSC17,73117,76517,77517,80617,76410,224
IR27,04927,09826,98326,89227,00624,278
Gene numberTotal133133133133133120
CDS878783838674
tRNA383838383838
rRNA888888
GC content (%)Total36.836.836.936.836.937.1
LSC34.334.434.534.334.434.4
SSC29.629.830.029.829.727.9
IR43.043.143.143.143.143.7
Table 2. Gene groups with different functions in the chloroplast genomes of B. elegans and B. grossum.
Gene GroupGene Name
photosystem IpsaA, psaB, psaC, psaI, psaJ
photosystem IIpsbA, psbB, psbC, psbD, psbE, psbF, psbH, psbI, psbJ, psbK, psbL, psbM, psbN, psbT, psbZ
NADH dehydrogenasendhA*, ndhB*(2), ndhC, ndhD, ndhE, ndhF, ndhG, ndhH, ndhI, ndhJ, ndhK
Cytochrome b/fpetA, petB*, petD*, petG, petL, petN
ATP synthaseatpA, atpB, atpE, atpF*, atpH, atpI
rubiscorbcL
Proteins of large ribosomal subunitrpl14, rpl16*, rpl2*(2), rpl20, rpl22, rpl23(2), rpl32, rpl33, rpl36
Proteins of small ribosomal subunitrps11, rps12**(2), rps14, rps15, rps16*, rps18, rps19(2), rps2, rps3, rps4, rps7(2), rps8
RNA polymeraserpoA, rpoB, rpoC1*, rpoC2
Ribosomal RNAsrrn16(2), rrn23(2), rrn4.5(2), rrn5(2)
Transfer RNAstrnA-UGC*(2), trnC-GCA, trnD-GUC, trnE-UUC, trnF-GAA, trnG-GCC*, trnG-UCC*, trnH-GUG(2), trnI-CAU(2), trnI-GAU*(2), trnK-UUU*, trnL-CAA(2), trnL-UAA*, trnL-UAG, trnM-CAU, trnN-GUU(2), trnP-UGG, trnQ-UUG, trnR-ACG(2), trnR-UCU, trnS-GCU, trnS-GGA, trnS-UGA, trnT-GGU, trnT-UGU, trnV-GAC(2), trnV-UAC*, trnW-CCA, trnY-GUA, trnfM-CAU
MaturasematK
ProteaseclpP**
Envelope membrane proteincemA
Acetyl-CoA carboxylaseaccD
c-type cytochrome synthesis geneccsA
Translation initiation factorinfA
Conserved hypothetical chloroplast ORFycf1(2), ycf2(2), ycf3**, ycf4
Note: Gene*: Gene with one intron; gene**: gene with two introns; gene(2): number of copies of multi-copy genes.
Table 3. Distribution of SNPs and indels in different genic regions.
SNPsIndels
InsertionsDeletions
CDS321212290
IGS3647521410
Total6849641700
Disclaimer/Publisher’s Note: The statements, opinions and data contained in all publications are solely those of the individual author(s) and contributor(s) and not of MDPI and/or the editor(s). MDPI and/or the editor(s) disclaim responsibility for any injury to people or property resulting from any ideas, methods, instructions or products referred to in the content.