Article

The Dynamics of Gene Expression Unraveling the Immune Response of Macrobrachium rosenbergii Infected by Aeromonas veronii

1
Key Laboratory of Aquatic Animal Genetic Breeding and Nutrition, Chinese Academy of Fishery Sciences, Huzhou University, Huzhou 313000, China
2
Zhejiang Provincial Key Laboratory of Aquatic Resources Conservation and Development, Huzhou University, Huzhou 313000, China
3
Jiangsu Shufeng Prawn Breeding Co., Ltd., Gaoyou 225654, China
*
Authors to whom correspondence should be addressed.
Genes 2023, 14(7), 1383; https://doi.org/10.3390/genes14071383
Submission received: 28 April 2023 / Revised: 24 June 2023 / Accepted: 26 June 2023 / Published: 30 June 2023
(This article belongs to the Special Issue Genetics and Genomics Applied to Aquatic Animal Science)

Abstract

:
To further investigate the immune response of Macrobrachium rosenbergii against Aeromonas veronii, comparative transcriptomic analyses of the M. rosenbergii hepatopancreas were conducted on challenge and control groups at 6, 12, and 24 h post-infection (hpi), independently. A total of 51,707 high-quality unigenes were collected from the RNA-seq data, and 8060 differentially expressed genes (DEGs) were discovered through paired comparisons. Among the three comparison groups, a KEGG pathway enrichment analysis showed that 173 immune-related DEGs were considerably clustered into 28 immune-related pathways, including the lysosome, the phagosome, etc. Moreover, the expression levels of the four key immune-related genes (TOLL, PAK1, GSK3β, and IKKα) were evaluated at various stages following post-infection in the hepatopancreas, hemolymph, and gills. Both PAK1 and GSK3β genes were highly up-regulated in all three tissues at 6 hpi with A. veronii; TOLL was up-regulated in the hepatopancreas and hemolymph but down-regulated in the gill at 6 hpi, and IKKα was up-regulated in hemolymph and gill, but down-regulated in the hepatopancreas at 6 hpi. These findings lay the groundwork for understanding the immune mechanism of M. rosenbergii after contracting A. veronii.

1. Introduction

The production of M. rosenbergii has reached an impressive 290,708 tons globally in 2021 [1]. China is a prominent producer, having produced a total of 171,263 tons in 2021 as reported by the “China Fisheries Yearbook,” with Guangdong, Jiangsu, and Zhejiang provinces contributing over 92% of the national total. However, the diversity and complexity of diseases affecting M. rosenbergii have resulted in substantial losses for farmers in recent years. These pathogenic microorganisms that invade M. rosenbergii include M. rosenbergii nodavirus (MrNV) and extra-small virus (XSV) [2], infectious precocity virus (IPV) [3], decapod iridescent virus 1 (DIV1) [4], Citrobacter freundii [5], etc.
A. veronii is a conditioned pathogen, widely distributed in fresh water, seawater, and soil [6], and was classified in the genus Aeromonas in 1978 [7]. As a Gram-negative bacterium, it has caused the mortality of various aquatic animals, such as Nile tilapia (Oreochromis niloticus) [8], yellow catfish (Pelteobagrus fulvidraco) [9], Odontobutis potamophila [10], etc. Our previous research discovered a dominant strain named WSQ-1, which has caused the mass mortality of adult M. rosenbergii in certain farms in Gaoyou city of Jiangsu Province. This strain was isolated from the hepatopancreas of dying M. rosenbergii and identified as A. veronii. The challenge test, amplification of virulence genes, and histopathological examination of the hepatopancreas all demonstrated that the strain was extremely pathogenic [11].
As an invertebrate, M. rosenbergii mainly relies on innate immunity to recognize and resist invading pathogens [12]. Among these tissues, the hepatopancreas is closely related to nutrient metabolism regulation [13], and the hemolymph plays a crucial role in the host immune response, including the recognition and phagocytosis of pathogenic bacteria [14,15]. The gills are more prone to damage and physiological responses compared to other organs as they participate in the absorption of pathogens into the hemolymph to eliminate them [16,17].
In previous experiments, we explored the virulence and pathogenicity of A. veronii [11]. In this study, we further investigated the immune response of M. rosenbergii against A. veronii. We conducted a comparative transcriptomic analysis on the hepatopancreas of M. rosenbergii infected with A. veronii at different time points (6, 12, and 24 post-injection). Additionally, four immune-related genes were identified from the transcriptomic data, and their expression levels were analyzed in the hepatopancreas, hemolymph, and gills at different post-infection time points. These findings may provide insights into the host response to A. veronii infection and can be used as a guide for A. veronii prevention and treatment.

2. Materials and Methods

2.1. Experimental Prawns and A. veronii Preparation

The healthy prawns, which had an average body weight of 3.11 ± 0.49 g, were used in the challenge experiment. Before being subjected to experimental manipulation, all prawns were acclimatized for one week in the recirculating water barrel system of Yuya Technology (Huzhou) Co. LTD (Zhejiang, China). Since the suitable growth temperature range for M. rosenbergii is 24–32 °C, the water temperature was maintained at 28 ± 2 °C during the challenge experiment. The dissolved oxygen concentration was above 5 mg/L and the prawns were fed twice daily but were not fed during the injection trial. Then, 180 prawns were split into two groups (n = 90) (the challenge groups and the control groups) at random, and each group was further separated into three parallel groups so that there were 30 prawns in each 60-L plastic container. Random inspections of the prawns by plate culture test were conducted before the injection trial to ensure that they were free of any bacterial infections.
In accordance with previous tests’ median lethal dosage (LD50) of 72 h, the strain WSQ-1 (A. veronii) was first inoculated in the tryptic soybean peptone liquid medium (TSB), then placed in a 28 °C shaker with shaking at 180 rpm for 18 h. Lastly, the turbidity was adjusted to 2.50 × 10⁶ CFU/mL.

2.2. Sample Collection

In the experiment, the challenge groups received an intramuscular injection of 50 μL of A. veronii, whereas the control groups were injected with sterilized PBS in the same amount. After 6, 12, and 24 hpi, prawns from the two groups were randomly selected, and the hepatopancreas and gills were temporarily stored in liquid nitrogen and then transferred to the ultra-low temperature (−80 °C) refrigerator. Every three of the same tissues were mixed into one sample at different time points, with three biological replicates. Significantly, the treatment of the hemocytes was particularly important. Briefly, the fresh hemolymp and TRIzol were first added to the cryotube in a 1:3 ratio to lyse the blood cells, and the mixture was then shocked for 1–2 min until the floccule was completely cracked. Finally, the mixture was incubated at room temperature for 5 min to completely decompose the ribosome and then stored at −80 °C.

2.3. Total RNA Extraction and Illumina Sequencing

The TRIzol reagent (Dalian, China) was used to extract the total RNA from 18 hepatopancreas samples at 6, 12, and 24 hpi in accordance with the manufacturer’s instructions. The challenge groups were named AV6_1, AV6_2, AV6_3, AV12_1, AV12_2, AV12_3, AV24_1, AV24_2, AV24_3, whereas the control groups were marked as C6_1, C6_2, C6_3, C12_1, C12_2, C12_3, C24_1, C24_2, C24_3, separately. These libraries were obtained after the whole RNA was first screened and purified using the AMPure XP technology (Beckman Coulter, Beverly, CA, USA). Following these libraries’ initial Qubit 2.0 quantification, they were diluted to 1.5 ng/uL and identified using an Agilent 2100 bioanalyzer. These libraries’ quality was further ensured by using qRT-PCR to precisely measure their effective concentration. The libraries’ construction and sequencing were completed using the Illumina NovaSeq 6000.

2.4. De Novo Assembly, Annotation, and Classification

To ensure the accuracy and dependability of data analysis, some raw data, such as reads with adapters, low-quality, and N bases were filtered away to obtain clean reads. Next, GC content and Q30 were computed with clean data by fastp (version 0.19.7). Trinity was used to assemble the transcripts [18], and BUSCO software was used to evaluate the correctness and completeness of the transcripts [19]. Finally, all of the transcripts were classified and annotated using the following 7 databases: Nr, Nt, Pfam, COG, Swiss-Prot, KO, and GO.

2.5. DEGs, KEGG, and GO Enrichment Analysis

The DESeq2 package (version 1.20.1) [20] was used in this research to screen DEGs for significantly differential gene expression. In addition, we set three comparisons between challenge and control groups after 6, 12, and 24 hpi (i.e., AV6 vs. C6, AV12 vs. C12, and AV24 vs. C24); next, the immune-related DEGs were collected and analyzed for GO and KEGG enrichment using GOseq and KOBAS software packages, separately [21].

2.6. Validation of Immune-Related DEGs by RT-qPCR

Ten immune-related DEGs were chosen at random for quantitative real-time PCR (qRT-PCR) analysis in order to verify the credibility of the transcriptome sequencing data. Primer 5.0 software was used to design the primers (Table 1), which were then synthesized by the company. The cDNA of the hepatopancreas (AV6 vs. C6) used for qRT-PCR was synthesized by reverse transcription using cDNA Synthesis Supermix (TransGen Biotech, Beijing, China), while the 18S rRNA was used as the reference gene for the qRT-PCR. In addition, amplifications were performed in a 10 µL reaction system with 0.8 µL of cDNA, 3.4 µL of ddH2O, 5 µL of TB Green Premix Ex Taq II (2×), and 0.4 µL each PCR forward primer and reverse primer. The PCR procedure was pre-denaturation at 95 °C for 3 min, followed by 39 cycles of denaturation at 95 °C for 5 s and annealing at 59 °C for 30 s. When the temperature rose from 65 °C to 95 °C, the melting curve increased by 0.5 °C every 5 s. Each qRT-PCR assay was carried out in three biological replicates and three technique replicates. Ultimately, the 2−ΔΔCT method was used to evaluate relative mRNA expression.

2.7. Expression Patterns of Four Key Immune-Related DEGs in Different Tissues

Based on KEGG enrichment pathway analysis results, protein Toll gene (TOLL) was enriched in “Toll and Imd signaling pathway”; p21-activated kinase 1 (PAK1) was enriched in three immune-related pathways, such as “Chemokine signaling pathway”, etc.; glycogen synthase kinase 3 β (GSK3β) was enriched in six immune-related pathways, such as “mTOR signaling pathway”, etc.; and inhibitor of nuclear factor kappa-B kinase subunit α (IKKα) was enriched in 12 immune-related pathways, such as ”NOD-like receptor signaling pathway”, etc. (Table 2). In addition, TOLL, PAK1, GSK3β were up-regulated and IKKα was down-regulated at 6 hpi.
To further analyze the relative mRNA expression in different tissues and time points, these four immune-related DEGs were selected and anticipated to be engaged in the immunological response of the tissues. The collected samples at 6, 12, and 24 hpi were used to extract RNA and synthesize cDNA based on the previous methods, and all qRT-PCR reactions were performed in triplicate (three biological replicates and three technique replicates). Lastly, the 2−ΔΔCT approach was used to calculate the relative mRNA expression.

2.8. Statistical Analysis

SPSS 25.0 software (IBM Corp., Armonk, NY, USA) was used to detect statistical significance for differences in gene expression levels between the challenge and control groups at three time points after infection in three tissues including hemolymph, hepatopancreas, and gills. Then, a chart was created with GraphPad Prism 9.0 software (GraphPad Software Inc., San Diego, CA, USA).

3. Results

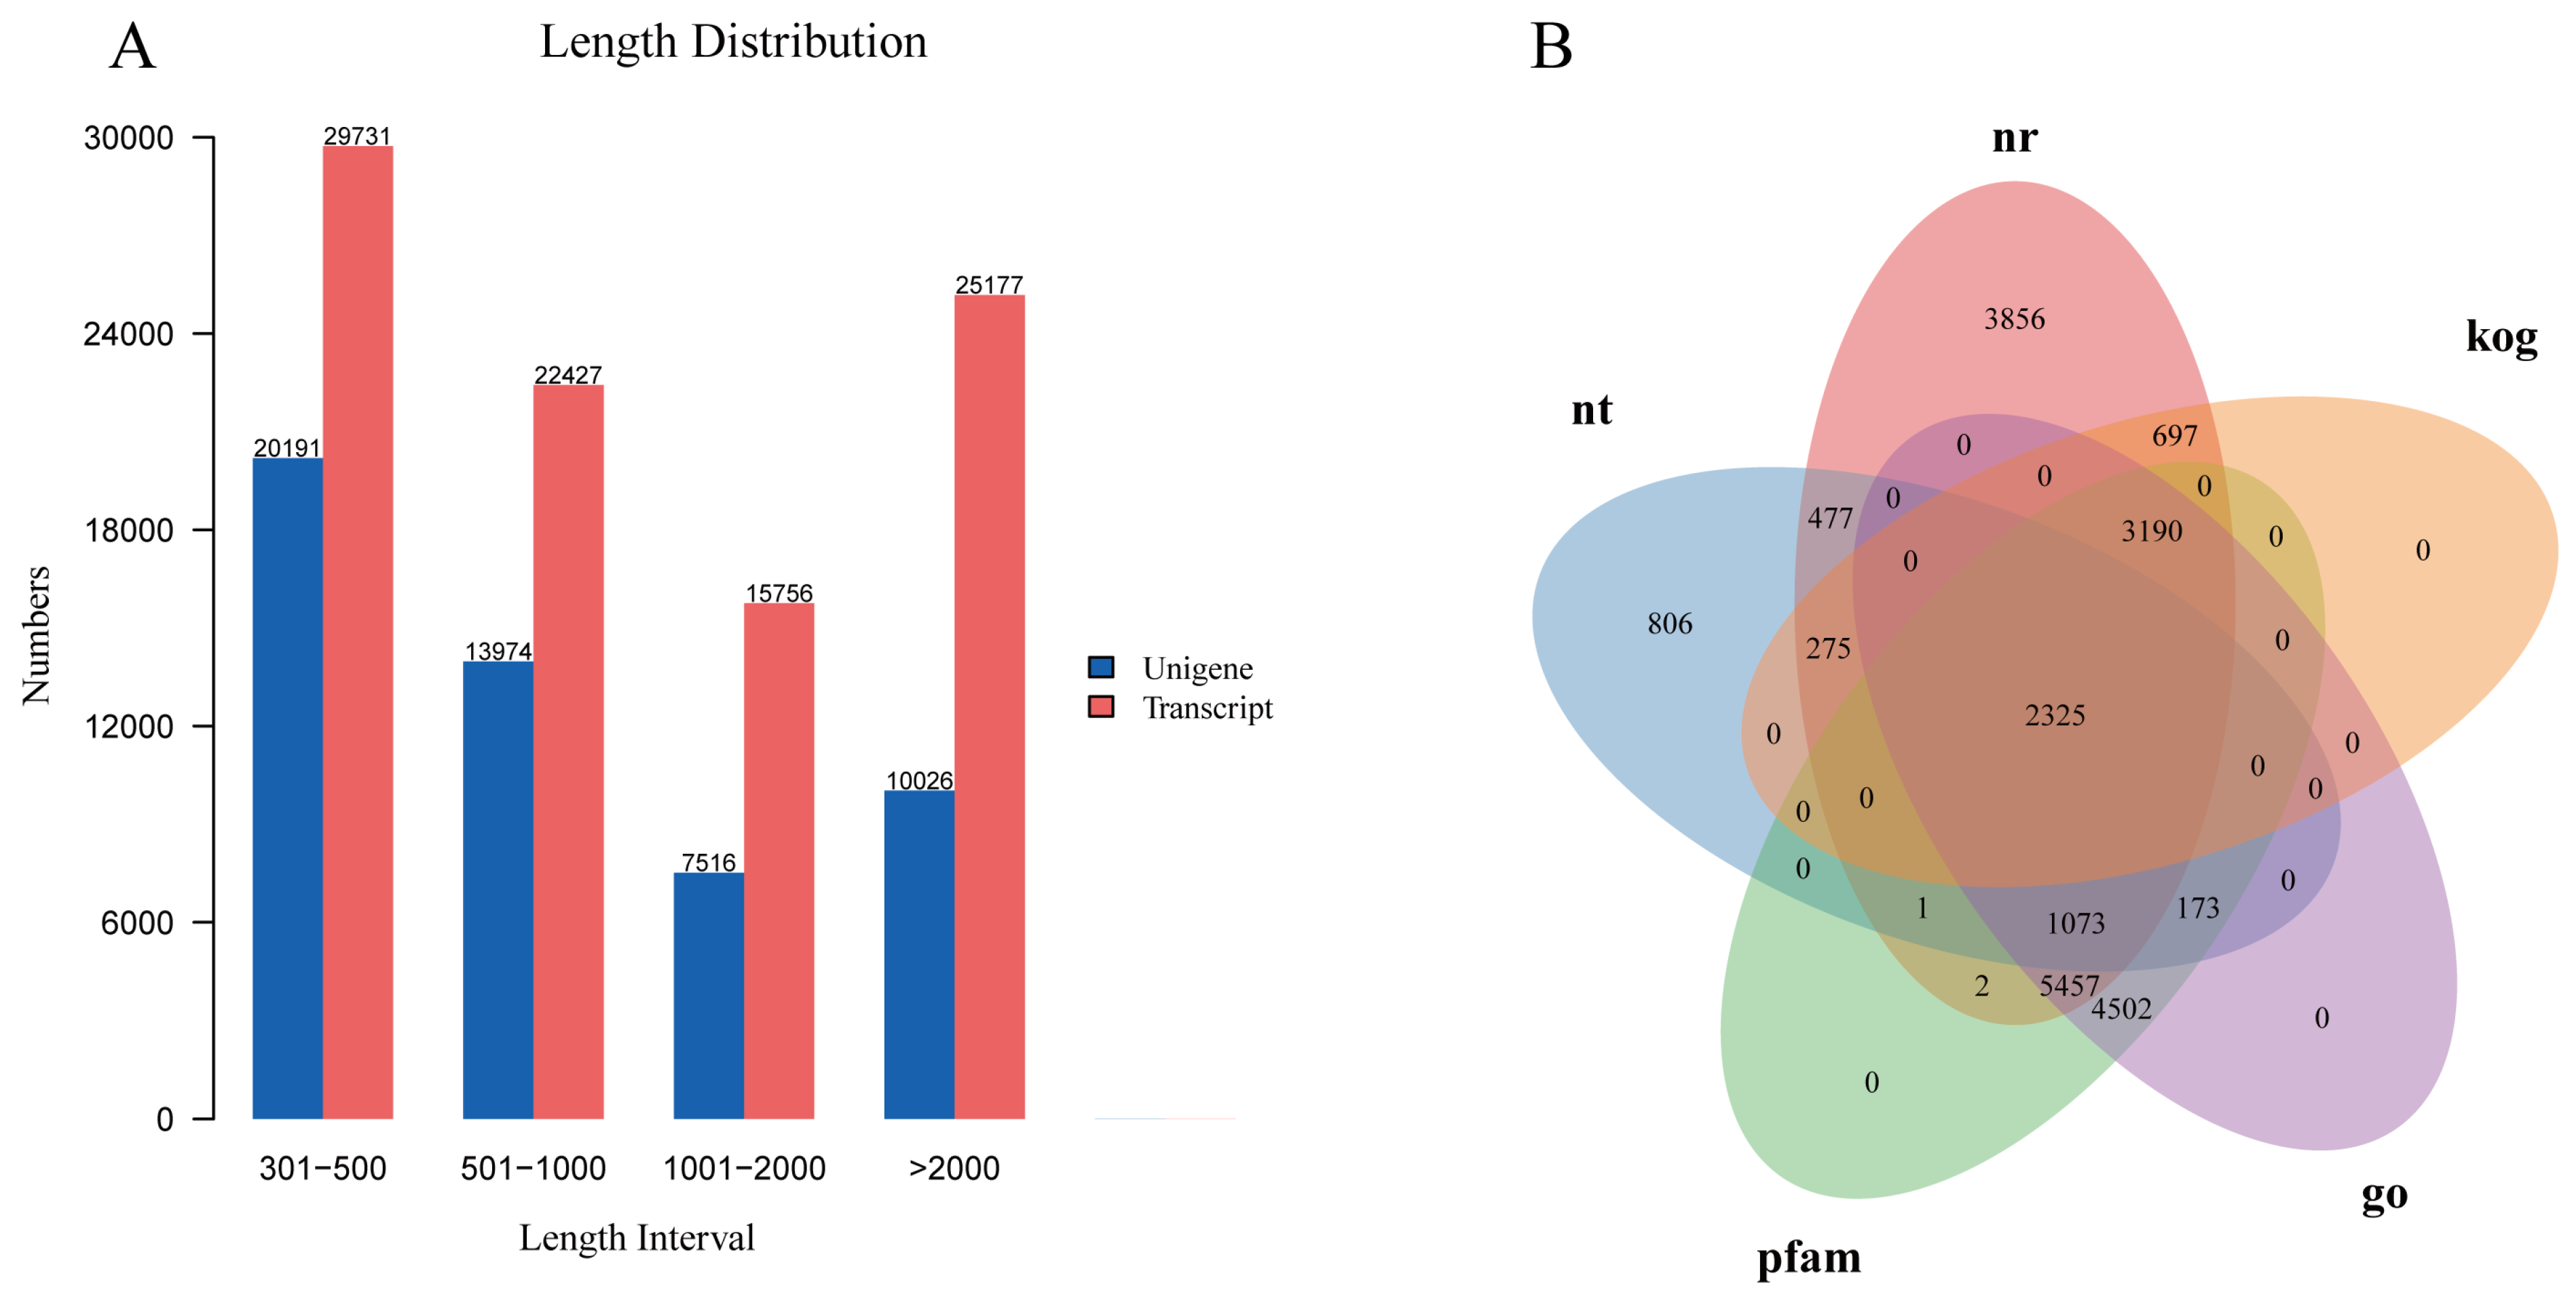
3.1. Transcript Assembly, Gene Functional Annotation, GO, and KEGG Classification

There were a total of 22,248,733–24,166,064 raw reads in 18 libraries, and 21,489,762–23,722,890 clean reads were obtained after quality control (Table S1). The Q30 percentages’ average values were 93.35%. Using the Trinity software, 93,091 transcripts were produced, with an average length of 1716 bp. Finally, 51,707 unigenes were obtained, with sizes ranging from 301 bp to 28,851 bp and the N50 length of 2808 bp (Figure 1A).
Seven public databases were used to annotate the functions of all unigenes: 17,353 (33.56%) in NR, 5130 (9.92%) in NT, 7354 (14.22%) in KEGG, 12,481 (24.13%) in Swiss-Prot, 16,723 (32.34%) in Pfam, 16,720 (32.33%) in GO, and 6487 (12.54%) in KOG, respectively (Table S2). In addition, 2325 genes were coexisting functional genes annotated in the 5 databases, as demonstrated in the Venn diagram of Nr, Nt, Pfam, GO, and KOG annotations in Figure 1B.
KEGG is used to comprehend the sophisticated functions of biological systems. In this study, 861 unigenes were associated with “signal transduction”, 618 unigenes with “transport and catabolism”, and 366 unigenes with the “immune system” (Figure S1A). Meanwhile, GO analysis is also important. 16,720 unigenes were classified as molecular function, cellular component, and biological process, with 12, 5, and 25 subcategories, respectively. Among the biological processes, 45 unigenes were associated with “antioxidant activity” (GO:0016209), 173 unigenes with “immune system process” (GO:0002376), and 2526 unigenes were associated with “response to stimulus” (GO:0050896), respectively (Figure S1B).

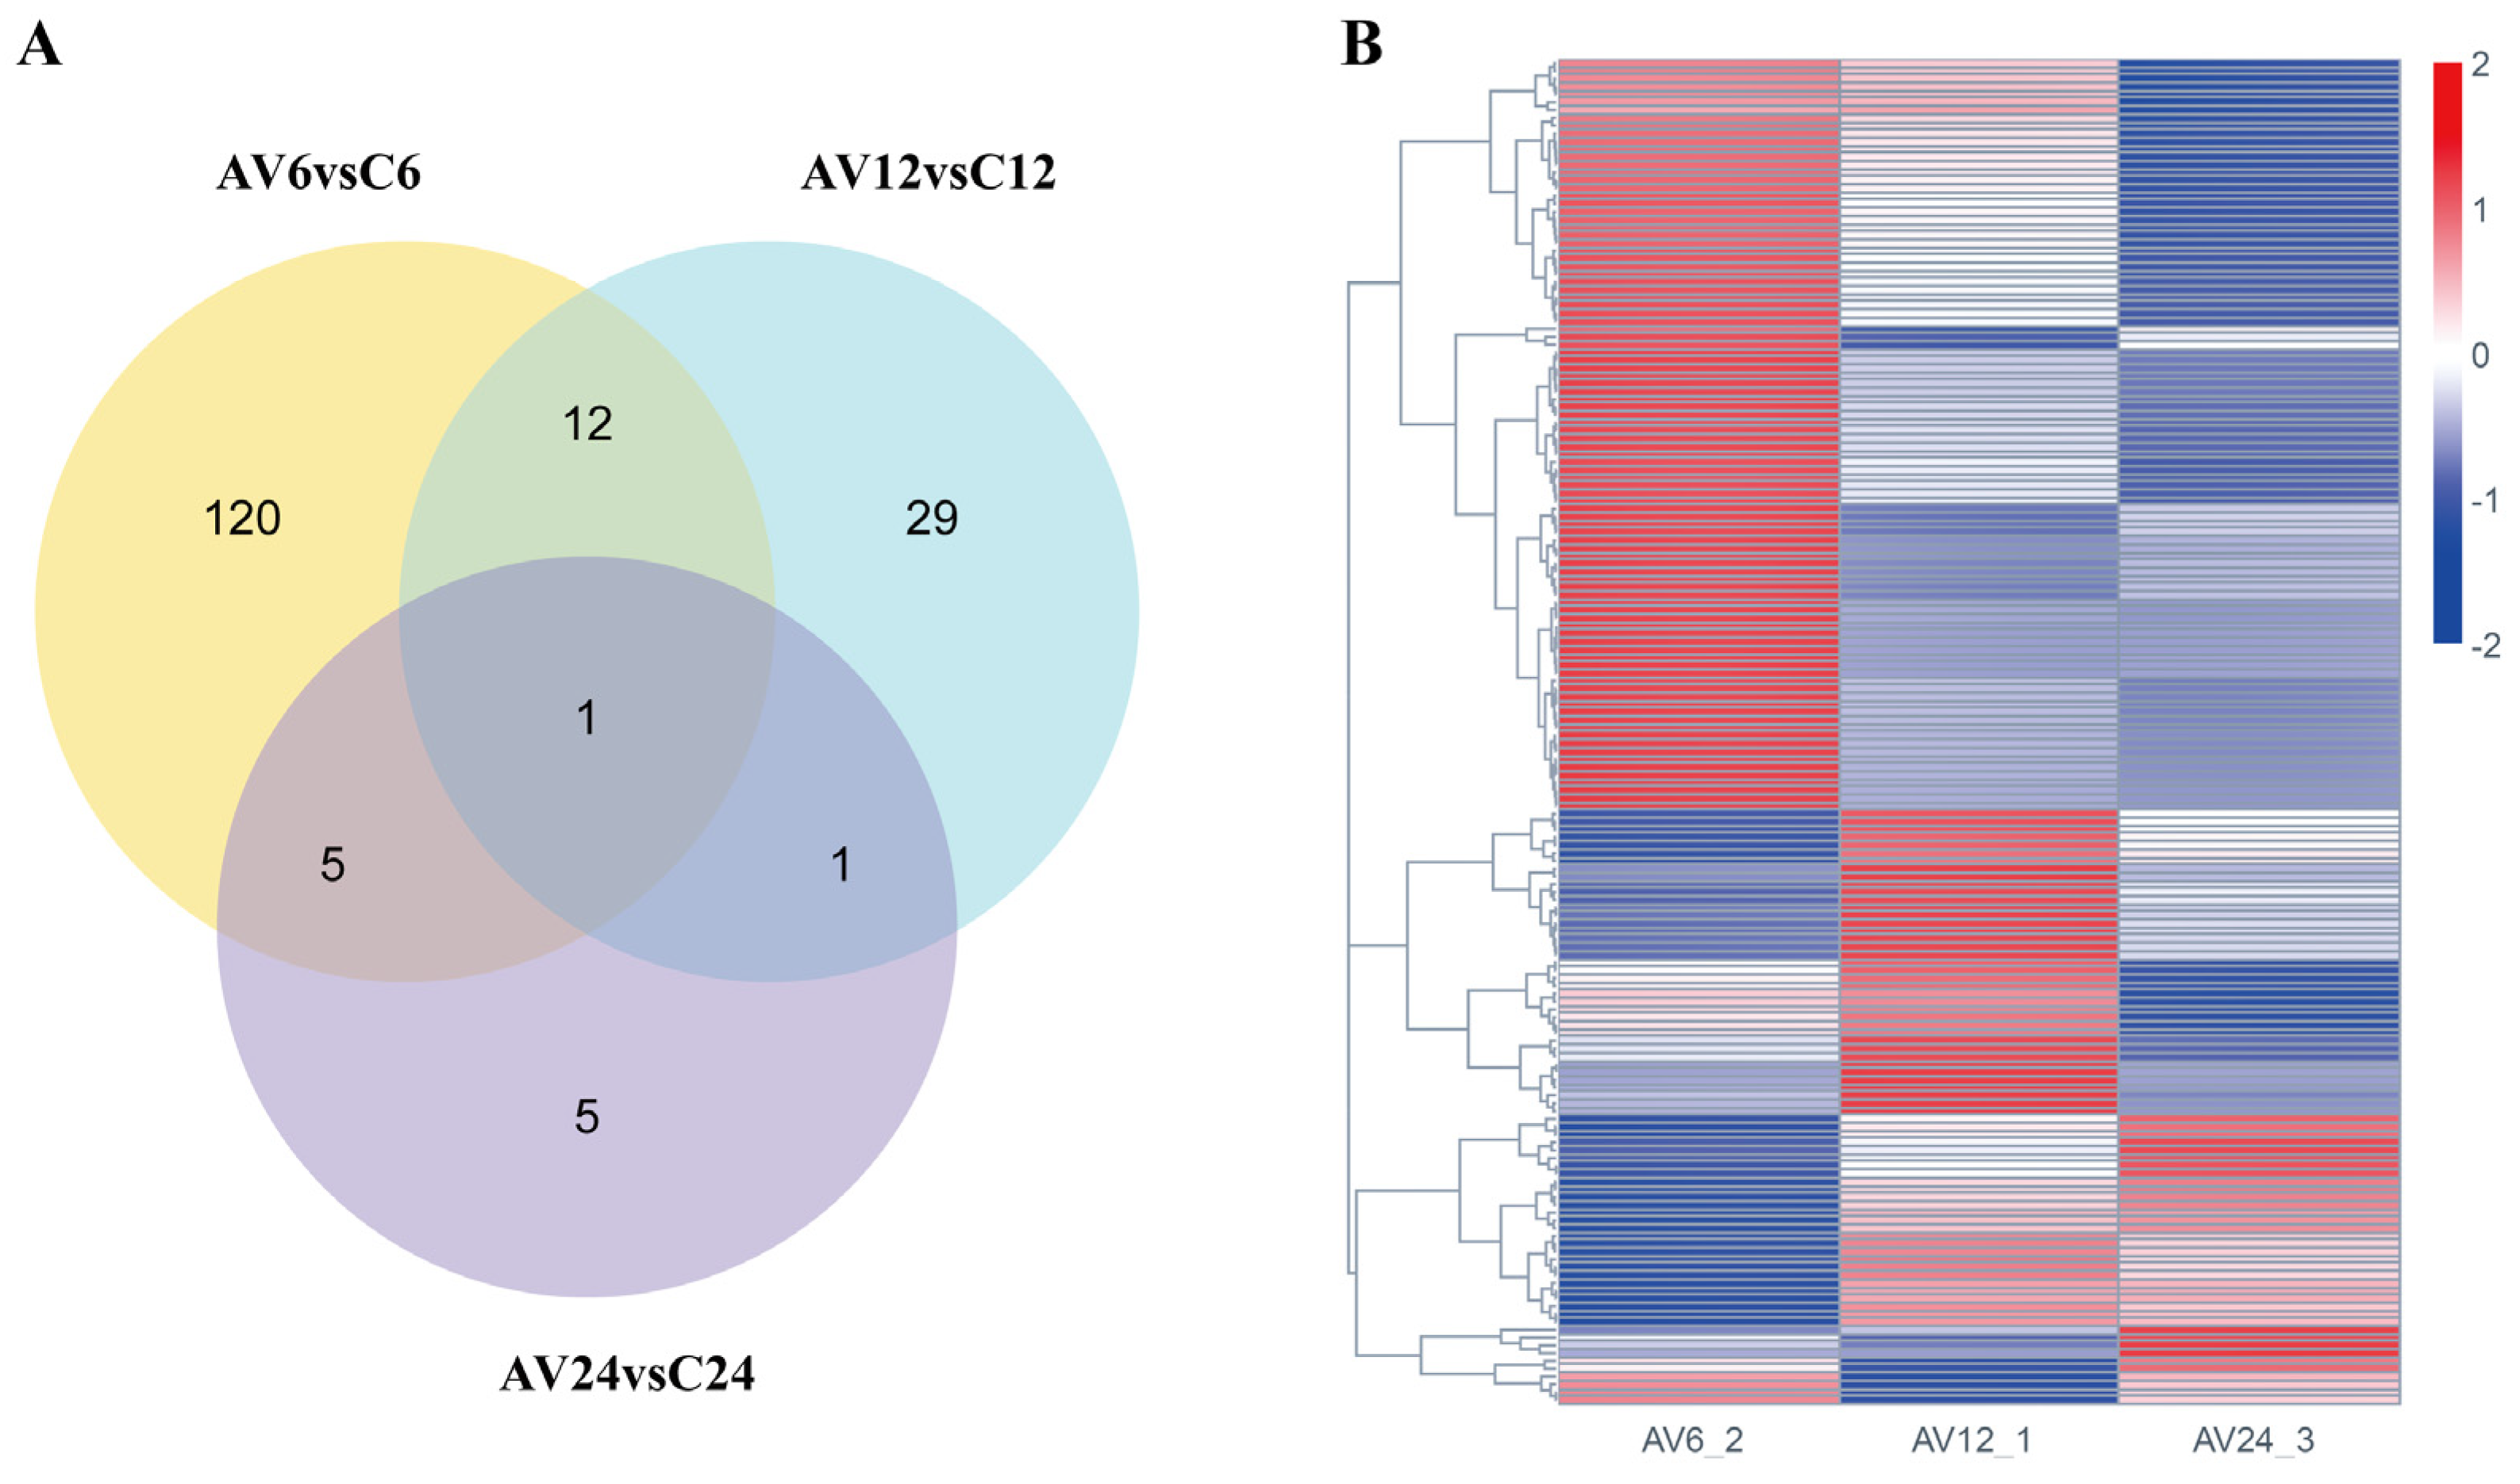
3.2. Identification of DEGs Related to A. veronii Infection

In the current study, 8060 DEGs (Table S3) were detected in three transcriptome comparisons between challenge and control groups (AV6 vs. C6, AV12 vs. C12, and AV24 vs. C24), among which 5208 DEGs (containing 2596 up-regulated and 2612 down-regulated genes) were involved at the early stage of the challenge (AV6 vs. C6). The DEGs reduced dramatically with the extension of the challenge time, with 2262 genes (1225 down-regulated and 1037 up-regulated) and 590 genes (325 down-regulated and 265 up-regulated) differentially expressed, respectively, at 12 and 24 hpi (Figure 2A). The Venn diagram showed that 36 DEGs coexisted in three comparable groups (Figure 2B).

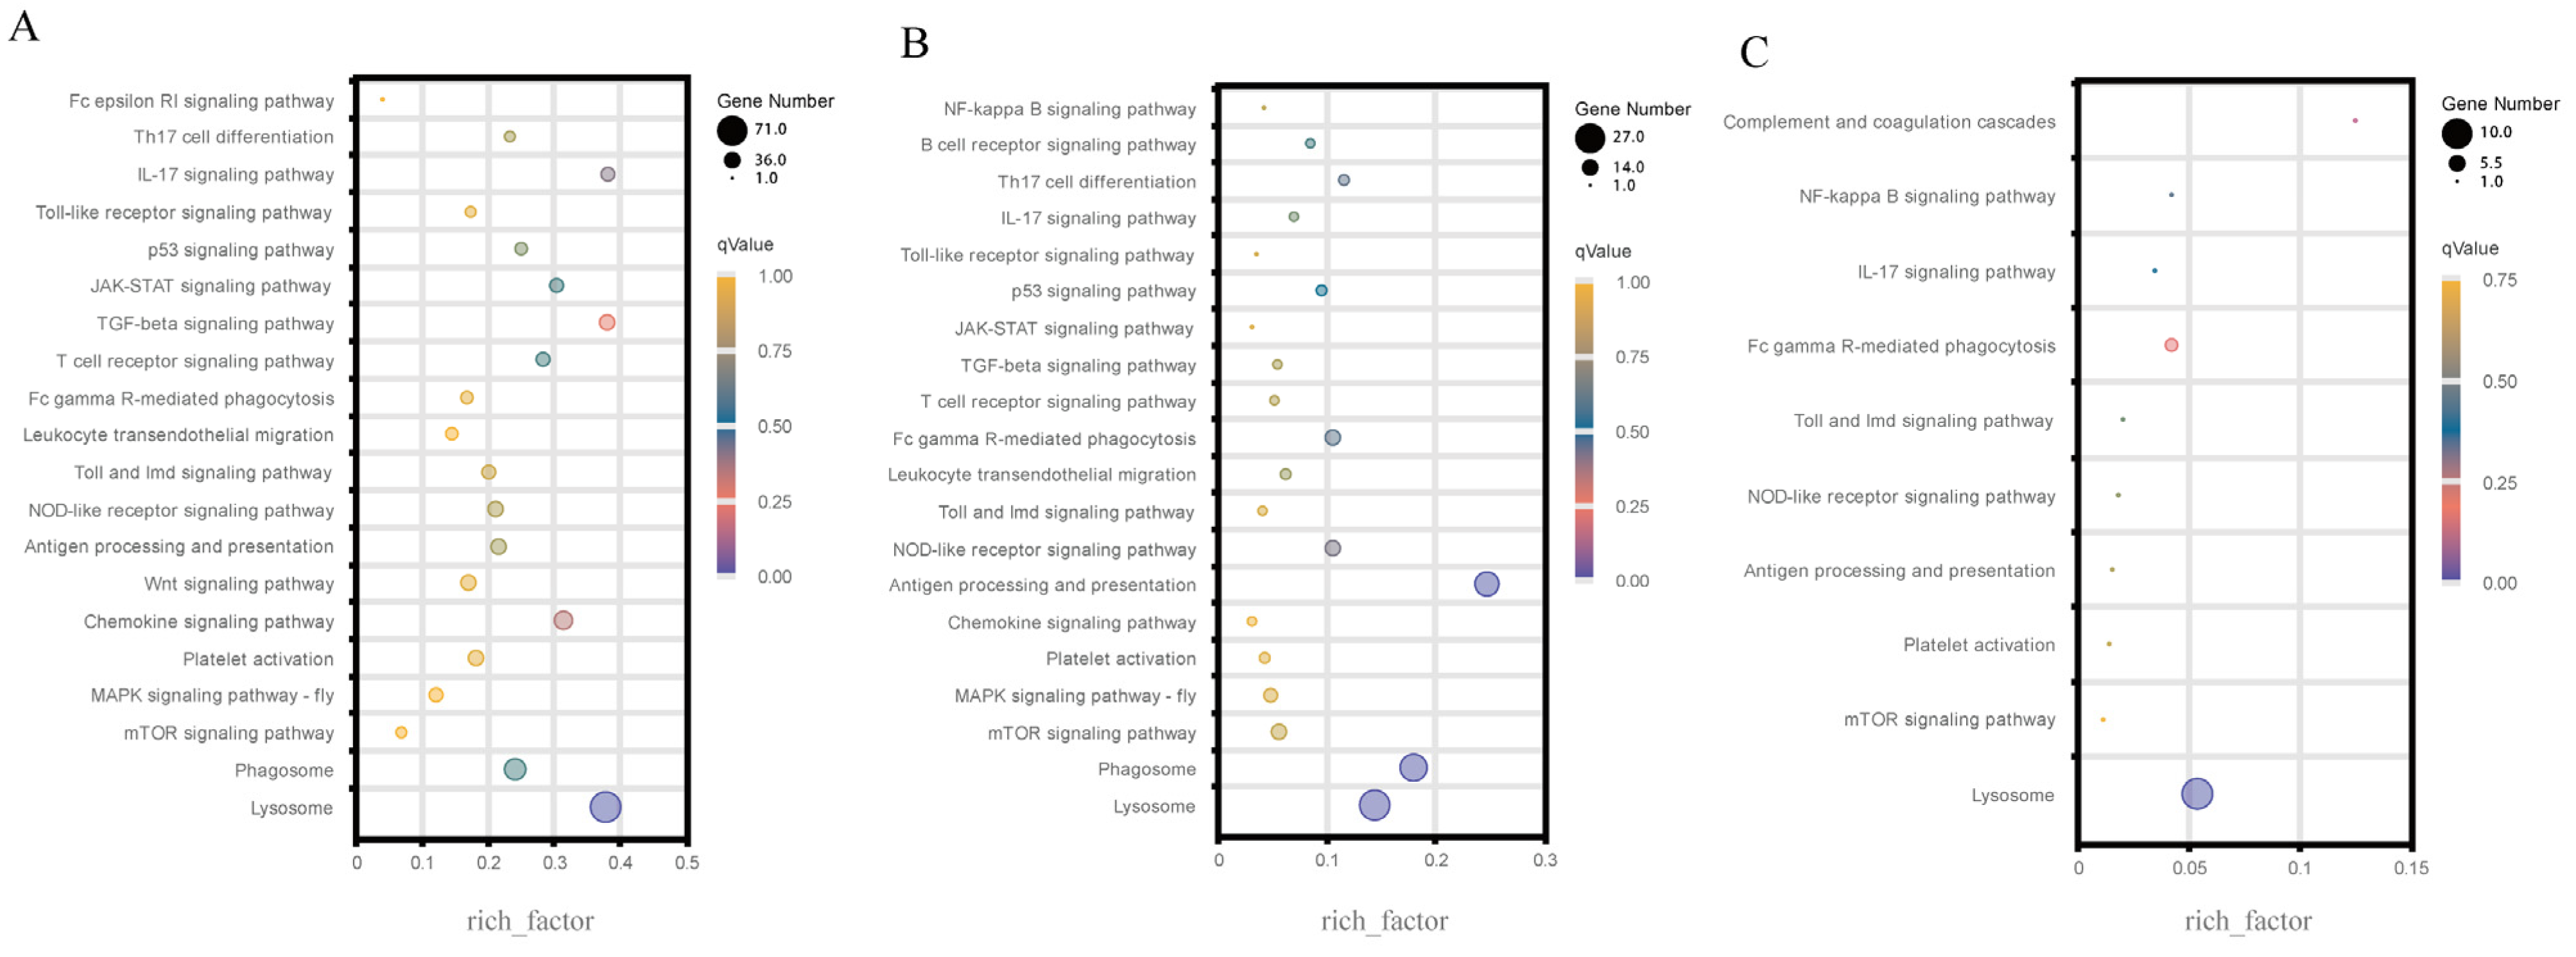
3.3. KEGG Enrichment of the Immune-Related DEGs

At 6, 12, and 24 hpi, KEGG enrichment of immune-related DEGs in different immune-related pathways was analyzed between the challenge group and the control group. For the three transcriptome comparisons, 28 important immune-related pathways were chosen (Table S4). As shown in Figure 3, the lysosome pathway was substantially enriched by all three comparisons, with the highest number of DEGs in the top-20 immune-related pathways. Except for Figure 3C, both comparison groups of AV6 vs. C6 (Figure 3A) and AV12 vs. C12 (Figure 3B) greatly enriched the phagosome pathway. A total of six up-regulated genes were detected at 6 hpi, including actin γ 1 (F-actin), C-type lectin domain family 4 member L/M (DCSIGN), tubulin β (TUBB), 1-phosphatidylinositol-3-phosphate 5-kinase (PIKFYVE), cation-dependent mannose-6-phosphate receptor (M6PR), and nitric-oxide synthase (NOS1) in the phagosome pathway (Figure 4A), and 4 up-regulated genes at 6 hpi were detected in the lysosome pathway, including lysosomal acid lipase (LIPA), lysophospholipase III (LYPLA3), lysosomal acid phosphatase (ACP2), and ceroid-lipofuscinosis neuronal protein 7 (CLN7) (Figure 4B). Other DEGs information was shown in Table 3 and other immune-related pathways, such as the MAPK signaling pathway-fly, the chemokine signaling pathway, antigen processing and presentation, etc., were also abundant in the DEGs.
Furthermore, the Venn diagram analysis showed that 173 immune-related DEGs were detected based on the aforementioned 28 immune-related pathways, and there were 138, 43, and 12 immune-related DEGs, respectively, at 6, 12, and 24 hpi compared to the control groups (Figure 5A). Furthermore, in the hierarchical cluster analysis, 173 immune-related DEGs in AV6 showed significant differences compared to AV12 and AV24, indicating that the majority of the 173 immune-related DEGs were relatively highly expressed at 6 hpi, then the number of DEGs was drastically reduced at 12 and 24 hpi; some genes’ expression increased at 12 hpi while being relatively low expressed at 6 and 24 hpi; a few genes were highly expressed at 24 hpi compared with 6 and 12 hpi (Figure 5B).

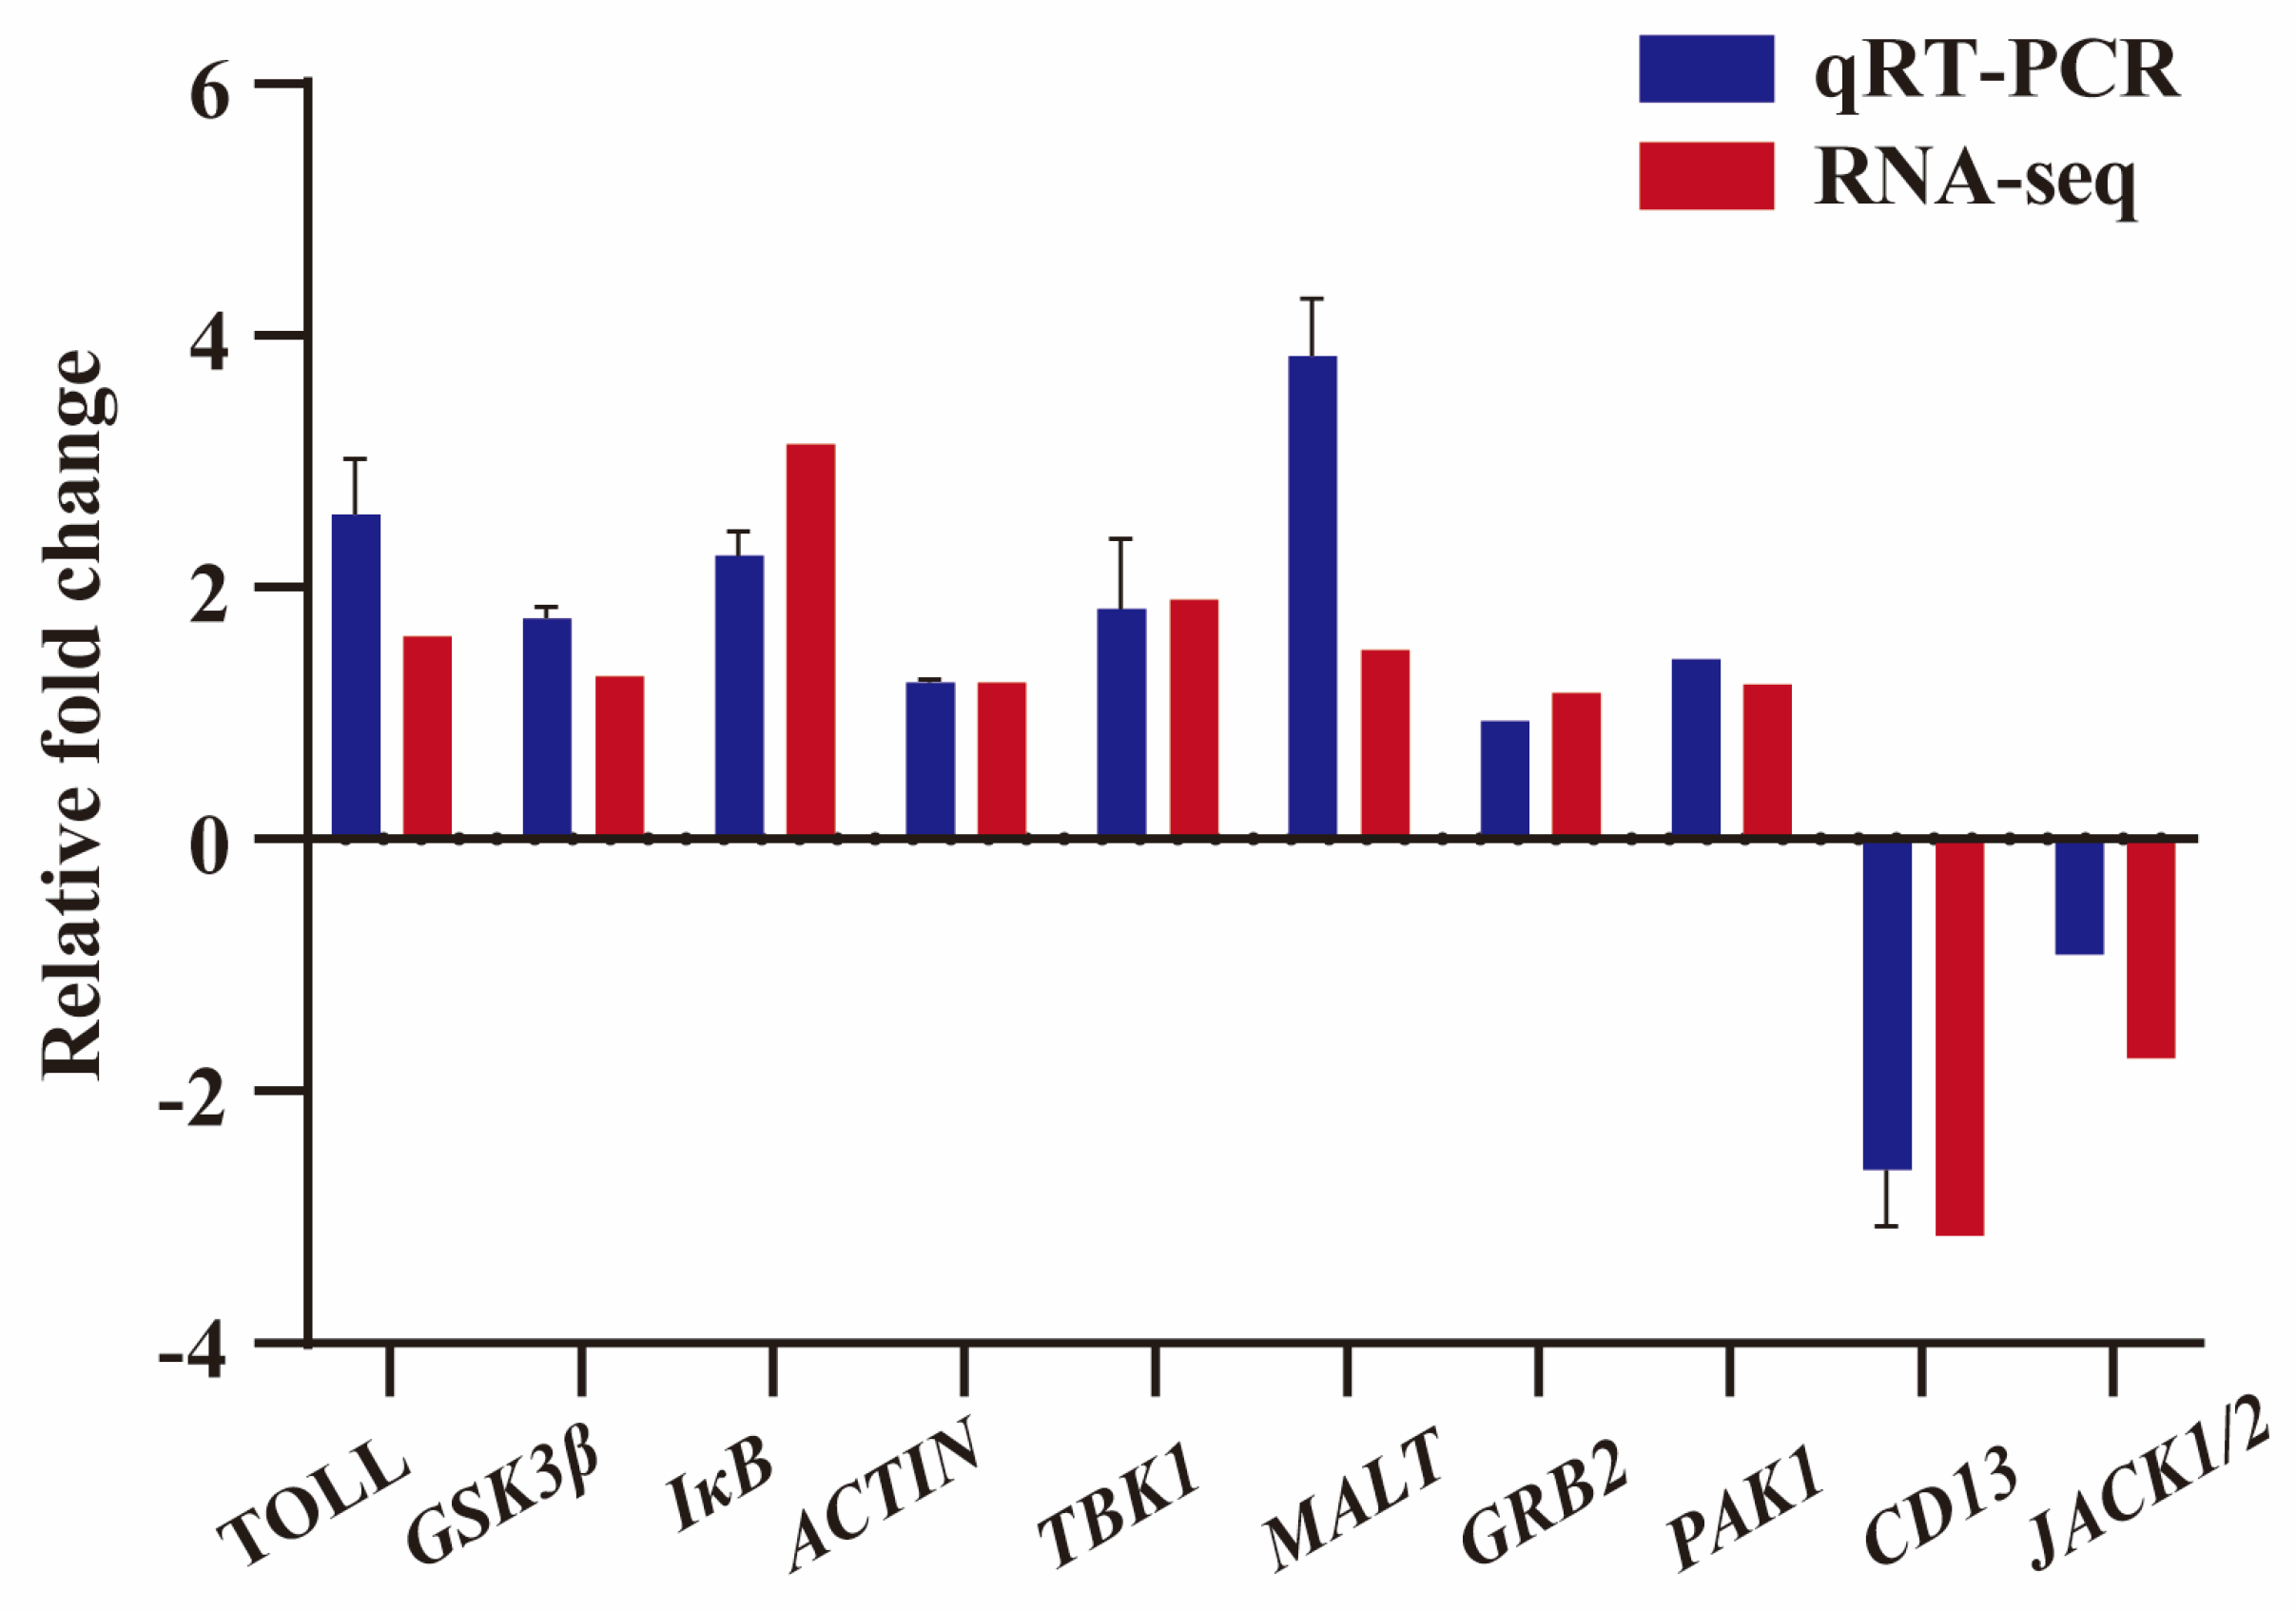
3.4. Validation of DEGs by qRT-PCR

To further confirm the gene expression from RNA-seq data, 10 immune-related DEGs, including TOLL, GSK3β, IκB, ACTIN, TBK1, MALT, GRB2, PAK1, CD13, and JACK1/2, were selected for qRT-PCR verification at random. The results showed that qRT-PCR had an identical expression tendency to the RNA-seq data, which confirmed the expression of immune-related DEGs in the RNA-seq data (Figure 6).

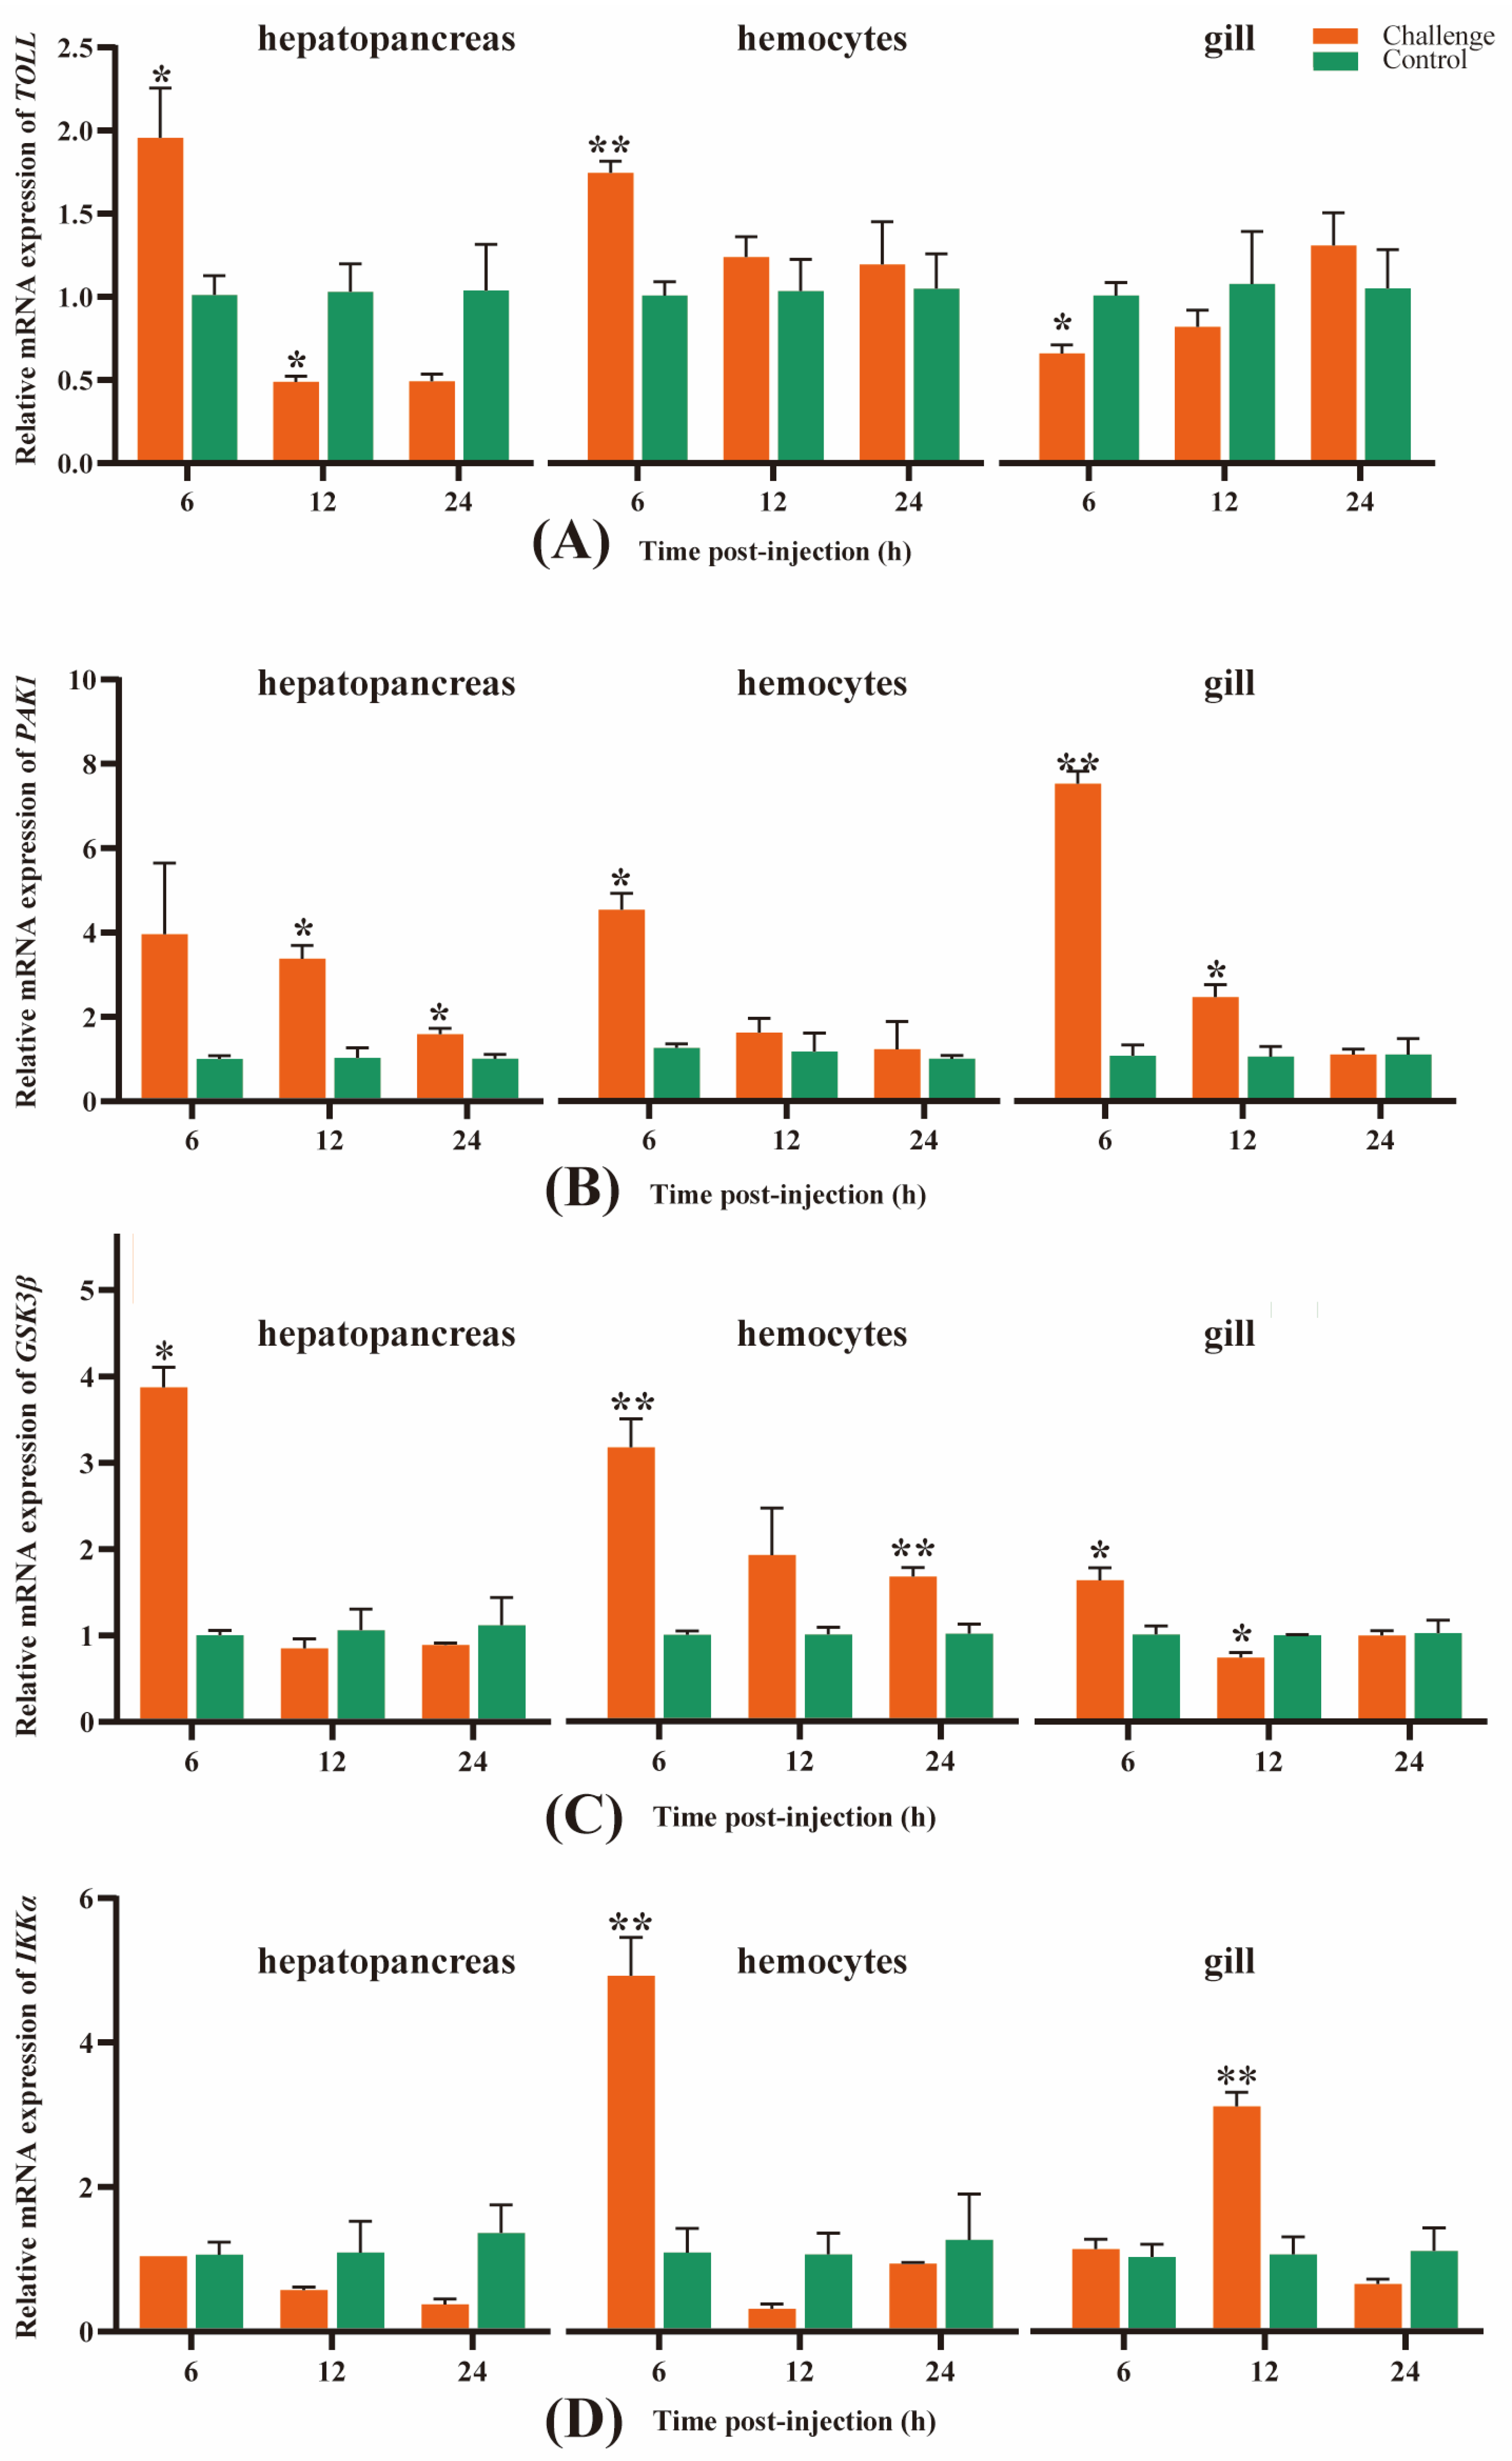
3.5. Temporal and Spatial Expression Levels of Four Key Immune-Related Genes in M. rosenbergii

To further explore the gene expression in hepatopancreas, hemolymph, and gills, four immune-related DEGs, including TOLL, PAK1, GSK3β, and IKKα, were screened from the KEGG pathways, in which these genes overlapped each other.
As seen in Figure 7A, the TOLL gene’s expression level in the hepatopancreas of the challenge groups at 6 hpi was significantly higher than that in the control group (p < 0.05), but then sharply decreased at 12 hpi, significantly lower than that in the control group (p < 0.05), and almost kept successively low levels at 24 hpi, indicating that this gene was remarkably up-regulated at 6 hpi, whereas it became down-regulated at 12 and 24 hpi. Similar to the hepatopancreas, the expression trend of TOLL in the hemolymph of the challenge group was significantly higher than that in the control group (p < 0.01) at 6 hpi, then slightly dropped at 12 hpi and remained similar at 24 hpi, still with a higher expression level than the control group, though the difference was not significant. Therefore, the expression of TOLL was up-regulated in the hemolymph after A. veronii infection. Unlike the hepatopancreas and hemolymph, in the gills, the expression of TOLL was down-regulated at 6 and 12 hpi, significantly lower than the control group at 6 hpi (p < 0.05), then slightly increased at 12 hpi, and became up-regulated at 24 hpi.
In the hepatopancreas, the PAK1 gene expression in the challenge group at 6 hpi was higher than that in the control group, then slightly decreased at 12 hpi and dropped dramatically at 24 hpi, but both of them were significantly higher than the control group (p < 0.05), indicating that the PAK1 gene was remarkably up-regulated at the three time points, despite the continuing decline at 12 and 24 hpi. A similar trend of PAK1 gene expression also appeared in the hemolymph and gills, except that the expression level of the PAK1 gene was slightly lower than that in the control group at 24 hpi in the gills and became down-regulated (Figure 7B).
In the hepatopancreas and gills, the expression trend of the GSK3β gene was similar to the TOLL gene expression in the hepatopancreas, which was significantly higher than that in the control group (p < 0.05), but precipitously declined at 12 and 24 hpi; both of the expression levels at the two points were slightly lower than those in the control group, indicating that the GSK3β gene was up-regulated at 6 hpi, whereas it became down-regulated at 12 and 24 hpi. Furthermore, the expression trend of the GSK3β gene in the hemolymph was similar to that of the PAK1 gene expression in the hepatopancreas and hemolymph, which was higher than that in the control group at 6 hpi (p < 0.01) but sharply decreased at 12 hpi, in spite of the fact that the difference was not significant compared to the control group. Following that, it maintained a slight decline at 24 hpi, but was significantly higher than that in the control group (p < 0.01), revealing that this gene was up-regulated and expressed at all three points (Figure 7C).
The expression level of the IKKα gene in the hepatopancreas of the challenge groups at 6 hpi decreased slightly and maintained a sustained decline at 12 and 24 hpi, and all of them were lower than the control group, which revealed that this gene remained down-regulated throughout the challenge. Unlike the hepatopancreas, the expression level in the hemolymph was remarkably higher than the control group at 6 hpi (p < 0.01) but decreased sharply at 12 hpi and was lower than the control group. After that, it increased slightly at 24 hpi but was still lower compared to the control. These results revealed that the gene IKKα was up-regulated at 6 hpi and became down-regulated at 12 and 24 hpi. In the gill, the IKKα gene in the challenge groups was slightly higher at 6 hpi than the control group and was remarkably higher compared to the control group at 12 hpi (p < 0.01), but then sharply declined at 24 hpi and was lower than the control group, indicating that the IKKα gene was up-regulated at 6 and 12 hpi but became down-regulated at 24 hpi (Figure 7D).

4. Discussion

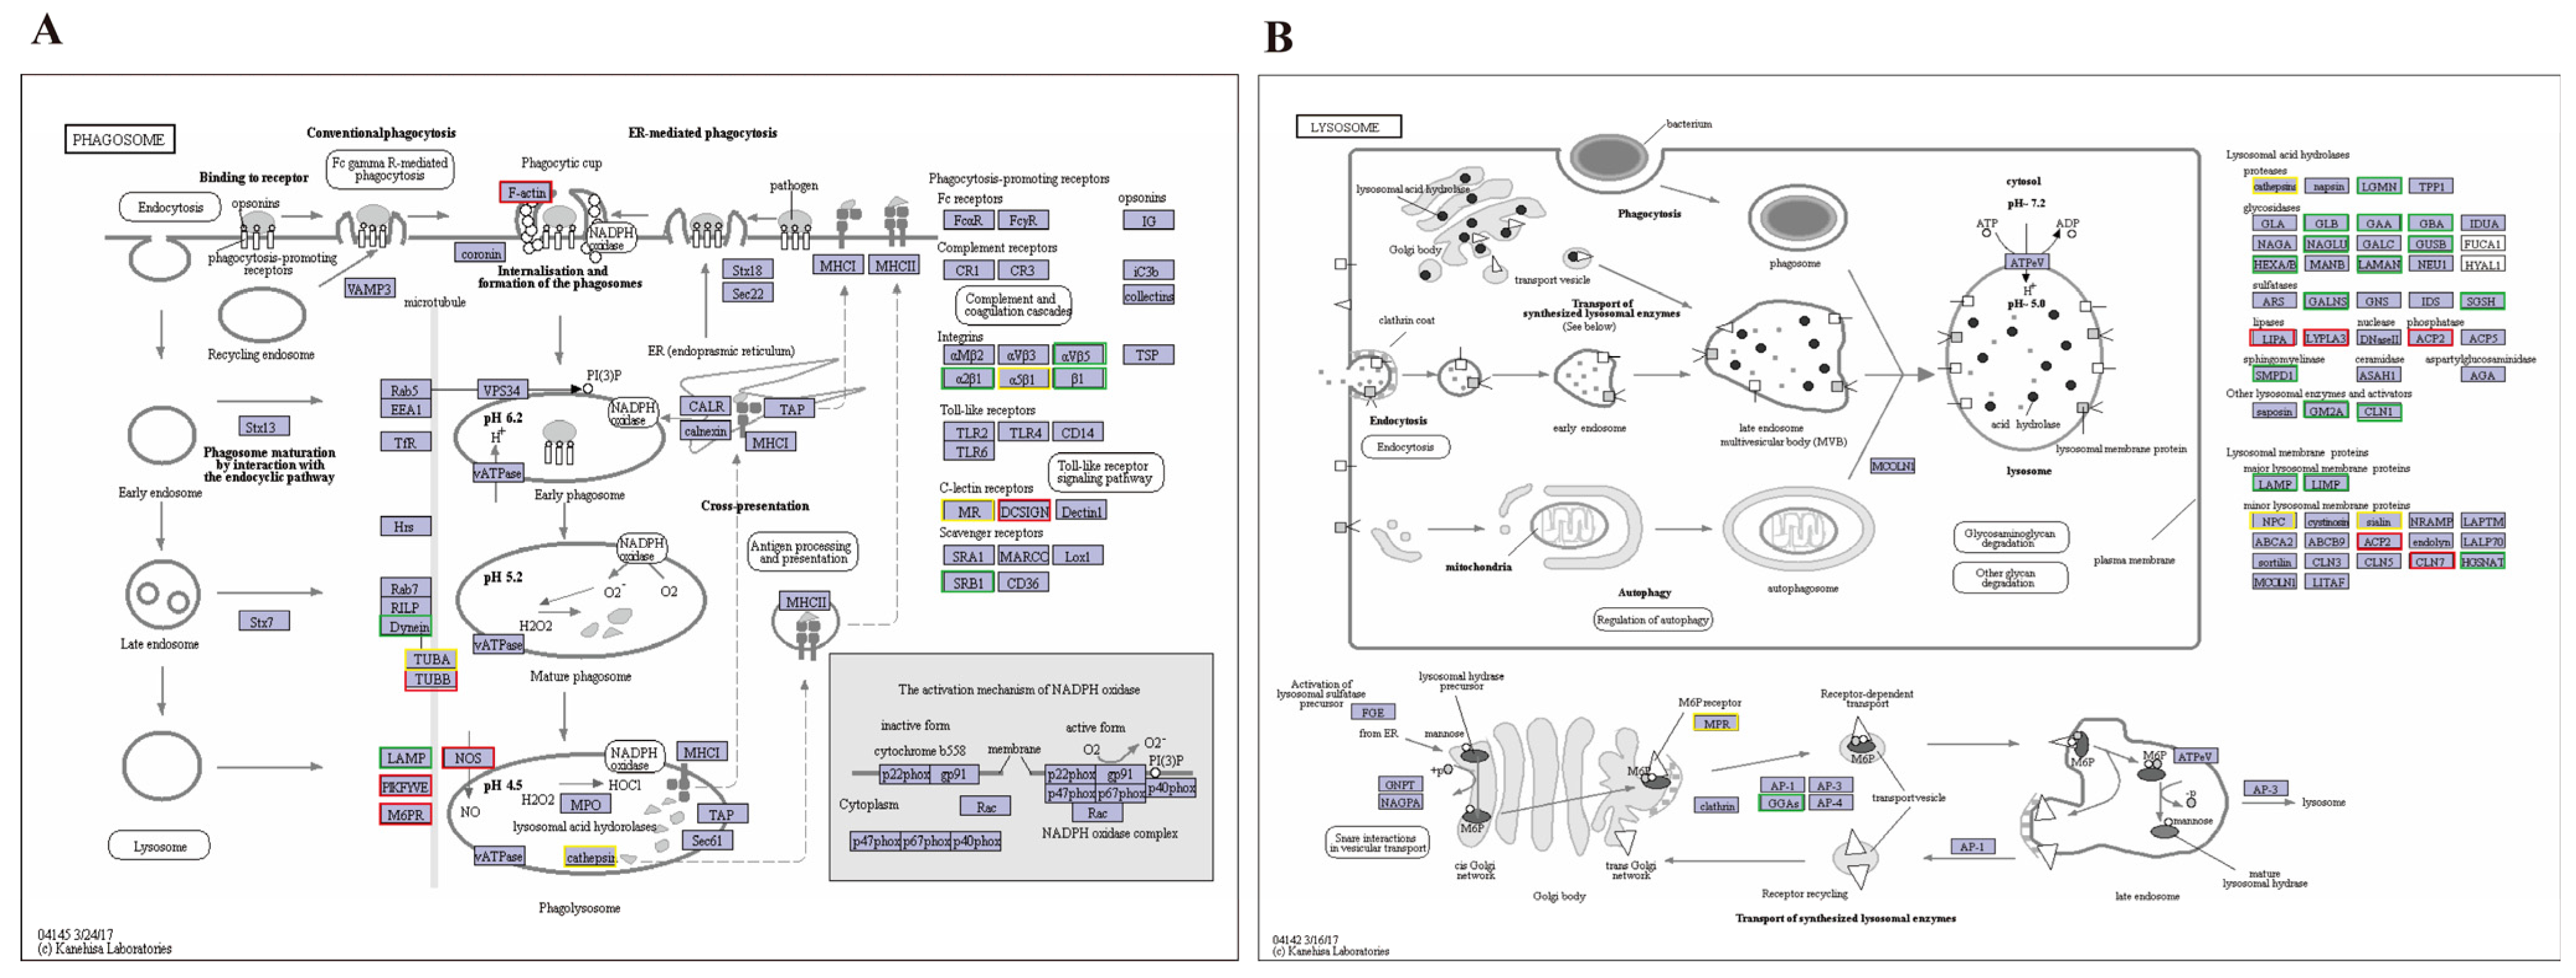
4.1. Phagosome and Lysosome Pathway Analysis

Phagocytosis plays an important role in the innate immunity of M. rosenbergii [15,22]. The phagocytosis process was the particle binding to the cell surface, forming an endocyte, becoming a phagolysosome, and finally digesting within the phagolysosome [23].
As shown in Figure 4A, phagocytosis is driven by the recombination of F-actin, which stimulates the diffusion of a pseudopod around the particle and produces phagosomes that are closely apposed to the particle [24]. F-actin was up-regulated in the M. rosenbergii-infected group at 6 hpi, which might promote the production of phagosomes. C-type lectin receptors (CLRs) play an important role in autoimmunity, allergy, homeostasis, and anti-microbial host defense [25], and one of the functions is to eliminate pathogens by regulating phagosome maturation in macrophages [26]. Up-regulation of the DCSIGN gene in the challenge group at 6 hpi might indicate the promotion of phagosome maturation. In addition, V-type proton ATPase can clear the pathogens in the phagosome by increasing the hydrogen ion (H+) concentration [27]. In the present study, the ATPase gene was down-regulated at 12 hpi compared to the control group, which might suggest a decreased phagocytic capacity of the phagosome in infected individuals compared to healthy M. rosenbergii, and this result is similar to Zhang et al.’s (2019) study which found a significant down-regulation in diseased sea urchins (Strongylocentrotus intermedius) [22].
Crustaceans’ innate immunity depends heavily on lysosomes, which mostly degrade hazardous compounds by phagocytosis and endocytosis, and several lysosomal hydrolytic enzymes, including lipase, proteases, etc., show their greatest enzyme activity at low pH levels [28].
As shown in Figure 4B, LIPA is a very important hydrolase, and reducing its activity can lead to symptoms such as hypercholesterolemia and hepatomegaly [29]. LYPLA3 is a transacylase that may play a specific role in lysosomes [30]. It is reported that LYPLA3′s loss increased atherosclerosis in apolipoprotein E-deficient mice [31]. ACP2 is the most important lysosomal enzyme in crustacean defense, transferring phosphate groups and catalyzing the hydrolysis of phosphorylated proteins [32]. In addition, loss of CLN7 will impair mTOR reactivation and the loss of soluble lysosomal proteins [33]. These genes (LIPA, LYPLA3, ACP2, CLN7) were up-regulated in the M. rosenbergii infection group at 6 hpi, suggesting that they may improve lysosome activity to defend against an A. veronii invasion.

4.2. Important Immune-Related Genes Involved in the Immune Response

The Toll receptor is typically composed of transmembrane regions, intracellular interleukin hormone receptor domains, and extracellular leucine repeats [34]. It is the key vector in immune signal transduction [35]. In the present study, the expression of Toll continuously increased in gills for 24 h and remained highly expressed in hemolymph and hepatopancreas at 6 hpi, indicating that the Toll gene is involved in the immune response against A. veronii infection. In the process of attacking M. rosenbergii with viruses (WSSV), Feng et al. found (2016) that the Toll gene was uniformly up-regulated within 24–48 h, thus it was speculated that the Toll gene played a positive role in the fight against viruses [36]. The result is similar to the present study that the Toll expression remained consistently up-regulated in three tissues after injection of A. veronii, although it varied across tissues and at different times.
PAK1 is the first protein kinase gene to be discovered and is extensively expressed in eukaryotic tissues while being crucial for biological processes [37]. In this study, PAK1 expression was significantly enhanced at 6 hpi in three tissues, then decreased at 12 and 24 hpi successively. The expression level at all time points was higher than the control group. It indicated that PAK1 was closely related to the immune response in M. rosenbergii against A. veronii. This result was similar to the study of Ren et al. (2019), who detected PAK1 in all tissues of infected sea cucumbers (Apostichopus japonicus) and the highest expression was found in the coelom. After the silencing of the PAK1 gene, the lysozyme in the coelom was significantly reduced, thus it was speculated that PAK1 was involved in the immune response against bacteria [38].
GSK-3β plays an important role in innate immunity, phosphorylating and inhibiting glycogen synthase [39]. Ruan et al. (2018) found that down-regulation of GSK3β can inhibit WSSV infection, suggesting that it may promote WSSV clearance in Litopenaeus vannamei by mediating cell apoptosis [40]. Zhang et al. (2020) also found that GSK3β negatively affects L. vannamei when it is infected with WSSV by mediating feedback regulation of the NF-κB pathway [41]. Contrary to the above study, GSK3β expression in the three tissues of M. rosenbergii was remarkably enhanced at 6 hpi in the present study, possibly because these infected individuals were greatly damaged and died in large numbers. The expression of GSK3β returned to normal at 12 and 24 hpi, which might be generated by an effective immune response in the surviving shrimp.
IKK (IκB kinase) consists of IKKα, IKKβ, and IKKγ, IKKα, and IKKβ are involved in the phosphorylation of IκB and the activation of NF-κB, while IKKγ is in charge of IKKβ and IKKα’s recruitment [42]. NF-κB is a transcription factor that is essential for the cell cycle, immunity, inflammation, etc. [43,44]. NF-κB proteins are usually inactivated by attaching to the IκB (the κB inhibitor) [45]. IKK will be activated when cells are stimulated from the outside, such as via a virus [46], and the NF-κB protein will be released, leading to inflammatory and immune responses. In this study, the expression of IKKα was significantly up-regulated in the hemolymph at 6 hpi and in gills at 12 hpi in the challenge group, suggesting a severe immune response in the prawns at these time points. However, the expression of IKKα was down-regulated at 24 hpi, indicating a relief in the symptoms of the surviving prawns. The expression of IKKα in the hepatopancreas kept decreasing, suggesting that the hepatopancreas might be an essential immune organ that responds positively to the stimulus from A. veronii.

5. Conclusions

In this study, a comparative transcriptome analysis revealed a variety of transcriptional information in the hepatopancreas of M. rosenbergii at different time points. KEGG enrichment analysis showed that plenty of DEGs were mainly concentrated in the phagosome and lysosome pathways. In addition, the spatio-temporal expression of four immune-related genes was found to be significantly up-regulated at 6 hpi. These findings contribute to understanding the immune mechanism of M. rosenbergii infected with A. veronii and provide new insights for further research on disease-resistance breeding in M. rosenbergii.

Supplementary Materials

The following supporting information can be downloaded at: https://www.mdpi.com/article/10.3390/genes14071383/s1, Figure S1: (A) KEGG annotation of unigenes. (B) GO annotation of the unigenes; Table S1: Purified transcriptome data from 18 samples; Table S2: Unigenes annotation information in database; Table S3: The details of DEGs in three transcriptome comparisons (AV6 vs. C6, AV12 vs. C12, and AV24 vs. C24); Table S4: The information on 28 immune-related KEGG pathways enriched with the DEGs.

Author Contributions

Conceptualization, Q.T. and X.P.; methodology, S.Y.; software, X.Y.; validation, Z.Z. and H.T.; formal analysis, X.L.; investigation, Z.X.; resources, G.Y.; project administration, Q.T.; funding acquisition, G.Y. All authors have read and agreed to the published version of the manuscript.

Funding

This research was funded by the earmarked fund for the China Agriculture Research System (CARS-48), key scientific and technological grant of Zhejiang for breeding new agricultural (Aquaculture) varieties (2021C02069-4-3), and the major research and development program (modern agriculture) of Jiangsu province (BE2019352).

Institutional Review Board Statement

This study was conducted according to the Guide for Laboratory Animals developed by the Ministry of Science and Technology (Beijing, China). The experimental protocol for animal care and tissue collection was approved by Huzhou University (the ethical approval code: 20190625).

Informed Consent Statement

Informed consent was obtained from all subjects involved in the study.

Data Availability Statement

All supporting data are included within the main article and all supporting data are included within the main article and its Supplementary Files.

Acknowledgments

Thanks for Qi Shen, Haoyu Lou, and Tianci Kong’s help in the experiment.

Conflicts of Interest

The authors declare no conflict of interest.

References

  1. Fao, F.; Bondad-Reantaso, M.G.; Arthur, J.R. FAO Fisheries and Aquaculture Report NFIA/R1333 (En); FAO: Rome, Italy, 2021. [Google Scholar]
  2. Chen, K.F.; Maran, S.; Tan, W.S.; Ong, L.K.; Abidin, S.A.Z.; Othman, I.; Tey, B.T.; Lee, R.F.S. Meta-analysis of studies on pro tection provided by different prophylactic agents, their routes of administration and incubation times against nodavirus infection in Macrobrachium rosenbergii. Aquaculture 2023, 565, 739125. [Google Scholar] [CrossRef]
  3. Zhao, C.; Miu, Q.; Liu, S.; Zhou, D.; He, X.; Pang, J.; Weng, S.; He, J. Detection methods, epidemiological investigation, and host ranges of infectious precocity virus (IPV). Aquaculture 2023, 562, 738818. [Google Scholar] [CrossRef]
  4. Qian, Q.; Zhou, Y.; Chen, Z.; Zhu, Y.; Xu, J.; Gao, X.; Jiang, Q.; Wang, J.; Zhang, X. Pathogenesis and complete genome sequence of Decapod iridescent virus 1 (DIV1) associated with mass mortality in Macrobrachium rosenbergii. Aquaculture 2023, 566, 739220. [Google Scholar] [CrossRef]
  5. Zhao, C.; Wen, H.; Huang, S.; Weng, S.; He, J. A Novel Disease (Water Bubble Disease) of the Giant Freshwater Prawn Macrobrachium rosenbergii Caused by Citrobacter freundii: Antibiotic Treatment and Effects on the Antioxidant Enzyme Activity and Immune Responses. Antioxidants 2022, 11, 1491. [Google Scholar] [CrossRef] [PubMed]
  6. Parte, A.C. LPSN—List of Prokaryotic names with Standing in Nomenclature (bacterio.net), 20 years on. Int. J. Syst. Evol. Microbiol. 2018, 68, 1825–1829. [Google Scholar] [CrossRef]
  7. Hickman-Brenner, F.W.; MacDonald, K.L.; Steigerwalt, A.G.; Fanning, G.R.; Brenner, D.J.; Farmer, J.J., 3rd. Aermonas veronii, a new ornithine decarboxylase-positive species that may cause diarrhea. J. Clin. Microbiol. 1987, 25, 900–906. [Google Scholar] [CrossRef] [PubMed] [Green Version]
  8. Dong, H.T.; Techatanakitarnan, C.; Jindakittikul, P.; Thaiprayoon, A.; Taengphu, S.; Charoensapsri, W.; Khunrae, P.; Rattanarojpong, T.; Senapin, S. Aeromonas jandaei and Aeromonas veronii caused disease and mortality in Nile tilapia, Oreochromis niloticus (L.). J. Fish Dis. 2017, 40, 1395–1403. [Google Scholar] [CrossRef]
  9. Zhai, W.; Wang, Q.; Zhu, X.; Jia, X.; Chen, L. Pathogenic infection and microbial composition of yellow catfish (Pelteobagrus fulvidraco) challenged by Aeromonas veronii and Proteus mirabilis. Aquac. Fish 2023, 8, 166–173. [Google Scholar] [CrossRef]
  10. Liu, G.; Li, J.; Jiang, Z.; Zhu, X.; Gao, X.; Jiang, Q.; Wang, J.; Wei, W.; Zhang, X. Pathogenicity of Aeromonas veronii causing mass mortalities of Odontobutis potamophila and its induced host immune response. Fish Shellfish Immunol. 2022, 125, 180–189. [Google Scholar] [CrossRef]
  11. Peng, X.; Tu, H.H.; Luo, J.P.; Zhong, Z.X.; Lan, X.; Tang, Q.Y.; Yi, S.K.; Xia, Z.L.; Cai, M.Y.; Yang, G.L. Isolation, identification and virulence gene analysis of pathogenic Aeromonas veronii in Microbrachium rosenberdii and its histopathological observation. Acta Hydrobiol. Sin. 2023, 47, 874–882. [Google Scholar]
  12. Kumaresan, V.; Palanisamy, R.; Pasupuleti, M.; Arockiaraj, J. Impacts of environmental and biological stressors on immune system of Macrobrachium rosenbergii. Rev. Aquacult. 2017, 9, 283–307. [Google Scholar] [CrossRef]
  13. Wang, Y.; Wang, B.; Liu, M.; Jiang, K.; Wang, M.; Wang, L. Comparative transcriptome analysis reveals the different roles between hepatopancreas and intestine of Litopenaeus vannamei in immune response to aflatoxin B1 (AFB1) challenge. Comp. Biochem. Physiol. C Toxicol. Pharmacol. 2019, 222, 1–10. [Google Scholar] [CrossRef] [PubMed]
  14. Zhang, X.; Zhang, M.; Zheng, H.; Ye, H.; Zhang, X.; Li, S. Source of hemolymph microbiota and their roles in the immune system of mud crab. Dev. Comp. Immunol. 2020, 102, 103470. [Google Scholar] [CrossRef]
  15. Gao, X.; Jiang, Z.; Zhang, S.; Chen, Q.; Tong, S.; Liu, X.; Jiang, Q.; Yang, H.; Wei, W.; Zhang, X. Transcriptome analysis and immune-related genes expression reveals the immune responses of Macrobrachium rosenbergii infected by Enterobacter cloacae. Fish Shellfish Immunol. 2020, 101, 66–77. [Google Scholar] [CrossRef]
  16. Wang, D.-L.; Zuo, D.; Wang, L.-M.; Sun, T.; Wang, Q.; Zhao, Y.-L. Effects of white spot syndrome virus infection on immuno-enzyme activities and ultrastructure in gills of Cherax quadricarinatus. Fish Shellfish Immunol. 2012, 32, 645–650. [Google Scholar] [CrossRef] [PubMed]
  17. Duan, Y.; Zhang, J.; Dong, H.; Wang, Y.; Liu, Q.; Li, H. Oxidative stress response of the black tiger shrimp Penaeus monodon to Vibrio parahaemolyticus challenge. Fish Shellfish Immunol. 2015, 46, 354–365. [Google Scholar] [CrossRef]
  18. Grabherr, M.G.; Haas, B.J.; Yassour, M.; Levin, J.Z.; Thompson, D.A.; Amit, I.; Adiconis, X.; Fan, L.; Raychowdhury, R.; Zeng, Q.; et al. Full-length transcriptome assembly from RNA-Seq data without a reference genome. Nat. Biotechnol. 2011, 29, 644–652. [Google Scholar] [CrossRef] [Green Version]
  19. Simão, F.A.; Waterhouse, R.M.; Ioannidis, P.; Kriventseva, E.V.; Zdobnov, E.M. BUSCO: Assessing genome assembly and annotation completeness with single-copy orthologs. Bioinformatics 2015, 31, 3210–3212. [Google Scholar] [CrossRef] [Green Version]
  20. Love, M.I.; Huber, W.; Anders, S. Moderated estimation of fold change and dispersion for RNA-seq data with DESeq2. Genome Biol. 2014, 15, 550. [Google Scholar] [CrossRef] [Green Version]
  21. Young, M.D.; Wakefield, M.J.; Smyth, G.K.; Oshlack, A. Gene ontology analysis for RNA-seq: Accounting for selection bias. Genome. Biol. 2010, 11, R14. [Google Scholar] [CrossRef] [Green Version]
  22. Zhang, W.; Lv, Z.; Li, C.; Sun, Y.; Jiang, H.; Zhao, M.; Zhao, X.; Shao, Y.; Chang, Y. Transcriptome profiling reveals key roles of phagosome and NOD-like receptor pathway in spotting diseased Strongylocentrotus intermedius. Fish Shellfish Immunol. 2019, 84, 521–531. [Google Scholar] [CrossRef] [PubMed]
  23. Torunn, T.E.; Løvdal, T.; Berg, T. Phagosome dynamics and function. Bioessays 2000, 22, 255–263. [Google Scholar]
  24. Swanson, J.A.; Baer, S.C. Phagocytosis by zippers and triggers. Trends. Cell Biol. 1995, 5, 89–92. [Google Scholar] [CrossRef] [PubMed]
  25. Dambuza, I.M.; Brown, G.D. C-type lectins in immunity: Recent developments. Curr. Opin. Immunol. 2015, 32, 21–27. [Google Scholar] [CrossRef] [Green Version]
  26. Lee, W.B.; Yan, J.J.; Kang, J.S.; Kim, L.K.; Kim, Y.J. Macrophage C-type lectin is essential for phagosome maturation and acidification during Escherichia coli-induced peritonitis. Biochem. Biophys. Res. Commun. 2017, 493, 1491–1497. [Google Scholar] [CrossRef]
  27. Nishi, T.; Forgac, M. The vacuolar (H+)-ATPases--nature’s most versatile proton pumps. Nat. Rev. Mol. Cell. Biol. 2002, 3, 94–103. [Google Scholar] [CrossRef]
  28. Pu, J.; Guardia, C.M.; Keren-Kaplan, T.; Bonifacino, J.S. Mechanisms and functions of lysosome positioning. J. Cell. Sci. 2016, 129, 4329–4339. [Google Scholar] [CrossRef] [Green Version]
  29. Zhang, B.; Porto, A.F. Cholesteryl ester storage disease: Protean presentations of lysosomal acid lipase deficiency. J. Pediatr. Gastroenterol. Nutr. 2013, 56, 682–685. [Google Scholar] [CrossRef]
  30. Hiraoka, M.; Abe, A.; Shayman, J.A. Cloning and characterization of a lysosomal phospholipase A2, 1-O-acylceramide synthase. J. Biol. Chem. 2002, 277, 10090–10099. [Google Scholar] [CrossRef] [Green Version]
  31. Taniyama, Y.; Fuse, H.; Satomi, T.; Tozawa, R.; Yasuhara, Y.; Shimakawa, K.; Shibata, S.; Hattori, M.; Nakata, M.; Taketomi, S. Loss of lysophospholipase 3 increases atherosclerosis in apolipoprotein E-deficient mice. Biochem. Biophys. Res. Commun. 2005, 330, 104–110. [Google Scholar] [CrossRef]
  32. Du, J.; Zhu, H.; Liu, P.; Chen, J.; Xiu, Y.; Yao, W.; Wu, T.; Ren, Q.; Meng, Q.; Gu, W.; et al. Immune responses and gene expression in hepatopancreas from Macrobrachium rosenbergii challenged by a novel pathogen spiroplasma MR-1008. Fish Shellfish Immunol. 2013, 34, 315–323. [Google Scholar] [CrossRef] [PubMed]
  33. Danyukova, T.; Ariunbat, K.; Thelen, M.; Brocke-Ahmadinejad, N.; Mole, S.E.; Storch, S. Loss of CLN7 results in depletion of soluble lysosomal proteins and impaired mTOR reactivation. Hum. Mol. Genet. 2018, 27, 1711–1722. [Google Scholar] [CrossRef] [PubMed]
  34. Kowalski, E.J.A.; Li, L. Toll-Interacting Protein in Resolving and Non-Resolving Inflammation. Front. Immunol. 2017, 8, 511. [Google Scholar] [CrossRef] [Green Version]
  35. Ou, J.; Chen, H.; Liu, Q.; Bian, Y.; Luan, X.; Jiang, Q.; Ji, H.; Wang, Z.; Lv, L.; Dong, X.; et al. Integrated transcriptome analysis of immune-related mRNAs and microRNAs in Macrobrachium rosenbergii infected with Spiroplasma eriocheiris. Fish Shellfish Immunol. 2021, 119, 651–669. [Google Scholar] [CrossRef] [PubMed]
  36. Feng, J.; Zhao, L.; Jin, M.; Li, T.; Wu, L.; Chen, Y.; Ren, Q. Toll receptor response to white spot syndrome virus challenge in giant freshwater prawns (Macrobrachium rosenbergii). Fish Shellfish Immunol. 2016, 57, 148–159. [Google Scholar] [CrossRef] [PubMed]
  37. Ke, Y.; Wang, X.; Jin, X.Y.; Solaro, R.J.; Lei, M. PAK1 is a novel cardiac protective signaling molecule. Front. Med. 2014, 8, 399–403. [Google Scholar] [CrossRef]
  38. Ren, L.J.; Li, K.Q.; Zhang, Y.Y.; Wang, y.; Yu, Y.; Cheng, Y.; Lin, K.; Song, J.; Chang, Y.Q. Isolation of a new PAK1 Gene from Sea Cucumber (Apostichopus japonicus) and its Expression analysis and function characterization. J. Ocean Univ. China 2019, 18, 1147–1157. [Google Scholar] [CrossRef]
  39. Beurel, E.; Grieco, S.F.; Jope, R.S. Glycogen synthase kinase-3 (GSK3): Regulation, actions, and diseases. Pharmacol. Ther. 2015, 148, 114–131. [Google Scholar] [CrossRef] [Green Version]
  40. Ruan, L.; Liu, H.; Shi, H. Characterization and function of GSK3β from Litopenaeus vannamei in WSSV infection. Fish Shellfish Immunol. 2018, 82, 220–228. [Google Scholar] [CrossRef]
  41. Zhang, S.; Zhu, L.; Hou, C.; Yuan, H.; Yang, S.; Dehwah, M.A.S.; Shi, L. GSK3β Plays a Negative Role During White Spot Syndrome Virus (WSSV) Infection by Regulating NF-κB Activity in Shrimp Litopenaeus vannamei. Front. Immunol. 2020, 11, 607543. [Google Scholar] [CrossRef]
  42. Solt, L.A.; May, M.J. The IκB kinase complex: Master regulator of NF-κB signaling. Immunol. Res. 2008, 42, 3–18. [Google Scholar] [CrossRef] [PubMed] [Green Version]
  43. Viatour, P.; Merville, M.P.; Bours, V.; Chariot, A. Phosphorylation of NF-κB and IκB proteins: Implications in cancer and inflammation. Trends Biochem. Sci. 2005, 30, 43–45. [Google Scholar] [CrossRef] [PubMed]
  44. Liu, T.; Zhang, L.; Joo, D.; Sun, S.C. NF-κB signaling in inflammation. Signal. Transduct. Target. Ther. 2017, 2, 17023. [Google Scholar] [CrossRef] [PubMed] [Green Version]
  45. Ferreiro, D.U.; Komives, E.A. Molecular mechanisms of system control of NF-κB signaling by IκBα. Biochemistry 2010, 49, 1560–1567. [Google Scholar] [CrossRef] [Green Version]
  46. Liu, F.; Xia, Y.; Parker, A.S.; Verma, I.M. IKK biology. Immunol. Rev. 2012, 246, 239–253. [Google Scholar] [CrossRef] [Green Version]
Figure 1. (A) The number of unigene (blue) and transcript (red) in different length intervals. The length of unigene/transcript (x-axis), and the number of unigene and transcript (y-axis). (B) Venn diagrams for five databases; each region was annotated with a corresponding number of genes.
Genes 14 01383 g001
Figure 2. (A) Columnar distribution of DEGs in three compare groups. Orange color (all DEGs numbers), yellow color (up-regulation gene numbers) and green color (down-regulation gene numbers). (B) Venn diagram reflects the number of DEGs in the three comparison groups.
Genes 14 01383 g002
Figure 3. A total of 173 immune-related differential genes (DEGs) were enriched in the top 20 immune-related pathways in the three comparison groups. (A) AV6 vs. C6, (B) AV12 vs. C12, (C) AV24 vs. C24. Dot size represents the corresponding number of DEGs, and color represents enrichment p-value.
Genes 14 01383 g003
Figure 4. Pathway map of the phagosome (A) and lysosome (B) pathways in KEGG at 6 h post injection. The red and green boxes represent up-regulated and down-regulated genes, respectively. The yellow boxes represent unclear up-regulation and down-regulation of genes.
Genes 14 01383 g004
Figure 5. (A) Venn diagram shows the number of 173 immune-related DEGs in the three comparison groups (AV6 vs. C6, AV12 vs. C12 and AV24 vs. C24). (B) Hierarchical cluster analysis of 173 immune-related DEGs. Red represents high expression and blue represents low expression.
Genes 14 01383 g005
Figure 6. A total of 10 immune-related genes were randomly selected for qRT-PCR validation. The blue column represents the expression level of qRT-PCR, and the red column represents the expression level of RNA-seq. Data shown are the mean of triplicates ± SD.
Genes 14 01383 g006
Figure 7. Gene expression analysis of the TOLL (A), PAK1 (B), GSK3β (C), and IKKα (D) in M. rosenbergii hepatopancreas, hemolymph, and gills at 6, 12, 24 hpi, respectively. Data shown are the mean of triplicates ± SD. The asterisk represents significant differences between the challenge and control groups at different times (“*”indicates p < 0.05 and “**” indicates p < 0.01). The orange column and the green column represent the challenge group and the control group, respectively.
Genes 14 01383 g007
Table 1. Sequences of primers used in this study.
PrimerGene Name or UsageSequence (5′→3′)Annealing Temperature (°C)
18S-FUsed as reference geneTATACGCTAGTGGAGCTGGAA59
18S-RGGGGAGGTAGTGACGAAAAAT
GSK3β-FGlycogen synthase kinase 3 βACCCGTGAGCAGATTAGA59
GSK3β-RGCCTGAAGTGGCGTGATA
1κB-FNF-kappa-B inhibitor αGCATAATGGCTATTGAACTG59
1κB-RTCCCAAGATGGAACGCTA
PAK1-Fp21-activated kinase 1TTCGTCGGAAGGTAGAGG59
PAK1-RGAGGCTGGTCGGTGGTAT
TBK1-FTank-binding kinase 1AGAGGAGCAAGAAGGTCG59
TBK1-RCAGGCTTCAAGTCACGATGT
TOLL-FProtein tollCAAACCGTCGGAGGAACA59
TOLL-RCCTTGACTGCCACTGAAC
CD13-FAminopeptidase NGAGTGCCGACTTCCAACC59
CD13-RCAAGACCTCCAGAACAATA
Actin-FActin β/γ 1ATGGTCGGTATGGGTCAGA59
Actin-RAGGTGCTACACGGAGTTCA
GRB2-FGrowth factor receptor-Bound protein 2GAAGGACTTATTCCCAGCAA59
GRB2-RACCATCGCCACATTTAGG
IKKα-FInhibitor of nuclear factor kappa-B kinase subunit αAATATCCCACTTGAAGCC59
IKKα-RCGTTGAAACAGGACGAAA
MALT-FMucosa-associated lymphoid tissue lymphoma translocation protein 1CGGAAGGACGGCGTTACAT59
MALT-RCACGGTCACGGGTCTGGTT
JAK1/2-FJanus kinase 1AAAGAGCGGATGAGCAC59
JAK1/2-RCTGGCAAGTCCCGATGA
Table 2. Information of four immune key genes in the immune-related KEGG pathway.
GenesFold ChangeUp/Down RegulationPathway
Toll1.6164UpToll and Imd signaling pathway
PAK11.2329UpChemokine signaling pathway
Fc γ R-mediated phagocytosis
Natural killer cell mediated cytotoxicity
GSK3B1.2959UpmTOR signaling pathway
Chemokine signaling pathway
Wnt signaling pathway
T cell receptor signaling pathway
IL-17 signaling pathway
B cell receptor signaling pathway
IKKα−5.0217DownmTOR signaling pathway
Chemokine signaling pathway
NOD-like receptor signaling pathway
T cell receptor signaling pathway
Toll-like receptor signaling pathway
IL-17 signaling pathway
Th17 cell differentiation
B cell receptor signaling pathway
NF-kappa B signaling pathway
RIG-I-like receptor signaling pathway
Cytosolic DNA-sensing pathway
Th1 and Th2 cell differentiation
Note: Gene information in KEGG pathway of M. rosenbergii infecting with A. veronii at 6 h. In fold change, positive numbers represent gene up-regulation and negative numbers represent gene down-regulation.
Table 3. Relevant DEGs information in the phagosome and lysosome pathways.
PathwayGenesFold ChangeUp/Down RegulationGenesFold ChangeUp/Down Regulation
PhagosomeF-actin1.7692UpDvnein−1.2674Down
TUBB2.9491UpLAMP−7.1505Down
PIKFYVE1.1451UpαVβ5−3.1955Down
M6PR1.315Upα2β1−2.9904Down
NOS5.1266Upβ1−1.4217Down
DCSIGN2.472UpSRB1−2.3453Down
LysosomeLIPA1.7805UpLGMN−1.3984Down
LYPLA1.6242UpGLB−2.5314Down
ACP21.7805UpGAA−1.8661Down
CLN72.5625UpGBA−1.9262Down
LAMAN−5.2917DownNAGLU−2.5669Down
GANLS−2.0659DownGUSB−2.8311Down
SGSH−2.5976DownHXA/P−3.5577Down
GM2A−2.4086DownLAMP−7.1505Down
CLN1−1.498DownHGSNAT−1.2058Down
GGAS−1.2001Down
Note: DEGs information in phagosome and lysosome pathways of M. rosenbergii infected with A. veronii at 6 h. In fold change, positive numbers represent gene up-regulation and negative numbers represent gene down-regulation.
Disclaimer/Publisher’s Note: The statements, opinions and data contained in all publications are solely those of the individual author(s) and contributor(s) and not of MDPI and/or the editor(s). MDPI and/or the editor(s) disclaim responsibility for any injury to people or property resulting from any ideas, methods, instructions or products referred to in the content.

