Article

Relevance of PNPLA3, TM6SF2, HSD17B13, and GCKR Variants to MASLD Severity in an Egyptian Population

1
Department of Pharmaceutical Biochemistry, Faculty of Pharmacy, Alexandria University, Alexandria 21521, Egypt
2
Faculty of Pharmacy, Alexandria University, Alexandria 21521, Egypt
3
Department of Internal Medicine and Hepatology, Faculty of Medicine, Alexandria University, Alexandria 21131, Egypt
4
Institute of Graduate Studies and Research, Alexandria University, Alexandria 21526, Egypt
5
Department of Experimental and Clinical Internal Medicine, Medical Research Institute, Alexandria University, Alexandria 21561, Egypt
6
Translational and Clinical Research Institute, Faculty of Medical Sciences, The Medical School, Newcastle University, Framlington Place, Newcastle upon Tyne NE2 4HH, UK
*
Author to whom correspondence should be addressed.
These authors contributed equally to this work.
Genes 2024, 15(4), 455; https://doi.org/10.3390/genes15040455
Submission received: 9 March 2024 / Revised: 28 March 2024 / Accepted: 1 April 2024 / Published: 4 April 2024
(This article belongs to the Section Molecular Genetics and Genomics)

Abstract

:
Metabolic dysfunction-associated steatotic liver disease (MASLD), formerly known as non-alcoholic fatty liver disease (NAFLD), is a frequent clinical condition globally. Single nucleotide polymorphisms (SNPs) associated with NAFLD have been proposed in the literature and based on bioinformatic screening. The association between NAFLD and genetic variants in Egyptians is still unclear. Hence, we sought to investigate the association of some genetic variants with NAFLD in Egyptians. Egyptians have been categorized into either the MASLD group (n = 205) or the healthy control group (n = 187). The severity of hepatic steatosis and liver fibrosis was assessed by a Fibroscan device. TaqMan-based genotyping assays were employed to explore the association of selected SNPs with MASLD. PNPLA3 rs738409 C>G variant is associated with the presence of MASLD with liver fibrosis, the severity of both hepatic steatosis and liver fibrosis, increased systolic and diastolic blood pressure and increased alanine aminotransferase (all p < 0.05), while the TM6SF2 rs58542926 C>T, HSD17B13 rs9992651 G>A, and GCKR rs1260326 T>C variants were not (all p > 0.05). The TM6SF2 rs58542926 T allele is associated with increased fasting blood glucose and a decreased waist circumference. The GCKR rs1260326 C allele is associated with decreased aspartate transaminase and diastolic blood pressure (all p < 0.05). Only after adjusting for the risk factors (age, sex, BMI, WC, HDL, TG, diabetes mellitus, and hypertension) F2 liver fibrosis score is negatively correlated with the HSD17B13 rs9992651 GA genotype. This study offers evidence for the association of the PNPLA3 rs738409 C>G variant with MASLD among Egyptians and for the association of the PNPLA3 rs738409 G allele, the TM6SF2 rs58542926 T allele, and the GCKR rs1260326 C allele with some parameters of cardiometabolic criteria.

1. Introduction

Metabolic dysfunction-associated steatotic liver disease (MASLD), formerly known as non-alcoholic fatty liver disease (NAFLD) [1], is a widespread clinical condition that affects about a quarter of all adults globally. It is the second-most frequent cause of liver transplantation in the United States. It refers to a group of disorders that range from simple steatotic liver disease to metabolic dysfunction-associated steatohepatitis (MASH), which can lead to liver fibrosis, cirrhosis, and hepatocellular carcinoma (HCC) [2]. Although it is common in obese people, it can also occur in non-obese people [3].
Egypt is one of the top 10 countries with the highest rates of obesity in the world. According to World Health Organization (WHO) figures, almost 75% of Egyptians have a high BMI, putting them at risk for NAFLD development. More than one-third of Egyptians are affected by NAFLD, which has a direct clinical and economic burden [4]. It was shown previously in a retrospective analysis that included 2097 Egyptian patients that the most common reason for patient presentation at liver centers is NAFLD (44.9%). Unfortunately, it appears that Egyptian patients and physicians are insufficiently aware of the issue, with some patients diagnosed with NAFLD after cirrhosis has already occurred [5].
Single nucleotide polymorphisms (SNPs) have been proposed to identify the genetic association with different diseases and their complications. SNPs associated with NAFLD have been proposed in the literature and based on bioinformatic screening. Strong evidence for the heredity of NAFLD comes from epidemiology, family aggregation, and data from twin studies. Heritability estimates range from 20% to 70% based on ethnicity, study design, environmental factors, and the methodologies used to characterize NAFLD [6]. The first gene variant found to have a consistent genetic association with NAFLD was the patatin-like phospholipase domain containing 3 (PNPLA3 rs738409 C>G) [7], and this association has been replicated extensively [8,9,10,11,12,13,14,15,16,17,18,19]. PNPLA3-induced steatohepatitis patients are known to be associated with developing liver fibrosis, cirrhosis, and, ultimately, HCC. In addition, other studies have shown that transmembrane 6 superfamily 2 (TM6SF2 rs58542926 C>T) and hydroxysteroid 17-beta dehydrogenase 13 (HSD17B13 rs9992651 G>A) are also associated with NAFLD development [18,20,21,22]. Another study revealed that the TM6SF2 rs58542926 C>T variant shows no significant correlation with NAFLD [23]. Some studies also show a role for the glucokinase regulatory protein in NAFLD (GCKR rs1260326 T>C) [18,24]. The genetic association with NAFLD may be modified by the change in the population [7,14,25,26]. The association between NAFLD and genetic variants in Egyptian subjects is still unclear. Hence, we sought to investigate the association of these genetic variants with NAFLD in Egyptian patients.

2. Patients and Methods

2.1. Bioinformatic Analysis

A protein–protein interaction network was generated using the STRING web-based tool to verify the interaction between the selected genes [27].
Prediction of the impact of the selected genetic variants on protein function was performed using the SIFT 6.2.1 predictive tool [28,29].
Homology modeling was performed using the SWISS-MODELworkspace to generate a 3D model of PNPLA3. Two models were generated using the template PDB ID: Q9NST1.1.A, one with position 148 as Isoleucine and another with the variant p.Ile148Met. Pymol (The PyMOL Molecular Graphics System, Version 3.0) was used to visualize the models and measure the polar distances at position 148 [30].
To evaluate the relationship between selected sequences, a phylogenetic analysis was performed using the UPGMA method in MEGA X (Version 10.1.8) software. The tree is drawn to scale, and the evolutionary distances were computed using the Poisson correction method and are in units of the number of amino acid substitutions per site [31].

2.2. Patients

Egyptian patients who participated in this study were recruited from Alexandria University hospitals between 1 January 2021 and 1 December 2022. A total of 392 participants signed a written consent document. These individuals have been categorized into either the MASLD group (n = 205) or the healthy control group (n = 187). A subgroup of 131 individuals with liver fibrosis in MASLD was compared with 187 control individuals; age, sex, waist circumference (WC), body mass index (BMI), systolic blood pressure (SBP), and diastolic blood pressure (DBP) were included in the information.
Biochemical analysis: plasma aspartate aminotransferase (AST), alanine aminotransferase (ALT), gamma-glutamyl transferase (GGT), fasting blood sugar (FBS), post-prandial blood sugar (PPBS), total cholesterol (TC), serum low-density lipoprotein cholesterol (LDL-C), serum high-density lipoprotein cholesterol (HDL-C), and triglycerides (TG) were measured for all participants [32].
Cases were defined as having steatotic liver disease (SLD) based on the evidence of steatotic liver using a Fibroscan device. Patients with controlled attenuation parameter (CAP) scores equal to or greater than 238 dB/m (decibels per meter) were included. The presence of at least one out of five cardiometabolic adult criteria defines patients who are currently diagnosed with MASLD. Other causes of chronic liver diseases, including alcohol intake, drug-induced fatty liver, chronic viral hepatitis B and C, autoimmune hepatitis, hemochromatosis, α1-antitrypsin deficiency, Wilson’s disease, and Celiac disease, were excluded from our study.
Cardiometabolic criteria of the study population: (1) BMI ≥ 25 kg/m2 or WC > 94 cm for males (M) and 80 cm for females (F), (2) FBG ≥ 100 mg/dL or PPBS ≥ 140 mg/dL or treatment for type 2 diabetes, (3) BP ≥ 130/85 mmHg or specific antihypertensive drug treatment, (4) TG ≥ 150 mg/dL or lipid-lowering treatment, (5) HDL-C ≤ 40 mg/dL (M) and ≤50 mg/dL (F) or lipid-lowering treatment (1).
Controls were defined as having no SLD based on no evidence of steatotic liver using a Fibroscan device. Healthy subjects with CAP scores less than 238 dB/m, normal liver enzymes and functions, and a normal liver on ultrasonography were included. The same exclusion criteria were applied to the control group.

2.2.1. Evaluation of the Stages of Hepatic Steatosis and Liver Fibrosis

According to the manufacturer’s guidelines, we used a Fibroscan device (FibroScan® Mini+ 430 Model by Echosens manufacturer, Paris, France), which can measure a volume of liver tissue 100 times the size of a liver biopsy, which minimizes sampling error [33]. A controlled attenuation parameter (CAP) scores less than 238 dB/m (decibels per meter)-denotes a healthy liver with no steatosis, 238 to 260 dB/m, 260 to 290 dB/m, and 290 dB/m or more indicate, S1, S2, and S3, respectively. A liver with no or minimal scarring has a fibrosis score of F0 to F1 (2 to 7 kPa). The F2 fibrosis score (7.5 to 10 kPa) indicates a considerable amount of scarring that has extended outside the liver. The F3 fibrosis score (10 to 14 kPa) denotes extensive scarring that has spread and interferes with normal blood flow; the F4 fibrosis score (14 kPa or more) indicates late-stage scarring, often known as cirrhosis, in which the damage and the scarring are irreversible [34].

2.2.2. Genotyping

Genomic DNA extraction from blood samples was performed using a QIAamp (Qiagen, Hilden, Germany) DNA Blood Mini Kit, following the manufacturer’s instructions. To evaluate the extracted DNA qualitatively and quantitatively, we used a Thermo Scientific Nanodrop 2000 spectrophotometer, Wilmington, NC, USA. Each DNA sample underwent genotyping analysis for the variants PNPLA3 rs738409 C>G, TM6SF2 rs58542926 C>T, HSD17B13 rs9992651 G>A, and GCKR rs1260326 T>C. Using TaqMan SNP Genotyping Assays (ThermoFisher, Waltham, MA, USA), the experiment was conducted on a QuantStudio Real-Time PCR System (Applied Biosystems, ThermoFisher, Waltham, MA, USA). TaqMan Genotype Software (Applied Biosystems, QuantStudioTM Design & Analysis Software v1.4.1) was used to analyze these data for genotype, and allelic discrimination plots were created to show the genotypes of all samples.

2.3. Statistical Analysis

The statistical tests utilized were the Chi-square test to contrast various groupings using categorical variables, Monte Carlo or Fisher’s exact correction to correct Chi-square when more than 20% of the cells have an expected count that is less than 5, the Mann–Whitney test to compare two groups under study for quantitative variables with aberrant distributions, and the Kolmogorov–Smirnov test to examine the normality of the distribution. Regression analysis was used, and adjusted model regression analysis was used to correct age, sex, BMI, WC, HDL, TG, diabetes mellitus, and hypertension.
Confidence intervals (CI) set to 95% with odds ratios (OR) were used to express multivariable studies. These data were analyzed using the IBM SPSS software package, version 20.0. (Armonk, NY, USA: IBM Corp.). Qualitative data were described by numbers and percentages. Quantitative data were characterized by the range (minimum and maximum), mean, standard deviation, median, and interquartile range (IQR). At the 5% level, the statistical significance of the results was determined.
A power calculation of sample size to evaluate the effect of genetic variations in MASLD was performed using Gpower 3.1.9.4 software. These power calculations are summarised in Table S9. False Discovery Rate (FDR) correction for multiple comparisons was performed using the Benjamini and Hochberg method. The control group for each SNP was explored to find its equilibrium with the Hardy–Weinberg Equilibrium (HWE) using HW_TEST software v.1.1 [35]. These HWE calculations are in Table S1.

3. Results

3.1. Bioinformatic Analyses

Using the Genome-wide association studies (GWAS) catalog, four SNPs associated with MASLD were selected, namely PNPLA3 rs738409 C>G, TM6SF2 rs58542926 C>T, HSD17B13 rs9992651 G>A, and GCKR rs1260326 T>C, and ranked based on their p-value (Figure S1A). The protein TM6SF2 is co-expressed with GCKR and HSD17B13, whereas PNPLA3 is only co-expressed with GCKR (Figure S1B). From the four selected SNPs, only rs738409 C>G in PNPLA3 was predicted to be deleterious as it has a substitution score < 0.05 and causes the substitution of isoleucine to methionine. The SNPs rs58542926 C>T and rs1260326 T>C in TM6SF2 and GCKR, respectively, were predicted to be tolerated, though they did not result in a silent mutation. It is worth mentioning that rs9992651 G>A in HSD17B13 is an intron variant with no known effects on the protein (Figure S1C).
The PNPLA3 rs738409 C>G G allele results in a non-synonymous substitution (Figure S2). Multiple sequence alignments of PNPLA3 among different species (such as mice and rats as well as in common domestic animals) revealed that position 148 (isoleucine) is highly conserved (Figure S3A). The phylogenetic analysis revealed an average similarity of 76% (Figure S3B) upon comparing the human PNPLA3 protein sequence with the sequence of common orthologues.Distance calculations showed that having a methionine at position 148 increased the polar distances (Figure S4).

3.2. Baseline Characteristics of the Study Population

All cases were diagnosed with MASLD. A total of 392 participants were categorized into either the MASLD group (n = 205) or the healthy control group (n = 187). The clinical, demographic, and biochemical characteristics of the participants are listed in Table 1. Compared with those without MASLD, participants with MASLD were found to be older, diabetic or prediabetic, hypertensive, more likely to be male, and had higher hepatic steatosis degree, liver fibrosis degree, body mass index (BMI), waist circumference (WC), systolic blood pressure (SBP), diastolic blood pressure (DBP), alanine aminotransferase (ALT), aspartate transaminase (AST), gamma-glutamyl transpeptidase (GGT), fasting blood glucose (FBG), post-prandial blood sugar (PPBS), total cholesterol (TC), triacylglyceride (TG), and low-density lipoprotein cholesterol (LDL-C) levels, yet lower levels of high-density lipoprotein cholesterol (HDL-C) (all p < 0.05).

3.3. Genotype Data

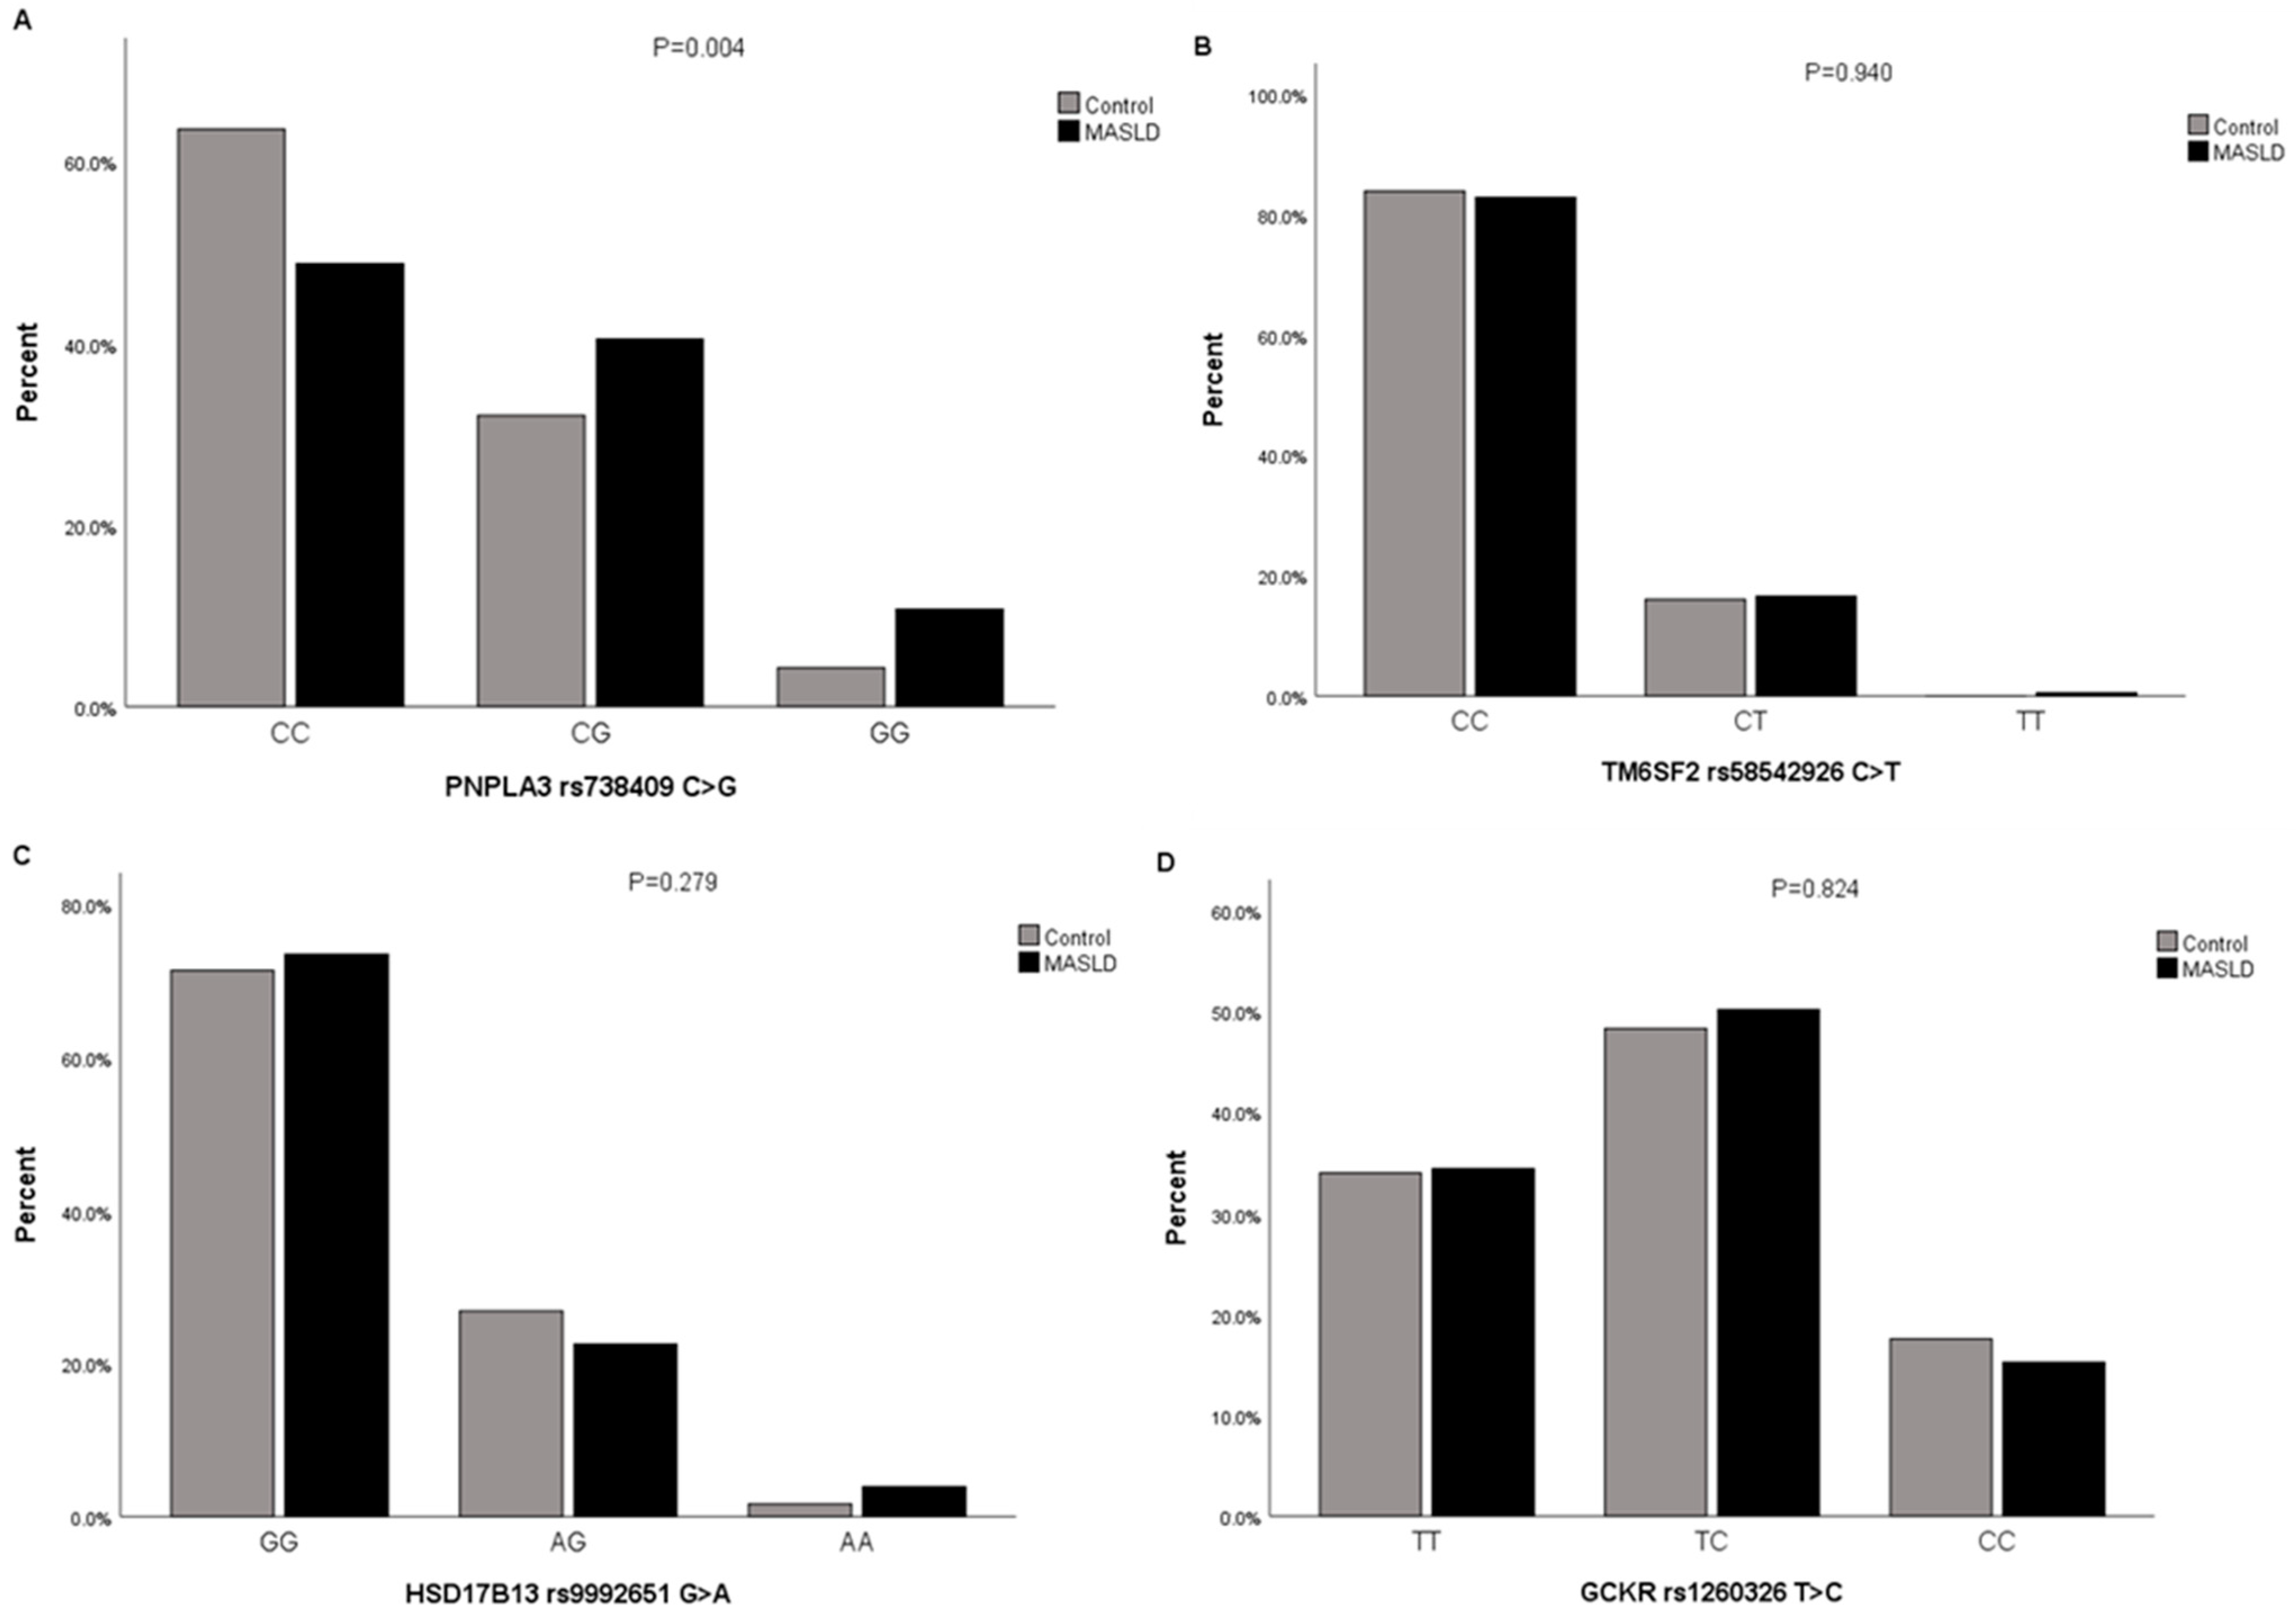
3.3.1. The Proportions of Participants with Genotypes and Alleles of PNPLA3 rs738409 C>G, TM6SF2 rs58542926 C>T, HSD17B13 rs9992651 G>A, and GCKR rs1260326 T>C in MASLD Cases and Controls

The proportions of participants with and without MASLD in different genotypes of PNPLA3 rs738409 C>G were assessed (p = 0.004, FDR corrected p-value = 0.016). CC genotype carriers in MASLD cases had a lower proportion than those in the controls (48.8% vs. 63.6%), CG genotype carriers in MASLD cases had a higher proportion than those in the controls (40.5% vs. 32.1%), GG genotype carriers in MASLD cases had a higher proportion than those in the controls (10.7% vs. 4.3%). However, no statistically significant differences in the TM6SF2 rs58542926 C>T, HSD17B13 rs9992651 G>A, and GCKR rs1260326 T>C genotypes were observed among the groups (Figure 1A–D) (Table S1).
The proportions of participants with and without MASLD in different alleles of PNPLA3 rs738409 C>G were also assessed (p = 0.001). C allele carriers in MASLD cases had a lower proportion than those in the controls (69% vs. 79.7%), and G allele carriers in MASLD cases had a higher proportion than those in the controls (31% vs. 20.3%); however, no statistically significant differences in the TM6SF2 rs58542926 C>T, HSD17B13 rs9992651 G>A, and GCKR rs1260326 T>C alleles were observed among the groups (Table S1).

3.3.2. Association of Genotypes of PNPLA3 rs738409 C>G, TM6SF2 rs58542926 C>T, HSD17B13 rs9992651 G>A, and GCKR rs1260326 T>C with MASLD by Logistic Regression Analysis

A single logistic regression analysis (Table 2) for the association of PNPLA3 rs738409 C>G with MASLD showed statistical significance with an increased odds ratio. MASLD was positively correlated with the GG genotype (OR = 3.272, 95%CI 1.396–7.670, p = 0.006) and the CG genotype (OR = 1.646, 95%CI 1.076–2.519, p = 0.022). Single logistic regression analyses for TM6SF2 rs58542926 C>T, HSD17B13 rs9992651 G>A, and GCKR rs1260326 T>C did not show statistical significance.
After adjusting for the risk factors (age, sex, BMI, WC, HDL, TG, diabetes mellitus, and hypertension) (Table 2), MASLD was positively correlated only with the GG genotype (OR = 9.166, 95%CI 1.123–74.832, p = 0.039). Analysis after correction for the risk factors for TM6SF2 rs58542926 C>T, GCKR rs1260326 T>C and HSD17B13 rs9992651 G>A did not show statistical significance.

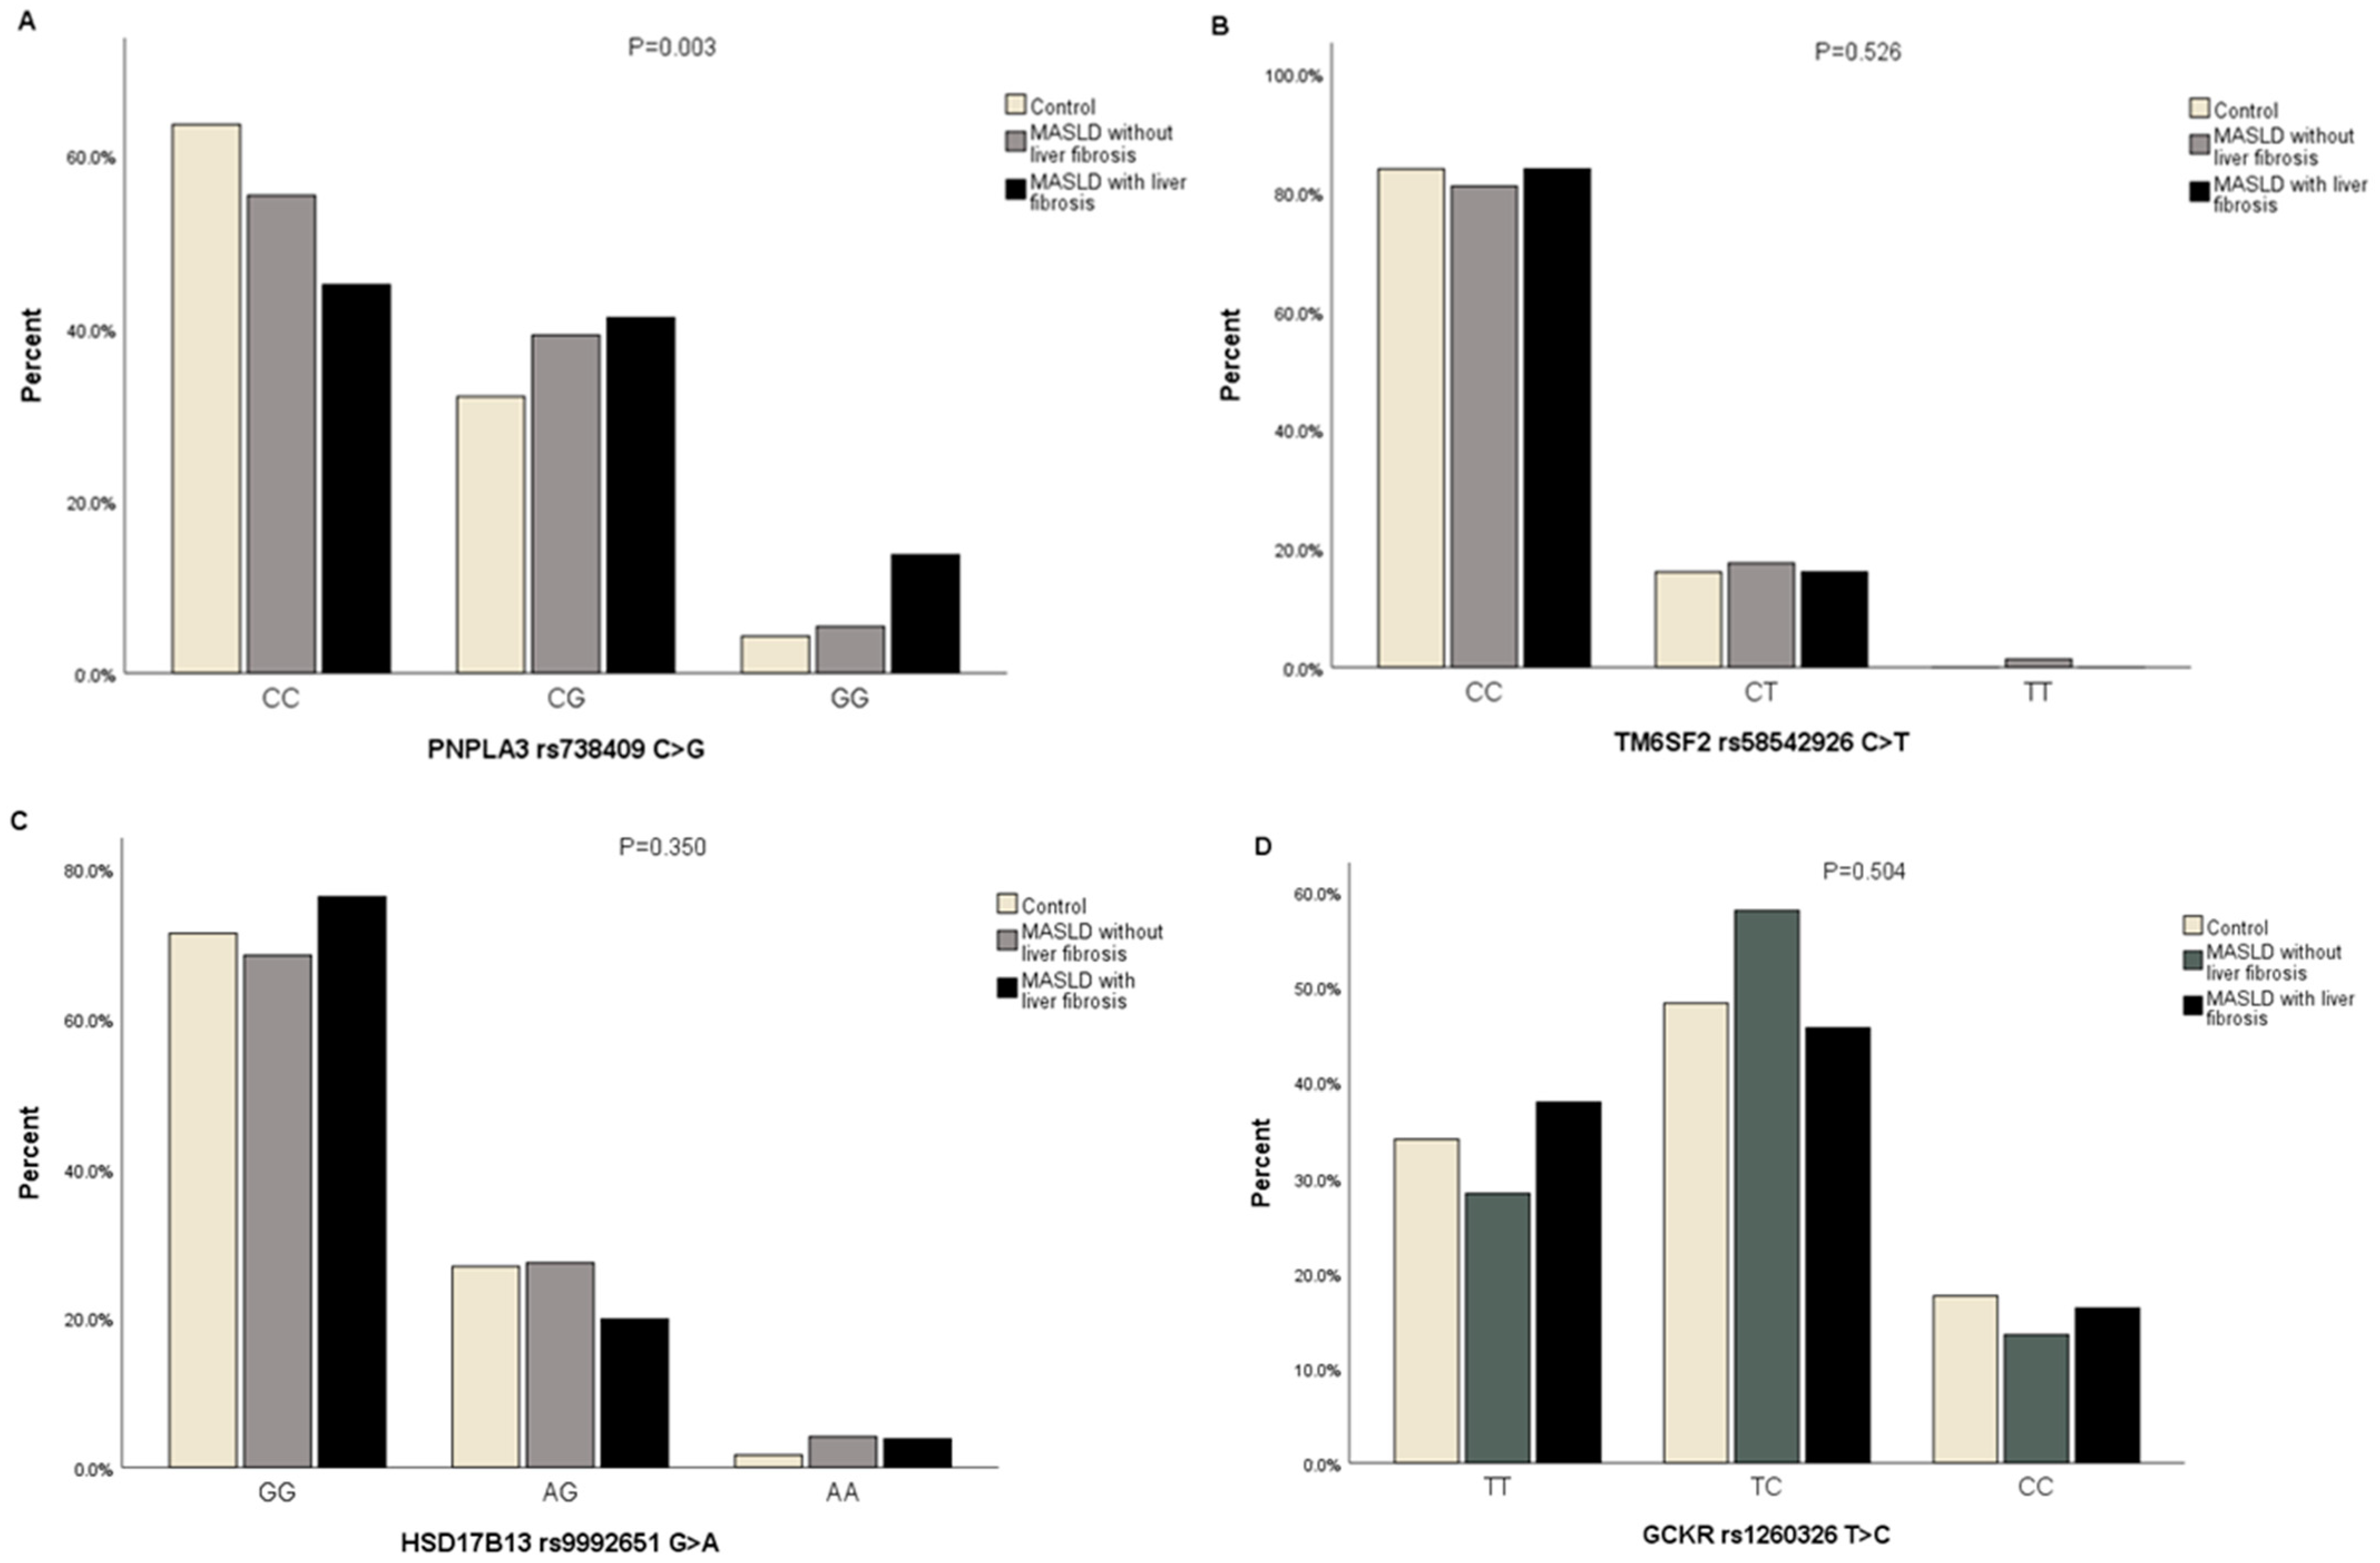
3.3.3. The Proportions of Participants with Genotypes of PNPLA3 rs738409 C>G, TM6SF2 rs58542926 C>T, HSD17B13 rs9992651 G>A, and GCKR rs1260326 T>C in MASLD Cases with Liver Fibrosis, MASLD Cases without Liver Fibrosis, and Controls

The proportions of cases with and without liver fibrosis in MASLD and controls in different genotypes of PNPLA3 rs738409 C>G were assessed (p = 0.003, FDR corrected p-value = 0.012). CC genotype carriers with liver fibrosis in MASLD cases had a lower proportion than those in cases without liver fibrosis and controls (45% vs. 55.4% vs. 63.6%); CG genotype carriers with liver fibrosis in MASLD cases had a higher proportion than those in cases without liver fibrosis and controls (41.2% vs. 39.2 vs. 32.1%). Moreover, GG genotype carriers with liver fibrosis in MASLD cases had a higher proportion than those in cases without liver fibrosis and controls (13.7% vs. 5.4 vs. 4.3%). However, no statistically significant differences in TM6SF2 rs58542926 C>T, HSD17B13 rs9992651 G>A, and GCKR rs1260326 T>C genotypes were observed among the groups (Figure 2A–D) (Table S2).
The proportions of cases with and without liver fibrosis in MASLD and controls in different alleles of PNPLA3 rs738409 C>G were also assessed (p < 0.001). C allele carriers with liver fibrosis in MASLD cases had a lower proportion than those in cases without liver fibrosis and controls (65.6% vs. 75% vs. 79.7%), G allele carriers with liver fibrosis in MASLD cases had a higher proportion than those in cases without liver fibrosis and controls (34.4% vs. 25% vs. 20.3%). However, no statistically significant differences in the TM6SF2 rs58542926 C>T, HSD17B13 rs9992651 G>A, and GCKR rs1260326 T>C alleles were observed among the groups (Table S2).

3.3.4. Association of Genotypes of PNPLA3 rs738409 C>G, TM6SF2 rs58542926 C>T, HSD17B13 rs9992651 G>A, and GCKR rs1260326 T>C with MASLD with Liver Fibrosis and MASLD without Liver Fibrosis

Logistic regression analysis (Table 3) for the association of PNPLA3 rs738409 C>G with MASLD with liver fibrosis and MASLD without liver fibrosis was assessed. MASLD with liver fibrosis was positively correlated with the GG genotype (OR = 4.538, 95%CI 1.865–11.044, p = 0.001) and the CG genotype (OR = 1.815, 95%CI 1.121–2.940, p = 0.015). MASLD without liver fibrosis did not show statistical significance with the GG and CG genotypes. Logistic regression analysis for TM6SF2 rs58542926 C>T, HSD17B13 rs9992651 G>A, and GCKR rs1260326 T>C did not show statistical significance.
After adjusting for the risk factors (age, sex, BMI, WC, HDL, TG, diabetes mellitus, and hypertension) (Table S3), the association of PNPLA3 rs738409 C>G, MASLD without liver fibrosis was positively correlated with the GG genotype (OR = 9.085, 95%CI 1.073–76.885, p = 0.043), while the CG genotype did not show statistical significance. MASLD with liver fibrosis did not show statistical significance with the GG and CG genotypes. TM6SF2 rs58542926 C>T, HSD17B13 rs9992651 G>A and GCKR rs1260326 T>C did not show statistical significance.

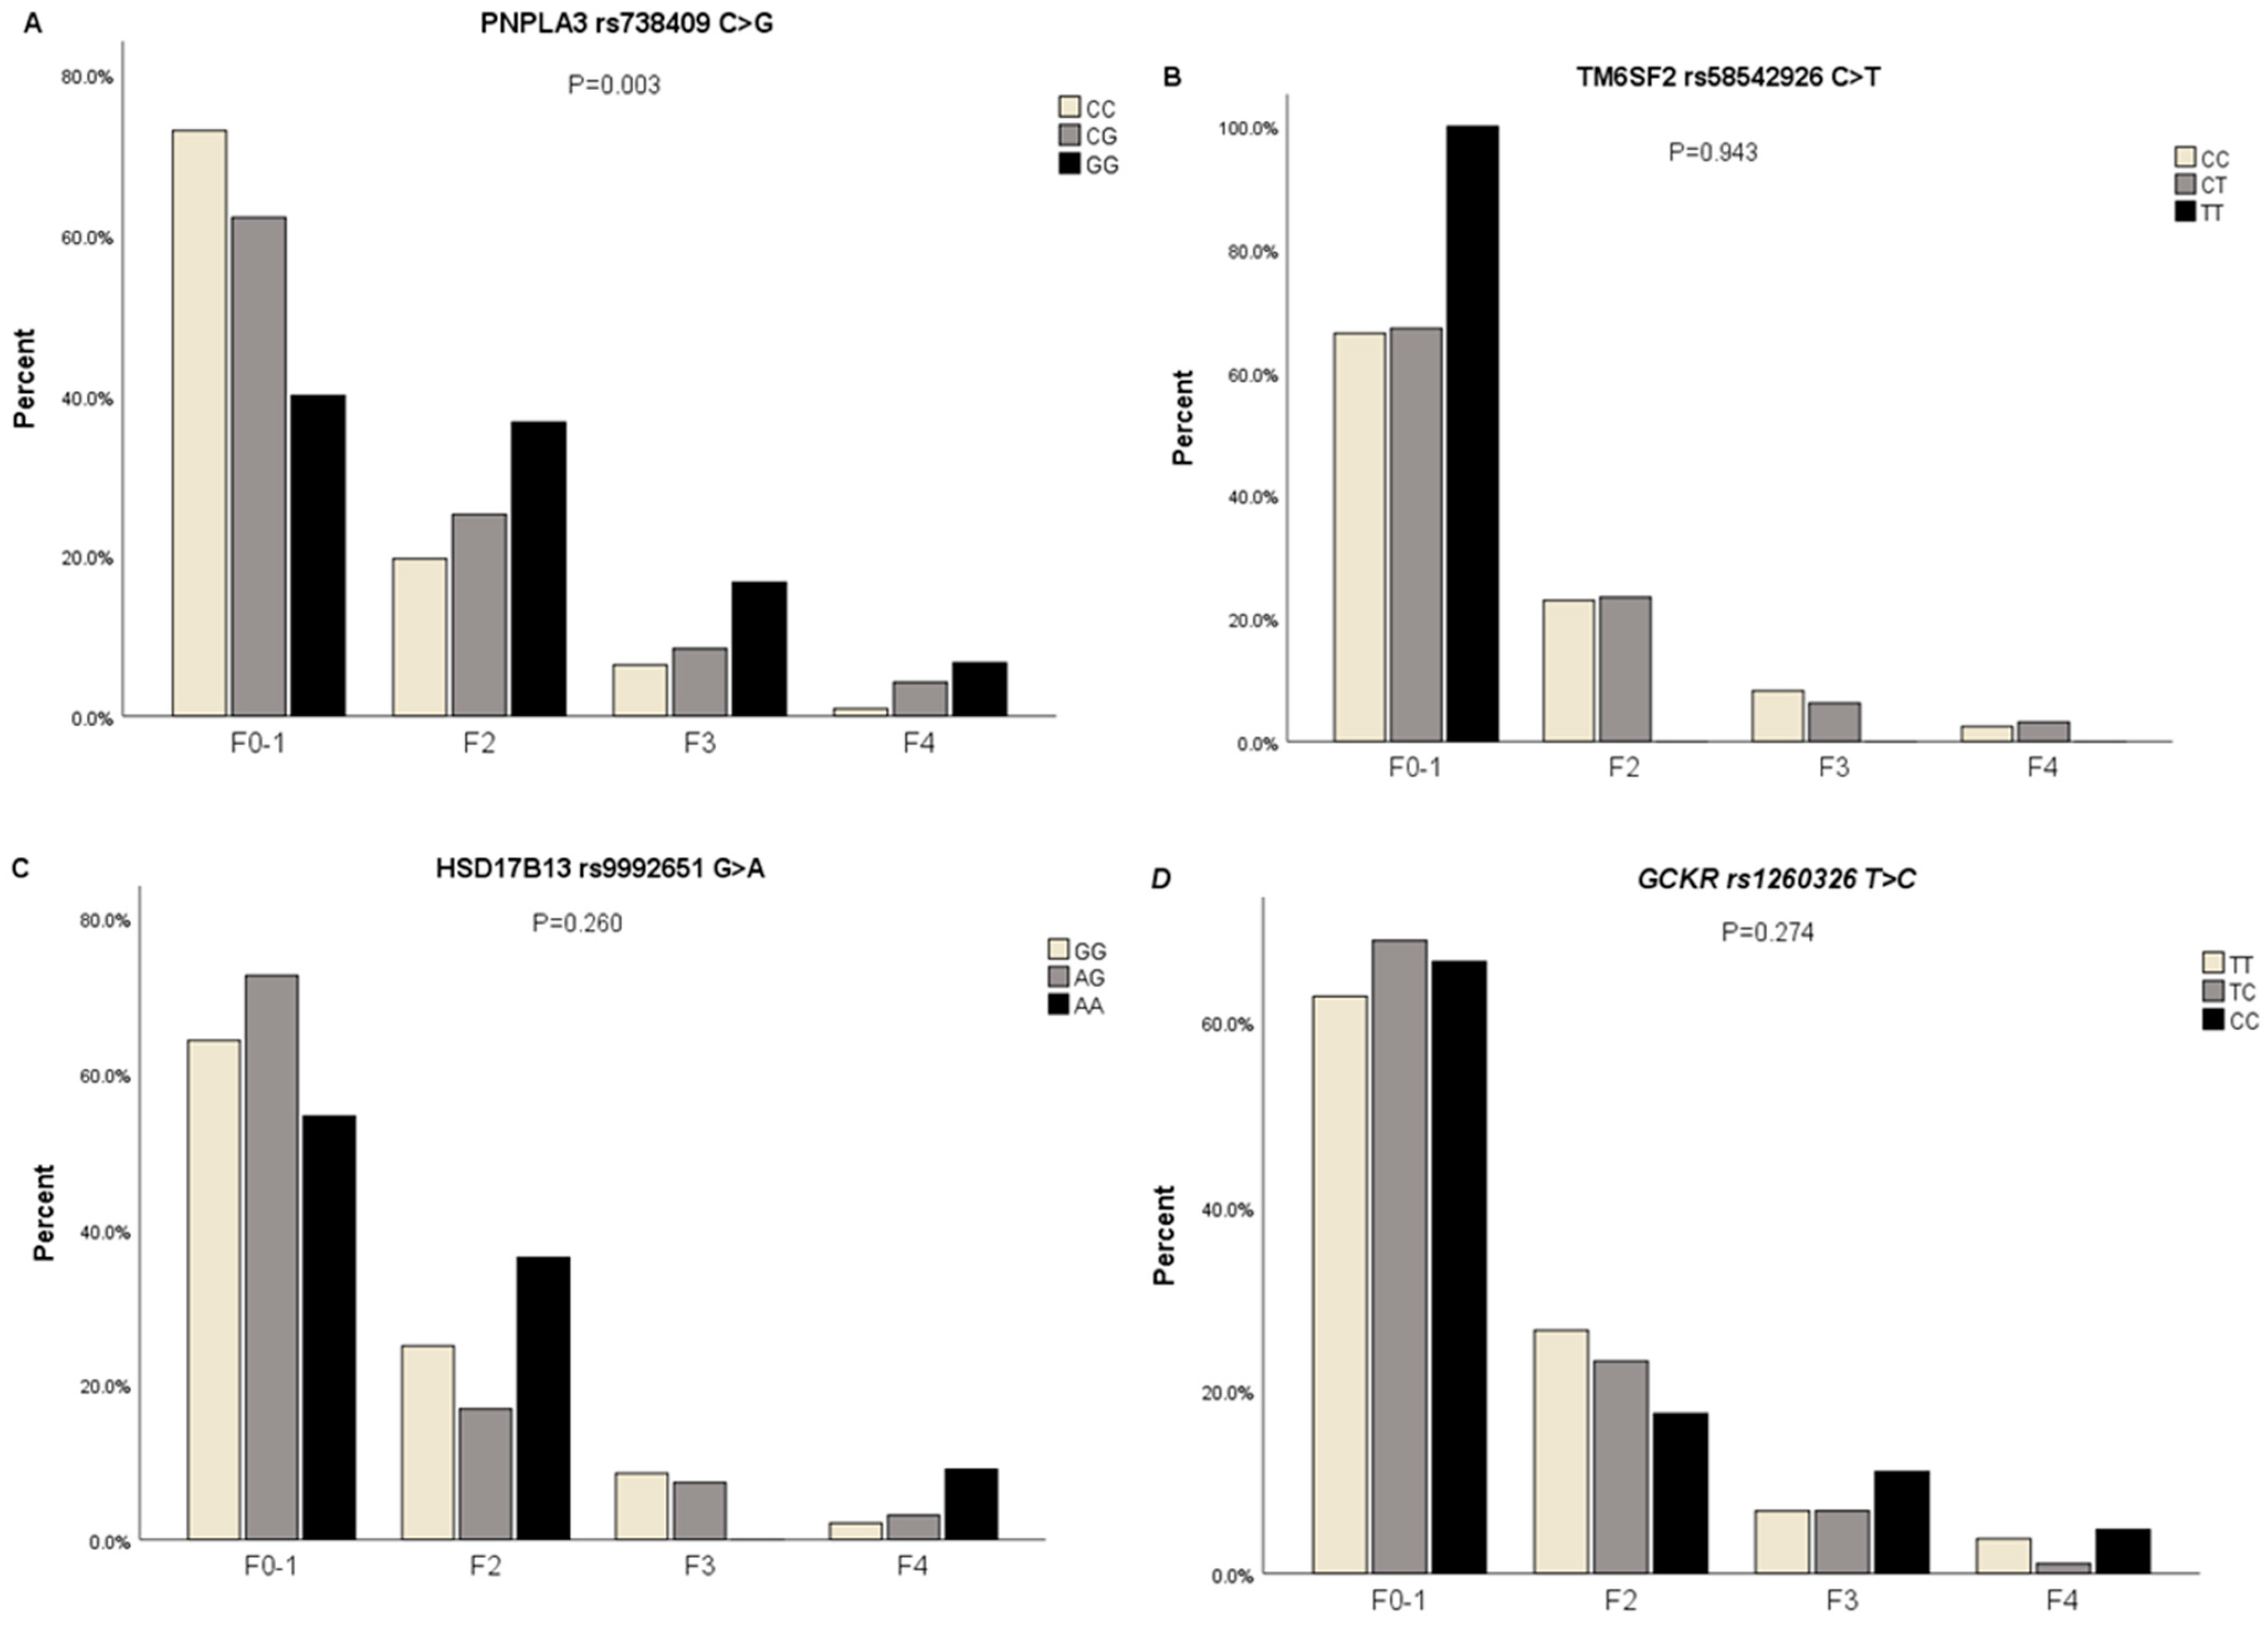
3.3.5. The Proportions of Participants with Genotypes of PNPLA3 rs738409 C>G, TM6SF2 rs58542926 C>T, HSD17B13 rs9992651 G>A, and GCKR rs1260326 T>C in Subjects with Different Severities of Liver Fibrosis

Participants were divided into F0–1, F2, F3, and F4 according to the fibrosis score using the Fibroscan device. The proportions of participants with different severities of liver fibrosis in different genotypes of PNPLA3 rs738409 C>G were assessed (p = 0.003, FDR corrected p-value = 0.012). CC genotype carriers in subjects with F0–1 liver fibrosis had a higher proportion than CG and GG genotype carriers (73% vs. 62.2% vs. 40%), CC genotype carriers in subjects with F2 liver fibrosis had a lower proportion than CG and GG genotype carriers (19.6% vs. 25.2% vs. 36.7%), CC genotype carriers in subjects with F3 liver fibrosis had a lower proportion than CG and GG genotype carriers (6.4% vs. 8.4% vs. 16.7%), and CC genotype carriers in subjects with F4 liver fibrosis had a lower proportion than CG and GG genotype carriers (1% vs. 4.2% vs. 6.7%). However, no statistically significant differences in TM6SF2 rs58542926 C>T, HSD17B13 rs9992651 G>A, and GCKR rs1260326 T>C genotypes were observed among the groups (Figure 3A–D) (Table S4).

3.3.6. Association of Genotypes of PNPLA3 rs738409 C>G, TM6SF2 rs58542926 C>T, HSD17B13 rs9992651 G>A, and GCKR rs1260326 T>C with Different Severities of Liver Fibrosis in MASLD by Logistic Regression Analysis

Logistic regression analysis (Table 4) for the association of PNPLA3 rs738409 C>G with different severities of liver fibrosis in MASLD was assessed. F2 was positively correlated with the GG genotype (OR = 3.411, 95%CI 1.408–8.262, p = 0.007), F3 was positively correlated with the GG genotype (OR = 4.762, 95%CI 1.467–15.460, p = 0.009), F4 was positively correlated with the GG genotype (OR = 13.333, 95%CI 1.724–103.145, p = 0.013), F2-F3 did not show statistical significance with the CG genotype, and F4 was positively correlated with the CG genotype (OR = 5.393, 95%CI 1.066–27.284, p = 0.042). Logistic regression analysis for TM6SF2 rs58542926 C>T, HSD17B13 rs9992651 G>A, and GCKR rs1260326 T>C did not show statistical significance.
After adjusting for the risk factors (age, sex, BMI, WC, HDL, TG, diabetes mellitus, and hypertension) (Table S5), the association of PNPLA3 rs738409 C>G, F2 was positively correlated with the GG genotype (OR = 5.482, 95%CI 1.572–19.112, p = 0.008), F3 was positively correlated with the GG genotype (OR = 9.641, 95%CI 1.493–62.233, p = 0.017), F4 was positively correlated with the GG genotype (OR = 107.296, 95%CI 1.411–8157.152, p = 0.034), F2-F3-F4 did not show statistical significance with the CG genotype. For the association of HSD17B13 rs9992651 G>A, F2 was negatively correlated with the GA genotype (OR = 0.341, 95%CI 0.148–0.787, p = 0.012). TM6SF2 rs58542926 C>T and GCKR rs1260326 T>C did not show statistical significance.

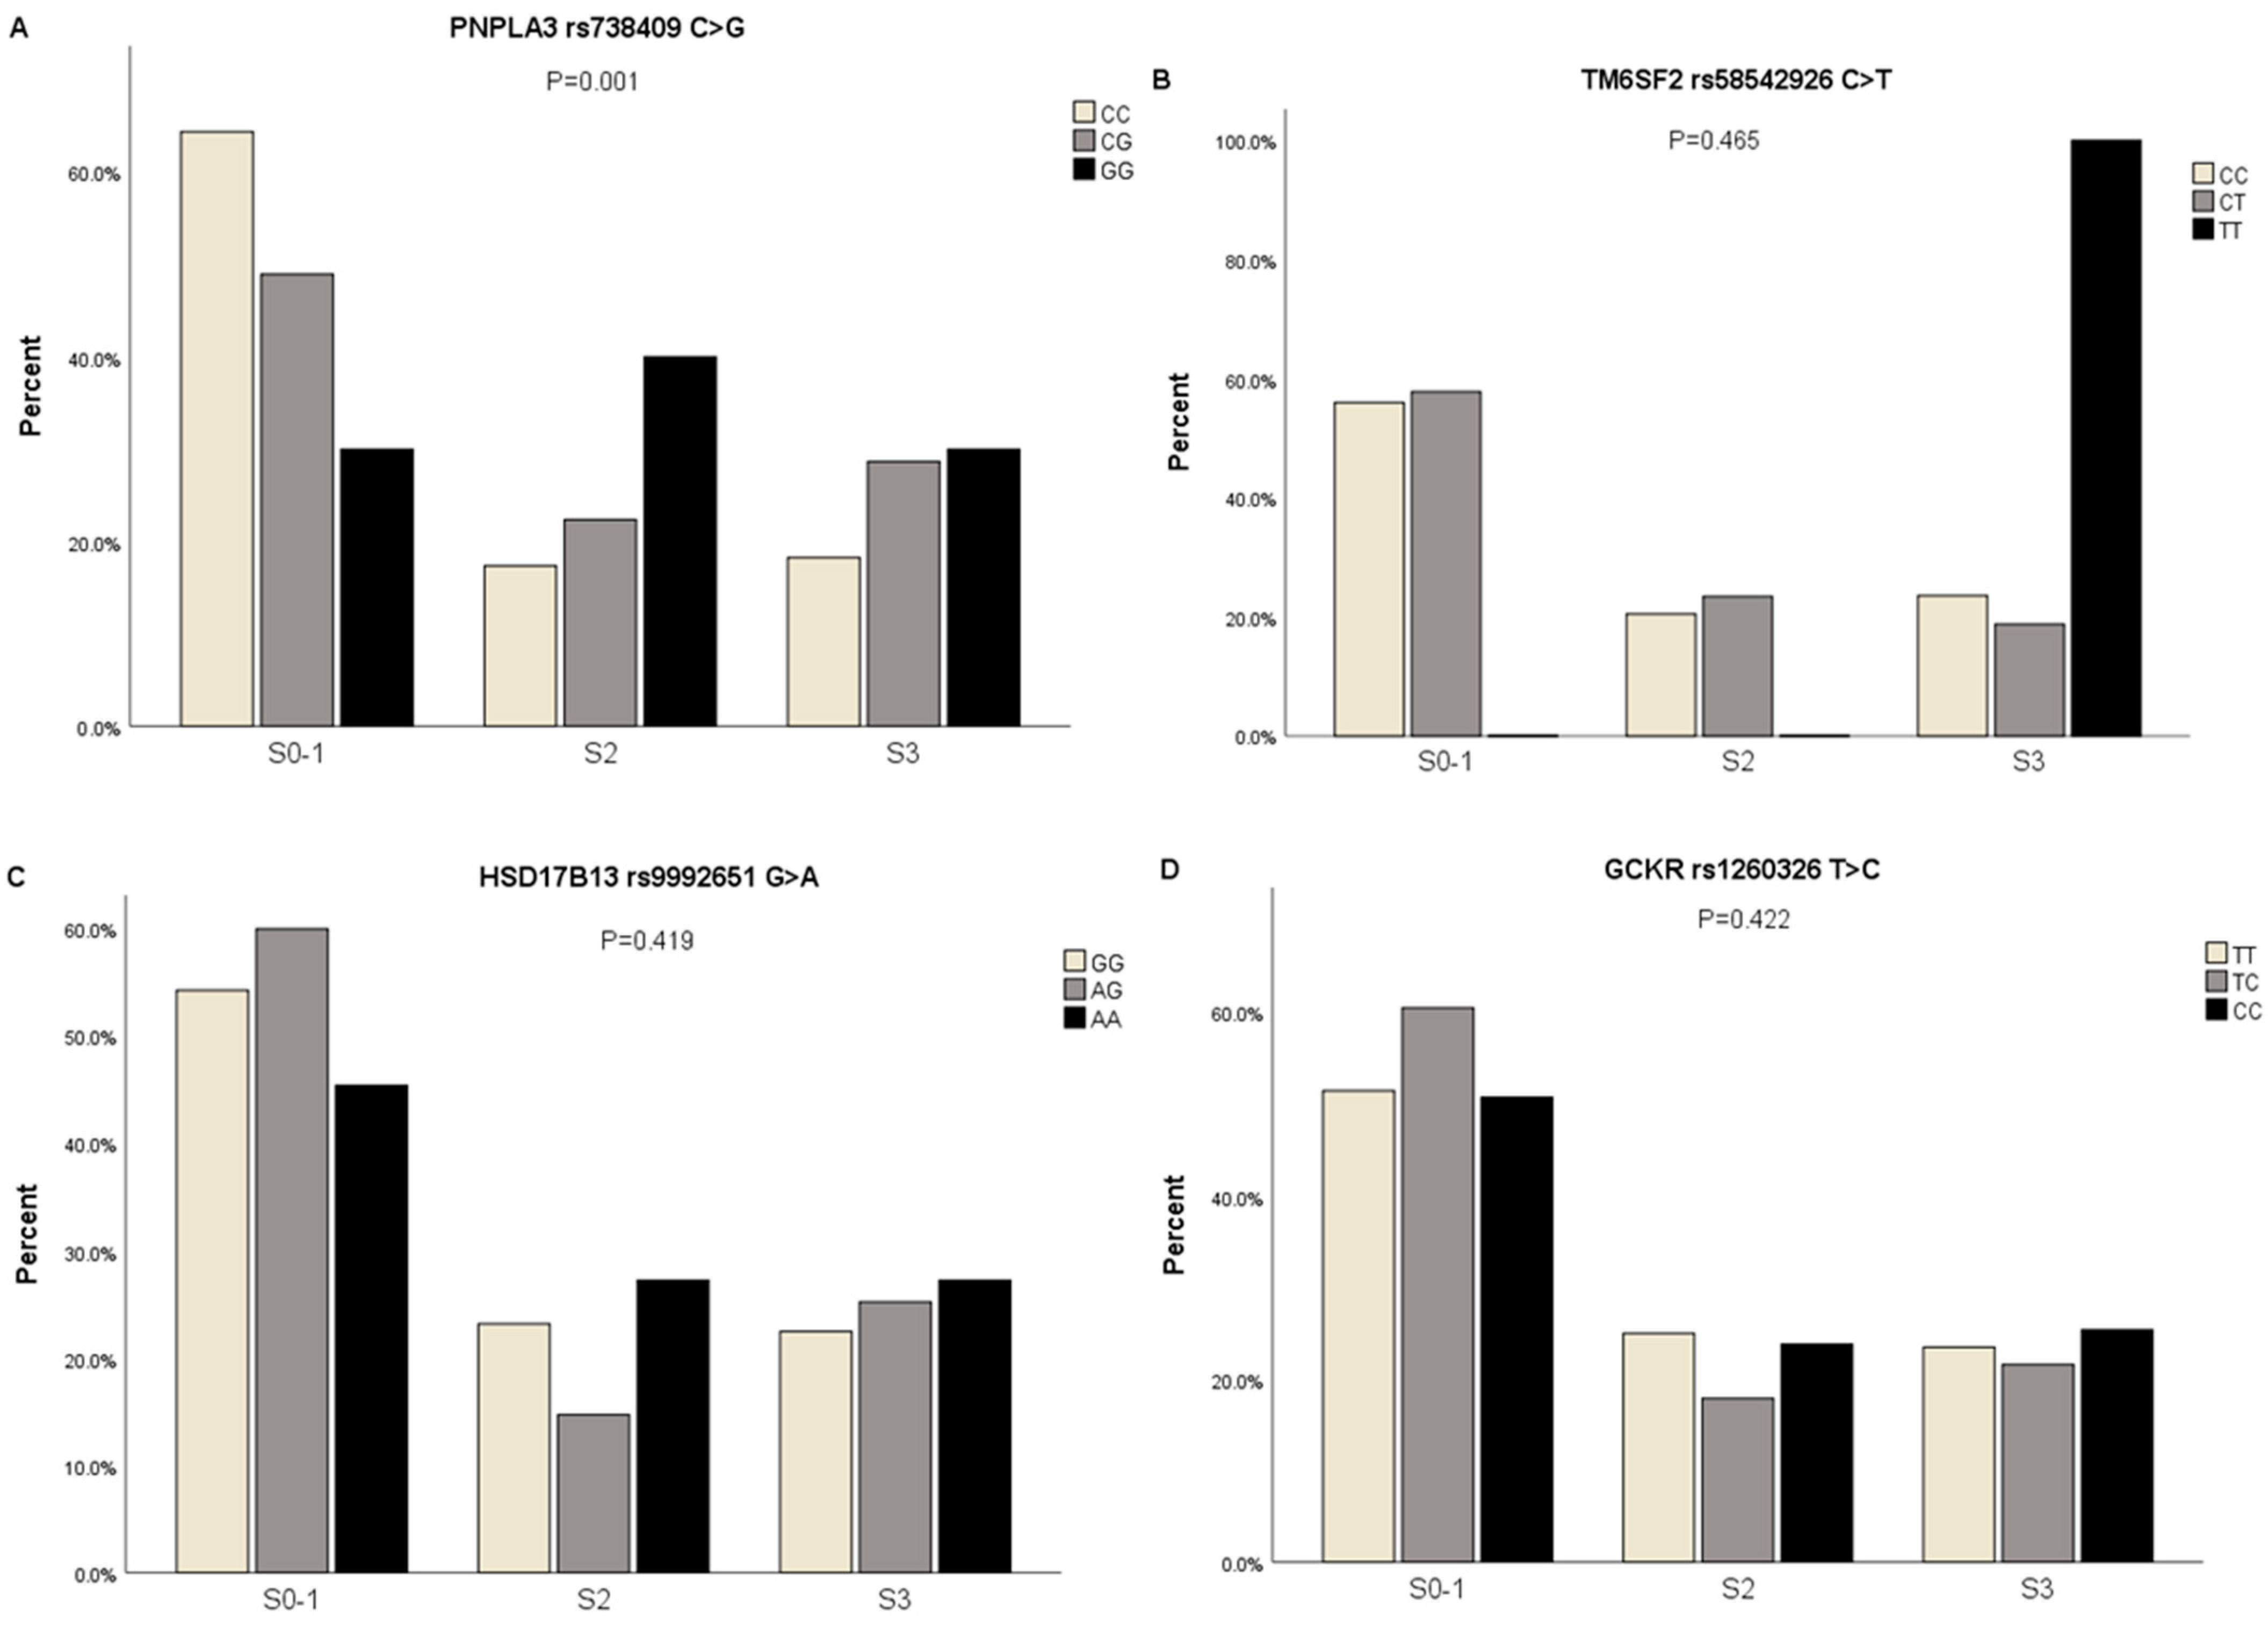
3.3.7. The Proportions of Participants with Genotypes of PNPLA3 rs738409 C>G, TM6SF2 rs58542926 C>T, HSD17B13 rs9992651 G>A, and GCKR rs1260326 T>C in Subjects with Different Severities of Hepatic Steatosis

Participants were divided into S0-1, S2, and S3 according to the CAP score using the Fibroscan device. The proportions of cases with different severities of hepatic steatosis in different genotypes of PNPLA3 rs738409 C>G were assessed (p = 0.001, FDR corrected p-value = 0.004). CC genotype carriers in subjects with S0-1 hepatic steatosis had a higher proportion than CG and GG genotype carriers (64.4% vs. 49% vs. 30%), CC genotype carriers in subjects with S2 hepatic steatosis had a lower proportion than CG and GG genotype carriers (17.4% vs. 22.4% vs. 40%), and CC genotype carriers in subjects with S3 hepatic steatosis had a lower proportion than CG and GG genotype carriers (18.3% vs. 28.7% vs. 30%). However, no statistically significant differences in TM6SF2 rs58542926 C>T, HSD17B13 rs9992651 G>A, and GCKR rs1260326 T>C genotypes were observed among the groups (Table S6) (Figure 4A–D).

3.3.8. Association of Genotypes of PNPLA3 rs738409 C>G, TM6SF2 rs58542926 C>T, HSD17B13 rs9992651 G>A, and GCKR rs1260326 T>C with Different Severities of Hepatic Steatosis in MASLD by Logistic Regression Analysis

Logistic regression analysis (Table S7) for the association of PNPLA3 rs738409 C>G with different severities of hepatic steatosis in MASLD was assessed, S2 was positively correlated with the GG genotype (OR = 4.947, 95%CI 1.941–12.609, p = 0.001), S3 was positively correlated with the GG genotype (OR = 3.525, 95%CI 1.312–9.471, p = 0.012), S2 did not show statistical significance with the CG genotype, and S3 was positively correlated with the CG genotype (OR = 2.065, 95%CI 1.226–3.478, p = 0.006). Logistic regression analysis for TM6SF2 rs58542926 C>T, HSD17B13 rs9992651 G>A, and GCKR rs1260326 T>C did not show statistical significance.

3.3.9. Clinical Characteristics of PNPLA3 rs738409 G, TM6SF2 rs58542926 T, HSD17B13 rs9992651 A, and GCKR rs1260326 C Carriers and Non-Carriers in the Study Population

The PNPLA3 rs738409 G allele is associated with increased systolic blood pressure (p = 0.029, FDR corrected p-value = 0.145), diastolic blood pressure values (p = 0.015, FDR corrected p-value = 0.113), and alanine aminotransferase levels (p = 0.002, FDR corrected p-value = 0.030). The TM6SF2 rs58542926 T allele is associated with increased fasting blood glucose levels (p = 0.017, FDR corrected p-value = 0.128). Although the waist circumference value is significantly higher in MASLD patients compared with the controls, the TM6SF2 rs58542926 T allele is associated with a decreased value of waist circumference (p = 0.013, FDR corrected p-value = 0.128). Although the aspartate transaminase levels and diastolic blood pressure values are significantly higher in MASLD patients compared with the controls, the GCKR rs1260326 C allele is associated with decreased aspartate transaminase levels (p = 0.014, FDR corrected p-value = 0.210) and diastolic blood pressure values (p = 0.043, FDR corrected p-value = 0.236). Other clinical characteristics did not show statistically significant differences between carriers and non-carriers in the study population (Table S8A,B).

4. Discussion

MASLD, formerly known as NAFLD, is a silent disease affecting about a quarter of all adults globally. GWAS validates PNPLA3 rs738409 C>G, with significant contributions from TM6SF2 rs58542926 C>T, HSD17B13 rs9992651 G>A, and GCKR rs1260326 T>C, as a risk factor for the entire histological spectrum of NAFLD at genome-wide significance levels [18,36]. PNPLA3 rs738409 C>G had the best correlation to NAFLD. Despite not being on the same chromosome, these genes are seen to be linked, as seen in the predicted protein–protein interaction network using a string database [27]. The protein TM6SF2 is co-expressed with GCKR and HSD17B13, whereas PNPLA3 is only co-expressed with GCKR. However, all four proteins were related to NAFLD. Hence, SNPs in any of these genes might affect the expression levels of these genes. Using the SIFT web-based tool, of the four selected SNPs, only rs738409 C>G in PNPLA3 was predicted to be deleterious as it has a substitution score < 0.05 and causes the substitution of isoleucine to methionine. The SNPs rs58542926 C>T and rs1260326 T>C in TM6SF2 and GCKR, respectively, were predicted to be tolerated, though they did not result in a silent mutation. It is worth mentioning that rs9992651 G>A in HSD17B13 is an intron variant with no known effects on the protein. Previously, there was a study showing that adiposity significantly increases the effect of the three variants (PNPLA3-I148M, TM6SF2-E167K, and GCKR-P446L) associated with nonalcoholic fatty liver disease (NAFLD).
The genetic association with NAFLD may be modified by the change in the population [7,14,25,26]. As yet, studies on the association of PNPLA3 rs738409 C>G, TM6SF2 rs58542926 C>T, HSD17B13 rs9992651 G>A, and GCKR rs1260326 T>C with NAFLD in the Egyptian population are still limited. To the best of our knowledge, our current study is the first to investigate the association of PNPLA3 rs738409 C>G, TM6SF2 rs58542926 C>T, HSD17B13 rs9992651 G>A, and GCKR rs1260326 T>C SNPs with clinical characteristics, the presence and severity of hepatic steatosis, and liver fibrosis in MASLD in the Egyptian population.
PNPLA3 is a triacylglycerol lipase that mediates the hydrolysis of triglycerides in adipocytes. Several studies have proven that the PNPLA3-I148M shows a modest decrease in lipolytic activity [37]. The PNPLA3 rs738409 C>G genetic variation is located in Exon 3 of the PNPLA3 gene. In other populations, all four nucleotides are represented. However, only the G allele results in a non-synonymous substitution. Though the genetic variant p.Ile148Met is not located within the active site, multiple sequence alignments of PNPLA3 among different species revealed that position 148 is highly conserved. In common model organisms such as mice and rats, as well as in common domestic animals, amino acid 148 was isoleucine, suggesting an important function in this position. The phylogenetic analysis revealed a similarity of 76%. After comparing the 3D structures of the PNPLA3 protein with those of Ile148 and Met148, distance calculations showed that having a methionine at position 148 increased the polar distances, thus hampering possible interactions that might affect protein conformation and ligand binding.
The first gene variant found to have a consistent genetic association with NAFLD was PNPLA3 rs738409 C>G [7], and this association has been replicated extensively [8,9,10,11,12,13,14,15,16,17,18,19]. PNPLA3-induced steatohepatitis patients are known to be associated with developing liver fibrosis, cirrhosis, and, ultimately, HCC. The results of the current study agree with a meta-analysis of 16 studies [11] that revealed an association between the PNPLA3 rs738409 C>G polymorphism and NAFLD, as well as the development of fibrosis in different populations around the world, not including the Egyptian population, and an association between the PNPLA3 rs738409 GG genotype and increased serum alanine aminotransferase levels.
Our results showed that PNPLA3 rs738409 C>G CG and GG genotype carriers in MASLD and liver fibrosis in MASLD cases had higher proportions than those in the controls (both p < 0.05). Logistic regression analysis for the association of PNPLA3 rs738409 C>G with MASLD and liver fibrosis in MASLD showed statistical significance with an increased odds ratio. After adjusting for the risk factors (age, sex, BMI, WC, HDL, TG, diabetes mellitus, and hypertension), the association of PNPLA3 rs738409 C>G with MASLD remained statistically significant with an increased odds ratio. As the severity of liver fibrosis in MASLD increased, PNPLA3 rs738409 C>G CG and GG genotype carriers in subjects had higher proportions than CC genotype carriers (p = 0.003). Also, as the severity of hepatic steatosis in MASLD increases, PNPLA3 rs738409 C>G CG and GG genotype carriers in subjects had higher proportions than CC genotype carriers (p = 0.001). F2-F3-F4 were positively correlated with the GG genotype (all p < 0.05), F2-F3 did not show statistical significance with the CG genotype, and F4 was positively correlated with the CG genotype (p = 0.042). S2 and S3 were positively correlated with the GG genotype (both p < 0.05), S2 did not show statistical significance with the CG genotype, and S3 was positively correlated with the CG genotype (p = 0.006). The PNPLA3 rs738409 G allele is associated with increased systolic blood pressure (p = 0.029), diastolic blood pressure values (p = 0.015), and alanine aminotransferase levels (p = 0.002). Other clinical characteristics did not show statistically significant differences between PNPLA3 rs738409 G allele carriers and non-carriers in the study population.
A meta-analysis study elucidated that polymorphisms in TM6SF2 rs58542926 C>T may have an impact on the likelihood of developing NAFLD [22]. G et al. [20] revealed that this variant was associated with NAFLD but had no statistically significant effects on fibrosis. Another study revealed that this variant shows no significant correlation with NAFLD [23]. Anstee QM et al. and others confirmed that loss-of-function variations in HSD17B13 rs9992651 G>A have been linked to the protective effect against NAFLD generally [18,21]. Abul-Husn NS et al. [38] reported a protective effect of HSD17B13 rs9992651 G>A against fibrosis but essentially none against milder steatosis. A meta-analysis including 25 studies containing 6598 cases and 19,954 controls revealed a statistically significant association of NAFLD with the GCKR rs1260326 T>C [24].
Our study suggested that TM6SF2 rs58542926 C>T, HSD17B13 rs9992651 G>A, and GCKR rs1260326 T>C polymorphisms are not associated with the presence or severity of hepatic steatosis and liver fibrosis in MASLD in the Egyptian population (all p > 0.05). The association of TM6SF2 rs58542926 C>T, HSD17B13 rs9992651 G>A, and GCKR rs1260326 T>C polymorphisms with NAFLD may be modified by the change in the population [7,14,25,26]. After adjusting for the risk factors (age, sex, BMI, WC, HDL, TG, diabetes mellitus, and hypertension), F2 was negatively correlated with the HSD17B13 rs9992651 GA genotype. The TM6SF2 rs58542926 T allele is associated with increased fasting blood glucose levels (p = 0.017). Although the waist circumference value is significantly higher in MASLD patients compared with the controls, the TM6SF2 rs58542926 T allele is associated with a decreased value of waist circumference (p = 0.013). Although the aspartate transaminase levels and diastolic blood pressure values are significantly higher in MASLD patients compared with the controls, the GCKR rs1260326 C allele is associated with decreased aspartate transaminase levels (p = 0.014), and diastolic blood pressure values (p = 0.043). Other clinical characteristics did not show statistically significant differences between allele carriers and non-carriers in the study population.

5. Conclusions

For the first time, our results confirm other worldwide studies for other populations for the positive association of the PNPLA3 rs738409 C>G variant with the presence of MASLD with liver fibrosis, the severity of hepatic steatosis and liver fibrosis in MASLD, and increased alanine aminotransferase levels among Egyptian subjects. To our knowledge, this is also the first report worldwide to describe novel associations of the PNPLA3 rs738409 G allele with increased systolic and diastolic blood pressure values. The TM6SF2 rs58542926 T allele is associated with increased fasting blood glucose levels and a decreased value of waist circumference. The GCKR rs1260326 C allele is associated with decreased aspartate transaminase levels and diastolic blood pressure values. Only after adjusting for the risk factors (age, sex, BMI, WC, HDL, TG, diabetes mellitus, and hypertension) the HSD17B13 rs9992651 GA genotype may have a protective effect from F2. These results are to be further investigated in wider, dedicated studies.

Supplementary Materials

The following supporting information can be downloaded at: https://www.mdpi.com/article/10.3390/genes15040455/s1, Figure S1: (A) Screening of Genome-wide association studies catalog for MASLD-related genetic variants identifying four genes with variants with p-value < 0.001. (B) Protein–protein interaction network using STRING online tool showing the interaction of the four mapped genes. The required score was set to 0.7 (high confidence). (C) Prediction of the impact of the selected genetic variants on protein function using the SIFT predictive tool. A score < 0.05 predicts the variation to be “deleterious”, whereas a score ≥ 0.05 would be “tolerated”. Figure S2: Location of PNPLA3 gene on chromosome 22 and location of rs738409 within exon 3 with all possible alleles. Figure S3: (A) Multiple sequence alignment of PNPLA3 protein in common model organisms and domestic animals. The location of the variant (148 in human protein) is marked with a box. (B) A phylogenetic tree was conducted in MEGA X using the UPGMA method with Poisson correction. Figure S4: Comparison of the 3D structure of PNPLA3_Ile148 (A) and PNPLA3_Met148 (B) showing the main polar distances where Met148 had a larger distance compared with Ile148. Table S1: The proportions of participants with genotypes of PNPLA3 rs738409 C>G, TM6SF2 rs58542926 C>T, HSD17B13 rs9992651 G>A, and GCKR rs1260326 T>C in MASLD cases and controls. Table S2: The proportions of participants with genotypes of PNPLA3 rs738409 C>G, TM6SF2 rs58542926 C>T, HSD17B13 rs9992651 G>A, and GCKR rs1260326 T>C in MASLD cases with liver fibrosis, MASLD cases without liver fibrosis and controls. Table S3: Association of genotypes of PNPLA3 rs738409 C>G, TM6SF2 rs58542926 C>T, HSD17B13 rs9992651 G>A, and GCKR rs1260326 T>C in MASLD cases with liver fibrosis, MASLD cases without liver fibrosis, and controls (After adjusting for the risk factors (age, sex, BMI, WC, HDL, TG, diabetes mellitus, and hypertension)). Table S4: The proportions of participants with genotypes of PNPLA3 rs738409 C>G, TM6SF2 rs58542926 C>T, HSD17B13 rs9992651 G>A, and GCKR rs1260326 T>C in subjects with different severities of liver fibrosis. Table S5: Association of genotypes of PNPLA3 rs738409 C>G, TM6SF2 rs58542926 C>T, HSD17B13 rs9992651 G>A, and GCKR rs1260326 T>C with different severity of liver fibrosis in MASLD by logistic regression analysis (After adjusting for the risk factors (age, sex, BMI, WC, HDL, TG, diabetes mellitus, and hypertension). Table S6: The proportions of participants with genotypes of PNPLA3 rs738409 C>G, TM6SF2 rs58542926 C>T, HSD17B13 rs9992651 G>A, and GCKR rs1260326 T>C in subjects with different severities of hepatic steatosis. Table S7: Association of genotypes of PNPLA3 rs738409 C>G, TM6SF2 rs58542926 C>T, HSD17B13 rs9992651 G>A, and GCKR rs1260326 T>C with different severity of hepatic steatosis in MASLD by logistic regression analysis. Table S8: A) Clinical characteristics of PNPLA3 rs738409 G and TM6SF2 rs58542926 T carriers and non-carriers in the study population. B) Clinical characteristics of HSD17B13 rs9992651 A and GCKR rs1260326 C carriers and non-carriers in the study population.Table S9: A power calculation of sample size to evaluate the effect of genetic variations on MASLD.

Author Contributions

N.E.: Investigation, validation, methodology, data curation, formal analysis, writing—original draft preparation. A.A.M.: Investigation, validation, methodology, data curation, formal analysis, writing—original draft preparation. A.K.: Writing—reviewing and editing, resources, methodology. N.E.-N.: Writing—reviewing and editing, formal analysis. M.L.: Writing—reviewing and editing, resources, formal analysis. M.A.: Writing—reviewing and editing, resources, methodology. A.K.D.: Supervision, writing—reviewing and editing. A.W.: Conceptualization, administration, supervision, writing—reviewing and editing. All authors have read and agreed to the published version of the manuscript.

Funding

This research received no external funding.

Institutional Review Board Statement

This work obtained ethical approval from the Faculty of Medicine, Alexandria University (approval number 0106658). This work was carried out following the Code of Ethics of the World Medical Association (Declaration of Helsinki) for experiments involving humans.

Informed Consent Statement

All participants signed a written consent document.

Data Availability Statement

The data presented in this study are available upon request from the corresponding author. The data are not publicly available due to privacy and ethical reasons.

Acknowledgments

We thank our patients who agreed to let us utilize their samples and data for research and the research nurses. This work was supported by the Faculty of Pharmacy at Alexandria University.

Conflicts of Interest

The authors declare no conflicts of interest.

References

  1. Rinella, M.E.; Lazarus, J.V.; Ratziu, V.; Francque, S.M.; Sanyal, A.J.; Kanwal, F.; Romero, D.; Abdelmalek, M.F.; Anstee, Q.M.; Arab, J.P.; et al. A multisociety Delphi consensus statement on new fatty liver disease nomenclature. Hepatology 2023, 78, 1966–1986. [Google Scholar] [CrossRef] [PubMed]
  2. Wong, R.J.; Aguilar, M.; Cheung, R.; Perumpail, R.B.; Harrison, S.A.; Younossi, Z.M.; Ahmed, A. Nonalcoholic steatohepatitis is the second leading etiology of liver disease among adults awaiting liver transplantation in the United States. Gastroenterology 2015, 148, 547–555. [Google Scholar] [CrossRef]
  3. Bertolotti, M.; Lonardo, A.; Mussi, C.; Baldelli, E.; Pellegrini, E.; Ballestri, S.; Romagnoli, D.; Loria, P. Nonalcoholic fatty liver disease and aging: Epidemiology to management. World J. Gastroenterol. 2014, 20, 14185–14204. [Google Scholar] [CrossRef]
  4. Tomah, S.; Mohamed Eid, E.S.; Abouelmagd, M.M.S.; Hassan, A.H.; Eldib, A.H.; Hamdy, O. 214-LB: Vibration-Controlled Transient Elastography Reveals Alarming Prevalence of Nonalcoholic Fatty Liver Disease and Fibrosis among Young Adults in Egypt. Diabetes 2019, 68 (Suppl. S1), 214-LB. [Google Scholar] [CrossRef]
  5. Fouad, Y.; Esmat, G.; Elwakil, R.; Zakaria, S.; Yosry, A.; Waked, I.; El-Razky, M.; Doss, W.; El-Serafy, M.; Mostafa, E.; et al. The egyptian clinical practice guidelines for the diagnosis and management of metabolic associated fatty liver disease. Saudi J. Gastroenterol. 2022, 28, 3–20. [Google Scholar] [CrossRef] [PubMed]
  6. Sookoian, S.; Pirola, C.J. Genetic predisposition in nonalcoholic fatty liver disease. Clin. Mol. Hepatol. 2017, 23, 1–12. [Google Scholar] [CrossRef]
  7. Romeo, S.; Kozlitina, J.; Xing, C.; Pertsemlidis, A.; Cox, D.; Pennacchio, L.A.; Boerwinkle, E.; Cohen, J.C.; Hobbs, H.H. Genetic variation in PNPLA3 confers susceptibility to nonalcoholic fatty liver disease. Nat. Genet. 2008, 40, 1461–1465. [Google Scholar] [CrossRef]
  8. Hotta, K.; Yoneda, M.; Hyogo, H.; Ochi, H.; Mizusawa, S.; Ueno, T.; Chayama, K.; Nakajima, A.; Nakao, K.; Sekine, A. Association of the rs738409 polymorphism in PNPLA3 with liver damage and the development of nonalcoholic fatty liver disease. BMC Med. Genet. 2010, 11, 172. [Google Scholar] [CrossRef] [PubMed]
  9. Jain, V.; Kumar, A.; Ahmad, N.; Jana, M.; Kalaivani, M.; Kumar, B.; Shastri, S.; Jain, O.; Kabra, M. Genetic polymorphisms associated with obesity and non-alcoholic fatty liver disease in Asian Indian adolescents. J. Pediatr. Endocrinol. Metab. 2019, 32, 749–758. [Google Scholar] [CrossRef]
  10. Krawczyk, M.; Rau, M.; Schattenberg, J.M.; Bantel, H.; Pathil, A.; Demir, M.; Kluwe, J.; Boettler, T.; Lammert, F.; Geier, A. Combined effects of the PNPLA3 rs738409, TM6SF2 rs58542926, and MBOAT7 rs641738 variants on NAFLD severity: A multicenter biopsy-based study. J. Lipid Res. 2017, 58, 247–255. [Google Scholar] [CrossRef]
  11. Sookoian, S.; Pirola, C.J. Meta-analysis of the influence of I148M variant of patatin-like phospholipase domain containing 3 gene (PNPLA3) on the susceptibility and histological severity of nonalcoholic fatty liver disease. Hepatology 2011, 53, 1883–1894. [Google Scholar] [CrossRef] [PubMed]
  12. Unalp-Arida, A.; Ruhl, C.E. Patatin-Like Phospholipase Domain-Containing Protein 3 I148M and Liver Fat and Fibrosis Scores Predict Liver Disease Mortality in the U.S. Population. Hepatology 2020, 71, 820–834. [Google Scholar] [CrossRef] [PubMed]
  13. Zain, S.M.; Mohamed, R.; Mahadeva, S.; Cheah, P.L.; Rampal, S.; Basu, R.C.; Mohamed, Z. A multi-ethnic study of a PNPLA3 gene variant and its association with disease severity in non-alcoholic fatty liver disease. Hum. Genet. 2012, 131, 1145–1152. [Google Scholar] [CrossRef] [PubMed]
  14. Benedict, M.; Zhang, X. Non-alcoholic fatty liver disease: An expanded review. World J. Hepatol. 2017, 9, 715–732. [Google Scholar] [CrossRef] [PubMed]
  15. Martínez, L.A.; Larrieta, E.; Kershenobich, D.; Torre, A. The Expression of PNPLA3 Polymorphism could be the Key for Severe Liver Disease in NAFLD in Hispanic Population. Ann. Hepatol. 2017, 16, 909–915. [Google Scholar] [CrossRef] [PubMed]
  16. Rotman, Y.; Koh, C.; Zmuda, J.M.; Kleiner, D.E.; Liang, T.J. The association of genetic variability in patatin-like phospholipase domain-containing protein 3 (PNPLA3) with histological severity of nonalcoholic fatty liver disease. Hepatology 2010, 52, 894–903. [Google Scholar] [CrossRef]
  17. Valenti, L.; Alisi, A.; Galmozzi, E.; Bartuli, A.; Del Menico, B.; Alterio, A.; Dongiovanni, P.; Fargion, S.; Nobili, V. I148M patatin-like phospholipase domain-containing 3 gene variant and severity of pediatric nonalcoholic fatty liver disease. Hepatology 2010, 52, 1274–1280. [Google Scholar] [CrossRef] [PubMed]
  18. Anstee, Q.M.; Darlay, R.; Cockell, S.; Meroni, M.; Govaere, O.; Tiniakos, D.; Burt, A.D.; Bedossa, P.; Palmer, J.; Liu, Y.-L.; et al. Genome-wide association study of non-alcoholic fatty liver and steatohepatitis in a histologically characterised cohort. J. Hepatol. 2020, 73, 505–515. [Google Scholar] [CrossRef]
  19. Mazo, D.F.; Malta, F.M.; Stefano, J.T.; Salles, A.P.M.; Gomes-Gouvea, M.S.; Nastri, A.C.S.; Almeida, J.R.; Pinho, J.R.R.; Carrilho, F.J.; Oliveira, C.P. Validation of PNPLA3 polymorphisms as risk factor for NAFLD and liver fibrosis in an admixed population. Ann. Hepatol. 2019, 18, 466–471. [Google Scholar] [CrossRef]
  20. Musso, G.; Cipolla, U.; Cassader, M.; Pinach, S.; Saba, F.; De Michieli, F.; Paschetta, E.; Bongiovanni, D.; Framarin, L.; Leone, N.; et al. TM6SF2 rs58542926 variant affects postprandial lipoprotein metabolism and glucose homeostasis in NAFLD. J. Lipid Res. 2017, 58, 1221–1229. [Google Scholar] [CrossRef]
  21. Motomura, T.; Amirneni, S.; Diaz-Aragon, R.; Faccioli, L.A.P.; Malizio, M.R.; Coard, M.C.; Kocas-Kilicarslan, Z.N.; Frau, C.; Haep, N.; Ostrowska, A.; et al. Is HSD17B13 Genetic Variant a Protector for Liver Dysfunction? Future Perspective as a Potential Therapeutic Target. J. Pers. Med. 2021, 11, 619. [Google Scholar] [CrossRef] [PubMed]
  22. Tong, M.; Wang, F. APOC3rs2854116, PNPLA3rs738409, and TM6SF2rs58542926 polymorphisms might influence predisposition of NAFLD: A meta-analysis. IUBMB Life 2020, 72, 1757–1764. [Google Scholar] [CrossRef]
  23. Mu, T.; Peng, L.; Xie, X.; He, H.; Shao, Q.; Wang, X.; Zhang, Y. Single Nucleotide Polymorphism of Genes Associated with Metabolic Fatty Liver Disease. J. Oncol. 2022, 2022, 9282557. [Google Scholar] [CrossRef]
  24. Li, J.; Zhao, Y.; Zhang, H.; Hua, W.; Jiao, W.; Du, X.; Rui, J.; Li, S.; Teng, H.; Shi, B.; et al. Contribution of Rs780094 and Rs1260326 Polymorphisms in GCKR Gene to Non-alcoholic Fatty Liver Disease: A Meta-Analysis Involving 26,552 Participants. Endocr. Metab. Immune Disord. Drug Targets 2021, 21, 1696–1708. [Google Scholar] [CrossRef] [PubMed]
  25. Riazi, K.; Swain, M.G.; Congly, S.E.; Kaplan, G.G.; Shaheen, A.A. Race and Ethnicity in Non-Alcoholic Fatty Liver Disease (NAFLD): A Narrative Review. Nutrients 2022, 14, 4556. [Google Scholar] [CrossRef]
  26. Cavalcante, L.N.; Porto, J.; Mazo, D.; Longatto-Filho, A.; Stefano, J.T.; Lyra, A.C.; Carrilho, F.J.; Reis, R.M.; Alves, V.A.F.; Sanyal, A.J.; et al. African genetic ancestry is associated with lower frequency of PNPLA3 G allele in non-alcoholic fatty liver in an admixed population. Ann. Hepatol. 2017, 16, 100728. [Google Scholar] [CrossRef]
  27. Szklarczyk, D.; Kirsch, R.; Koutrouli, M.; Nastou, K.; Mehryary, F.; Hachilif, R.; Gable, A.L.; Fang, T.; Doncheva, N.T.; Pyysalo, S.; et al. The STRING database in 2023: Protein-protein association networks and functional enrichment analyses for any sequenced genome of interest. Nucleic Acids Res. 2023, 51, D638–D646. [Google Scholar] [CrossRef]
  28. Ng, P.C.; Henikoff, S. Predicting deleterious amino acid substitutions. Genome Res. 2001, 11, 863–874. [Google Scholar] [CrossRef] [PubMed]
  29. Peka, M.; Balatsky, V.; Saienko, A.; Tsereniuk, O. Bioinformatic analysis of the effect of SNPs in the pig TERT gene on the structural and functional characteristics of the enzyme to develop new genetic markers of productivity traits. BMC Genom. 2023, 24, 487. [Google Scholar] [CrossRef]
  30. Waterhouse, A.; Bertoni, M.; Bienert, S.; Studer, G.; Tauriello, G.; Gumienny, R.; Heer, F.T.; de Beer, T.A.P.; Rempfer, C.; Bordoli, L.; et al. SWISS-MODEL: Homology modelling of protein structures and complexes. Nucleic Acids Res. 2018, 46, W296–W303. [Google Scholar] [CrossRef]
  31. Stecher, G.; Tamura, K.; Kumar, S. Molecular Evolutionary Genetics Analysis (MEGA) for macOS. Mol. Biol. Evol. 2020, 37, 1237–1239. [Google Scholar] [CrossRef] [PubMed]
  32. Lopez, J. Carl A. Burtis, Edward R. Ashwood and David E. Bruns (eds): Tietz Textbook of Clinical Chemistry and Molecular Diagnosis (5th edition): Elsevier, St. Louis, USA, 2012, 2238 pp, 909 illustrations. ISBN: 978-1-4160-6164-9. Indian J. Clin. Biochem. 2013, 28, 104–105. [CrossRef]
  33. Wilder, J.; Patel, K. The clinical utility of FibroScan® as a noninvasive diagnostic test for liver disease. Med. Devices Evid. Res. 2014, 7, 107–114. [Google Scholar] [CrossRef]
  34. Lee, J.E.; Ko, K.O.; Lim, J.W.; Cheon, E.J.; Song, Y.H.; Yoon, J.M. Correlation between Transient Elastography (Fibroscan®) and Ultrasonographic and Computed Tomographic Grading in Pediatric Nonalcoholic Steatohepatitis. Pediatr. Gastroenterol. Hepatol. Nutr. 2022, 25, 240–250. [Google Scholar] [CrossRef] [PubMed]
  35. Santos, F.A.B.; Lemes, R.B.; Otto, P.A. HW_TEST, a program for comprehensive HARDY-WEINBERG equilibrium testing. Genet. Mol. Biol. 2020, 43, e20190380. [Google Scholar] [CrossRef] [PubMed]
  36. Fairfield, C.J.; Drake, T.M.; Pius, R.; Bretherick, A.D.; Campbell, A.; Clark, D.W.; Fallowfield, J.A.; Hayward, C.; Henderson, N.C.; Joshi, P.K.; et al. Genome-Wide Association Study of NAFLD Using Electronic Health Records. Hepatol. Commun. 2022, 6, 297–308. [Google Scholar] [CrossRef] [PubMed]
  37. Huang, Y.; Cohen, J.C.; Hobbs, H.H. Expression and characterization of a PNPLA3 protein isoform (I148M) associated with nonalcoholic fatty liver disease. J. Biol. Chem. 2011, 286, 37085–37093. [Google Scholar] [CrossRef]
  38. Abul-Husn, N.S.; Cheng, X.; Li, A.H.; Xin, Y.; Schurmann, C.; Stevis, P.; Liu, Y.; Kozlitina, J.; Stender, S.; Wood, G.C.; et al. A Protein-Truncating HSD17B13 Variant and Protection from Chronic Liver Disease. N. Engl. J. Med. 2018, 378, 1096–1106. [Google Scholar] [CrossRef]
Figure 1. The proportions of participants with genotypes of PNPLA3 rs738409 C>G, TM6SF2 rs58542926 C>T, HSD17B13 rs9992651 G>A, and GCKR rs1260326 T>C in subjects with MASLD and controls. (A) The proportions of participants with genotypes of PNPLA3 rs738409 C>G in subjects with MASLD and controls; (B) The proportions of participants with genotypes of TM6SF2 rs58542926 C>T in subjects with MASLD and controls; (C) The proportions of participants with genotypes of HSD17B13 rs9992651 G>A in subjects with MASLD and controls; (D) The proportions of participants with genotypes of GCKR rs1260326 T>C in subjects with MASLD and controls, p-value estimated by Chi-Square or Fisher’s Exact tests for categorical datasets.
Genes 15 00455 g001
Figure 2. The proportions of participants with genotypes of PNPLA3 rs738409 C>G, TM6SF2 rs58542926 C>T, HSD17B13 rs9992651 G>A, and GCKR rs1260326 T>C in cases with and without liver fibrosis in MASLD and controls. (A) The proportions of participants with genotypes of PNPLA3 rs738409 C>G in cases with and without liver fibrosis in MASLD and controls; (B) The proportions of participants with genotypes of TM6SF2 rs58542926 C>T in cases with and without liver fibrosis in MASLD and controls.; (C) The proportions of participants with genotypes of HSD17B13 rs9992651 G>A in cases with and without liver fibrosis in MASLD and controls; (D) The proportions of participants with genotypes of GCKR rs1260326 T>C in cases with and without liver fibrosis in MASLD and controls, p-value estimated by Chi-Square or Fisher’s Exact tests for categorical datasets.
Genes 15 00455 g002
Figure 3. The proportions of participants with genotypes of PNPLA3 rs738409 C>G, TM6SF2 rs58542926 C>T, HSD17B13 rs9992651 G>A, and GCKR rs1260326 T>C in subjects with different severities of liver fibrosis. (A) The proportions of participants with genotypes of PNPLA3 rs738409 C>G in subjects with different severities of liver fibrosis; (B) The proportions of participants with genotypes of TM6SF2 rs58542926 C>T in subjects with different severities of liver fibrosis; (C) The proportions of participants with genotypes of HSD17B13 rs9992651 G>A in subjects with different severities of liver fibrosis; (D) The proportions of participants with genotypes of GCKR rs1260326 T>C in subjects with different severities of liver fibrosis, p-value estimated by Chi-Square or Fisher’s Exact tests for categorical datasets.
Genes 15 00455 g003
Figure 4. The proportions of participants with genotypes of PNPLA3 rs738409 C>G, TM6SF2 rs58542926 C>T, HSD17B13 rs9992651 G>A, and GCKR rs1260326 T>C in subjects with different severities of hepatic steatosis. (A) The proportions of participants with genotypes of PNPLA3 rs738409 C>G in subjects with different severities of hepatic steatosis; (B) The proportions of participants with genotypes of TM6SF2 rs58542926 C>T in subjects with different severities of hepatic steatosis; (C) The proportions of participants with genotypes of HSD17B13 rs9992651 G>A in subjects with different severities of hepatic steatosis; (D) The proportions of participants with genotypes of GCKR rs1260326 T>C in subjects with different severities of hepatic steatosis, p-value estimated by Chi-Square or Fisher’s Exact tests for categorical datasets.
Genes 15 00455 g004
Table 1. Baseline characteristics of MASLD cases and controls.
PhenotypeMASLD Cases
(n = 205)
Controls
(n = 187)
p-Value
Gender (male/female)126/7972/115<0.001 ***
Diabetes (Diabetic/Prediabetic/Normal)78/14/1130/0/187<0.001 ***
Hypertension (Hypertensive/Normal)125/800/187<0.001 ***
Age (years)45.16 ± 11.2538.37 ± 11.30<0.001 ***
Hepatic Steatosis degree (S0/S1/S2/S3)0/33/82/90187/0/0/0<0.001 ***
Liver Fibrosis degree (F0–1/F2/F3/F4)74/90/31/10187/0/0/0<0.001 ***
BMI (kg/m2)32.78 ± 5.8222.95 ± 2.62<0.001 ***
WC (cm)112.52 ± 12.1990.36 ± 4.10<0.001 ***
SBP (mmHg)119.98 ± 18.25116.18 ± 10.080.011 *
DBP (mmHg)83.86 ± 13.5177.36 ± 5.98<0.001 ***
ALT (U/L)36.01 ± 27.3915.16 ± 7.07<0.001 ***
AST (U/L)31.61 ± 20.2520.48 ± 6.57<0.001 ***
GGT (U/L)41.89 ± 36.4418.28 ± 7.55<0.001 ***
FBG (mg/dL)106.29 ± 34.6586.51 ± 11.450<0.001 ***
PPBS (mg/dL)122.66 ± 37.01104.60 ± 14.60<0.001 ***
TC (mg/dL)197.4 ± 45.62169.27 ± 36.02<0.001 ***
TG (mg/dL)154.76 ± 79.1591.67 ± 37.43<0.001 ***
LDL-C (mg/dL)128.75 ± 41.57114.08 ± 28.73<0.001 ***
HDL-C (mg/dL)37.20 ± 11.1939.51 ± 11.44<0.001 ***
Values are presented as mean ± standard deviation. BMI, body mass index; WC, waist circumference; SBP, systolic blood pressure; DBP, diastolic blood pressure; ALT, alanine aminotransferase; AST, aspartate transaminase; GGT, gamma-glutamyl transpeptidase; FBG, fasting blood glucose; PPBS, post-prandial blood sugar; TC, total cholesterol; TG, triacylglyceride; LDL-C, low-density lipoprotein cholesterol; HDL-C, high-density lipoprotein cholesterol. p-value estimated by the Chi-Square test or Mann–Whitney test for categorical or non-normally distributed continuous, respectively, * <0.05; *** <0.001.
Table 2. Association of genotypes of PNPLA3 rs738409 C>G, TM6SF2 rs58542926 C>T, HSD17B13 rs9992651 G>A, and GCKR rs1260326 T>C with MASLD by logistic regression analysis.
MASLD Cases
(n = 205)
Controls (Ref.)
(n = 187)
Unadjusted ModelAdjusted Model for Age, Sex, BMI, WC, HDL, TG, Diabetes Mellitus, and Hypertension
No.No.p-Value 1OR (95%CI)p-Value 2OR (95%CI)
PNPLA3 rs738409 C>G
Genotype
CC (Ref.)100119 1.000 1.000
CG83600.022 *1.646 (1.076–2.519)0.9411.043 (0.337–3.235)
GG2280.006 **3.272 (1.396–7.670)0.039 *9.166 (1.123–74.832)
TM6SF2 rs58542926 C>T
Genotype
CC (Ref.)170157 1.000 1.000
CT34300.86771.047 (0.612–1.790)0.9521.041 (0.282–3.844)
TT101.000-1.000-
HSD17B13 rs9992651 G>A
Genotype
GG (Ref.)150130 1.000 1.000
GA46490.3860.814 (0.511–1.296)0.5971.409 (0.395–5.025)
AA830.2232.311 (0.601–8.893)0.5112.726 (0.137–54.280)
GCKR rs1260326 T>C
Genotype
TT (Ref.)7062 1.000 1.000
TC102880.9081.027 (0.658–1.602)0.6570.745 (0.203–2.731)
CC31320.6170.858 (0.471–1.564)0.5561.796 (0.256–12.612)
Ref., reference group; OR, odds ratio; CI, confidence interval; p-value 1, and p-value 2 estimated by single logistic regression analysis and multivariable logistic regression analysis, respectively, * <0.05; ** <0.01.
Table 3. Association of genotypes of PNPLA3 rs738409 C>G, TM6SF2 rs58542926 C>T, HSD17B13 rs9992651 G>A, and GCKR rs1260326 T>C in MASLD cases with liver fibrosis, MASLD cases without liver fibrosis, and controls.
Control (Ref.) (n = 187)
versus MASLD Cases with Liver Fibrosis
(n = 131)
Control (Ref.) (n = 187)
versus MASLD Cases without Liver Fibrosis
(n = 74)
p-Value 1OR (95%CI)p-Value 2OR (95%CI)
PNPLA3 rs738409 C>G
Genotype
CC (Ref.) (n = 219) 1.000 1.000
CG (n = 143)0.015 *1.815 (1.121–2.940)0.2431.403 (0.795–2.475)
GG (n = 30)0.001 **4.538 (1.865–11.044)0.5601.451 (0.415–5.073)
TM6SF2 rs58542926 C>T
Genotype
CC (Ref.) (n = 327) 1.000 1.000
CT (n = 64)0.9980.999 (0.544–1.836)0.7311.134 (0.554–2.319)
TT (n = 1)----
HSD17B13 rs9992651 G>A
Genotype
GG (Ref.) (n = 280) 1.000 1.000
GA (n = 95)0.1800.690 (0.401–1.186)0.8501.061 (0.574–1.961)
AA (n = 11)0.2982.167 (0.506–9.282)0.2522.600 (0.508–13.313)
GCKR rs1260326 T>C
Genotype
TT (Ref.) (n = 132) 1.000 1.000
TC (n = 190)0.5180.848 (0.515–1.397)0.2431.443 (0.780–2.668)
CC (n = 63)0.5840.830 (0.427–1.616)0.8550.923 (0.388–2.192)
Ref., reference group; OR, odds ratio; CI, confidence interval; p-value 1 and p-value 2 estimated by logistic regression analysis, * <0.05; ** <0.01.
Table 4. Association of genotypes of PNPLA3 rs738409 C>G, TM6SF2 rs58542926 C>T, HSD17B13 rs9992651 G>A, and GCKR rs1260326 T>C with different severities of liver fibrosis in MASLD by logistic regression analysis.
F0–1 (Ref.) (n = 261)
VS F2 (n = 90)
F0–1 (Ref.) (n = 261)
VS F3 (n = 31)
F0–1 (Ref.) (n = 261)
VS F4 (n = 10)
p-Value 1OR (95%CI)p-Value 2OR (95%CI)p-Value 3OR (95%CI)
PNPLA3 rs738409 C>G
Genotype
CC (Ref.) (n = 219) 1.000 1.000 1.000
CG (n = 143)0.1181.505 (0.901–2.514)0.2971.241 (0.827–1.864)0.042 *5.393 (1.066–27.284)
GG (n = 30)0.007 **3.411 (1.408–8.262)0.009 **4.762 (1.467–15.460)0.013 *13.333 (1.724–103.145)
TM6SF2 rs58542926 C>T
Genotype
CC (Ref.) (n = 327) 1.000 1.000 1.000
CT (n = 64)0.9781.009 (0.530–1.921)0.6040.748 (0.249–2.246)0.7741.262 (0.259–6.148)
TT (n = 1)------
HSD17B13 rs9992651 G>A
Genotype
GG (Ref.) (n = 280) 1.000 1.000 1.000
GA (n = 95)0.0970.596 (0.324–1.097)0.5460.761 (0.314–1.846)0.7131.304 (0.317–5.361)
AA (n = 11)0.4151.714 (0.470–6.258)0.999-0.1645.000 (0.518–48.295)
GCKR rs1260326 T>C
Genotype
TT (Ref.) (n = 132) 1.000 1.000 1.000
TC (n = 190)0.3930.797 (0.473–1.343)0.8460.915 (0.375–2.236)0.1060.253 (0.048–1.337)
CC (n = 63)0.2270.621 (0.287–1.345)0.4251.537 (0.535–4.415)0.8211.186 (0.270–5.202)
Ref., reference group; OR, odds ratio; CI, confidence interval; p-value 1, p-value 2, and p-value 3 estimated by logistic regression analysis, * <0.05; ** <0.01.
Disclaimer/Publisher’s Note: The statements, opinions and data contained in all publications are solely those of the individual author(s) and contributor(s) and not of MDPI and/or the editor(s). MDPI and/or the editor(s) disclaim responsibility for any injury to people or property resulting from any ideas, methods, instructions or products referred to in the content.

