Article

Complete Chloroplast Genome of Megacarpaea megalocarpa and Comparative Analysis with Related Species from Brassicaceae

Xinjiang Key Laboratory for Ecological Adaptation and Evolution of Extreme Environment Biology, College of Life Sciences, Xinjiang Agricultural University, Urumqi 830052, China
*
Author to whom correspondence should be addressed.
These authors contributed equally to this work.
Genes 2024, 15(7), 886; https://doi.org/10.3390/genes15070886
Submission received: 7 June 2024 / Revised: 1 July 2024 / Accepted: 3 July 2024 / Published: 5 July 2024
(This article belongs to the Section Plant Genetics and Genomics)

Abstract

:
Megacarpaea megalocarpa, a perennial herbaceous species belonging to the Brassicaceae family, has potential medicinal value. We isolated and characterized the chloroplast (cp) genome of M. megalocarpa and compared it with closely related species. The chloroplast genome displayed a typical quadripartite structure, spanning 154,877 bp, with an overall guanine–cytosine (GC) content of 36.20%. Additionally, this genome contained 129 genes, 105 simple sequence repeats (SSRs), and 48 long repeat sequences. Significantly, the ycf1 gene exhibited a high degree of polymorphism at the small single copy (SSC) region and the inverted repeat a (IRa) boundary. Despite this polymorphism, relative synonymous codon usage (RSCU) values were found to be similar across species, and no large segment rearrangements or inversions were detected. The large single copy (LSC) and SSC regions showed higher sequence variations and nucleotide polymorphisms compared to the IR region. Thirteen distinct hotspot regions were identified as potential molecular markers. Our selection pressure analysis revealed that the protein-coding gene rpl20 is subjected to different selection pressures in various species. Phylogenetic analysis positioned M. megalocarpa within the expanded lineage II of the Brassicaceae family. The estimated divergence time suggests that M. megalocarpa diverged approximately 4.97 million years ago. In summary, this study provides crucial baseline information for the molecular identification, phylogenetic relationships, conservation efforts, and utilization of wild resources in Megacarpaea.

1. Introduction

Brassicaceae is a large group of angiosperms, consisting of 52 tribes, 321 genera, and approximately 4000 species. They are distributed worldwide, except for Antarctica, mainly in temperate regions [1,2]. Most of the Brassicaceae plants have significant economic and medicinal value [3] and are utilized as adjuvant therapy to treat major illnesses such as cancer [4,5]. For instance, Brassica oleracea has been demonstrated to reduce the risk of bladder cancer, as well as other types of cancer and cardiovascular disease incidence [6]. However, taxonomic classification has remained controversial in Brassicaceae due to the utilization of various molecular markers. Previous studies categorized the phylogenetic relationships of Brassicaceae into four lineages (basal LI–III and expanded LII) [2,7] or six major clades (A–F) [8], based on the internal transcribed spacer of nuclear ribosomal DNA (ITS) or single-copy nuclear markers; however, statistical support was generally low. Subsequent studies utilizing chloroplast DNAs and nuclear genes identified five strongly supported lineages (LI–V) [9], but some tribes remained unassigned to any lineage. Therefore, phylogenetic relationships within and between these lineages in Brassicaceae still need to be further studied.
Megacarpaea is a perennial herb that is primarily found in Central Asia and the Himalayan region. In China, there are three species, four varieties, and one variant of Megacarpaea [10]. Megacarpaea species hold significant value as traditional medicinal plants. For example, Megacarpaea delavayi is renowned for its heat-clearing and stomachic effects, and the rhizomes of Megacarpaea polyandra are utilized as a coolant in fever treatment or as an antidote for scorpion stings and snake bites by Bai and Tibetan people [11,12]. Megacarpaea megalocarpa (Fisch. ex DC.) Schischk. ex B. Fedtsch., a perennial herb, grows in desert areas at altitudes of 200–3600 m. It grows 20–40 cm tall, with erect stems, and its basal leaves have oblanceolate leaf blades with pinnatisect margins. The inflorescences are paniculate, with sessile bracts at branching. The petals of M. megalocarpa are lavender in color (Figure 1). This species is found in the sandy deserts and alkaline plains in Kazakhstan, Kyrgyzstan, Russia, Uzbekistan, and China (Qinghai and Xinjiang). M. megalocarpa, a congener, may hold promise for its medicinal value. Previous studies have classified the phylogenetic relationships of Megacarpaea in the Brassicaceae family as part of the extended lineage II or clade C [7,13]. However, recent research has left Megacarpaea unassigned to any specific lineage [9], making it difficult to determine its exact phylogenetic position.
Contrary to the mitochondrial and nuclear genomes, the chloroplast genome exhibits high conservation, characterized by a slow variation rate, maternal inheritance, and sequence stability [14,15]. As a result, the chloroplast genome is extensively utilized for reconstructing phylogenetic analyses in angiosperms, identifying species, and determining the origin and divergence timelines of species [16]. Nonetheless, research on the chloroplast genomes of Megacarpaea species has been limited, primarily focusing on M. polyandra and M. delavayi. There have been no reports on the chloroplast genomes of M. megalocarpa, which impedes our understanding of phylogenetic relationships within the Megacarpaea genus. Hence, we propose the hypothesis that the chloroplast genome of M. megalocarpa exhibits similar characteristics to other Megacarpaea species, and the M. megalocarpa phylogenetic relationship is more closely related to M. delavayi. Consequently, this research aims to sequence, assemble, and analyze M. megalocarpa through high-throughput sequencing to uncover its gene-level features. Our primary goals are as follows: (1) to characterize and compare the chloroplast genome of the tribe Megacarpaeeae, including M. megalocarpa, M. delavayi (GenBank ID: KX886349), M. polyandra (MK637758), Pugionium cornutum (KT844941), Pugionium dolabratum (KT844940), and Pugionium pterocarpum (MK637779); (2) to examine simple sequence repeats (SSRs) and repeat structures in the whole cp genome of Megacarpaeeae to provide markers for phylogenetic and genetic studies; and (3) to explore the phylogenomic position of M. megalocarpa. This study will offer a molecular foundation for the species identification of M. megalocarpa and the genetic evolution of Megacarpaeeae species.

2. Materials and Methods

2.1. Survey Site Sampling and DNA Sequencing

Fresh, healthy leaf specimens of M. megalocarpa were collected from the desert region near Dure Town (88°32′15″ E,46°30′36″ N), Altay, Xinjiang. Following collection, all leaves were promptly preserved in liquid nitrogen and stored in a −80 °C ultra-low temperature freezer. The leaf samples were then dispatched to Genepioneer Biotechnologies (Nanjing, China) for genetic sequencing. DNA extraction was carried out using the Plant Genomic DNA Kit (Tian gen Biotechnology, Beijing, China). Paired-end libraries with insert sizes of 350 bp were created according to Illumina’s standard protocol for genomic DNA library preparation, with subsequent quality assessments to verify sequencing precision. The whole genome of M. megalocarpa was sequenced on the Illumina Novaseq 6000 PE150 platform (Illumina, San Diego, CA, USA), utilizing the sequencing by synthesis (SBS) technology.

2.2. Chloroplast Genome Assembly and Annotation Analyses

High-quality clean reads were obtained by utilizing Trimmomatic v.0.39 [17] to filter out sequences with low quality (where the quality value was Q ≤ 5 and N bases > 5%). The assembly of the M. megalocarpa chloroplast genome was conducted using the GetOrganelle v.1.7.5 [18] pipeline, with the M. delavayi chloroplast genome serving as the reference. Automatic annotations of the chloroplast genomes were performed by CpGAVAS2 [19] and subsequently manually curated with reference to previously published chloroplast genomes using Geneious v.2021.1.1 [20]. The structure maps of the chloroplast genome were visualized using the OGDRAW v.1.3.1 [21] online tool (https://chlorobox.mpimp-golm.mpg.de/OGDraw.html, accessed on 20 December 2023). The chloroplast genome sequence for M. megalocarpa was submitted to the NCBI platform under accession number PP234616.

2.3. Analysis of SSRs and Repetitive Sequences

The online program MIcroSAtellite (MISA) v.2.1 [22] was used to detect microsatellites (mono-, di-, tri-, tetra-, penta-, and hexanucleotide repeats) with the following thresholds (unit size, min repeats): ten for mononucleotide, five for dinucleotide, four for trinucleotide, and three repeat units each for tetra-, penta-, and hexanucleotide SSRs. Additionally, the web-based software REPuter (http://bibiserv.techfak.uni-bielefeld.de/reputer/, accessed on 13 December 2023) [23] was employed to analyze repeat sequences. The types of repeats included were forward (F), reverse (R), complement (C), palindromic (P), and tandem, with minimal lengths of 30 bp, maximum lengths of 1000 bp and Hamming distance of 3 bp.

2.4. Inverted Repeats Boundary Analysis, Codon Usage Bias, and Genome Comparison

Comparisons were made between the IR/SSC and IR/LSC junctions of six different species by utilizing the online tool IRscope software (https://irScope.shinyapps.io/Irapp/, accessed on 4 December 2023) [24]. An analysis was conducted on the boundaries and identities of the inverted repeat (IR) and single copy (SC) regions for M. megalocarpa, as well as for the aforementioned five species. The estimation of codon usage bias was carried out using CodonW v.1.4.2 [25]. RSCU values for each codon were determined based on the coding sequences (CDSs) of the protein-coding genes from M. megalocarpa and other species of tribe Megacarpaeeae. Additionally, the comparison of six Brassicaceae chloroplast genomes was performed using the mVISTA [26] program in Shuffle-LAGAN mode, using M. delavayi as the reference genome. Results from dynamic visualization helped in observing gene conservation within the chloroplast genomes of the species, as well as identifying the presence or absence of variants and the locations where these variations occur.

2.5. Ka/Ks Analysis and Nucleotide Diversity

In order to evaluate the impact of evolutionary selection pressure on the chloroplast genome of the studied species, homologous protein sequences between M. megalocarpa and other species of the tribe Megacarpaeeae were obtained using BLASTN. The alignment of shared protein-coding genes was conducted using MAFFT v7.427 [27] software. The Ka/Ks ratios were determined by comparing non-synonymous (Ka) and synonymous (Ks) mutations between M. megalocarpa and other species through KaKs_Calculator2.0 [28]. The calculation of nucleotide diversity (Pi values) was performed using DnaSP v.5.10 [29] with a sliding window analysis, where the window size was adjusted to 600 bp, with a step size of 200 bp.

2.6. Phylogenetic Analysis and Estimation of Divergence Times

The chloroplast genome sequences of 37 species from nine genera within Brassicaceae were analyzed for phylogenetic reconstruction. Data were sourced from the National Center for Biotechnology Information (NCBI) (Table S1). Aethionema arabicum and Aethionema grandiflorum were selected to serve as outgroups. Alignment of the sequences was performed using the MAFFT program with default parameters [27]. Subsequently, phylogenetic trees were constructed using two methods: Maximum Likelihood (ML) and Neighbor Joining (NJ). For the ML tree, the GTR+I+G nucleotide replacement model was employed, along with 1000 bootstrap replicates through Phylosuite v.1.2.2 [30]. Visualization of the ML tree was carried out using FigTree v.1.4.2 (download link: http://tree.bio.ed.ac.uk/software/figtree/, accessed on 16 April 2024). As for the NJ tree, the Kimura 2-parameter model was utilized with 1000 bootstrap replicates, analyzed using MEGA v11.0.13 [31].
Estimations for divergence time were conducted using BEAST v 1.8.4 [32] under the uncorrelated lognormal relaxed clock and Yule process model. The Bayesian Markov chain Monte Carlo (MCMC) algorithms were analyzed with other parameter settings, according to Hohmann et al. [33]. Due to the limited macrofossils record of Brassicaceae, three calibration points from the TimeTree database were used: Ae. arabicum and other Brassicaceae plants (32–43 Mya), lineages II+ and expanded lineage II, and lineage I (23.4–33.5 Mya), as well as Lepidium meyenii and lineage I plants (11.9–20.6 Mya). The MCMC simulation ran for 10,000,000 generations, discarding the initial 10% as burn-in. Visualization of the resulting tree was performed utilizing FigTree.

3. Results

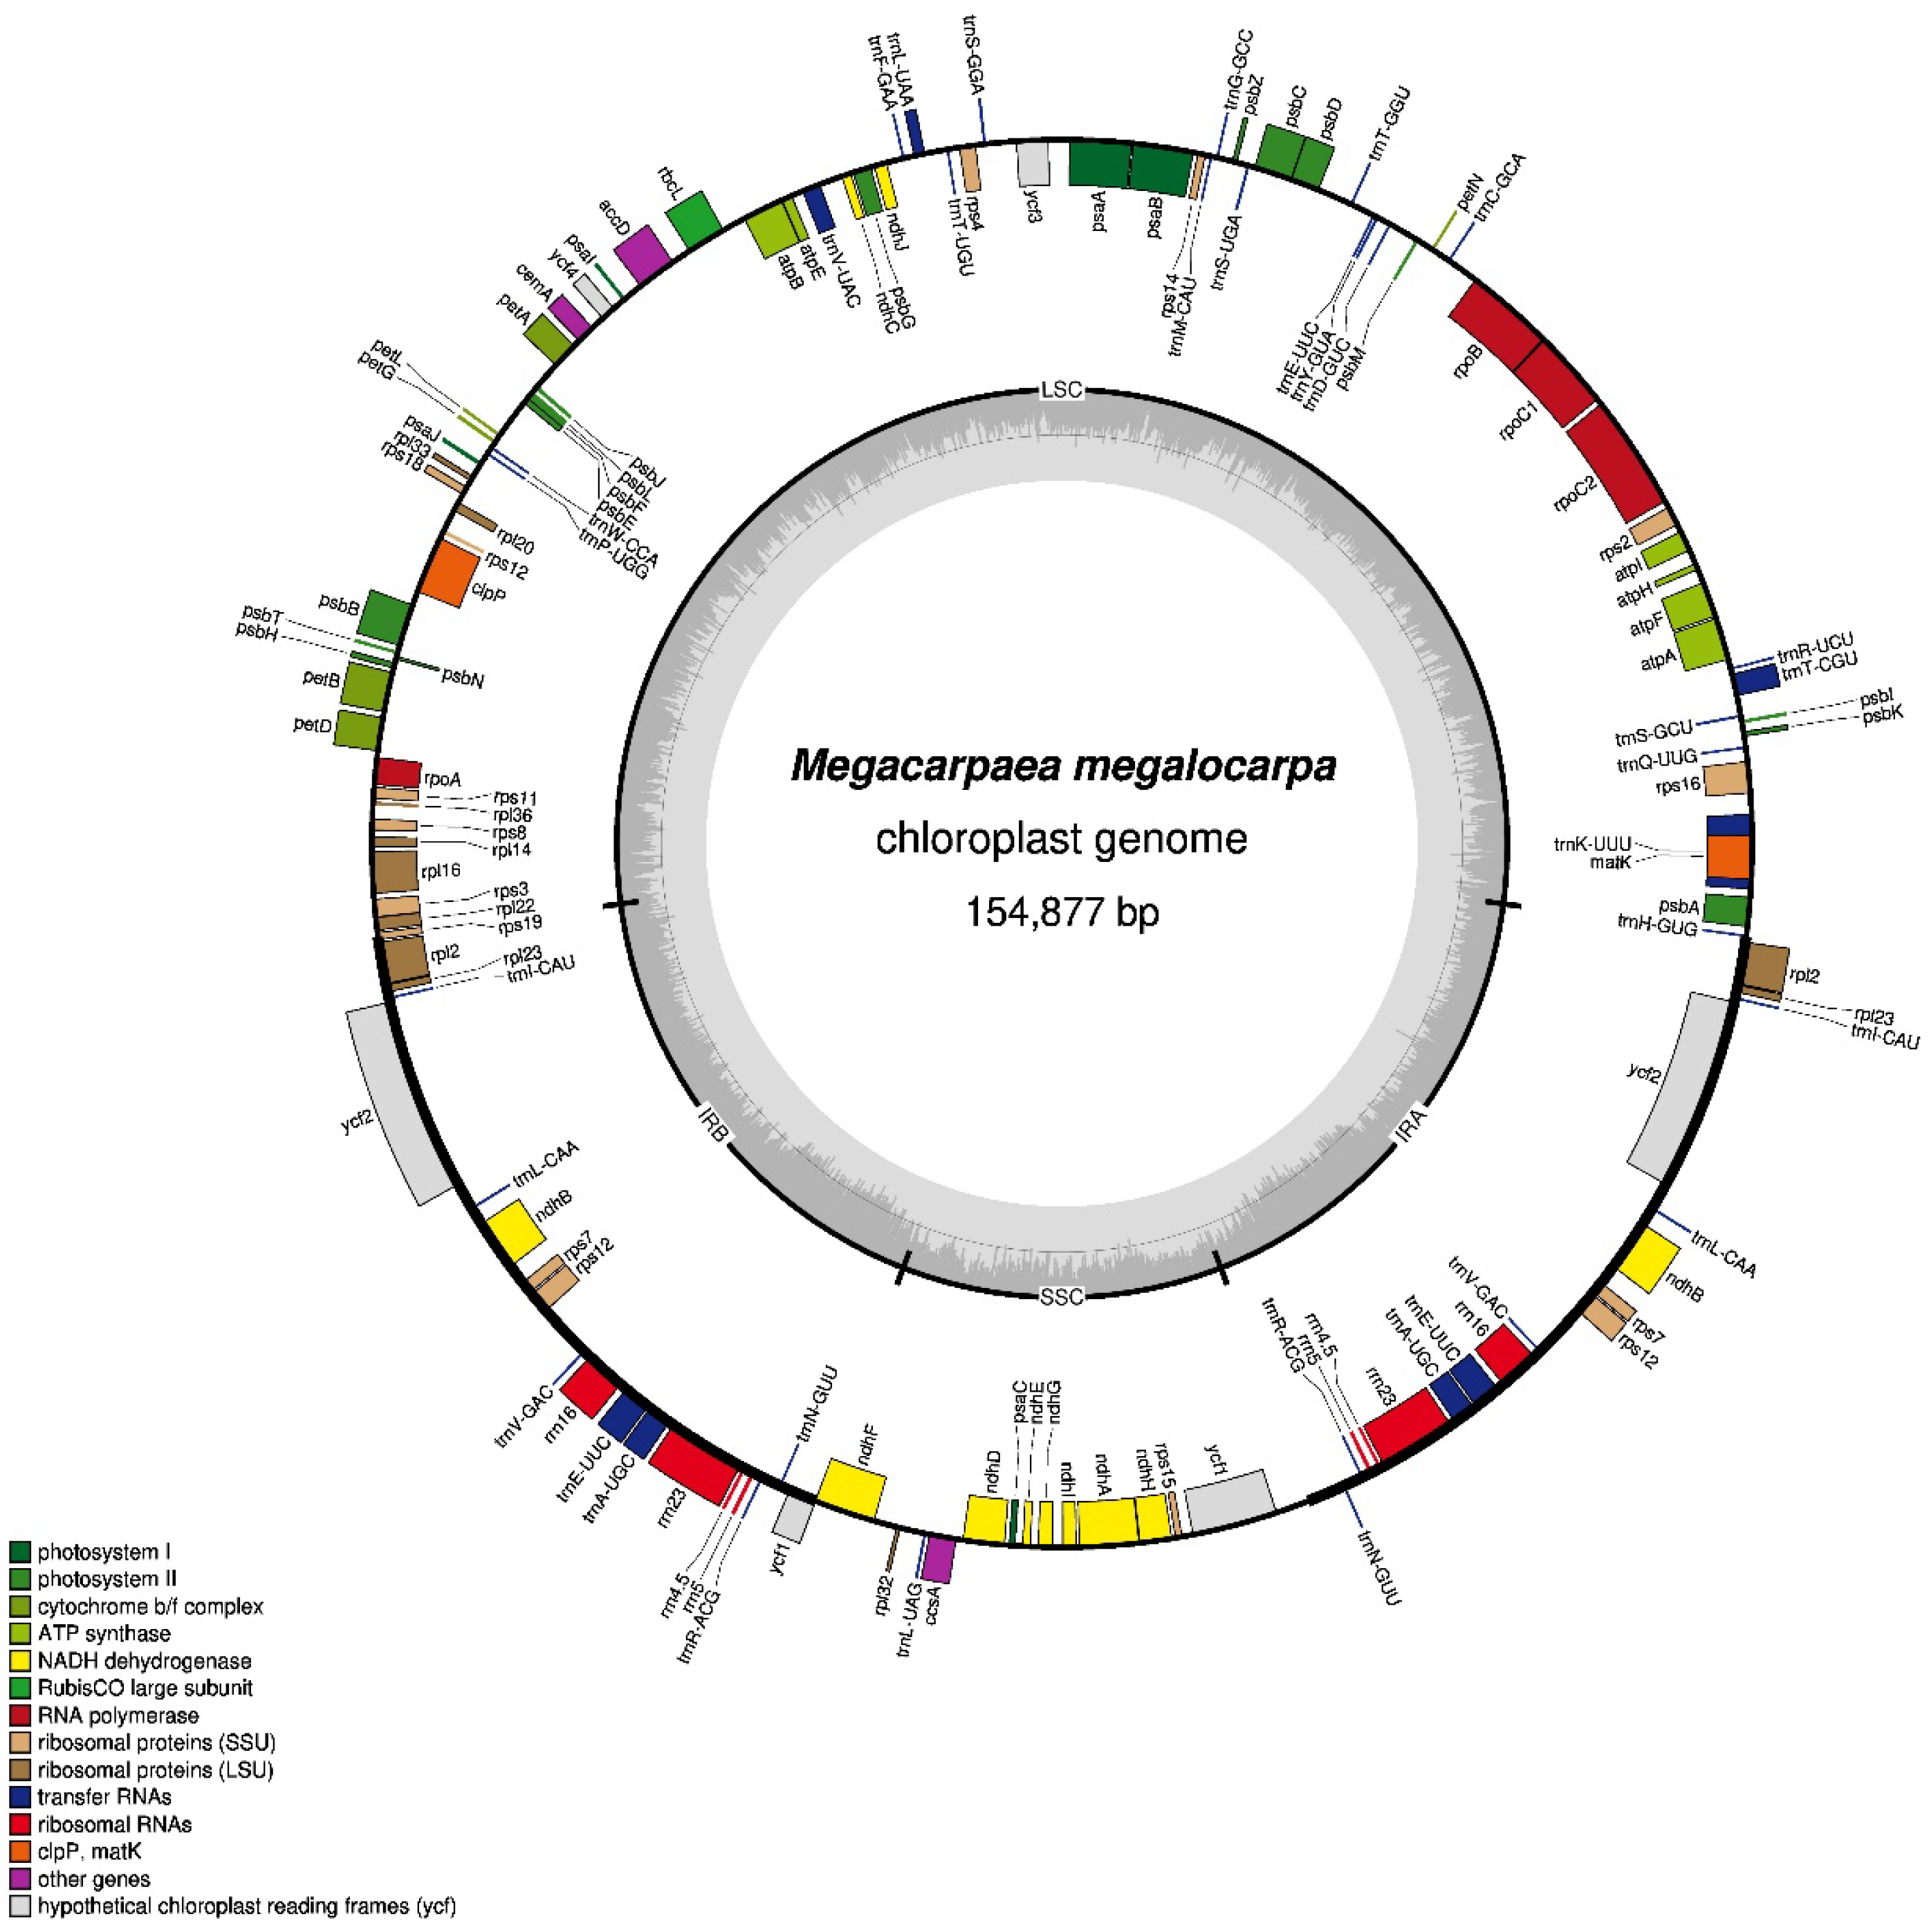
3.1. Basic Characteristics of the M. megalocarpa Chloroplast Genome

The tetrameric structure of M. megalocarpa chloroplast genome measured 154,877 bp, featuring two inverted repeat regions (IR a and IR b), a large single copy (LSC), and a small single copy (SSC), with lengths of 26,446 bp, 84,008 bp, and 17,977 bp, respectively (Figure 2 and Table 1). The overall guanine-cytosine (GC) content stood at 36.20%, with IR a/b showcasing a higher GC content of 42.31% compared to LSC (33.96%) and SSC (29.08%). Despite a variance of 621 bp in the lengths of the chloroplast genomes among the six species, there was minimal fluctuation in their overall GC content and the GC content within the four regions (Table 1).
The chloroplast genome of M. megalocarpa contains a total of 129 genes, comprising 85 protein-coding genes, 36 tRNA genes, and 8 rRNA genes. Compared to other species of the tribe Megacarpaeea, M. megalocarpa lacks a tRNA, whereas M. polyandra and P. pterocarpum had two more protein-coding genes, and both contained eight rRNA genes (Table 1). The functional categorization of M. megalocarpa chloroplast genome is divided into four categories with 18 groups, which consist of 73 self-replicating genes, 45 photosynthesis-related genes, 5 genes associated with biosynthesis, and 6 genes of unidentified function. Among the identified genes, 18 possess introns. Specifically, six tRNA genes (trnA-UGC, trnE-UUC, trnK-UUU, trnL-UAA, trnT-CGU, and trnV-UAC) and ten protein-coding genes (ndhA, ndhB, petB, petD, atpF, rpl16, rpl2, rps16, rpoC1, ycf3) contain a single intron each. Furthermore, the protein-coding genes clpP and rps12 each contain two introns (Table 2). A total of 83 genes (comprising 60 PCGs and 21 tRNA genes) are situated in the LSC region, while 12 genes (including 11 PCGs and 1 tRNA gene) reside in the SSC region. Moreover, 18 genes were duplicated in the IR region, which includes seven protein-coding genes (ndhB, rpl2, rpl23, rps12, rps7, ycf1, ycf2), four rRNA genes (rrn16, rrn23, rrn4.5, rrn5), and seven tRNA genes (trnA-UGC, trnE-UUC, trnI-CAU, trnL-CAA, trnN-GUU, trnR-ACG, trnV-GAC) (Figure 2 and Table 2).

3.2. SSRs and Long Repeat Sequences

The simple sequence repeats (SSRs) generally consisted of DNA sequences containing tandem repeats of one to six bases and were widely distributed at various locations throughout the chloroplast genome. In the genome of M. megalocarpa, 105 SSRs were discovered, comprising of 68 mononucleotide repeats, 20 dinucleotide repeats, 5 trinucleotide repeats, 11 tetranucleotide repeats, and 1 pentanucleotide repeat. Pentanucleotide repeats were only present in M. polyandra and M. megalocarpa, with M. polyandra having three and M. megalocarpa having one (Figure 3A). Hexanucleotide repeats were absent in six species, with mononucleotide repeats, primarily A/T bases, being the most common, indicating a bias in base composition.
The long repetitive sequences were relatively long DNA sequences that repeat in the chloroplast genome. Within the genome of M. megalocarpa, 48 long repetitive sequences were identified, consisting of 27 forward repeats, 15 palindromic repeats, 3 complementary repeats, and 3 reverse repeats. M. megalocarpa displayed the highest count of forward and palindromic repeats among the six species, whereas P. dolabratum and P. cornutum lacked complementary and reverse repeats (Figure 3B). Notably, these sequences were not shorter than 30 bp, as the parameter was set to a minimum value of 30 bp. Mostly 30–35 bp repeats were found in all species studied, with only M. polyandra containing one repeat of 46–50 bp in length (Figure 3C).

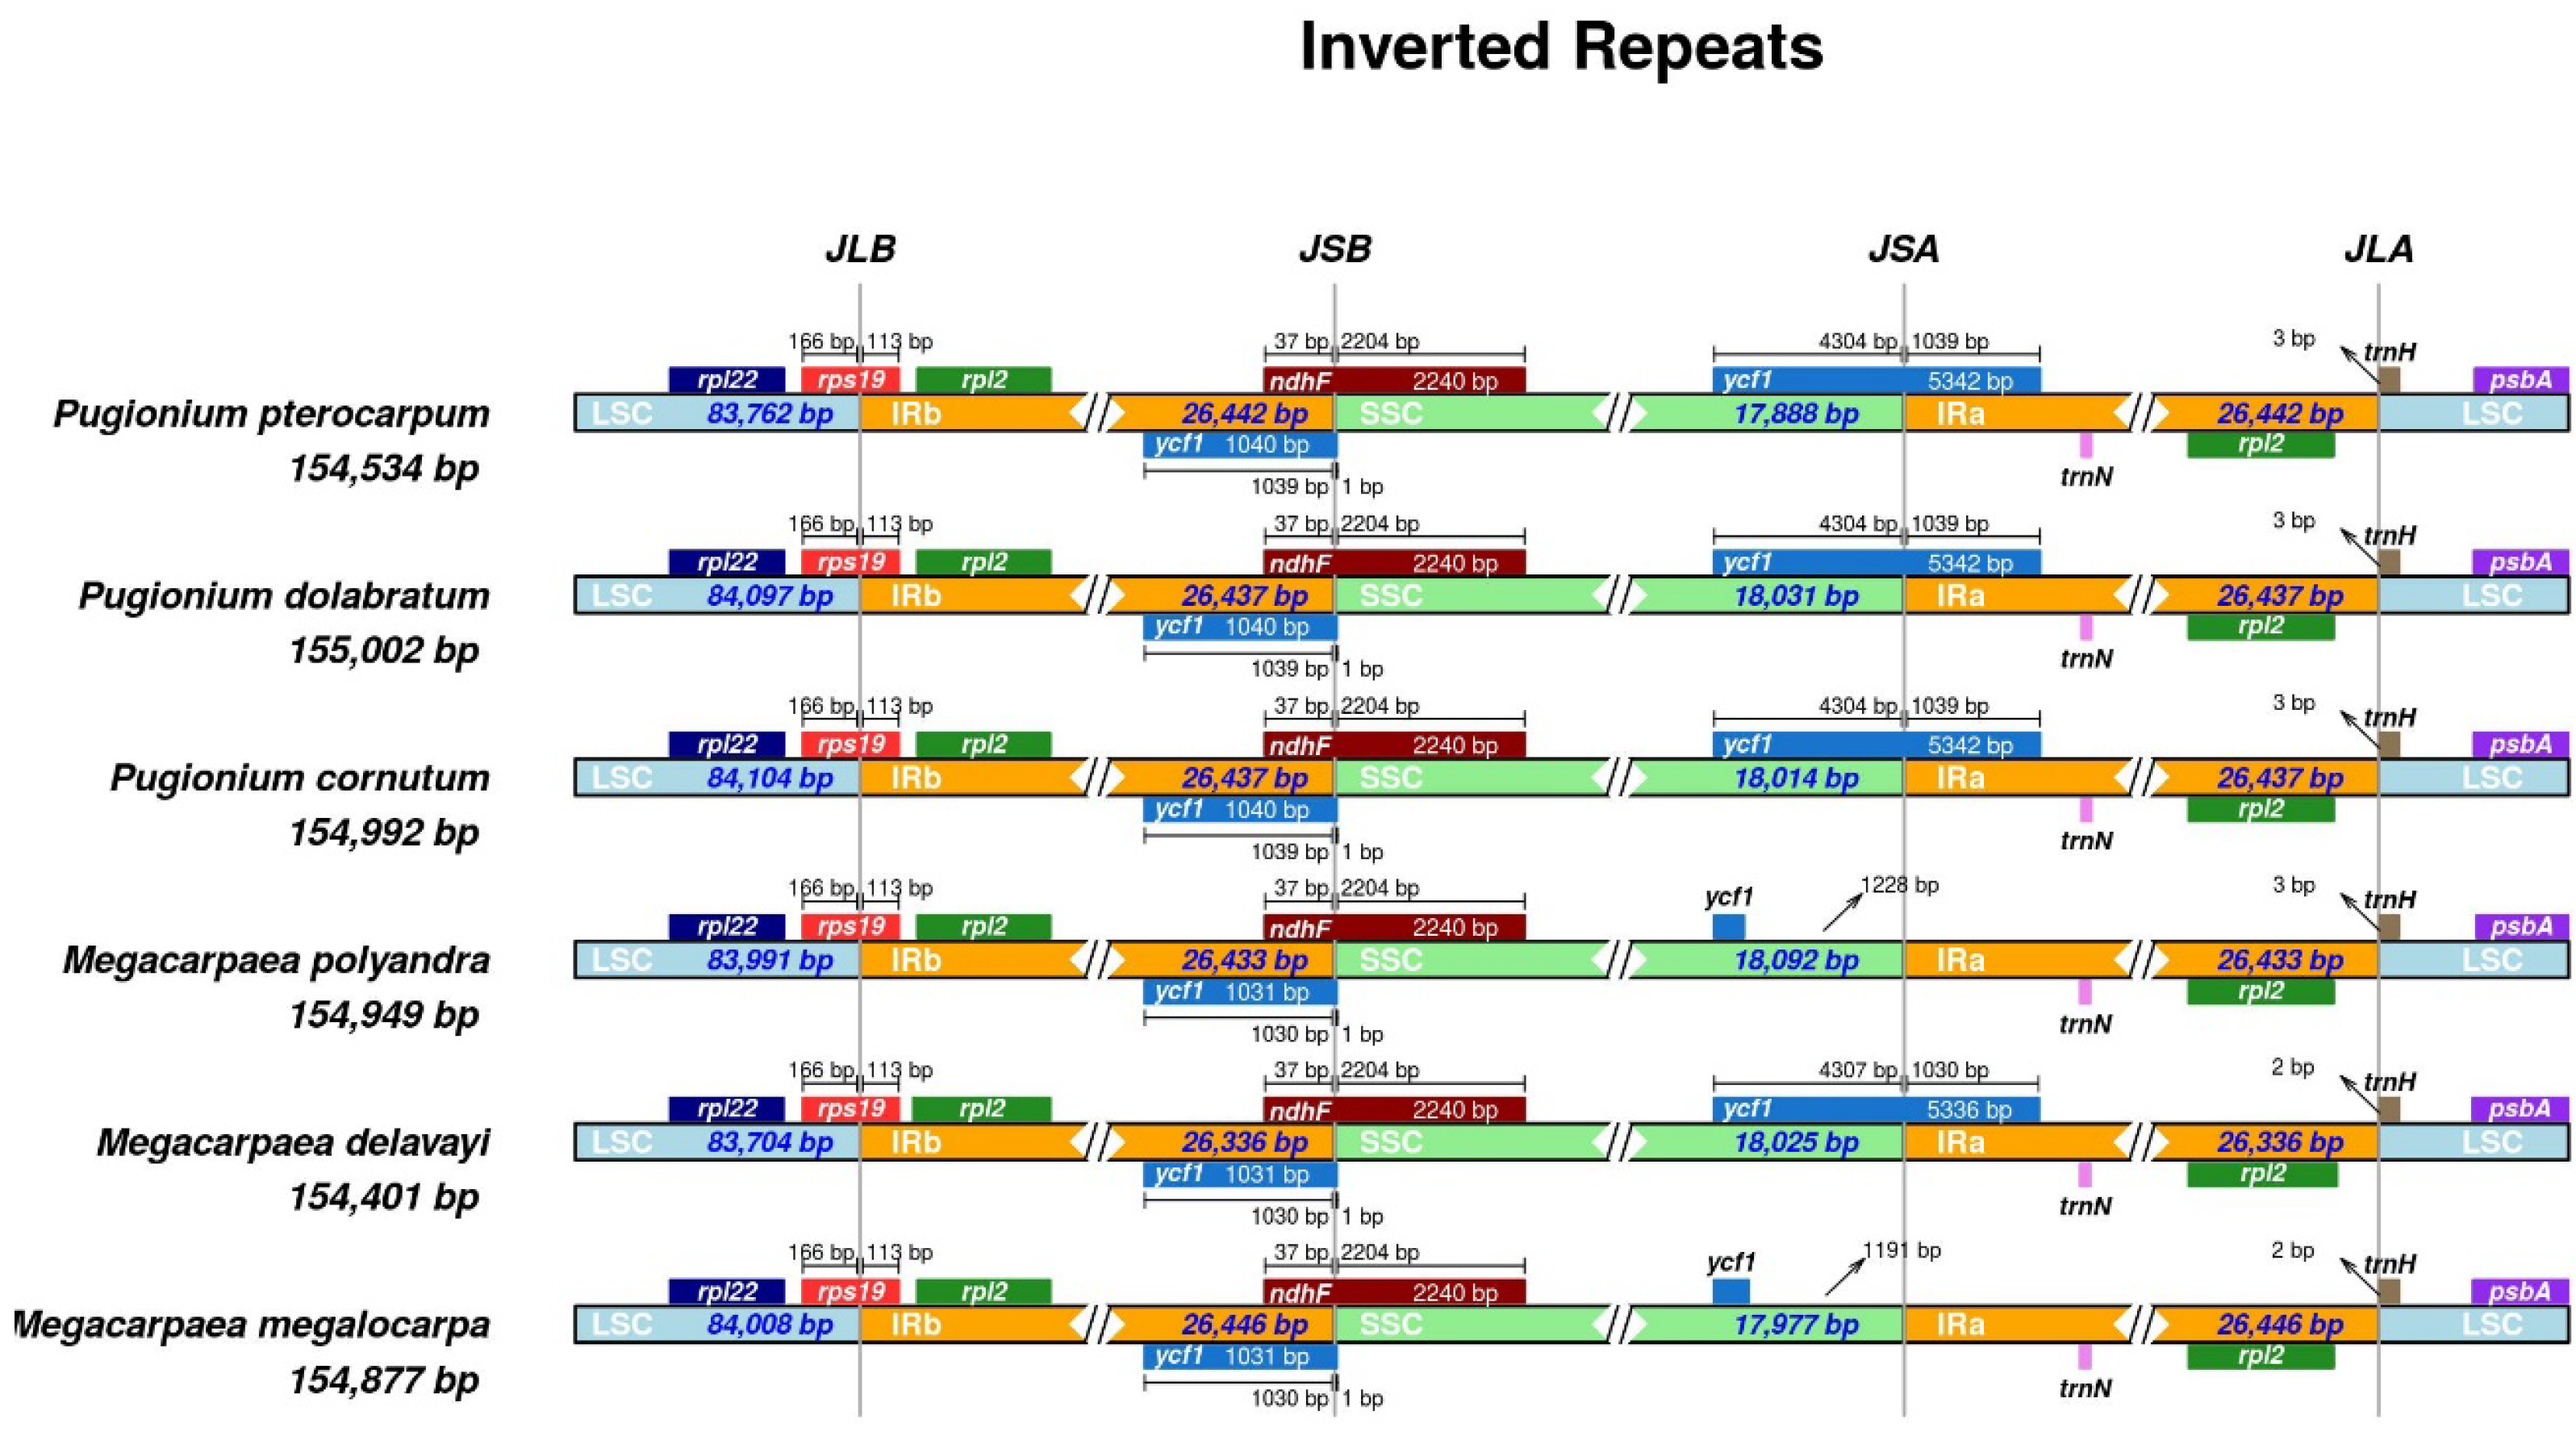
3.3. Expansion and Contraction of the Inverted Repeat Boundaries

Differences in genome size among plant species may arise from changes in the IR boundary region of the chloroplast genome. The analysis showed that six species had the same number of rps19 and ndhF genes at the borders of IRb/LSC and IRb/SSC, with gene crossover occurring. The genes rpl22, psbA, and trnH were exclusively located in the LSC region, while the rpl2 gene in the IR region and the ycf1 gene in the IRb region did not undergo gene crossover. In contrast to the other four species, the ycf1 gene was only present in the SSC region in M. megalocarpa and M. polyandra. Generally, the chosen species displayed a high level of conservation at the boundaries of LSC/IRb, IRb/SSC, and IRa/LSC, whereas the SSC/IRa boundary was more susceptible to mutations (Figure 4).

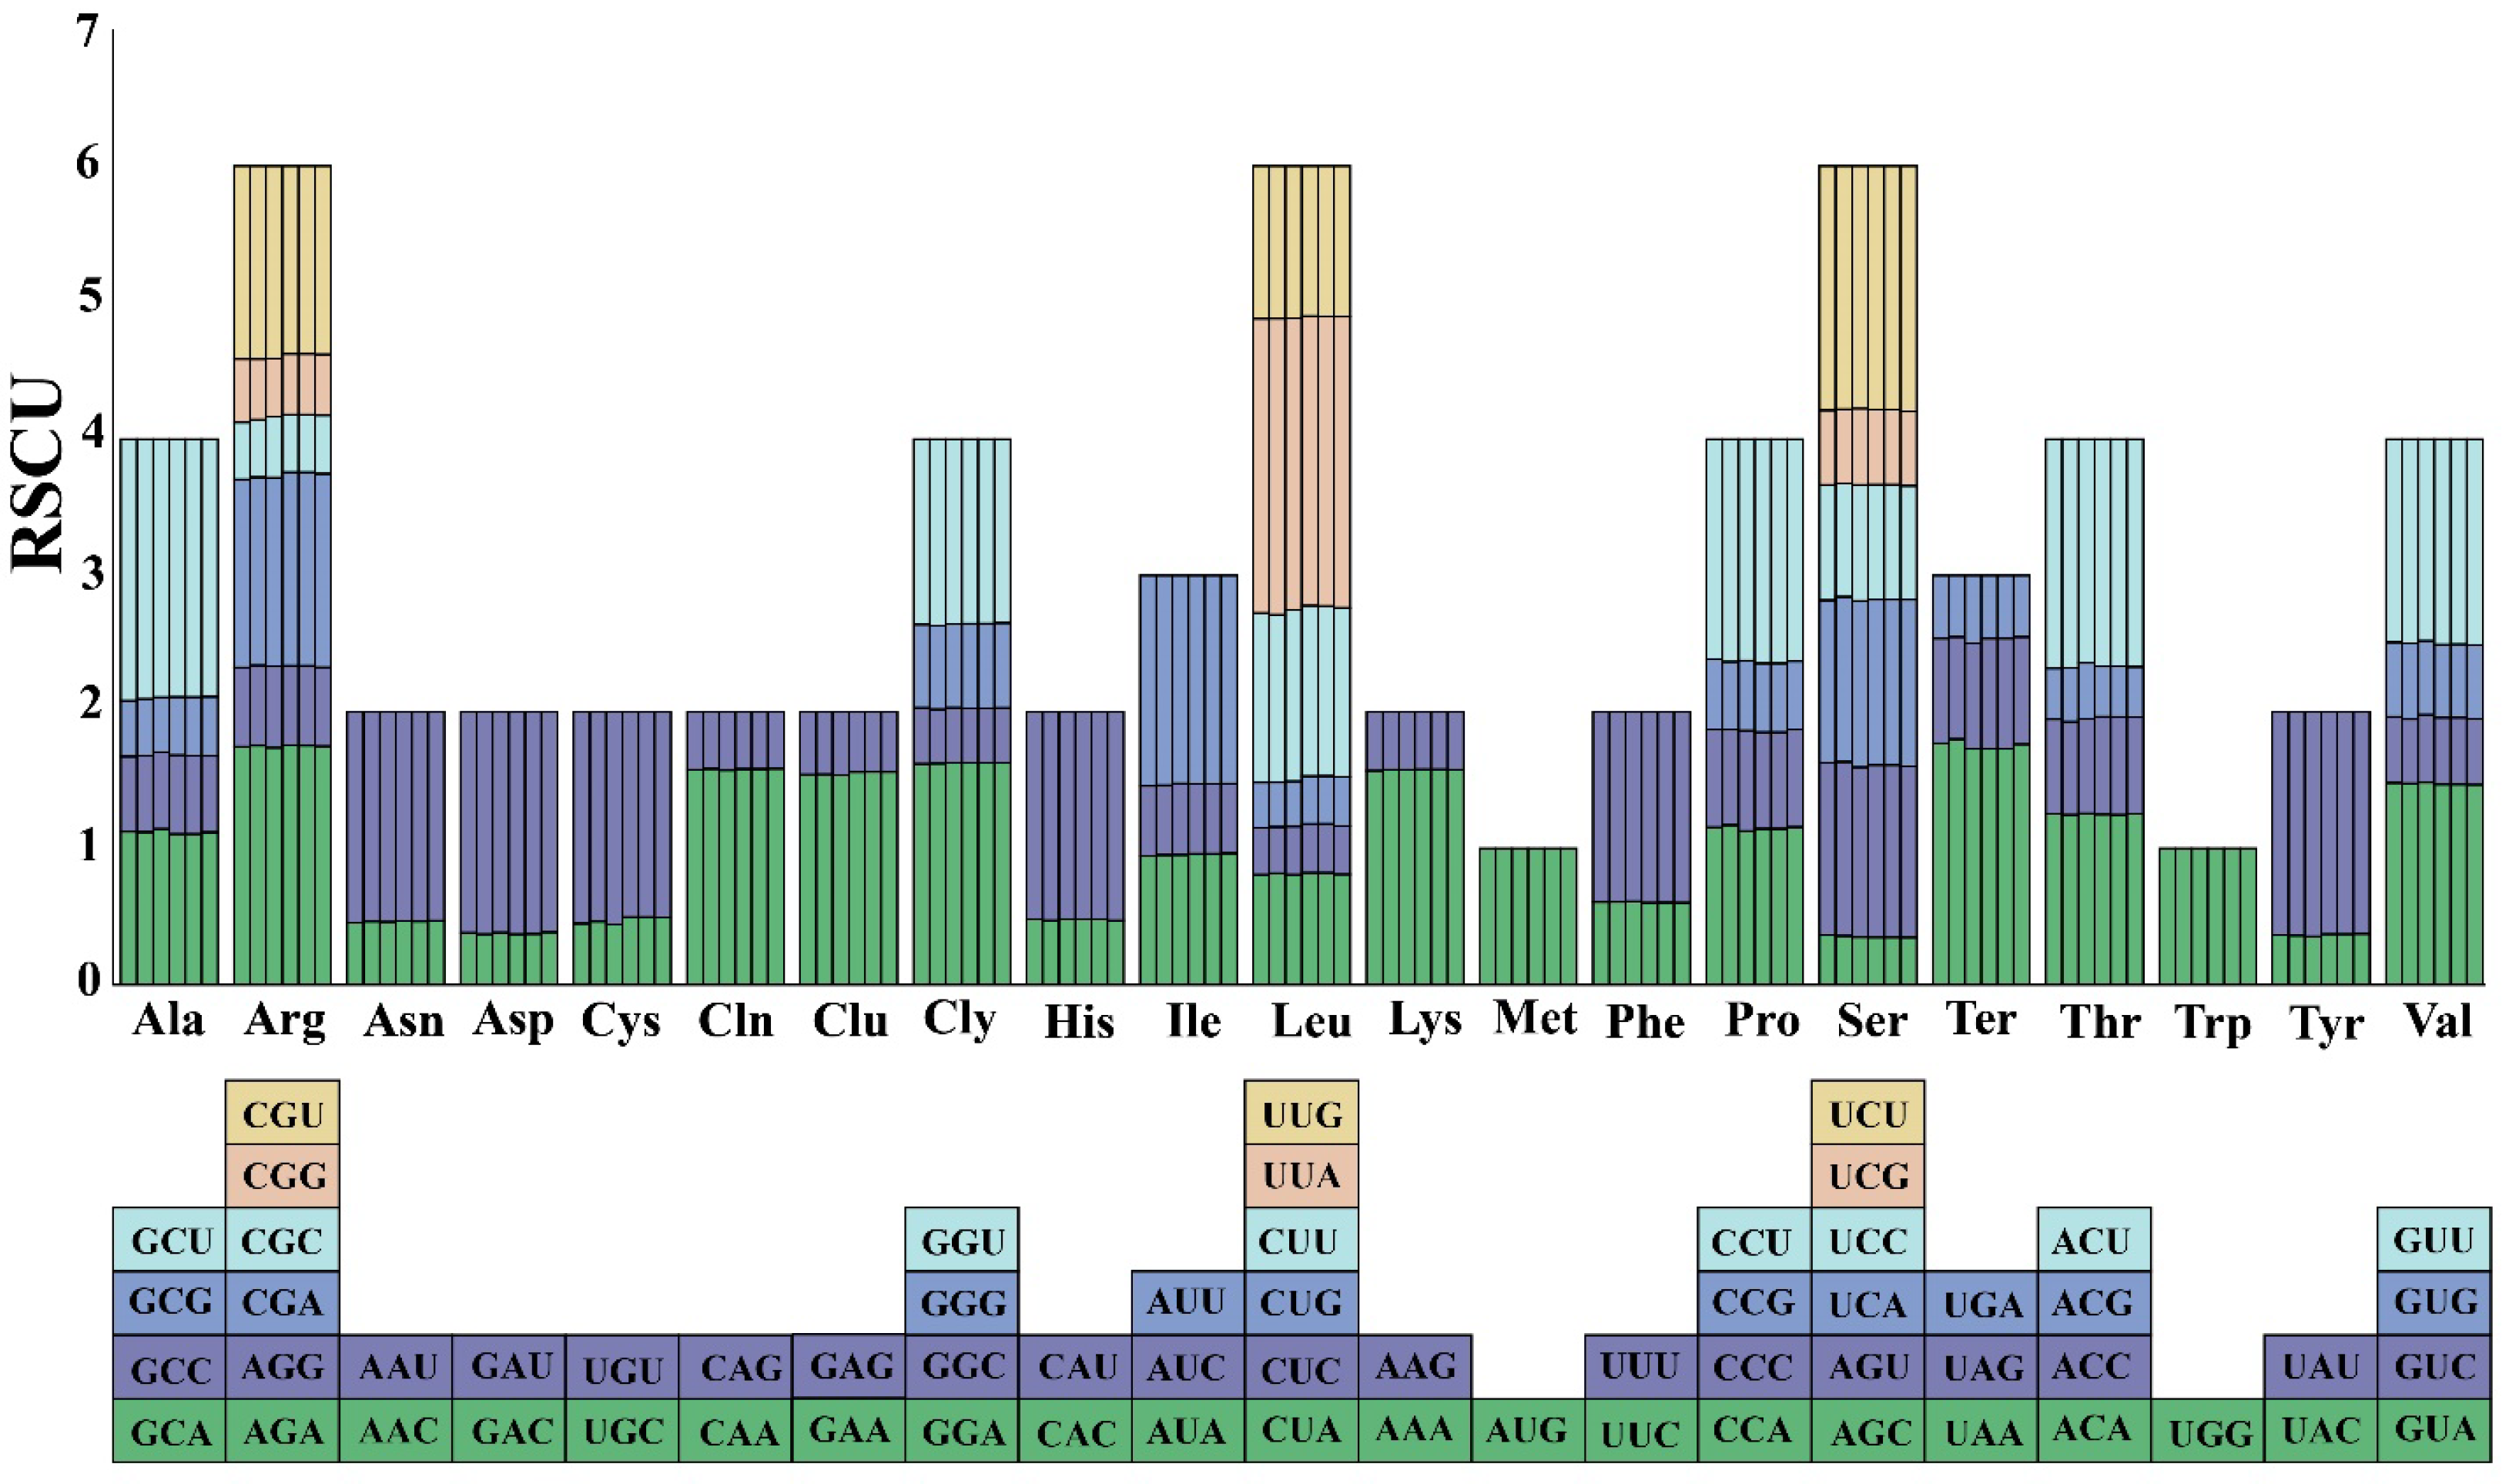
3.4. Codon Usage Bias Analysis

The analysis of codon usage bias in the chloroplast genome of M. megalocarpa revealed almost the same RSCU values among the six species examined. The amino acids with the highest codon diversity across all species were Arginine (Arg), Leucine (Leu), and Serine (Ser), each consisting of six different codons. Conversely, Methionine (Met) and Tryptophan (Trp) were represented by only one codon each. Among the 64 codons studied, 30 exhibited RSCU values exceeding 1, indicating a relatively high frequency of use. Notably, two codons, AUG and UGG, had RSCU values of 1, suggesting no specific bias in their utilization. Additionally, the analysis showed that codons ending in A/U tended to have RSCU values higher than 1, while those ending in C/G had values below 1, which was consistent with the situation in genomes with lower GC content (Figure 5).

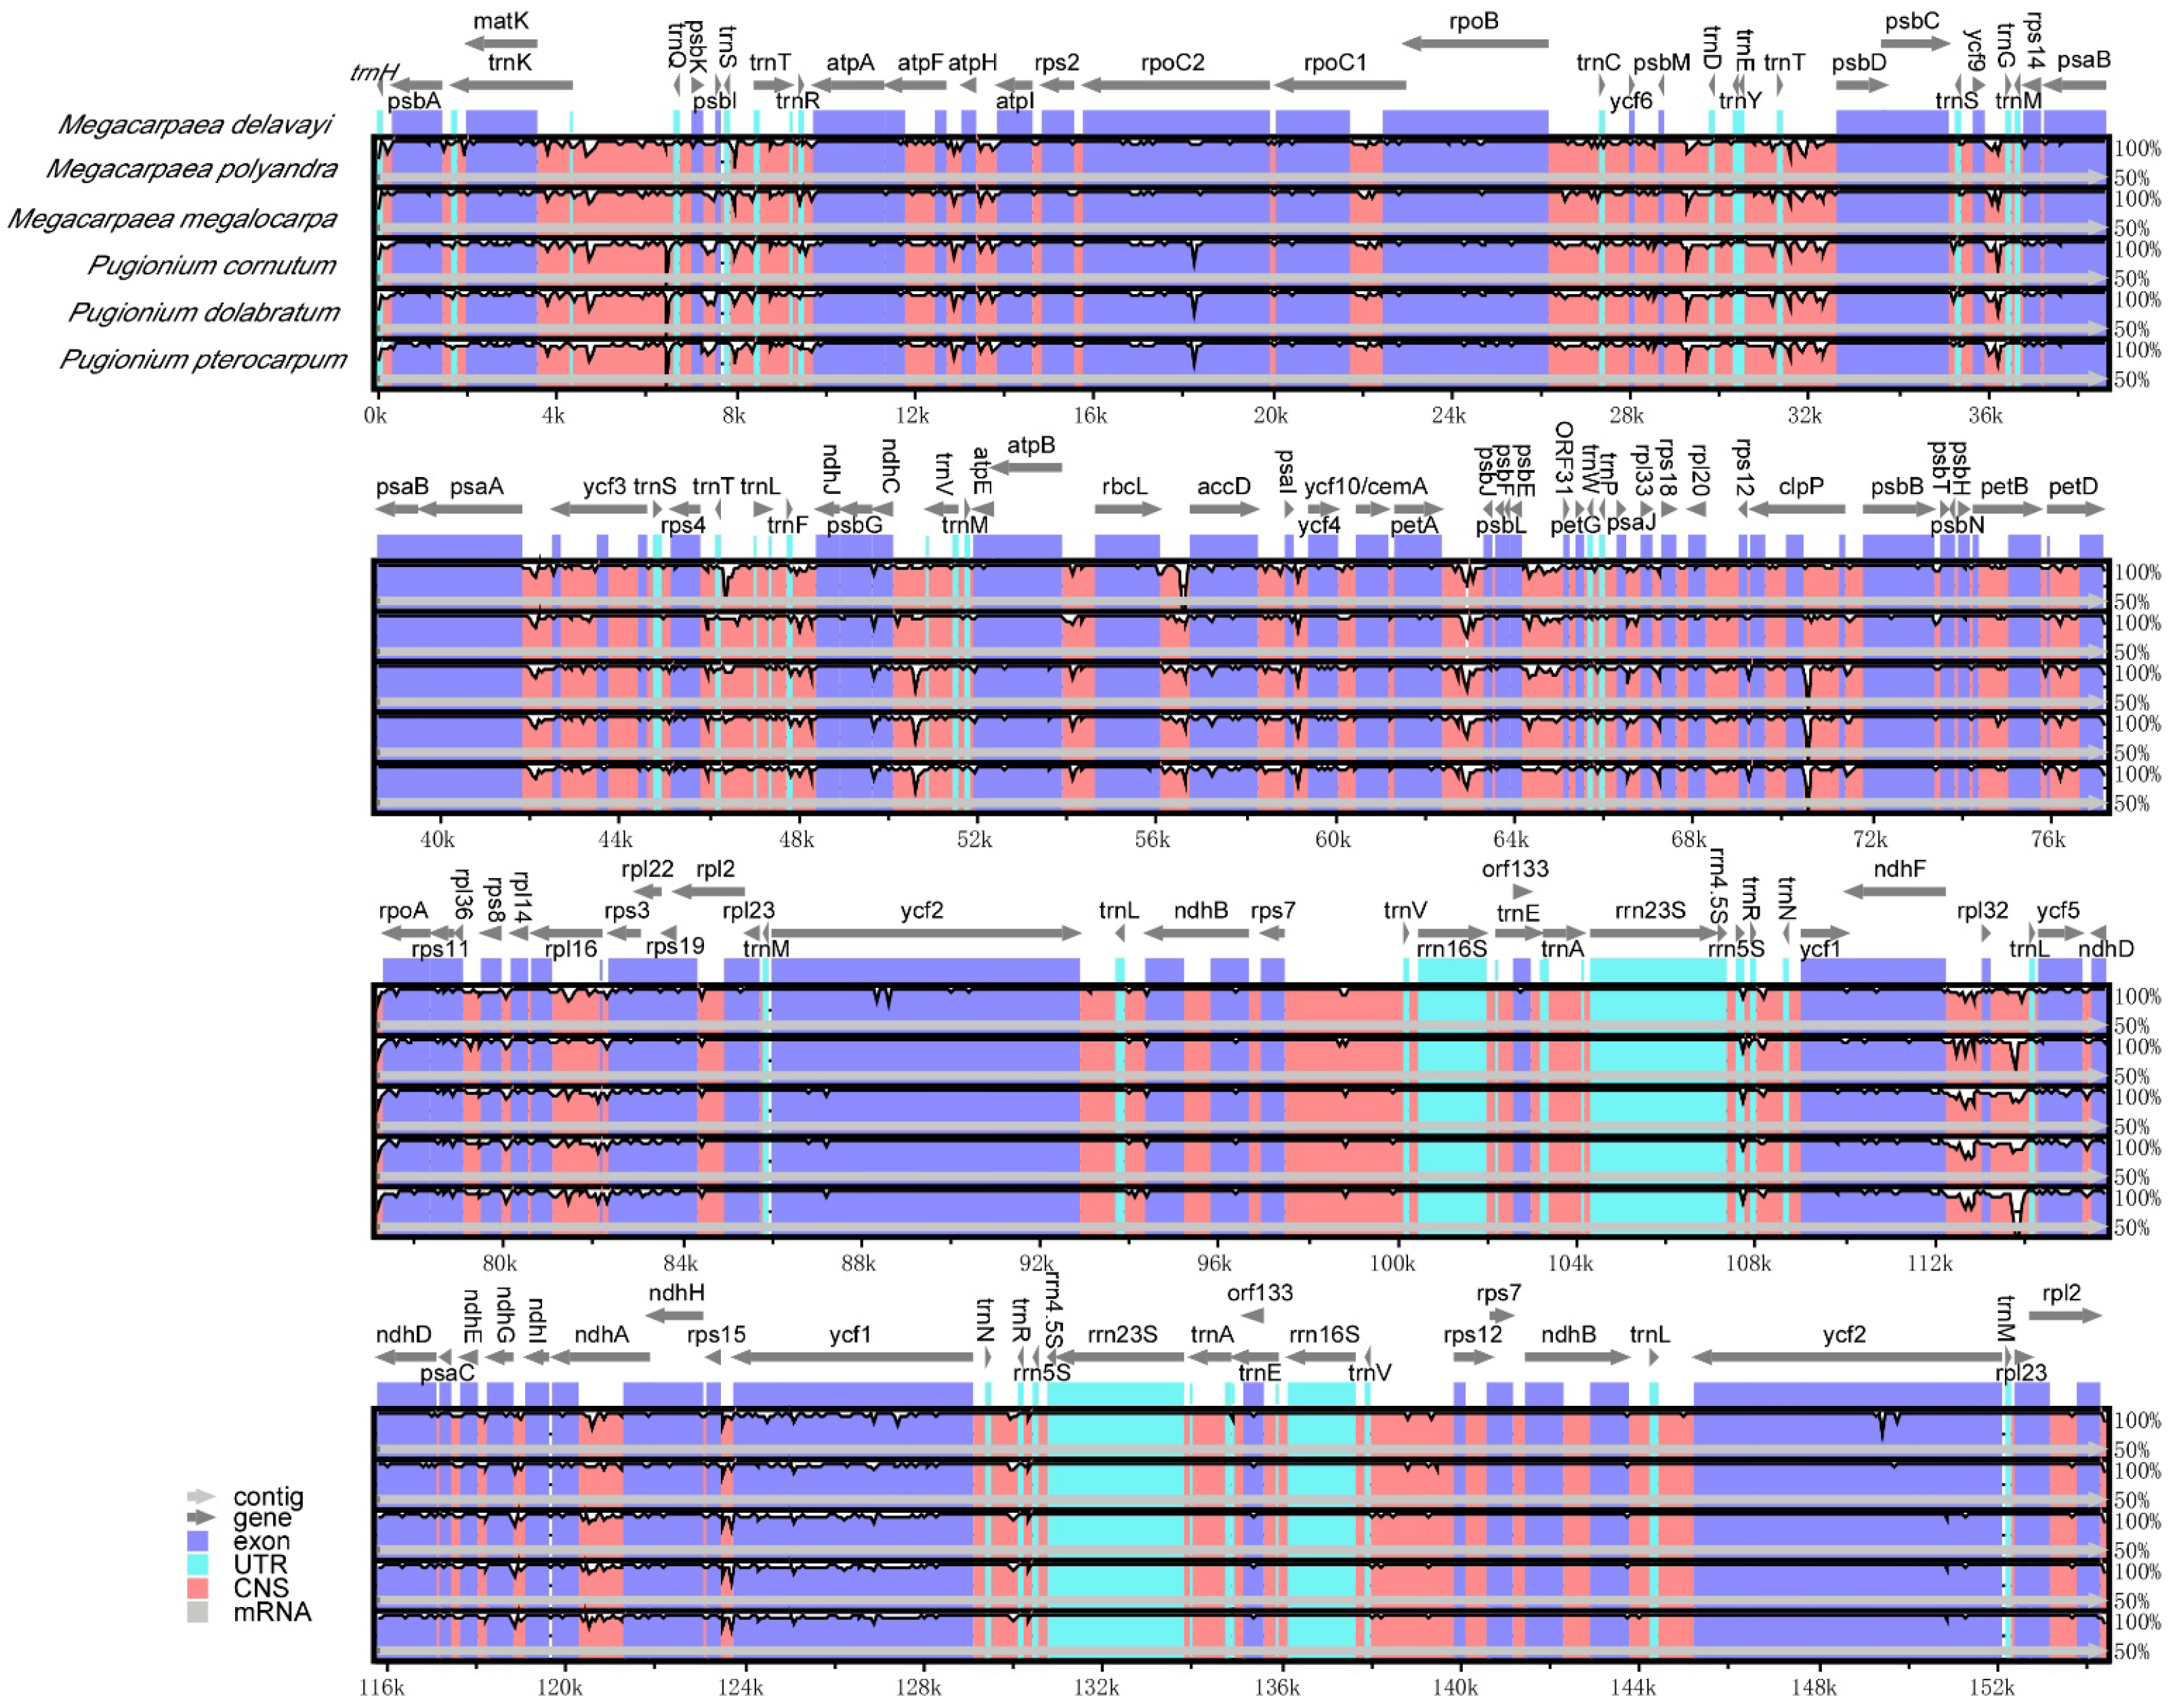
3.5. Comparative Analysis of Chloroplast Genome Sequences

A comparative analysis of the chloroplast genome sequences from six species indicated no significant rearrangements or inversions in any of the four regions (Figure 6). However, sequence variation was greater in the SSC and LSC regions compared to the IR region. The high conservation of the IR region may be attributed to the conserved properties of the rRNA genes situated within it. In the six species, the coding regions exhibited higher conservation than the non-coding regions. The coding region variants of the gene included rpoC2, psbG, accD, rpoA, rps11, rpl22, ndhF, ycf1. Meanwhile, variants in the gene’s spacer region were primarily found in regions such as trnS-trnT, atpF-atpH, atpH-atpI, psbM-trnD, trnT-psbD, psaA-ycf3, trnT-trnL, trnF-ndhJ, rbcL-accD, petA-psbJ, and rps15-ycf1.

3.6. Selective Pressure Analyses

Calculating Ka/Ks between species revealed that the Ka/Ks values could not be calculated for some genes (atpA, atpH, ndhC, petB, petG, petL, petN, etc.) because Ka or Ks were 0, indicating that these genes were relatively conserved and had no nucleotides to replace. The genes with more than three NA values (Ka tends to infinity) or 0 values (Ks tends to 0) were excluded, and the Ka/Ks values of the remaining 41 genes were analyzed and visualized (Figure 7). The majority of protein-coding genes exhibited Ka/Ks values below one, suggesting that these genes were subject to purifying selection. The Ks/Ks values of rpl20 were greater than one, indicating that this gene was under positive selection.

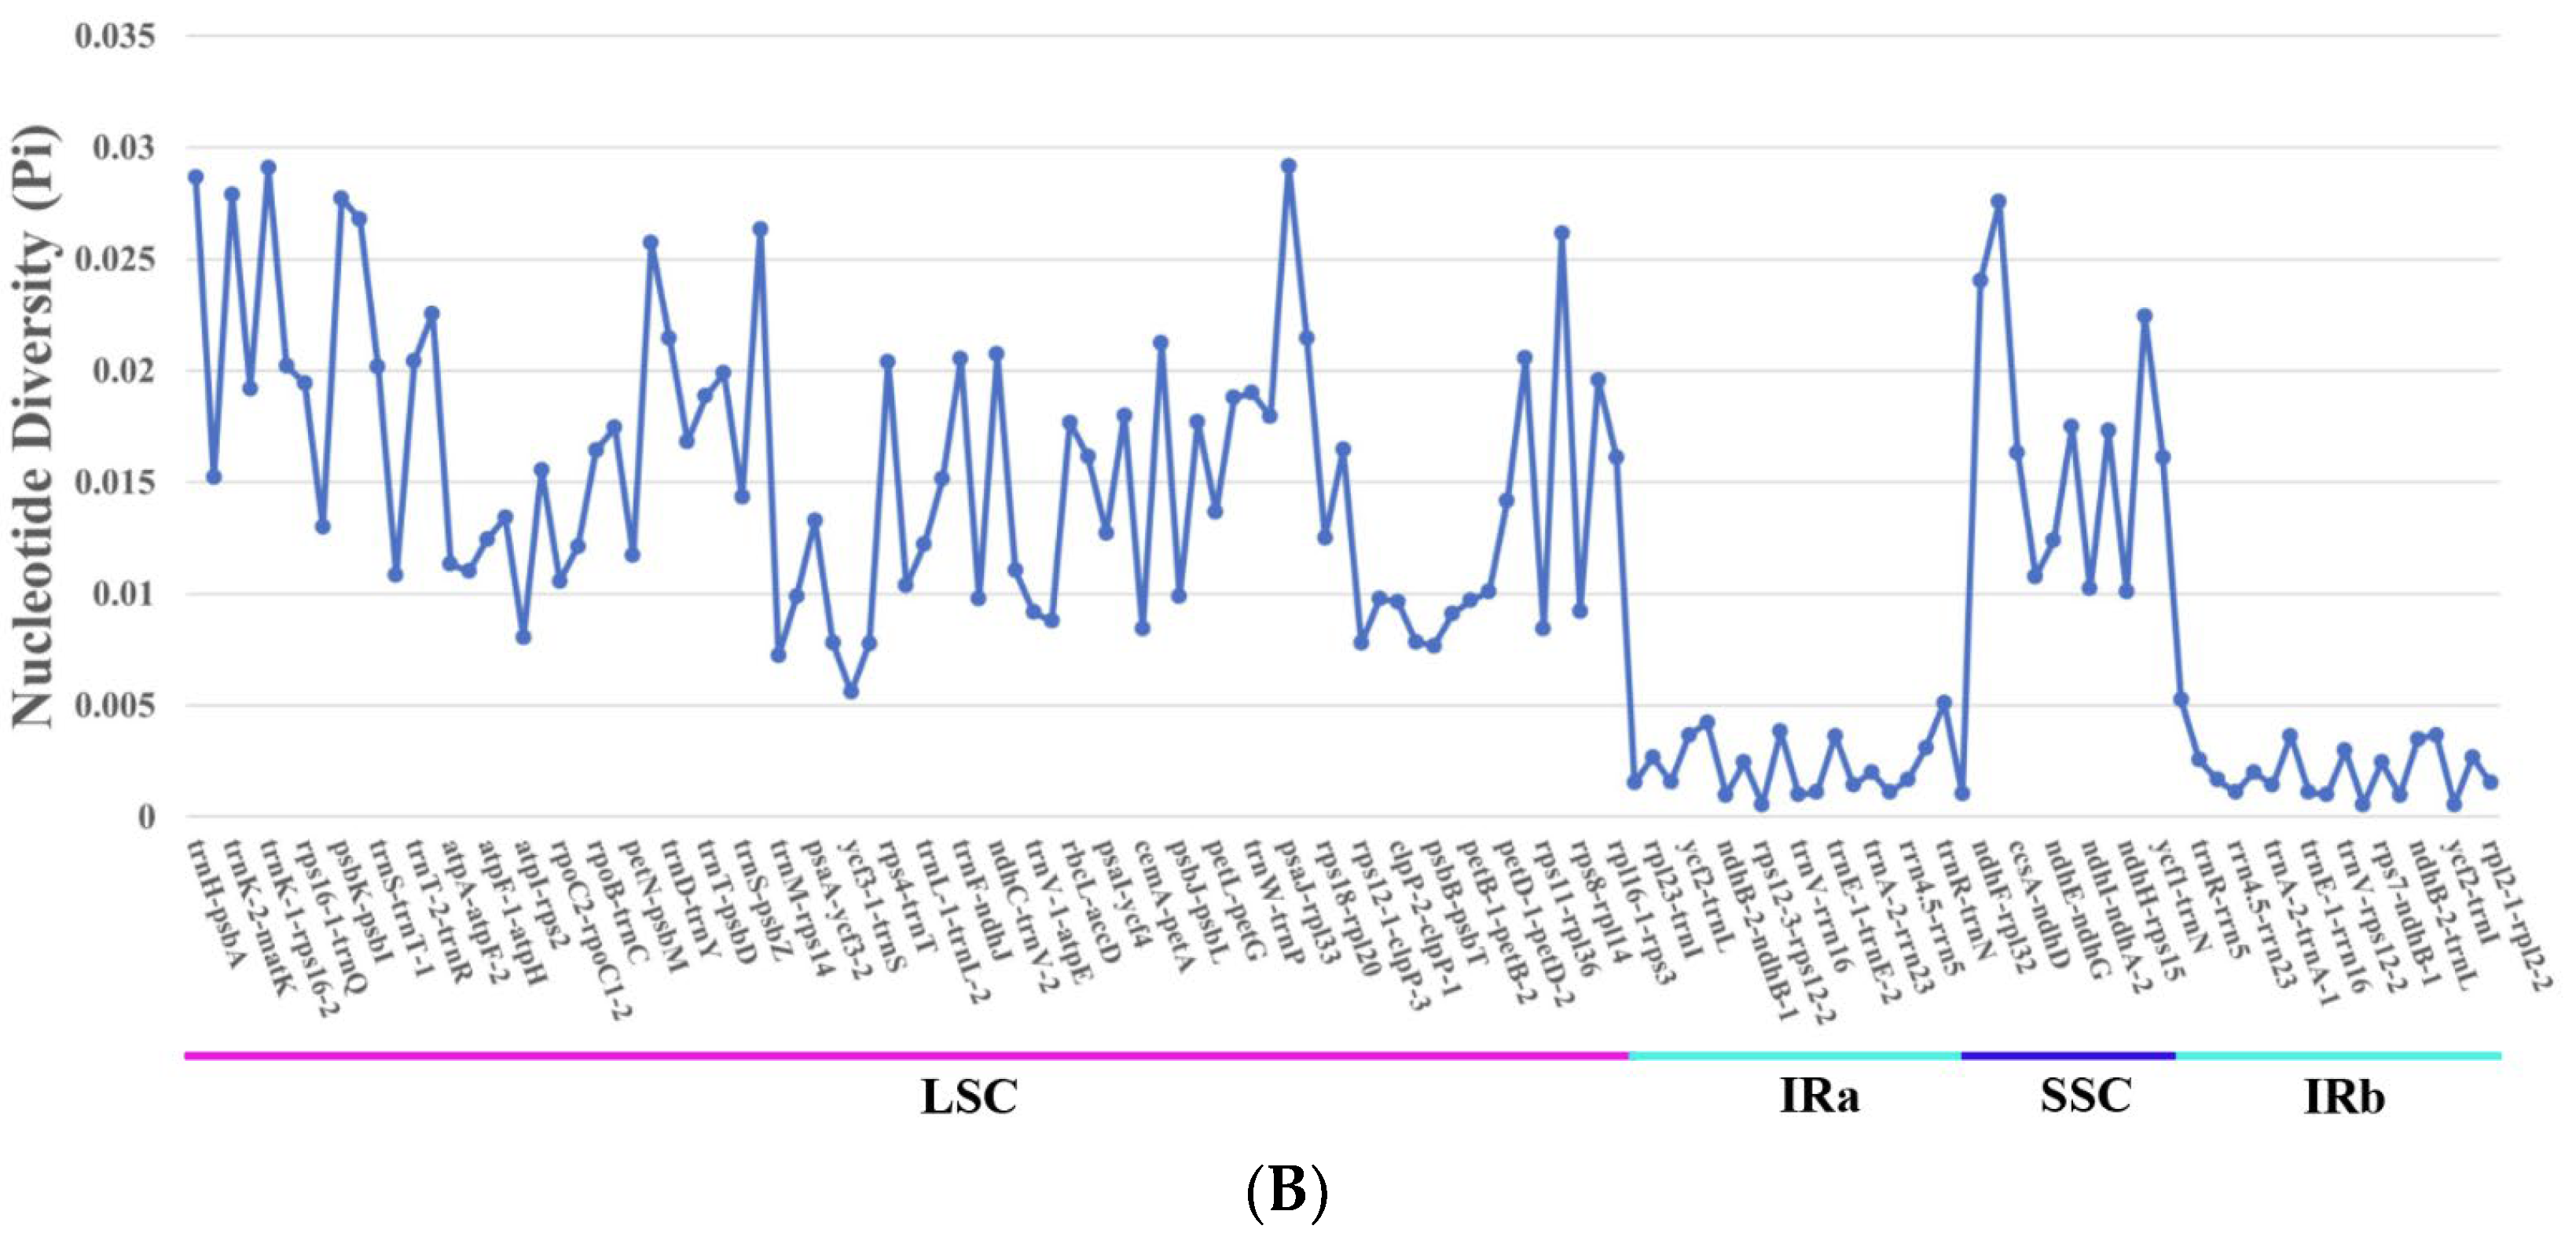
3.7. Nucleotide Diversity

Nucleotide diversity values (Pi) of 127 non-coding and 122 coding regions (Tables S2 and S3) revealed that three coding regions (trnK-2, psaJ, ycf1) (Figure 8A) and 10 non-coding regions (trnH-psbA, trnK-1-rps16-2, psbK-psbI, psbI-trnS, psbM-trnD, psbZ-trnG, psaJ-rpl33, rpl36-rps8, rpl32-trnL) (Figure 8B) exhibited Pi values greater than 0.025. Notably, the psaJ gene displayed a Pi value exceeding 0.03, signifying variability and diversity at the nucleotide level in this region. The chloroplast genome Pi values ranged from 0 to 0.0308, averaging 0.01041. Among the 13 identified regions, 11 were located in the LSC region, with only two (rpl32-trnL, ycf1) found in the SSC region. The nucleotide polymorphisms in the IR region were notably lower compared to the LSC and SSC regions, with the SSC region harboring fewer polymorphisms than the LSC region.

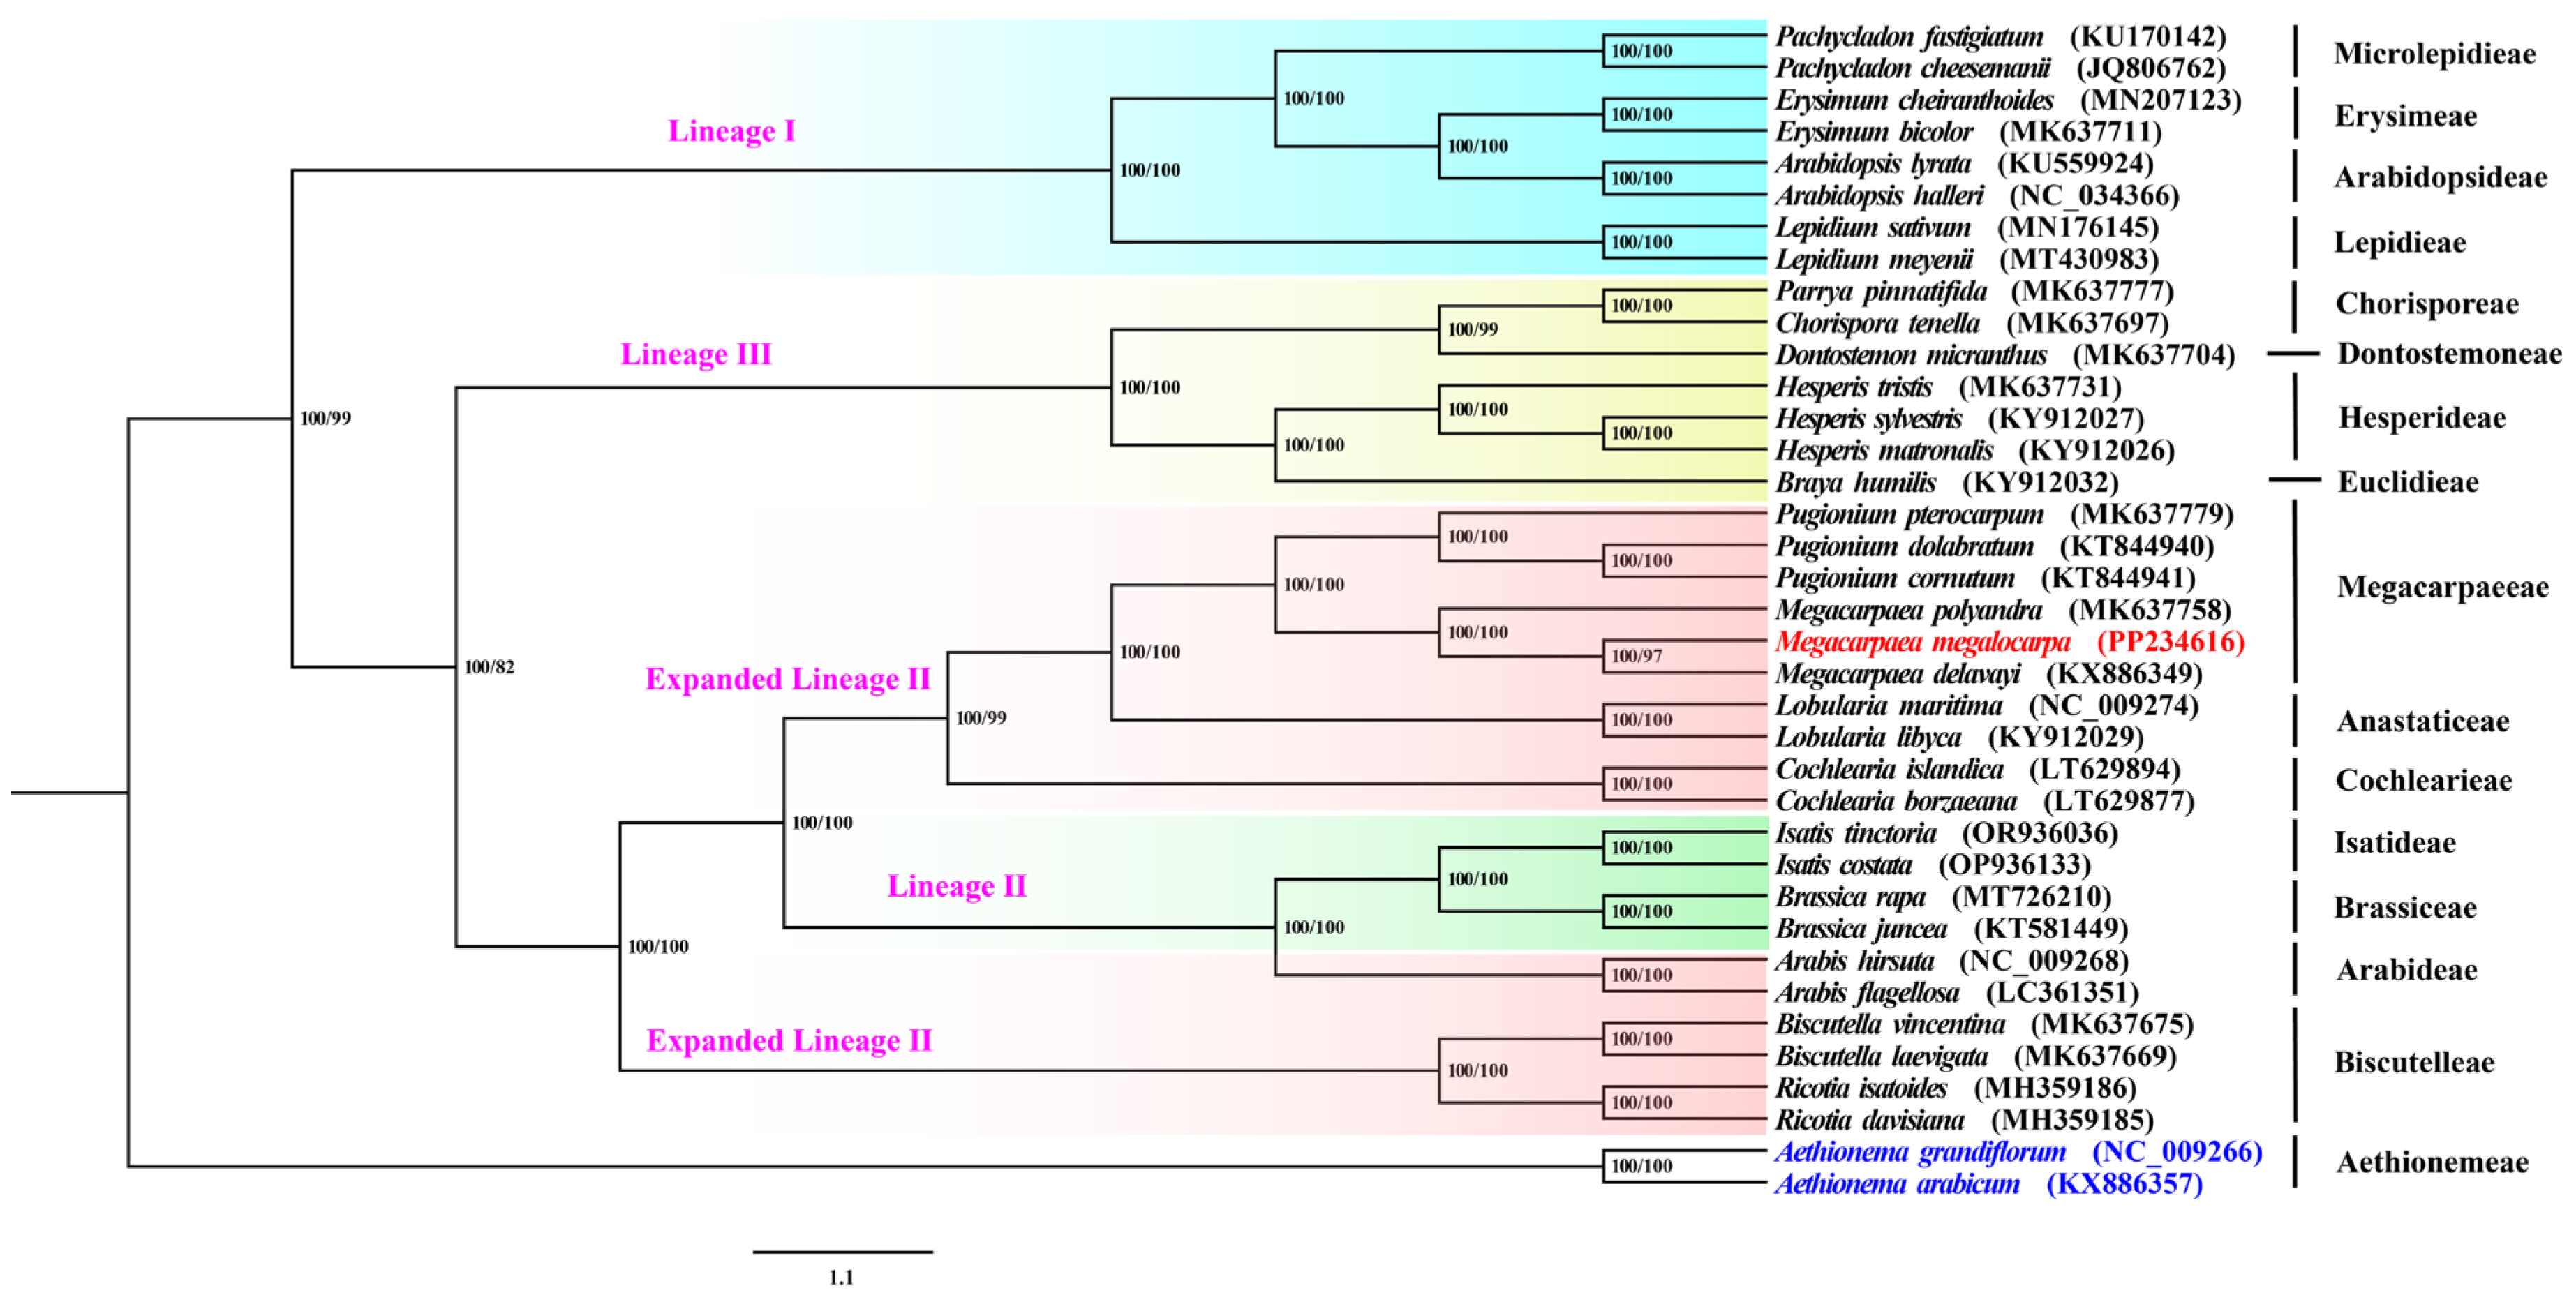
3.8. Phylogenetic Analyses and Estimation of Divergence Times

Studies on the taxonomic status and evolutionary relationships of M. megalocarpa show that the two phylogenetic methods (ML/NJ) had almost similar topological structures, with generally high support values (Figure 9). Four major lineages were identified: lineages I (Microlepidieae, Erysimeae, Arabidopsideae, Lepidieae), lineages III (Chorisporeae, Dontostemoneaae, Hesperideae, Euclidieae), lineages II (Isatideae, Brassiceae), and expanded lineage II (Megacarpaeeae, Anastaticeae, Cochlearieae, Arabideae, Biscutelleae). The phylogenetic analysis confirmed the phylogenetic position of M. megalocarpa in the expanded lineage II of Brassicaceae. The evolutionary trees confirmed that Megacarpaea was closely related to Pugionium, and that M. megalocarpa and M. delavayi were the most closely related species, with bootstrap support values higher than 97 for both their ML and NJ trees.
Estimated divergence times, using phylogenetic relationships as a reference, showed that the core Brassicaceae and Aethionemeae began to split at 36.77 Mya during the Eocene boundary (Figure 10 and Figure S1), while the origins of the major lineages chloroplast genome sequences or clades occurred between the Oligocene and Miocene. The divergences within lineages I and lineages III were dated to Oligocene, while those in the expanded lineage II were estimated to have occurred around 28.02 Mya (23.75–32.76 Mya). The divergence between Pugionium and Megacarpaea was estimated around 8.18 Mya (5.77–12.50 Mya). M. megalocarpa diverged from M. delavayi about 4.97 Mya (2.82–6.76 Mya), whereas M. megalocarpa diverged from M. polyandra about 6.63 Mya (3.65–8.54 Mya).

4. Discussion

4.1. Architecture of Chloroplast Genomes in Megacarpaeeae

In this study, we present the first assembly and annotation of the M. megalocarpa whole chloroplast genome. Five previously reported closely related species were used in a basic comparative study to confirm the close relationships found within the genus Megacarpaea and with other genera. The size, structure, and gene content of the chloroplast genome in this species were highly similar to those of P. dolabratum, P. cornutum [34], and other Brassicaceae species [35,36], indicating a high conservation of the chloroplast genome structure. The guanine and cytosine (GC) content in the IR a/b region of M. megalocarpa was found to be higher than that in the LSC and SSC regions, which is consistent with previous chloroplast genome studies in species such as Sinapis alba and Eutrema japonicum [37,38]. This suggests a high conservation of the IR region, possibly due to the conserved nature of the rRNA genes located in this region, resulting in a higher GC content in the IR region than in other regions. Moreover, the GC content exhibited variation across different species, which has influenced the distribution, environmental adaptability, and lifestyles of species [39].
Simple sequence repeats (SSRs) can be extensive applications across various biological fields, such as genetic map development and crop improvement, and is an important tool applied in genetic relationships, population structure, and phylogenetic analysis among species [40,41]. The SSRs in the genomes of the six species primarily consisted of single nucleotide repeats. These repeats showed a bias towards A/T base compositions, which could be attributed to the higher susceptibility of A/T to change compared to G/C. This bias may be linked to the evolutionary history of the species or their environmental adaptations [42]. Among the species, only M. polyandra and M. megalocarpa possessed three and one pentanucleotide repeat sequences, respectively. These variants were valuable for identifying polymorphic regions at the individual level and serve as specific markers for genetic diversity analysis [43]. In this study, most of the long repetitive sequences were forward (F) and palindromic (P) repeats, which have also been observed in other studies of angiosperms [35,44,45]. This further suggests that forward and palindromic repeat sequences play an important role in maintaining structural and functional stability in the genome and contribute to maintaining the integrity and stability of the genome [46]. Additionally, the analysis of long repetitive sequence length showed a gradual decrease in the number of repetitive sequences as the sequence length increased, a phenomenon that was also found in the study of Stemona parviflora [47].
The differences in chloroplast genome length and structure were attributed to the expansion and contraction of inverted repeat (IR) boundaries [48]. The contraction of the ycf1 gene at the M. megalocarpa and M. polyandra SSC/IRa boundaries was observed, and this variability has also been observed in other species, such as Rheum, Quercus, and Camellia [49,50,51]. This variability is attributed to the high variability and susceptibility to mutation of the ycf1 gene, which has multiple mutation sites, and it encodes a protein that is a component of the chloroplast inner envelope membrane protein translocon [50,52]. However, further validation was required to confirm the potential of the highly polymorphic ycf1 gene as a core DNA barcode [53]. The boundaries between LSC/IRb (JLB), SSC/IRb (JSB), and LSC/IRa (JLA) were identical, indicating a closer relationship, which has been supported by subsequent phylogenetic studies. Additionally, significant differences in codon usage between species were observed [54]. The amino acids with the highest variety of codon usage in this study were Arg, Leu, and Ser, while Met and Trp had only one codon. These findings were consistent with the results observed in S. parviflora and Cyathula officinalis [47,55]. Among all the codons studied, Leu with the codon UUA exhibits the highest usage bias, while Leu with the codon CUG exhibits the lowest usage bias. Codons AUG and UGG show no usage preference (Table S4). A comparison revealed that almost all codons ending in A/U have RSCU values greater than one, while those ending in C/G have RSCU values less than one. This phenomenon might be attributed to the higher content of A and T bases, resulting in an obvious bias for A or T termination codons, a preference that may arise from evolutionary pressures and genetic alterations [56].
The inheritance pattern of the chloroplast genome was matrilineal, with a relatively low incidence of base substitutions and genome structure rearrangement events [57]. This was supported by the absence of gene rearrangements and inversions in M. megalocarpa and other closely related species. While there were differences in the mVISTA analyses of the M. megalocarpa chloroplast genome, most of these differences were found in the intergenic spacer regions, with overall conservation remaining consistent. Not only do Brassicaceae plants exhibit this phenomenon, but Orchidaceae and Betulaceae also show similar results, supporting the conservation of the chloroplast genome [58,59]. The ratio of non-synonymous-to-synonymous mutations (Ka/Ks) in genes encoding proteins was an important indicator of selection pressure in molecular evolution [60]. In this study, only the rpl20 gene showed evidence of positive selection, was associated with transcription and translation, and suggested its involvement in adaptive evolution and environmental adaptation [61,62]. The Ka/Ks values of the rpl20 gene showed positive selection in M. delavayi, P. cornutum, and P. pterocarpum, but purifying selection in M. megalocarpa, M. polyandra, and P. dolabratum, indicating that different species experienced varying evolutionary pressures on this gene. Nucleotide diversity studies have shown that the IR region of the species was less polymorphic, compared to the LSC and SSC regions. This was attributed to the lower variability of the conserved rRNA genes in the IR region [63]. The 13 regions with high Pi values (>0.025) were more susceptible to nucleotide substitutions during evolution. Notably, the psaJ gene (Pi > 0.03) in the LSC region could serve as an effective molecular marker for species identification, providing valuable data and phylogenetic information for genetic evolutionary analyses.

4.2. Phylogeny of Chloroplast Genome of Megacarpaeeae

In phylogenetic trees, the ML and NJ trees constructed exhibited similar topologies. However, the lack of a robust, densely sampled Brassicaceae Tree of Life has resulted in a variety of different phylogenetic relationships at present. A system of four major lineages, as opposed to a system of three [64,65] or five [2,9] major lineage divisions, provides a good indication of the phylogenetic position of Megacarpaeeae. Therefore, four major lineages were identified, as well as the phylogenetic position of M. megalocarpa in the expanded lineage II of Brassicaceae, which is consistent with the findings of Kiefer et al. [13]. Notably, Megacarpaea and Pugionium formed a highly supported monophyletic taxon, which is consistent with previous studies [7,37,64]. This finding further confirms the close relationship between the Megacarpaea and Pugionium species. Additionally, M. delavayi was found to be more closely related to M. megalocarp than to M. polyandra.
The ages of the major Brassicaceae splits are in agreement with previously published results; most Brassicaceae species mainly diverged in the middle Miocene to Pleistocene [7]. The divergences within M. megalocarpa with M. delavayi and M. polyandra were estimated to have occurred around 6.63 Mya (3.65 Mya–8.54 Mya), which was basically consistent with the time-differentiation results of previous analyses, based on the chloroplast genomes of M. delavayi and M. polyandra [9]. M. megalocarpa and M. delavayi diverged separately about 4.97 Mya (2.82 Mya–6.76 Mya). This might have been due to the rapid uplift of the Tibetan Plateau in the Neogene, resulting in the formation of mountains such as the Tian Mountains and Qilian Mountains, and a harsh drought in the northwest from the late Miocene to Pliocene, leading to the differentiation of M. megalocarpa [66,67]. M. megalocarpa grows in the sandy deserts and alkaline plains of northwestern China (Qinghai and Xinjiang). M. delavayi grows in the swampy meadows, on the steep grassy slopes, and in the open thickets of southwest China (Gansu, Qinghai, Sichuan, Xizang, Yunnan) at elevations of 3300–4800 m [10]. Accordingly, M. megalocarpa’s and M. delavayi’s divergence could be inferred to be possibly related to violent geological movements from the massive Tibetan Plateau uplift, as well as the aridification of the northwestern region [67,68].

5. Conclusions

In this study, the chloroplast genome of M. megalocarpa was assembled and characterized and compared with other species of the tribe Megacarpaeeae. The results confirmed the previously proposed hypothesis that the chloroplast genome (154,877 bp) of M. megalocarpa shares similarities with the Megacarpaea species in terms of characteristics. It is worth noting that the psaJ gene in the LSC region can be used as a molecular marker for species identification. Phylogenetic analysis confirmed that M. megalocarpa and M. delavayi are closely related and differentiated independently around 4.97 Ma, suggesting that this may be related to the violent geological movement associated with the large-scale uplift of the Tibetan Plateau. This provides valuable genetic resources for understanding phylogenetic relationships within the genus and refining the complex classification and species identification of Brassicaceae plants.

Supplementary Materials

The following supporting information can be downloaded at: https://www.mdpi.com/article/10.3390/genes15070886/s1. Table S1: GenBank IDs for chloroplast genome sequences of 30 species and M. megalocarpa. Table S2: Nucleotide diversity (Pi) values were calculated for 127 non-coding. Table S3: Nucleotide diversity (Pi) values were calculated for 122 coding regions. Table S4: RSCU values of the chloroplast genome for M. megalocarpa and other species of tribe Megacarpaeeae. Figure S1: Divergence time (million years ago) of Brassicaceae species inferred from the complete chloroplast genome data.

Author Contributions

Conceptualization, X.S. and D.T.; methodology, Z.Z. and X.S.; investigation, Z.Z., H.T., and H.M.; data curation, Z.Z. and H.T.; writing—original draft preparation, Z.Z. and X.S.; writing—review and editing, Z.Z., X.S., D.T., and J.Q.; visualization, Z.Z.; funding acquisition, X.S., D.T. and J.Q. All authors have read and agreed to the published version of the manuscript.

Funding

This research was funded by the National Natural Science Foundation of China, grant number 31960229, the Grant of Innovation Environment Construction of the Xinjiang Uygur Autonomous Region, China, grant number PT2315, the Third Xinjiang Scientific Expedition Program, grant number 2022xjkk1505, the Natural Science Foundation of the Xinjiang Uygur Autonomous Region, grant number 2023D01B36.

Institutional Review Board Statement

Not applicable.

Informed Consent Statement

Not applicable.

Data Availability Statement

The chloroplast genome sequences that support the findings of this study are openly available in NCBI, GenBank accession number: PP234616. The raw sequencing data for this study are publicly available in the NCBI Sequence Read Archive (SRA), the BioProject number: PRJNA1129693.

Conflicts of Interest

The authors declare no conflicts of interest.

References

  1. Al-Shehbaz, I.A. A Generic and Tribal Synopsis of the Brassicaceae (Cruciferae). Taxon 2012, 61, 931–954. [Google Scholar] [CrossRef]
  2. Nikolov, L.A.; Shushkov, P.; Nevado, B.; Gan, X.; Al-Shehbaz, I.A.; Filatov, D.; Bailey, C.D.; Tsiantis, M. Resolving the Backbone of the Brassicaceae Phylogeny for Investigating Trait Diversity. New Phytol. 2019, 222, 1638–1651. [Google Scholar] [CrossRef]
  3. Shankar, S.; Segaran, G.; Sundar, R.D.V.; Settu, S.; Sathiavelu, M. Brassicaceae—A Classical Review on Its Pharmacological Activities. Int. J. Pharm. Sci. Rev. Res. 2019, 55, 107–113. [Google Scholar]
  4. Higdon, J.; Delage, B.; Williams, D.; Dashwood, R. Cruciferous Vegetables and Human Cancer Risk: Epidemiologic Evidence and Mechanistic Basis. Pharmacol. Res. 2007, 55, 224–236. [Google Scholar] [CrossRef]
  5. Murillo, G.; Mehta, R.G. Cruciferous Vegetables and Cancer Prevention. Nutr. Cancer 2001, 41, 17–28. [Google Scholar] [CrossRef]
  6. Ilahy, R.; Tlili, I.; Pék, Z.; Montefusco, A.; Siddiqui, M.W.; Homa, F.; Hdider, C.; R’Him, T.; Lajos, H.; Lenucci, M.S. Pre-and Post-Harvest Factors Affecting Glucosinolate Content in Broccoli. Front. Nutr. 2020, 7, 147. [Google Scholar] [CrossRef]
  7. Guo, X.; Liu, J.; Hao, G.; Zhang, L.; Mao, K.; Wang, X.; Zhang, D.; Ma, T.; Hu, Q.; Al-Shehbaz, I.A.; et al. Plastome Phylogeny and Early Diversification of Brassicaceae. BMC Genom. 2017, 18, 176. [Google Scholar] [CrossRef]
  8. Huang, C.-H.; Sun, R.; Hu, Y.; Zeng, L.; Zhang, N.; Cai, L.; Zhang, Q.; Koch, M.A.; Al-Shehbaz, I.; Edger, P.P.; et al. Resolution of Brassicaceae Phylogeny Using Nuclear Genes Uncovers Nested Radiations and Supports Convergent Morphological Evolution. Mol. Biol. Evol. 2016, 33, 394–412. [Google Scholar] [CrossRef]
  9. Hendriks, K.P.; Kiefer, C.; Al-Shehbaz, I.A.; Bailey, C.D.; Van Huysduynen, A.H.; Nikolov, L.A.; Nauheimer, L.; Zuntini, A.R.; German, D.A.; Franzke, A. Global Brassicaceae Phylogeny Based on Filtering of 1,000-Gene Dataset. Curr. Biol. 2023, 33, 4052–4068. [Google Scholar] [CrossRef]
  10. Cheo, T.; Lu, L.; Yang, G.; Al-Shehbaz, I.; Dorofeev, V. Flora of China; Science Press: Beijing, China, 2001; Volume 8, pp. 39–40. [Google Scholar]
  11. Shen, L.; Liu, X.; Shi, G.; Yang, Y.; Li, B. Effect of Megacarpaea delavayi Franch on Digestive Juice in Rat with Heat Due to Food Stagnation. Chin. J. Ethnomed. Ethnopharm. 2009, 18, 1–3. [Google Scholar]
  12. Singh, A.; Nautiyal, M.C.; Curti, R.N.; Fenu, G. The Phenological Growth Stages of Megacarpaea polyandra Benth. Ex Madden: A High Valued Traditional Medicinal Plant of the Himalaya. Genet. Resour. Crop Evol. 2022, 69, 431–441. [Google Scholar] [CrossRef]
  13. Kiefer, M.; Schmickl, R.; German, D.A.; Mandáková, T.; Lysak, M.A.; Al-Shehbaz, I.A.; Franzke, A.; Mummenhoff, K.; Stamatakis, A.; Koch, M.A. BrassiBase: Introduction to a Novel Knowledge Database on Brassicaceae Evolution. Plant Cell Physiol. 2014, 55, e3. [Google Scholar] [CrossRef] [PubMed]
  14. Ahmed, I. Chloroplast Genome Sequencing: Some Reflections. Next Gen. Seq. Appl. 2015, 2, 1000119. [Google Scholar] [CrossRef]
  15. Wu, Y.; Liu, F.; Yang, D.-G.; Li, W.; Zhou, X.-J.; Pei, X.-Y.; Liu, Y.-G.; He, K.-L.; Zhang, W.-S.; Ren, Z.-Y. Comparative Chloroplast Genomics of Gossypium Species: Insights into Repeat Sequence Variations and Phylogeny. Front. Plant Sci. 2018, 9, 376. [Google Scholar] [CrossRef] [PubMed]
  16. Wang, J.; He, W.; Xiang, K.; Wu, Z.; Gu, C. Advancements in Plant Phylogenomics in the Genomic Era. J. Zhejiang AF Univ. 2023, 40, 227–236. [Google Scholar] [CrossRef]
  17. Bolger, A.M.; Lohse, M.; Usadel, B. Trimmomatic: A Flexible Trimmer for Illumina Sequence Data. Bioinformatics 2014, 30, 2114–2120. [Google Scholar] [CrossRef] [PubMed]
  18. Jin, J.-J.; Yu, W.-B.; Yang, J.-B.; Song, Y.; de Pamphilis, C.W.; Yi, T.-S.; Li, D.-Z. GetOrganelle: A Fast and Versatile Toolkit for Accurate de Novo Assembly of Organelle Genomes. Genome Biol. 2020, 21, 241. [Google Scholar] [CrossRef] [PubMed]
  19. Shi, L.; Chen, H.; Jiang, M.; Wang, L.; Wu, X.; Huang, L.; Liu, C. CPGAVAS2, an Integrated Plastome Sequence Annotator and Analyzer. Nucleic Acids Res. 2019, 47, W65–W73. [Google Scholar] [CrossRef] [PubMed]
  20. Kearse, M.; Moir, R.; Wilson, A.; Stones-Havas, S.; Cheung, M.; Sturrock, S.; Buxton, S.; Cooper, A.; Markowitz, S.; Duran, C.; et al. Geneious Basic: An Integrated and Extendable Desktop Software Platform for the Organization and Analysis of Sequence Data. Bioinformatics 2012, 28, 1647–1649. [Google Scholar] [CrossRef]
  21. Lohse, M.; Drechsel, O.; Kahlau, S.; Bock, R. OrganellarGenomeDRAW—A Suite of Tools for Generating Physical Maps of Plastid and Mitochondrial Genomes and Visualizing Expression Data Sets. Nucleic Acids Res. 2013, 41, W575–W581. [Google Scholar] [CrossRef]
  22. Thiel, T.; Michalek, W.; Varshney, R.; Graner, A. Exploiting EST Databases for the Development and Characterization of Gene-Derived SSR-Markers in Barley (Hordeum vulgare L.). Theor. Appl. Genet. 2003, 106, 411–422. [Google Scholar] [CrossRef] [PubMed]
  23. Kurtz, S. REPuter: The Manifold Applications of Repeat Analysis on a Genomic Scale. Nucleic Acids Res. 2001, 29, 4633–4642. [Google Scholar] [CrossRef] [PubMed]
  24. Amiryousefi, A.; Hyvönen, J.; Poczai, P. IRscope: An Online Program to Visualize the Junction Sites of Chloroplast Genomes. Bioinformatics 2018, 34, 3030–3031. [Google Scholar] [CrossRef] [PubMed]
  25. Peden, J. Analysis of Codon Usage. Ph.D. Thesis, University of Nottingham, Nottingham, UK, 2000. [Google Scholar]
  26. Frazer, K.A.; Pachter, L.; Poliakov, A.; Rubin, E.M.; Dubchak, I. VISTA: Computational Tools for Comparative Genomics. Nucleic Acids Res. 2004, 32, W273–W279. [Google Scholar] [CrossRef] [PubMed]
  27. Katoh, K.; Rozewicki, J.; Yamada, K.D. MAFFT Online Service: Multiple Sequence Alignment, Interactive Sequence Choice and Visualization. Brief. Bioinf. 2019, 20, 1160–1166. [Google Scholar] [CrossRef] [PubMed]
  28. Wang, D.; Zhang, Y.; Zhang, Z.; Zhu, J.; Yu, J. KaKs_Calculator 2.0: A Toolkit Incorporating γ-Series Methods and Sliding Window Strategies. Genom. Proteom. Bioinform. 2010, 8, 77–80. [Google Scholar] [CrossRef]
  29. Librado, P.; Rozas, J. DnaSP v5: A Software for Comprehensive Analysis of DNA Polymorphism Data. Bioinformatics 2009, 25, 1451–1452. [Google Scholar] [CrossRef]
  30. Zhang, D.; Gao, F.; Jakovlić, I.; Zou, H.; Zhang, J.; Li, W.X.; Wang, G.T. PhyloSuite: An Integrated and Scalable Desktop Platform for Streamlined Molecular Sequence Data Management and Evolutionary Phylogenetics Studies. Mol. Ecol. Resour. 2020, 20, 348–355. [Google Scholar] [CrossRef] [PubMed]
  31. Tamura, K.; Stecher, G.; Kumar, S. MEGA11: Molecular Evolutionary Genetics Analysis Version 11. Mol. Biol. Evol. 2021, 38, 3022–3027. [Google Scholar] [CrossRef] [PubMed]
  32. Drummond, A.J.; Suchard, M.A.; Xie, D.; Rambaut, A. Bayesian Phylogenetics with BEAUti and the BEAST 1.7. Mol. Biol. Evol. 2012, 29, 1969–1973. [Google Scholar] [CrossRef]
  33. Hohmann, N.; Wolf, E.M.; Lysak, M.A.; Koch, M.A. A Time-Calibrated Road Map of Brassicaceae Species Radiation and Evolutionary History. Plant Cell 2015, 27, 2770–2784. [Google Scholar] [CrossRef] [PubMed]
  34. Hu, Q.; Hu, H.; Guo, X.; Ma, Y.; Liu, J.; Ma, T. Characterization of the Complete Chloroplast Genome of Two Sister Species of Pugionium (Brassicaceae). Conserv. Genet. Resour. 2016, 8, 243–245. [Google Scholar] [CrossRef]
  35. Javaid, N.; Ramzan, M.; Khan, I.A.; Alahmadi, T.A.; Datta, R.; Fahad, S.; Danish, S. The Chloroplast Genome of Farsetia hamiltonii Royle, Phylogenetic Analysis, and Comparative Study with Other Members of Clade C of Brassicaceae. BMC Plant Biol. 2022, 22, 384. [Google Scholar] [CrossRef] [PubMed]
  36. Shang, S.; Zhao, L.; Xu, T.; Li, C.; Shen, R. The Complete Chloroplast Genome of Lepidium Latifolium linnaeus and Phylogenetic Analysis of Brassicaceae. Mitochondrial DNA B 2021, 6, 178–179. [Google Scholar] [CrossRef] [PubMed]
  37. Du, X.; Zeng, T.; Feng, Q.; Hu, L.; Luo, X.; Weng, Q.; He, J.; Zhu, B. The Complete Chloroplast Genome Sequence of Yellow Mustard (Sinapis alba L.) and Its Phylogenetic Relationship to Other Brassicaceae Species. Gene 2020, 731, 144340. [Google Scholar] [CrossRef] [PubMed]
  38. Li, M.; Zhang, R.; Li, J.; Zheng, K.; Xiao, J.; Zheng, Y. Analyses of Chloroplast Genome of Eutrema japonicum Provide New Insights into the Evolution of Eutrema Species. Agronomy 2021, 11, 2546. [Google Scholar] [CrossRef]
  39. Mann, S.; Chen, Y.-P.P. Bacterial Genomic G+C Composition-Eliciting Environmental Adaptation. Genomics 2010, 95, 7–15. [Google Scholar] [CrossRef]
  40. Ebert, D.; Peakall, R. Chloroplast Simple Sequence Repeats (cpSSRs): Technical Resources and Recommendations for Expanding cpSSR Discovery and Applications to a Wide Array of Plant Species. Mol. Ecol. Resour. 2009, 9, 673–690. [Google Scholar] [CrossRef] [PubMed]
  41. George, B.; Bhatt, B.S.; Awasthi, M.; George, B.; Singh, A.K. Comparative Analysis of Microsatellites in Chloroplast Genomes of Lower and Higher Plants. Curr. Genet. 2015, 61, 665–677. [Google Scholar] [CrossRef]
  42. Kuang, D.-Y.; Wu, H.; Wang, Y.-L.; Gao, L.-M.; Zhang, S.-Z.; Lu, L. Complete Chloroplast Genome Sequence of Magnolia kwangsiensis (Magnoliaceae): Implication for DNA Barcoding and Population Genetics. Genome 2011, 54, 663–673. [Google Scholar] [CrossRef]
  43. Powell, W.; Morgante, M.; McDevitt, R.; Vendramin, G.G.; Rafalski, J.A. Polymorphic Simple Sequence Repeat Regions in Chloroplast Genomes: Applications to the Population Genetics of Pines. Proc. Natl. Acad. Sci. USA 1995, 92, 7759–7763. [Google Scholar] [CrossRef] [PubMed]
  44. Sun, J.; Wang, Y.; Liu, Y.; Xu, C.; Yuan, Q.; Guo, L.; Huang, L. Evolutionary and Phylogenetic Aspects of the Chloroplast Genome of Chaenomeles Species. Sci. Rep. 2020, 10, 11466. [Google Scholar] [CrossRef] [PubMed]
  45. Zhang, Y.; Du, L.; Liu, A.; Chen, J.; Wu, L.; Hu, W.; Zhang, W.; Kim, K.; Lee, S.-C.; Yang, T.-J. The Complete Chloroplast Genome Sequences of Five Epimedium Species: Lights into Phylogenetic and Taxonomic Analyses. Front. Plant Sci. 2016, 7, 306. [Google Scholar] [CrossRef]
  46. Wei, S.; Liufu, Y.; Zheng, H.; Chen, H.; Lai, Y.; Liu, Y.; Ye, Q.; Tang, S. Using Phylogenomics to Untangle the Taxonomic Incongruence of Yellow-flowered Camellia Species (Theaceae) in China. J. Syst. Evol. 2023, 61, 748–763. [Google Scholar] [CrossRef]
  47. Wei, R.; Li, Q. The Complete Chloroplast Genome of Endangered Species Stemona parviflora: Insight into the Phylogenetic Relationship and Conservation Implications. Genes 2022, 13, 1361. [Google Scholar] [CrossRef] [PubMed]
  48. Wang, W.; Messing, J. High-Throughput Sequencing of Three Lemnoideae (Duckweeds) Chloroplast Genomes from Total DNA. PLoS ONE 2011, 6, e24670. [Google Scholar] [CrossRef] [PubMed]
  49. Yang, J.-B.; Yang, S.-X.; Li, H.-T.; Yang, J.; Li, D.-Z. Comparative Chloroplast Genomes of Camellia Species. PLoS ONE 2013, 8, e73053. [Google Scholar] [CrossRef] [PubMed]
  50. Yang, Y.; Zhou, T.; Duan, D.; Yang, J.; Feng, L.; Zhao, G. Comparative Analysis of the Complete Chloroplast Genomes of Five Quercus Species. Front. Plant Sci. 2016, 7, 959. [Google Scholar] [CrossRef]
  51. Zhou, T.; Zhu, H.; Wang, J.; Xu, Y.; Xu, F.; Wang, X. Complete Chloroplast Genome Sequence Determination of Rheum Species and Comparative Chloroplast Genomics for the Members of Rumiceae. Plant Cell Rep. 2020, 39, 811–824. [Google Scholar] [CrossRef]
  52. Kikuchi, S.; Bédard, J.; Hirano, M.; Hirabayashi, Y.; Oishi, M.; Imai, M.; Takase, M.; Ide, T.; Nakai, M. Uncovering the Protein Translocon at the Chloroplast Inner Envelope Membrane. Science 2013, 339, 571–574. [Google Scholar] [CrossRef]
  53. Li, L.; Hu, Y.; He, M.; Zhang, B.; Wu, W.; Cai, P.; Huo, D.; Hong, Y. Comparative Chloroplast Genomes: Insights into the Evolution of the Chloroplast Genome of Camellia sinensis and the Phylogeny of Camellia. BMC Genom. 2021, 22, 138. [Google Scholar] [CrossRef] [PubMed]
  54. Gouy, M.; Gautier, C. Codon Usage in Bacteria: Correlation with Gene Expressivity. Nucleic Acids Res. 1982, 10, 7055–7074. [Google Scholar] [CrossRef] [PubMed]
  55. Guo, H.; Wang, L.; Xu, W.; Huo, Z.; Yang, P.; Zhang, Q.; Wang, H.; Li, P.; Lu, X. The Complete Chloroplast Genome Sequence of Cyathula officinalis and Comparative Analysis with Four Related Species. Gene 2022, 839, 146728. [Google Scholar] [CrossRef] [PubMed]
  56. Gao, Y.; Chen, Z.; Li, X.; Malik, K.; Li, C. Comparative Analyses of Complete Chloroplast Genomes of Microula sikkimensis and Related Species of Boraginaceae. Genes 2024, 15, 226. [Google Scholar] [CrossRef] [PubMed]
  57. Qian, F.; Gao, Z.; Hu, L.; Wang, H. Characteristics of the Chloroplast Genome and Phylogenetic Studies of Crambe abyssinica. Biotechnol. Bull. 2022, 38, 174. [Google Scholar] [CrossRef]
  58. Dong, W.-L.; Wang, R.-N.; Zhang, N.-Y.; Fan, W.-B.; Fang, M.-F.; Li, Z.-H. Molecular Evolution of Chloroplast Genomes of Orchid Species: Insights into Phylogenetic Relationship and Adaptive Evolution. Int. J. Mol. Sci. 2018, 19, 716. [Google Scholar] [CrossRef] [PubMed]
  59. Hu, G.; Cheng, L.; Huang, W.; Cao, Q.; Zhou, L.; Jia, W.; Lan, Y. Chloroplast Genomes of Seven Species of Coryloideae (Betulaceae): Structures and Comparative Analysis. Genome 2020, 63, 337–348. [Google Scholar] [CrossRef] [PubMed]
  60. Dos Reis, M. How to Calculate the Non-Synonymous to Synonymous Rate Ratio of Protein-Coding Genes under the Fisher-Wright Mutation-Selection Framework. Biol. Lett. 2015, 11, 20141031. [Google Scholar] [CrossRef] [PubMed]
  61. Yang, Z.; Nielsen, R. Estimating Synonymous and Nonsynonymous Substitution Rates under Realistic Evolutionary Models. Mol. Biol. Evol. 2000, 17, 32–43. [Google Scholar] [CrossRef]
  62. Yu, T.; Gao, J.; Liao, P.-C.; Li, J.-Q.; Ma, W.-B. Insights into Comparative Analyses and Phylogenomic Implications of Acer (Sapindaceae) Inferred from Complete Chloroplast Genomes. Front. Genet. 2022, 12, 791628. [Google Scholar] [CrossRef]
  63. Jansen, R.K.; Raubeson, L.A.; Boore, J.L.; de Pamphilis, C.W.; Chumley, T.W.; Haberle, R.C.; Wyman, S.K.; Alverson, A.J.; Peery, R.; Herman, S.J.; et al. Methods for Obtaining and Analyzing Whole Chloroplast Genome Sequences. In Methods in Enzymology; Elsevier: Amsterdam, The Netherlands, 2005; Volume 395, pp. 348–384. ISBN 978-0-12-182800-4. [Google Scholar] [CrossRef]
  64. Liu, L.; Du, X.; Guo, C.; Li, D. Resolving Robust Phylogenetic Relationships of Core Brassicaceae Using Genome Skimming Data. J. Syst. Evol. 2021, 59, 442–453. [Google Scholar] [CrossRef]
  65. Couvreur, T.L.P.; Franzke, A.; Al-Shehbaz, I.A.; Bakker, F.T.; Koch, M.A.; Mummenhoff, K. Molecular Phylogenetics, Temporal Diversification, and Principles of Evolution in the Mustard Family (Brassicaceae). Mol. Biol. Evol. 2010, 27, 55–71. [Google Scholar] [CrossRef] [PubMed]
  66. Sun, J.; Liu, T. The Age of the Taklimakan Desert. Science 2006, 312, 1621. [Google Scholar] [CrossRef] [PubMed]
  67. Dai, S.; Zhang, M.; Peng, D.; Wang, H.; Wu, M.; Chen, R. Tectonic and Climatic Pattern Evolution of the Middle-Cenozoic in Northwest China. Mar. Geol. Quat. Geol. 2013, 33, 153–168. [Google Scholar] [CrossRef]
  68. Li, X.; Dong, G. Discussion on the Formation Era and Causes of Arid Environment in Northwest China. Quat. Sci. 2006, 26, 895–904. [Google Scholar]
Figure 1. Plant characteristics of M. megalocarpa.
Genes 15 00886 g001
Figure 2. Chloroplast genome map of M. megalocarpa. Genes within and outside the circle consist of forward-coding genes and reverse-coding genes. The varying shades of gray in the innermost circle represent the GC and AT contents.
Genes 15 00886 g002
Figure 3. SSRs (simple sequence repeats) and long repetitive sequences in M. megalocarpa and other five species. (A): types and number of SSRs; (B): the quantity of four types of long repetitive sequences; (C): length of long repetitive sequences.
Genes 15 00886 g003
Figure 4. Comparison of the LSC, SSC, and IR region boundaries in the chloroplast genomes of M. megalocarpa and other five species. Different boxes represent different gene names. Different colors represent the four regions and gene names.
Genes 15 00886 g004
Figure 5. The relative synonymous codon usage of 20 amino acids and the stop codon in the CDS of the chloroplast genome for M. megalocarpa and other species of the tribe Megacarpaeeae. The sequence from left to right consists of M. megalocarpa, M. polyandra, M. delavayi, P. dolabratum, P. cornutum, and P. pterocarpum. Different colors represent different codons encoding amino acids.
Genes 15 00886 g005
Figure 6. Sequence identity plot comparing the chloroplast genomes of M. megalocarpa with those of five other species. Exons, UTR, CNS, and mRNA are marked with different colors. The y-axis represents the percentage of sequence identity from 50% to 100%. Gray arrows above the alignment indicate gene transcription direction. Arrows indicate the annotated genes in the reference genome of M. delavayi and their transcription directions.
Genes 15 00886 g006
Figure 7. The Ka/Ks values of 41 genes. Ka/Ks values for 41 genes between M. megalocarpa and five other species, two-by-two.
Genes 15 00886 g007
Figure 8. Nucleotide diversity (Pi) of M. megalocarpa compared to the other five species. (A): protein-coding regions; (B): non-coding regions.
Genes 15 00886 g008aGenes 15 00886 g008b
Figure 9. Phylogenetic tree constructed based on 37 species. Numbers at nodes are Maximum Likelihood and Neighbor Joining bootstrap values (BS), separated by “/”. Blue letters represent the outgroups; red letters represent study species; pink letters represent different lineages.
Genes 15 00886 g009
Figure 10. BEAST-derived chronograms of Brassicaceae based on the chloroplast genome sequences with three calibration points (red pentagram) derived from previous studies. Abbreviations of geological time are as follows: Q: Quaternary, P: Pleistocene, Pli: Pliocene.
Genes 15 00886 g010
Table 1. Chloroplast genome information of M. megalocarpa and other species of the tribe Megacarpaeeae.
Length (bp)GC Content (%)Number of Gene
GenomeLSCIRSSCTotalLSCIRSSCTotalProtein CodingtRNArRNA
M. megalocarpa154,87784,00826,44617,97736.2033.9642.3129.0812985368
M. delavayi154,40183,70426,33618,02536.2033.8942.3428.9813085378
M. polyandra154,94983,99126,43318,09236.1033.8542.2828.9113287378
P. cornutum154,99284,10426,43718,01436.2033.9242.3629.0513085378
P. dolabratum155,02284,09726,43718,03136.2033.9342.3629.0313085378
P. pterocarpum154,53483,76226,44217,88836.3033.9242.3629.1613287378
Table 2. Functional classification of the chloroplast genome of M. megalocarpa. Note: gene*: gene with one intron; gene**: gene with two introns; gene (2): number of copies of multi-copy genes.
CategoryGene GroupGene Name
PhotosynthesisSubunits of photosystem IpsaA, psaB, psaC, psaI, psaJ
Subunits of photosystem IIpsbA, psbB, psbC, psbD, psbE, psbF, psbG, psbH, psbI, psbJ,
psbK, psbL, psbM, psbN, psbT, psbZ
Subunits of NADH dehydrogenasendhA*, ndhB*(2), ndhC, ndhD, ndhE, ndhF, ndhG, ndhH, ndhI, ndhJ
Subunits of cytochrome b/f complexpetA, petB*, petD*, petG, petL, petN
Subunits of ATP synthaseatpA, atpB, atpE, atpF*, atpH, atpI
Large subunit of rubiscorbcL
Self-replicationProteins of large ribosomal subunitrbcL
Proteins of small ribosomal subunitrps11, rps12**(2), rps14, rps15, rps16*, rps18, rps19, rps2,
rps3, rps4, rps7(2), rps8
Subunits of RNA polymeraserpoA, rpoB, rpoC1*, rpoC2
Ribosomal RNAsrrn16(2), rrn23(2), rrn4.5(2), rrn5(2)
Transfer RNAstrnA-UGC*(2), trnC-GCA, trnD-GUC, trnE-UUC, trnE-UUC*(2),
trnF-GAA, trnG-GCC, trnH-GUG, trnI-CAU(2), trnK-UUU*,
trnL-CAA(2), trnL-UAA*, trnL-UAG, trnM-CAU, trnN-GUU(2),
trnP-UGG, trnQ-UUG, trnR-ACG(2), trnR-UCU, trnS-GCU,
trnS-GGA, trnS-UGA, trnT-CGU*, trnT-GGU, trnT-UGU,
trnV-GAC(2), trnV-UAC*, trnW-CCA, trnY-GUA
Other genesMaturasematK
ProteaseclpP**
Envelope membrane proteincemA
Acetyl-CoA carboxylaseaccD
c-type cytochrome synthesis geneccsA
Genes of unknown functionConserved hypothetical chloroplast ORFycf1(2), ycf2(2), ycf3*, ycf4
Disclaimer/Publisher’s Note: The statements, opinions and data contained in all publications are solely those of the individual author(s) and contributor(s) and not of MDPI and/or the editor(s). MDPI and/or the editor(s) disclaim responsibility for any injury to people or property resulting from any ideas, methods, instructions or products referred to in the content.

