Article

Integration of Transcriptomics and WGCNA to Characterize Trichoderma harzianum-Induced Systemic Resistance in Astragalus mongholicus for Defense against Fusarium solani

1
College of Life Sciences, Shanxi Agricultural University, Taigu, Jinzhong 030801, China
2
Modern Research Center for Traditional Chinese Medicine, Shanxi University, Taiyuan 030006, China
*
Author to whom correspondence should be addressed.
Genes 2024, 15(9), 1180; https://doi.org/10.3390/genes15091180 (registering DOI)
Submission received: 18 August 2024 / Revised: 5 September 2024 / Accepted: 6 September 2024 / Published: 8 September 2024
(This article belongs to the Section Plant Genetics and Genomics)

Abstract

:
Beneficial fungi of the genus Trichoderma are among the most widespread biocontrol agents that induce a plant’s defense response against pathogens. Fusarium solani is one of the main pathogens that can negatively affect Astragalus mongholicus production and quality. To investigate the impact of Trichoderma harzianum on Astragalus mongholicus defense responses to Fusarium solani, A. mongholicus roots under T. harzianum + F. solani (T + F) treatment and F. solani (F) treatment were sampled and subjected to transcriptomic analysis. A differential expression analysis revealed that 6361 differentially expressed genes (DEGs) responded to T. harzianum induction. The Kyoto Encyclopedia of Genes and Genomes (KEGG) pathway enrichment analysis of the 6361 DEGs revealed that the genes significantly clustered into resistance-related pathways, such as the plant–pathogen interaction pathway, phenylpropanoid biosynthesis pathway, flavonoid biosynthesis pathway, isoflavonoid biosynthesis pathway, mitogen-activated protein kinase (MAPK) signaling pathway, and plant hormone signal transduction pathway. Pathway analysis revealed that the PR1, formononetin biosynthesis, biochanin A biosynthesis, and CHIB, ROS production, and HSP90 may be upregulated by T. harzianum and play important roles in disease resistance. Our study further revealed that the H2O2 content was significantly increased by T. harzianum induction. Formononetin and biochanin A had the potential to suppress F. solani. Weighted gene coexpression network analysis (WGCNA) revealed one module, including 58 DEGs associated with T. harzianum induction. One core hub gene, RPS25, was found to be upregulated by T. harzianum, SA (salicylic acid) and ETH (ethephon). Overall, our data indicate that T. harzianum can induce induced systemic resistance (ISR) and systemic acquired resistance (SAR) in A. mongholicus. The results of this study lay a foundation for a further understanding of the molecular mechanism by which T. harzianum induces resistance in A. mongholicus.

1. Introduction

Astragalus membranaceus (Fisch.) Bge. var. mongholicus (Bge.) Hsiao (Leguminosae) is a medicinal plant that is distributed across China, Japan, Korea, and Southeast Asia [1]. Astragalus root is a well-known traditional Chinese medicine that is listed in the Chinese Pharmacopoeia [2]. And it has rich medicinal properties, such as antioxidant, tonic, hepatoprotectant, antidiabetic, and anticancer properties [3]. However, owing to the expanded cultivation area and continuous cropping, A. membranaceus is prone to infection by various phytopathogens in the rhizospheric soil, which severely affects its yield and quality [4]. Astragalus root rot caused by Fusarium spp. is the most common disease of A. membranaceus [5]. Severe Astragalus root rot can reach an incidence of more than 80% and even lead to a complete lack of harvest [6]. The use of the resistant cultivar HQN03-03 [5], crop rotation [5,7], and a combination of fungicide and insecticide [8] have been reported to control Astragalus root rot to some extent. However, these protection measures are time-consuming, involve excessive labor costs, can harm human health and the environment [9], and lead to the development of fungicide-resistant strains of pathogens [10]. For these reasons, biocontrol agents (BCAs) offering a sustainable ecological solution for disease management [11] are needed. Trichoderma is considered to be the largest genus of BCAs, comprising 25 species, and is the most commonly used genus for controlling phytopathogenic fungi [12]. Importantly, Trichoderma spp. have diverse biocontrol traits, including parasitism, antibiosis, and the production of secondary metabolites (SM), and can cause the induction of the plant’s defense system [13]. Trichoderma reesei has been shown to inhibit the growth of F. solani and effectively prevent the occurrence of Astragalus root rot [14]. The induction of plant defense mechanisms against pathogens via the application of biological control agents (BCAs) is a novel approach to achieving plant protection [15,16]. However, this mechanism has not been reported in Trichoderma spp.-induced resistance to A. membranaceus.
The two main mechanisms, including induced systemic resistance (ISR) and systemic acquired resistance (SAR), are identified in activating the defense mechanisms in plants [17]. Resistance associated with the colonization of plant roots by certain plant-growth-promoting rhizobacteria (PGPR) is called ISR [18]. ISR is effective against a broad spectrum of plant pathogens and relies mainly on the jasmonic acid (JA) and ethylene (ET) signaling pathways [17,19]. SAR is typically initiated by local infection, offers long-term systemic resistance against subsequent pathogen attacks, is associated with the activation of PR genes, and demands the participation of the signal molecule salicylic acid (SA) [20]. Trichoderma spp. has been reported to induce a mixed ISR or SAR against Rhizoctonia solani [21]. The expression of genes related to ISR-dependent ethylene and jasmonate (ET/JA) and SAR-dependent salicylic acid (SA)-mediated signaling pathways in tomatoes was upregulated by the T. harzianum strain M10 [22]. Moreover, genes involved in the oxidative stress response, the phenylpropanoid pathway [23], terpenoid metabolites [24], etc., were also shown to be associated with Trichoderma spp.
In the resistance study of Astragalus root rot, only one article mentioned that JA content and ISR-related enzyme activities can be induced by a simplified bacteria synthetic community [25]. It is insufficient to mine resistance genes of A. membranaceus at the genome level. In recent years, transcriptome analysis and weighted gene coexpression network analysis (WGCNA) have been employed to understand the transcriptomic changes in host tissue during the early phases of Trichoderma–host interaction [26,27]. And WGCNA can be used to ascertain the correlation between module eigengenes and hub genes in relation to sample traits [28]. Nevertheless, to our knowledge, transcriptome and WGCNA analysis of T. harzianum inducing resistance of A. mongholicus to F. solani have not been reported. To explore the mechanism by which T. harzianum induces A. mongholicus resistance to F. solani in this study, differential gene expression between the T. harzianum + F. solani treatment and F. solani treatment groups was analyzed at the transcriptional level. Subsequently, key KEGG pathways were analyzed on the basis of the differentially expressed genes (DEGs). Finally, weighted gene coexpression network analysis (WGCNA) was performed to identify the hub genes, and the expression of the hub genes was analyzed via hormone induction. These findings could enrich the gene resources of A. mongholicus resistant to F. solani and lay a foundation for future research on Trichoderma spp. inducing A. membranaceus resistance.

2. Materials and Methods

2.1. Plant Material and T. harzianum and F. solani Inoculation

Seeds of susceptible material A. mongholicus were obtained from Hunyuan County, Shanxi Province, China. T. harzianum T9-1-3-1 and F. solani HYFS-1, which were isolated from A. mongholicus plants with root rot, were grown on potato dextrose agar (PDA) plates and incubated in darkness for 7 days at 27 °C.
Seeds were planted in 14 cm-diameter plastic pots containing nutrient soil and vermiculite (volume ratio of 1:1). Nutrient soil and vermiculite were purchased from GREEN HOPE (Linyi, ShanDong, China) and were sterilized for one hour at 121 °C using an oven (JH881-3, Junhuan Machinery, Suzhou, Jiangsu, China). A total of 10–15 seedlings were planted in each pot, and the pots were subsequently placed in a climate-controlled cabinet at 25 °C with a 16 h light/8 h dark photoperiod. Half of the A. mongholicus plants grown for one month were inoculated with fresh spore suspensions of T. harzianum (T) (conc. 108 spores mL−1) by application on the roots via watering (about 10 mL for each plant), and the plants inoculated with water alone were used as controls. Then, all the plants were put back in the climate-controlled cabinet. All the A. mongholicus plants were subsequently inoculated with F. solani (F) via the hypocotyl inoculation technique [29] after T treatment for 48 h and subsequently placed in a high-humidity mist chamber for 24 h. A. mongholicus roots were collected at 0, 24, and 48 h after F infection, and three replicates were examined.

2.2. RNA Sequencing and Functional Annotation

A total of 18 RNA samples, representing T + F and F treatments in triple biological repeats, were extracted with a TRIzol reagent kit (Invitrogen, Carlsbad, CA, USA) following the manufacturer’s instructions. The purity and concentration of the RNA were determined via a Nanodrop2000 (Thermo Fisher Scientific, Waltham, MA, USA). The integrity of the RNA was detected via agarose gel electrophoresis, and RNA integrity (RIN) values were determined with an Agilent 5300 Bioanalyzer (Agilent Technologies, Santa Clara, CA, USA). The RNA-seq transcriptome libraries of 18 samples were prepared at Shanghai Majorbio Biopharm Biotechnology Co., Ltd. (Shanghai, China) following ligation by Illumina (San Diego, CA, USA) and sequenced via the Illumina NovaSeq 6000 platform.
A large number of raw reads were produced via Illumina NovaSeq 6000 sequencing. Subsequently, the raw paired-end reads were trimmed and subjected to quality control by employing FASTP (v0.19.5) (https://github.com/OpenGene/fastp (accessed on 5 December 2023)) with default parameters. Trinity software (v2.8.5) (https://github.com/trinityrnaseq/trinityrnaseq/wiki (accessed on 5 December 2023)) [30] was used for de novo assembly of the clean reads of the 18 samples. The assembly results were evaluated by employing TransRate (v1.0.3) (http://hibberdlab.com/transrate/ (accessed on 7 December 2023)) [31]. The integrity of the assembly was assessed by means of BUSCO (v3.0.2) (http://busco.ezlab.org (accessed on 7 December 2023)). The annotation of the unigenes obtained through Trinity assembly was performed using the following six databases: the Non-Redundant Protein Sequence Database (NR) (ftp://ftp.ncbi.nlm.nih.gov/blast/db/ (accessed on 15 January 2024) [32], Gene Ontology (GO) (http://www.geneontology.org (accessed on 15 January 2024) [33] and Kyoto Encyclopedia of Genes and Genome (KEGG) (http://www.genome.jp/kegg/ (accessed on 15 January 2024)) [34], Evolutionary Genealogy of Genes: Non-supervised Orthologous Groups (EggNOG) (http://www.ncbi.nlm.nih.gov/COG/ (accessed on 15 January 2024) [35], Swiss-Prot (http://web.expasy.org/docs/swiss-prot_guideline.html (accessed on 15 January 2024)) [36], and Pfam (http://pfam.xfam.org/ (accessed on 15 January 2024) [37].

2.3. Differentially Expressed Gene Analysis

The gene abundance of each transcript was quantified with RSEM software [38]. The quantitative index was the number of fragments per kilobase per million reads (FPKM). Three pairwise comparisons were conducted based on RNA-seq data, including T + F_0 h vs. F_0 h, T + F_24 h vs. F_24 h, and T + F_48 h vs. F_48 h. The DEGs among different comparisons were identified via DESeq2 software [39]. Genes with a fold change (FC) ≥ 2 and an FDR-adjusted p value < 0.05 were considered significant DEGs. Venn diagrams were constructed by using the online tool of the Majorbio cloud platform (https://cloud.majorbio.com/page/tools/ (accessed on 1 February 2024) [40]. KEGG pathway enrichment analysis of the DEGs was implemented via KOBAS [41]. A p value < 0.05 was considered to indicate a significantly enriched functional pathway.

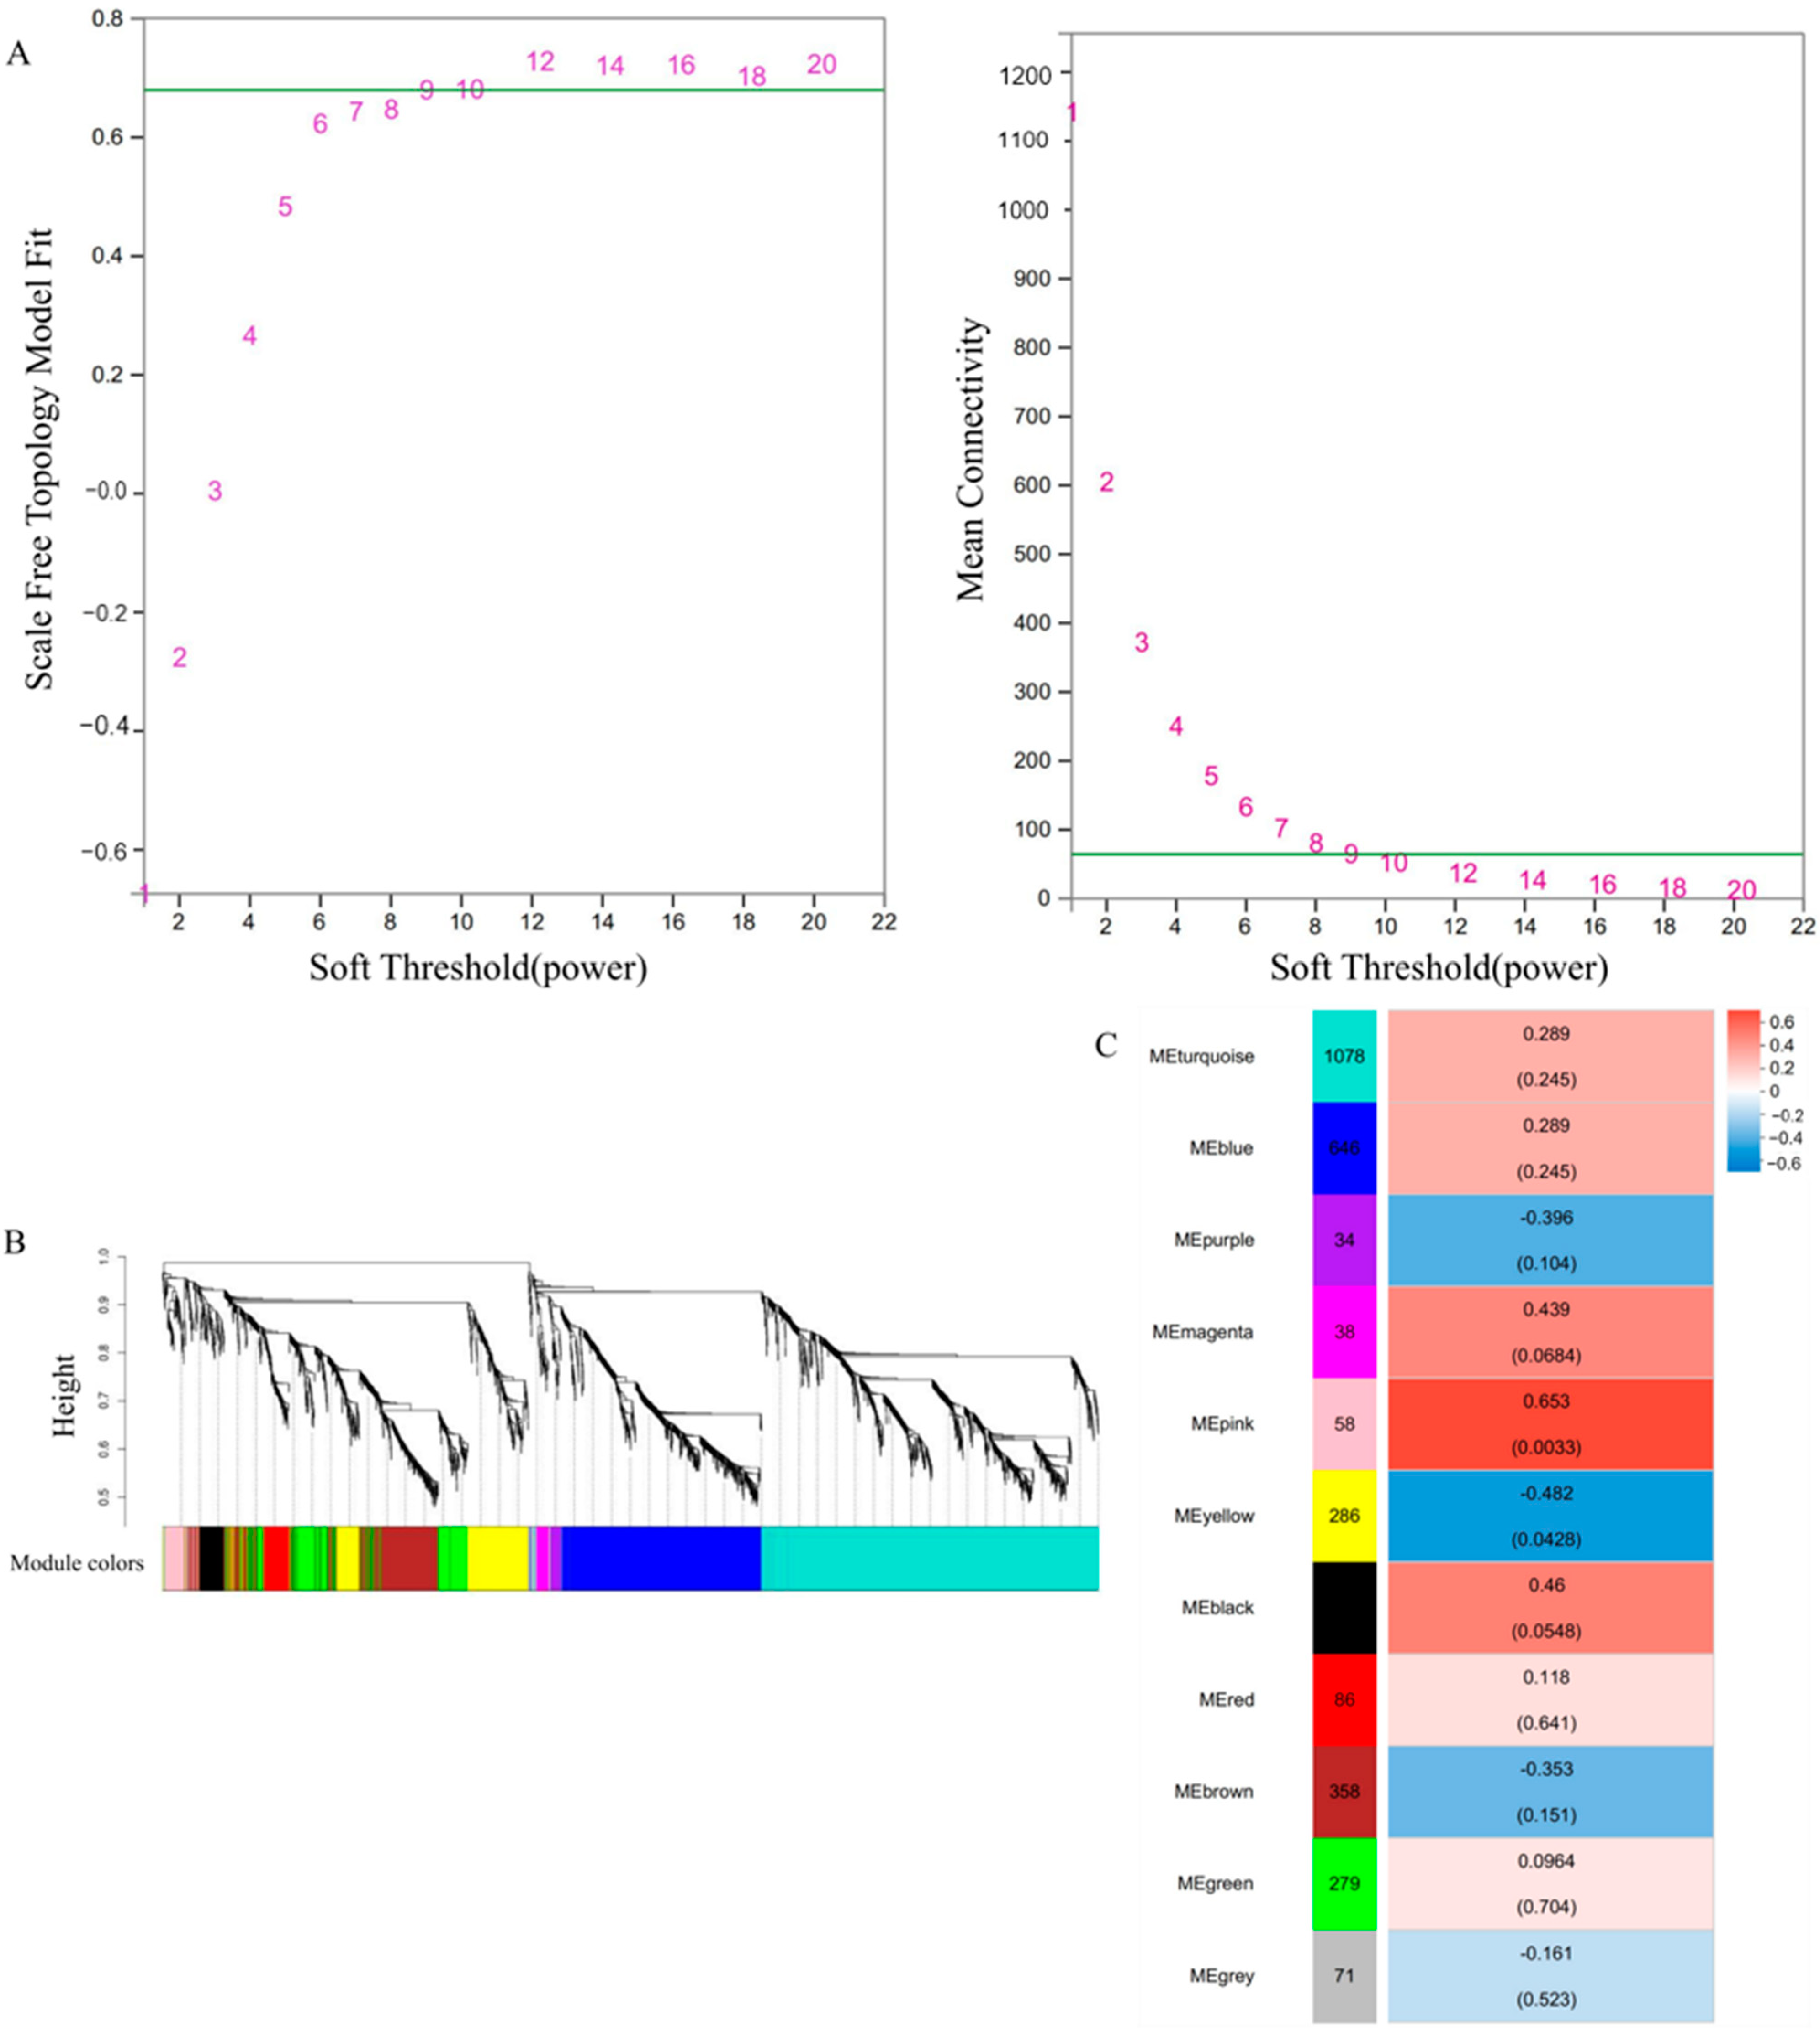
2.4. Weighted Gene Co-Expression Network Analysis

WGCNA was performed via the WGCNA R software package [42]. To improve the accuracy of the WGCNA, genes with a low expression (FPKM < 1) were removed. The β value was determined by the adjacency matrix using WGCNA. The adjacency matrix was weighted based on the power of correlation data between different genes, and the β value was determined by applying the average connectivity criterion and scale-free topology [43]. The module was identified according to the β value, and the threshold for merging similar modules was 0.25 (mergeCutHeight = 0.25). The module correlating with T. harzianum was calculated via the Spearman method; p < 0.01 was used as the criterion for screening related modules. The coexpression network was visualized via Cytoscape [44].

2.5. RT-qPCR Analysis

The template cDNA of the RNA-Seq samples was synthesized via MonScriptTM RTIII Super Mix with dsDNase (Monad Biotech., Suzhou, Jiangsu, China) following a standard protocol. The gene primers used for RT–qPCR were designed with Primer Premier 5.0. The housekeeping gene Am18S [45] was employed as a reference control in the RT–qPCR analysis of the RNA-Seq samples. The volume and program settings for RT–qPCR were adjusted according to the specifications of MomAmpTM Chemohs qPCR (Monad Biotech., Suzhou, Jiangsu, China). The RT–qPCR was subsequently conducted via a Bio-Rad CFX96 system. Three technical replicates were conducted for each sample. The relative expression levels of eight randomly selected genes from the top five pathways, including plant-pathogen interaction, flavonoid biosynthesis, isoflavonoid biosynthesis, MAPK signaling pathway, and phenylpropanoid biosynthesis pathways, were calculated via the relative 2−ΔΔCT method for validating RNA-Seq results. The relative expression levels of six connected hub genes were also calculated via the relative 2−ΔΔCT method. Information on the primers used is shown in Table S1.

2.6. H2O2 Content Assays

The roots of the T + F and F groups of A. mongholicus were collected at 0, 24, and 48 h. And the roots were washed in deionized distilled water (ddH2O) and stored in a deep freezer (−80 °C) for H2O2 content assays. Three replicates were performed. The H2O2 content was determined via a kit from Sangon Biotech Co., Ltd. (D799773-0050; Shanghai, China) following the manufacturer’s instructions. The H2O2 content was measured by determining the absorbance at a wavelength of 415 nm via an ultraviolet–visible spectrophotometer (UV-1100, Molecular Devices, Tianjin, China) [28].

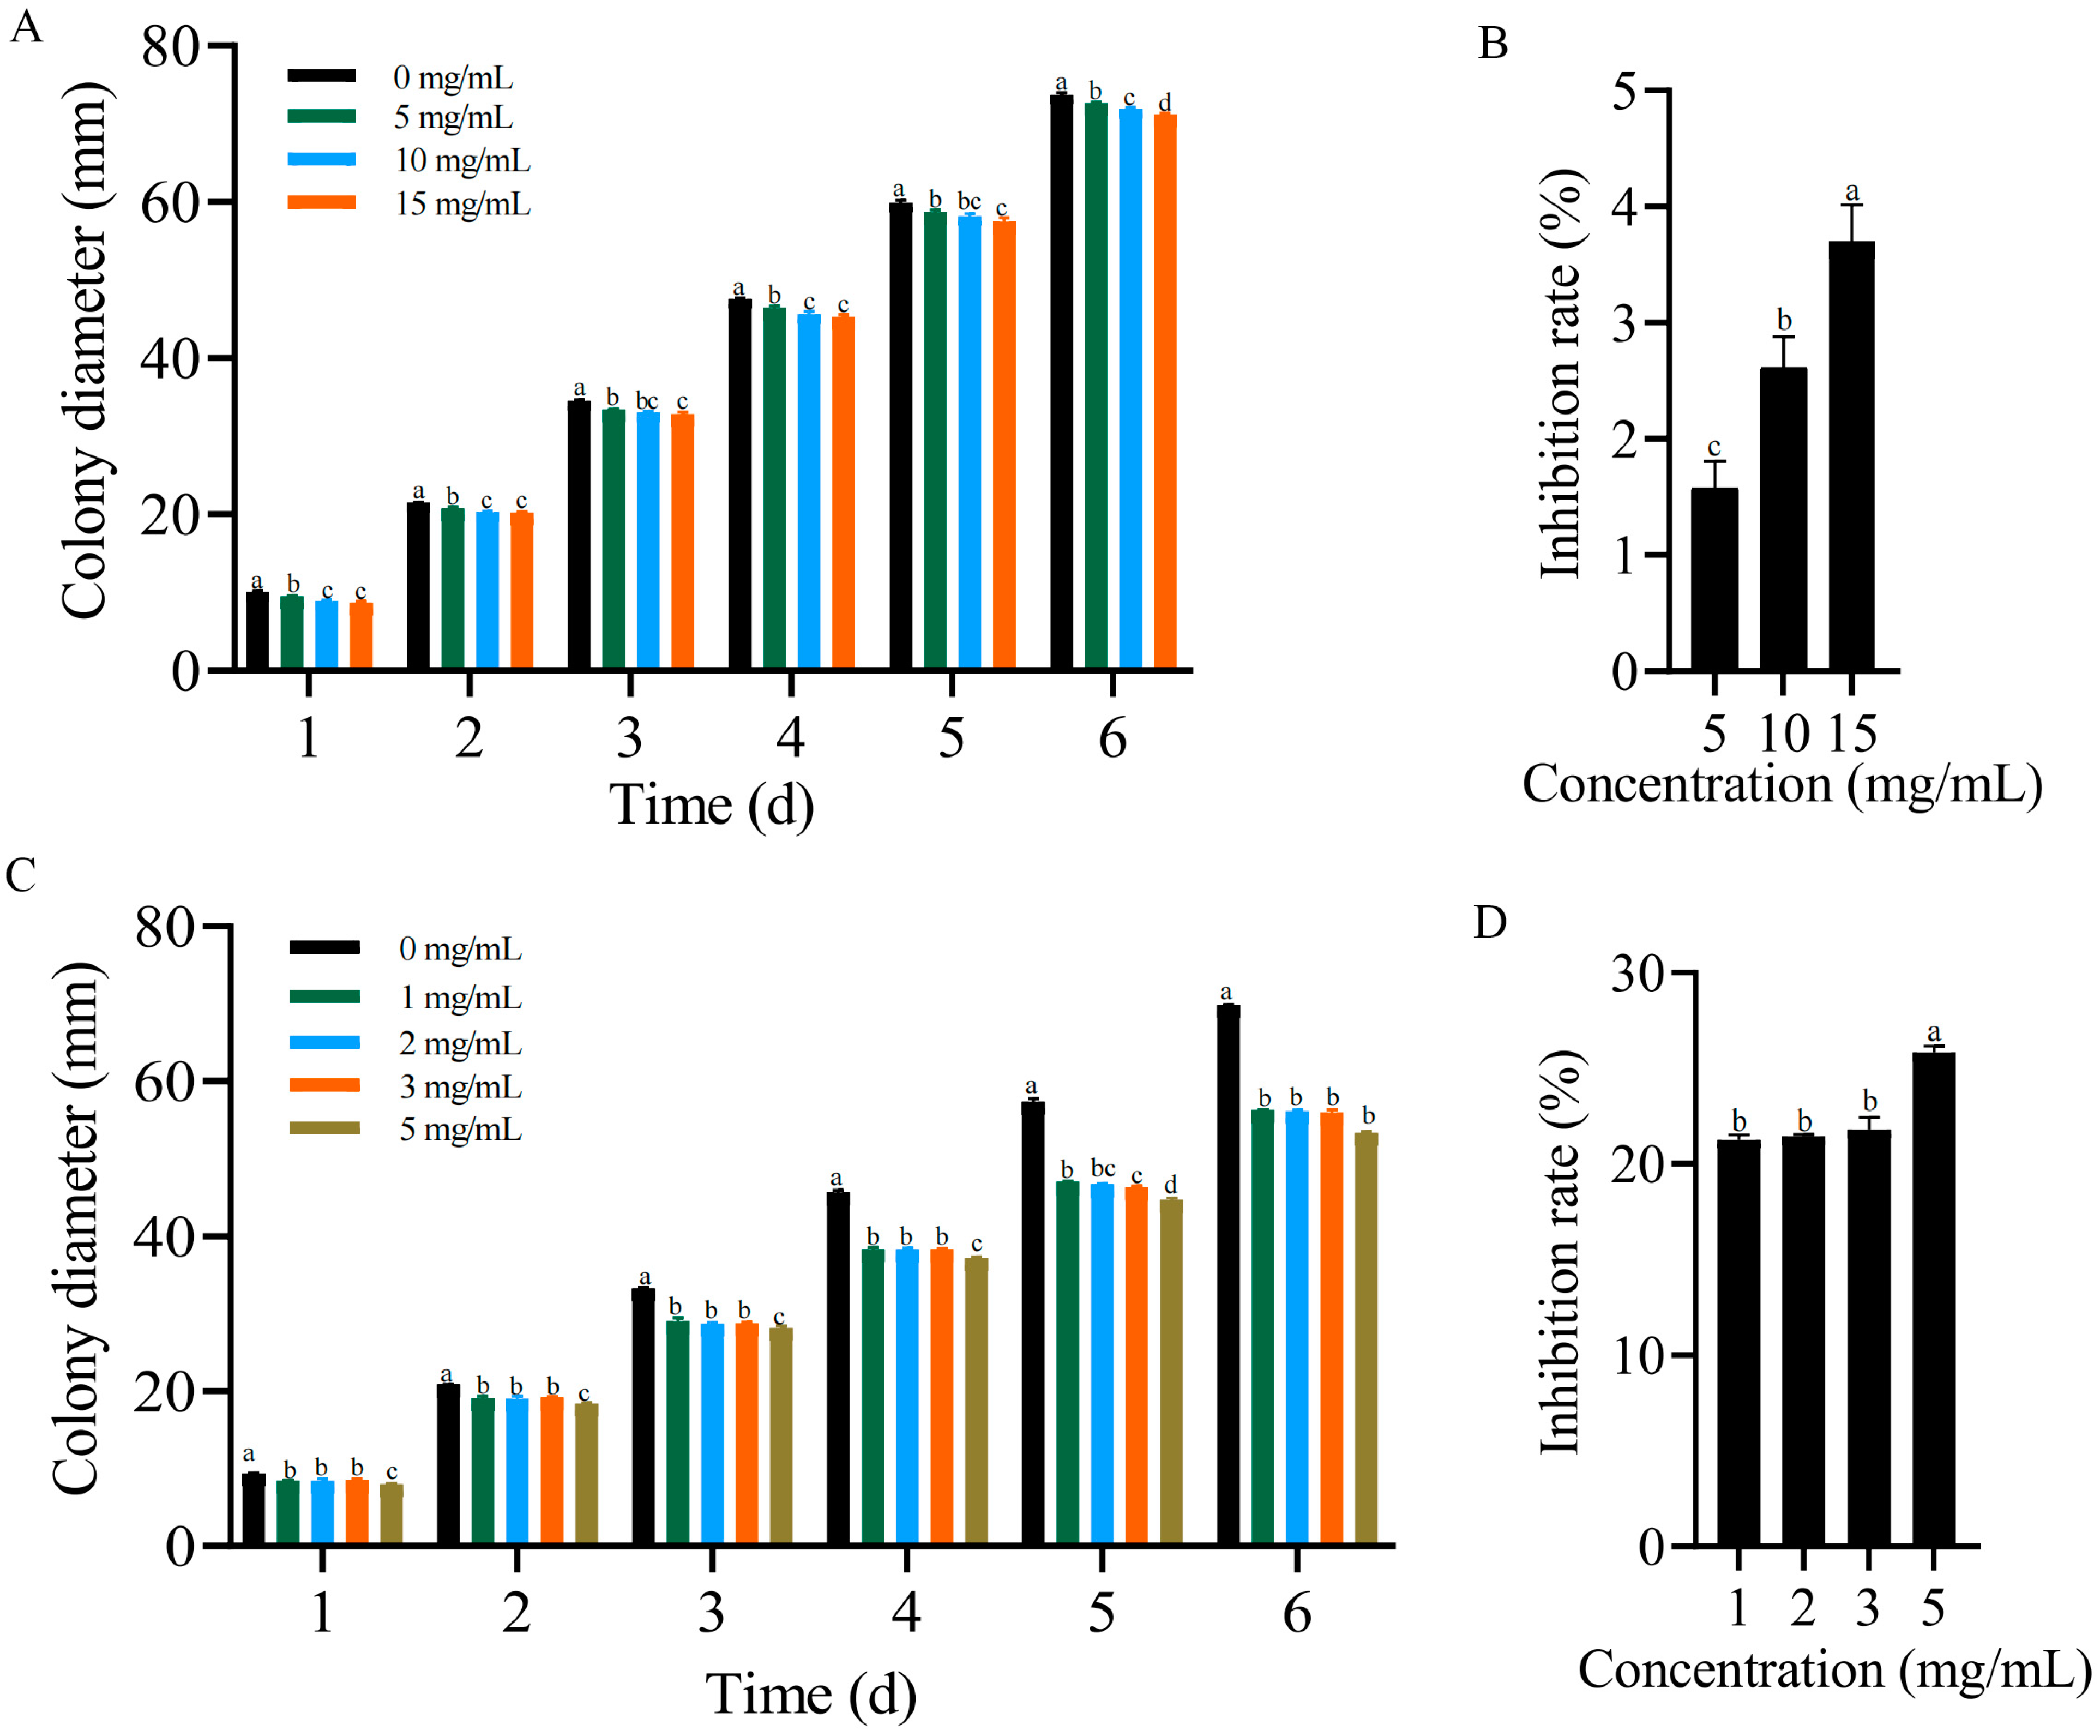
2.7. Antagonistic Effects of Formononetin and Biochanin A on F. solani In Vitro

Formononetin (purity > 99%, CAS No.: 485-72-3) and biochanin A (purity > 99%, CAS No.: 491-80-5) were purchased from Med ChemExpress (MCE, Shanghai, China). The growth of F. solani was inhibited on a PDA medium supplemented with different concentrations of formononetin (0, 5, 10, or 15 mg/mL) or biochanin A (0, 1, 2, 3, or 5 mg/mL), with 0 mg/mL as a control. An F. solani colony with a diameter of 6 mm was placed on the middle of the plate and incubated at 27 °C for 6 days, and three replicate experiments were performed per concentration. The percent inhibition of F. solani was calculated by using the formula ((control colony diameter − treated colony diameter)/(control colony diameter − 6) × 100) [4].

2.8. Analysis of RPS25 Expression under Hormone Treatments

SA (purity ≥ 99.5%, CAS No.: 69-72-7), ETH (purity ≥ 95%, CAS No.: 16672-87-0), and MeJA (purity ≥ 95%, CAS No.: 39924-52-2) were purchased from Solarbio Science & Technology Co., Ltd. (Beijing, China). A. mongholicus plants grown for one month were sprayed with SA (400 µmol/L), ETH (400 µmol/L) and MeJA (200 µmol/L) at a rate of 5 mL per plant, respectively. Roots were sampled at 0, 24, and 48 h after spraying, and three replicates were performed. Total RNA was extracted using the EZ-10 DNAaway RNA Mini-Preps Kit (Sangon Biotech, Shanghai, China) with reference to the manufacturer’s protocol. The cDNA of RNA samples was synthesized via MonScriptTM RTIII Super Mix with dsDNase (Monad Biotech., Suzhou, Jiangsu, China) by following a standard protocol. The cDNA was used for the RT–qPCR analysis of gene RPS25.

2.9. Statistical Analysis

IBM SPSS Statistics 23 was used for the statistical analysis. A one-way analysis of variance (ANOVA) was carried out to assess the effects of the treatments, and Duncan’s multiple range tests were employed to determine the significant difference at p values ≤ 0.05. In all cases, the residuals were subjected to a normality test using the Holm–Sidak test. Figure processing was performed via GraphPad Prism 8.

3. Results

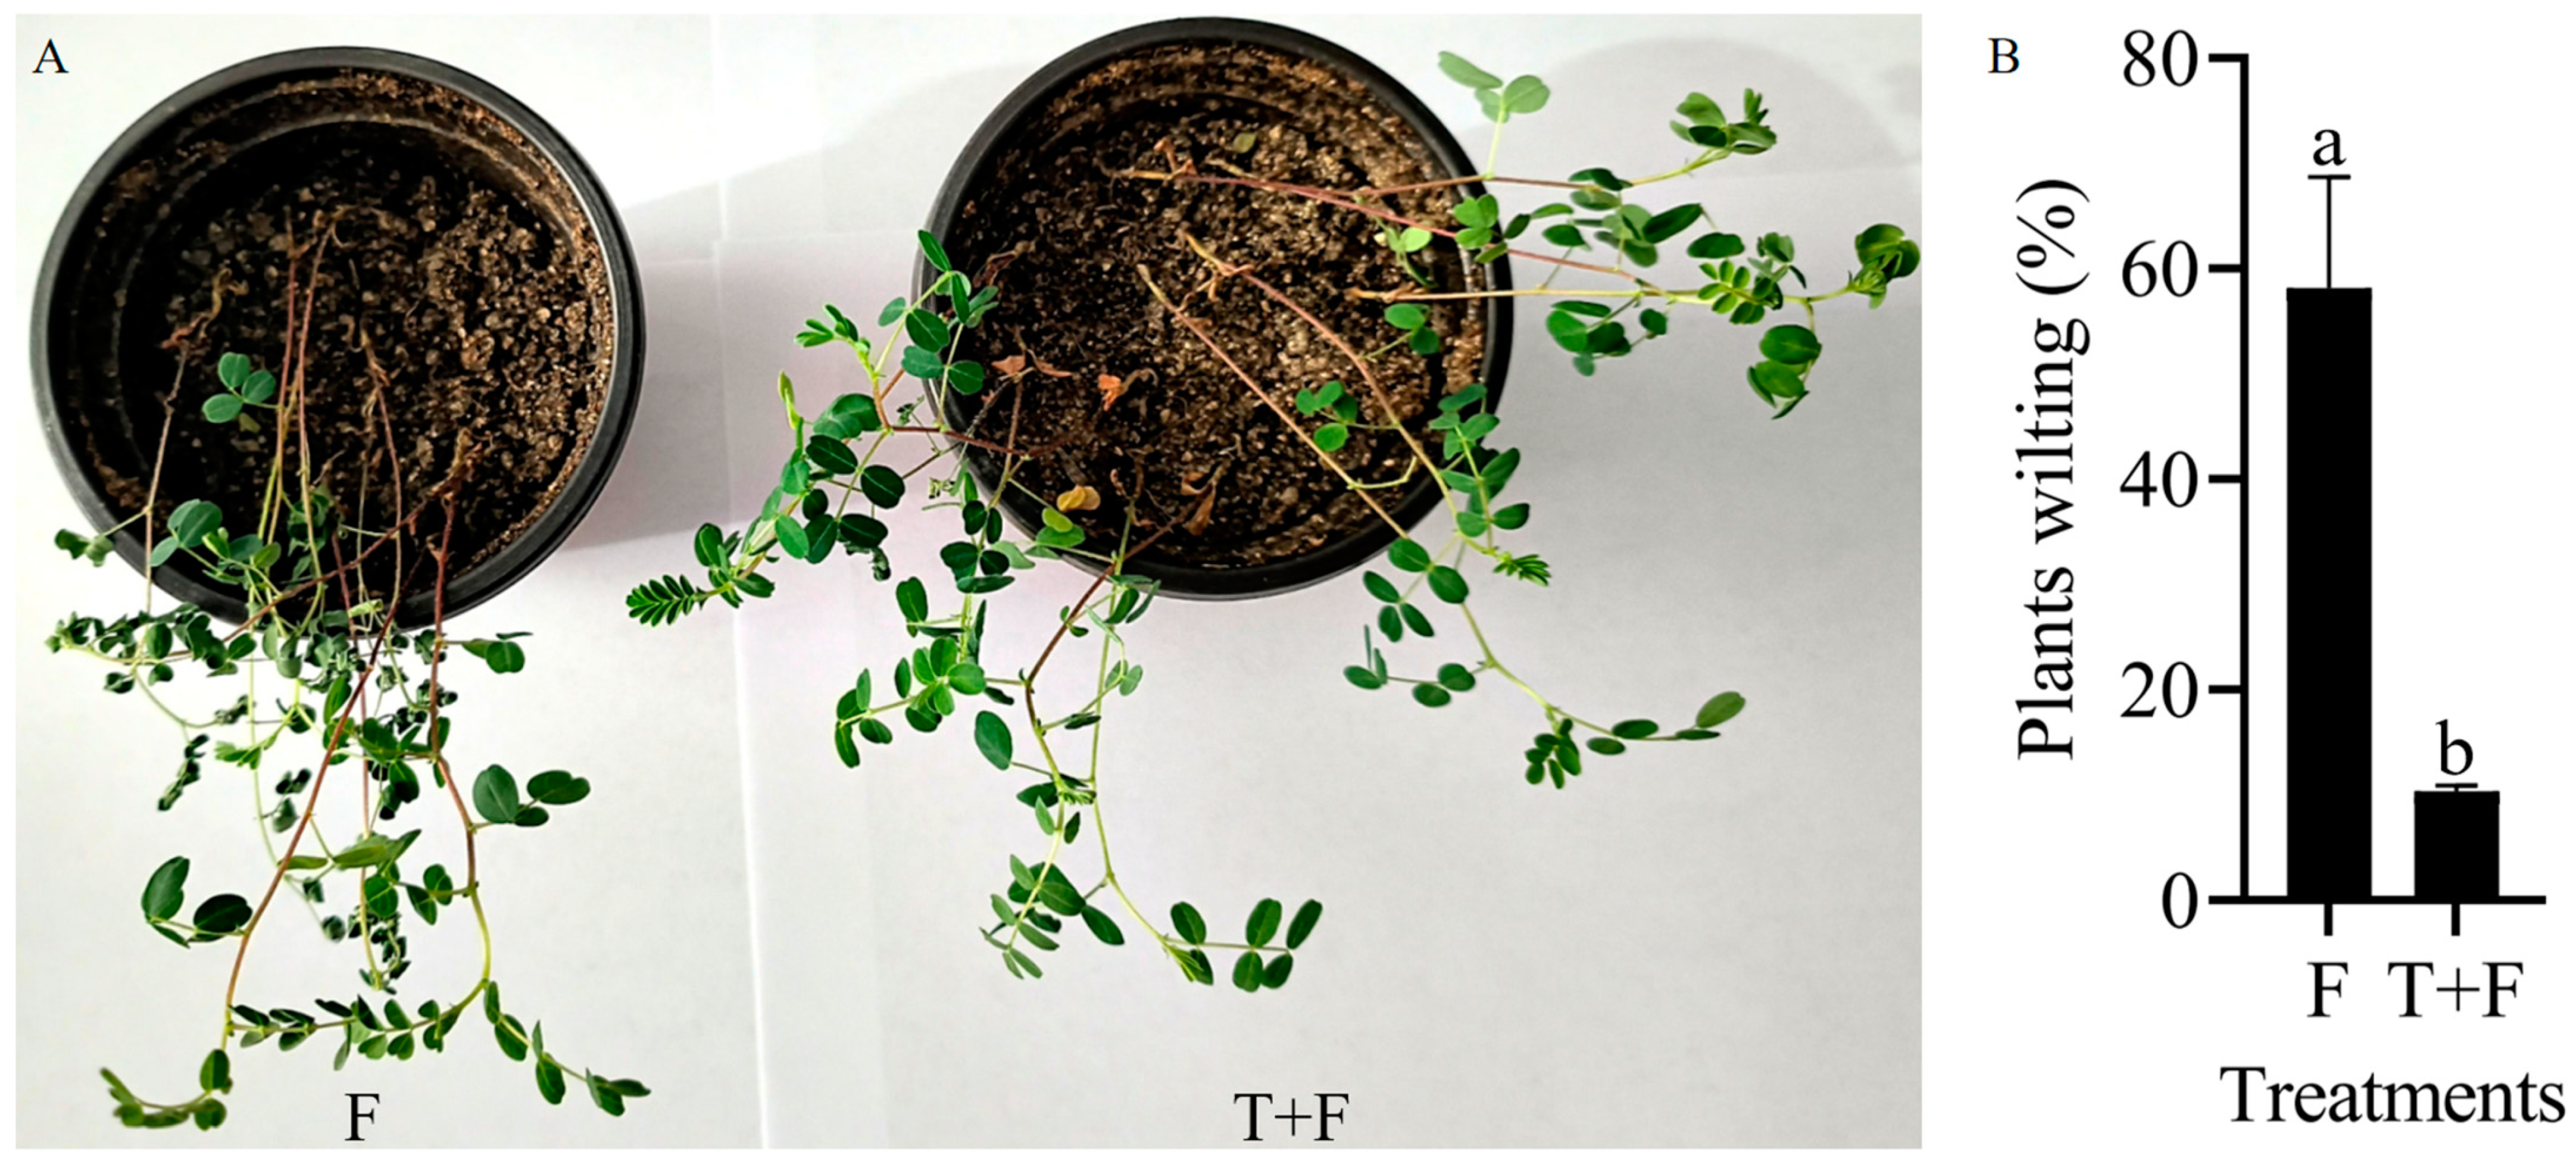
3.1. Reduction in the Plant Wilt Rate

When A. mongholicus plants were infected with F. solani, the leaves began to wilt at 48 h [29]. Treating A. mongholicus with T. harzianum could significantly reduce the onset of symptoms. Approximately 58.18% of the plants exhibited leaf wilting at 48 h after inoculation with F. solani, and an average of 10.37% of the plants treated with T9-1-3-1 exhibited leaf wilting at 48 h after inoculation with F. solani (Figure 1). We speculated that T9-1-3-1 could promote the resistance of A. mongholicus to F. solani.

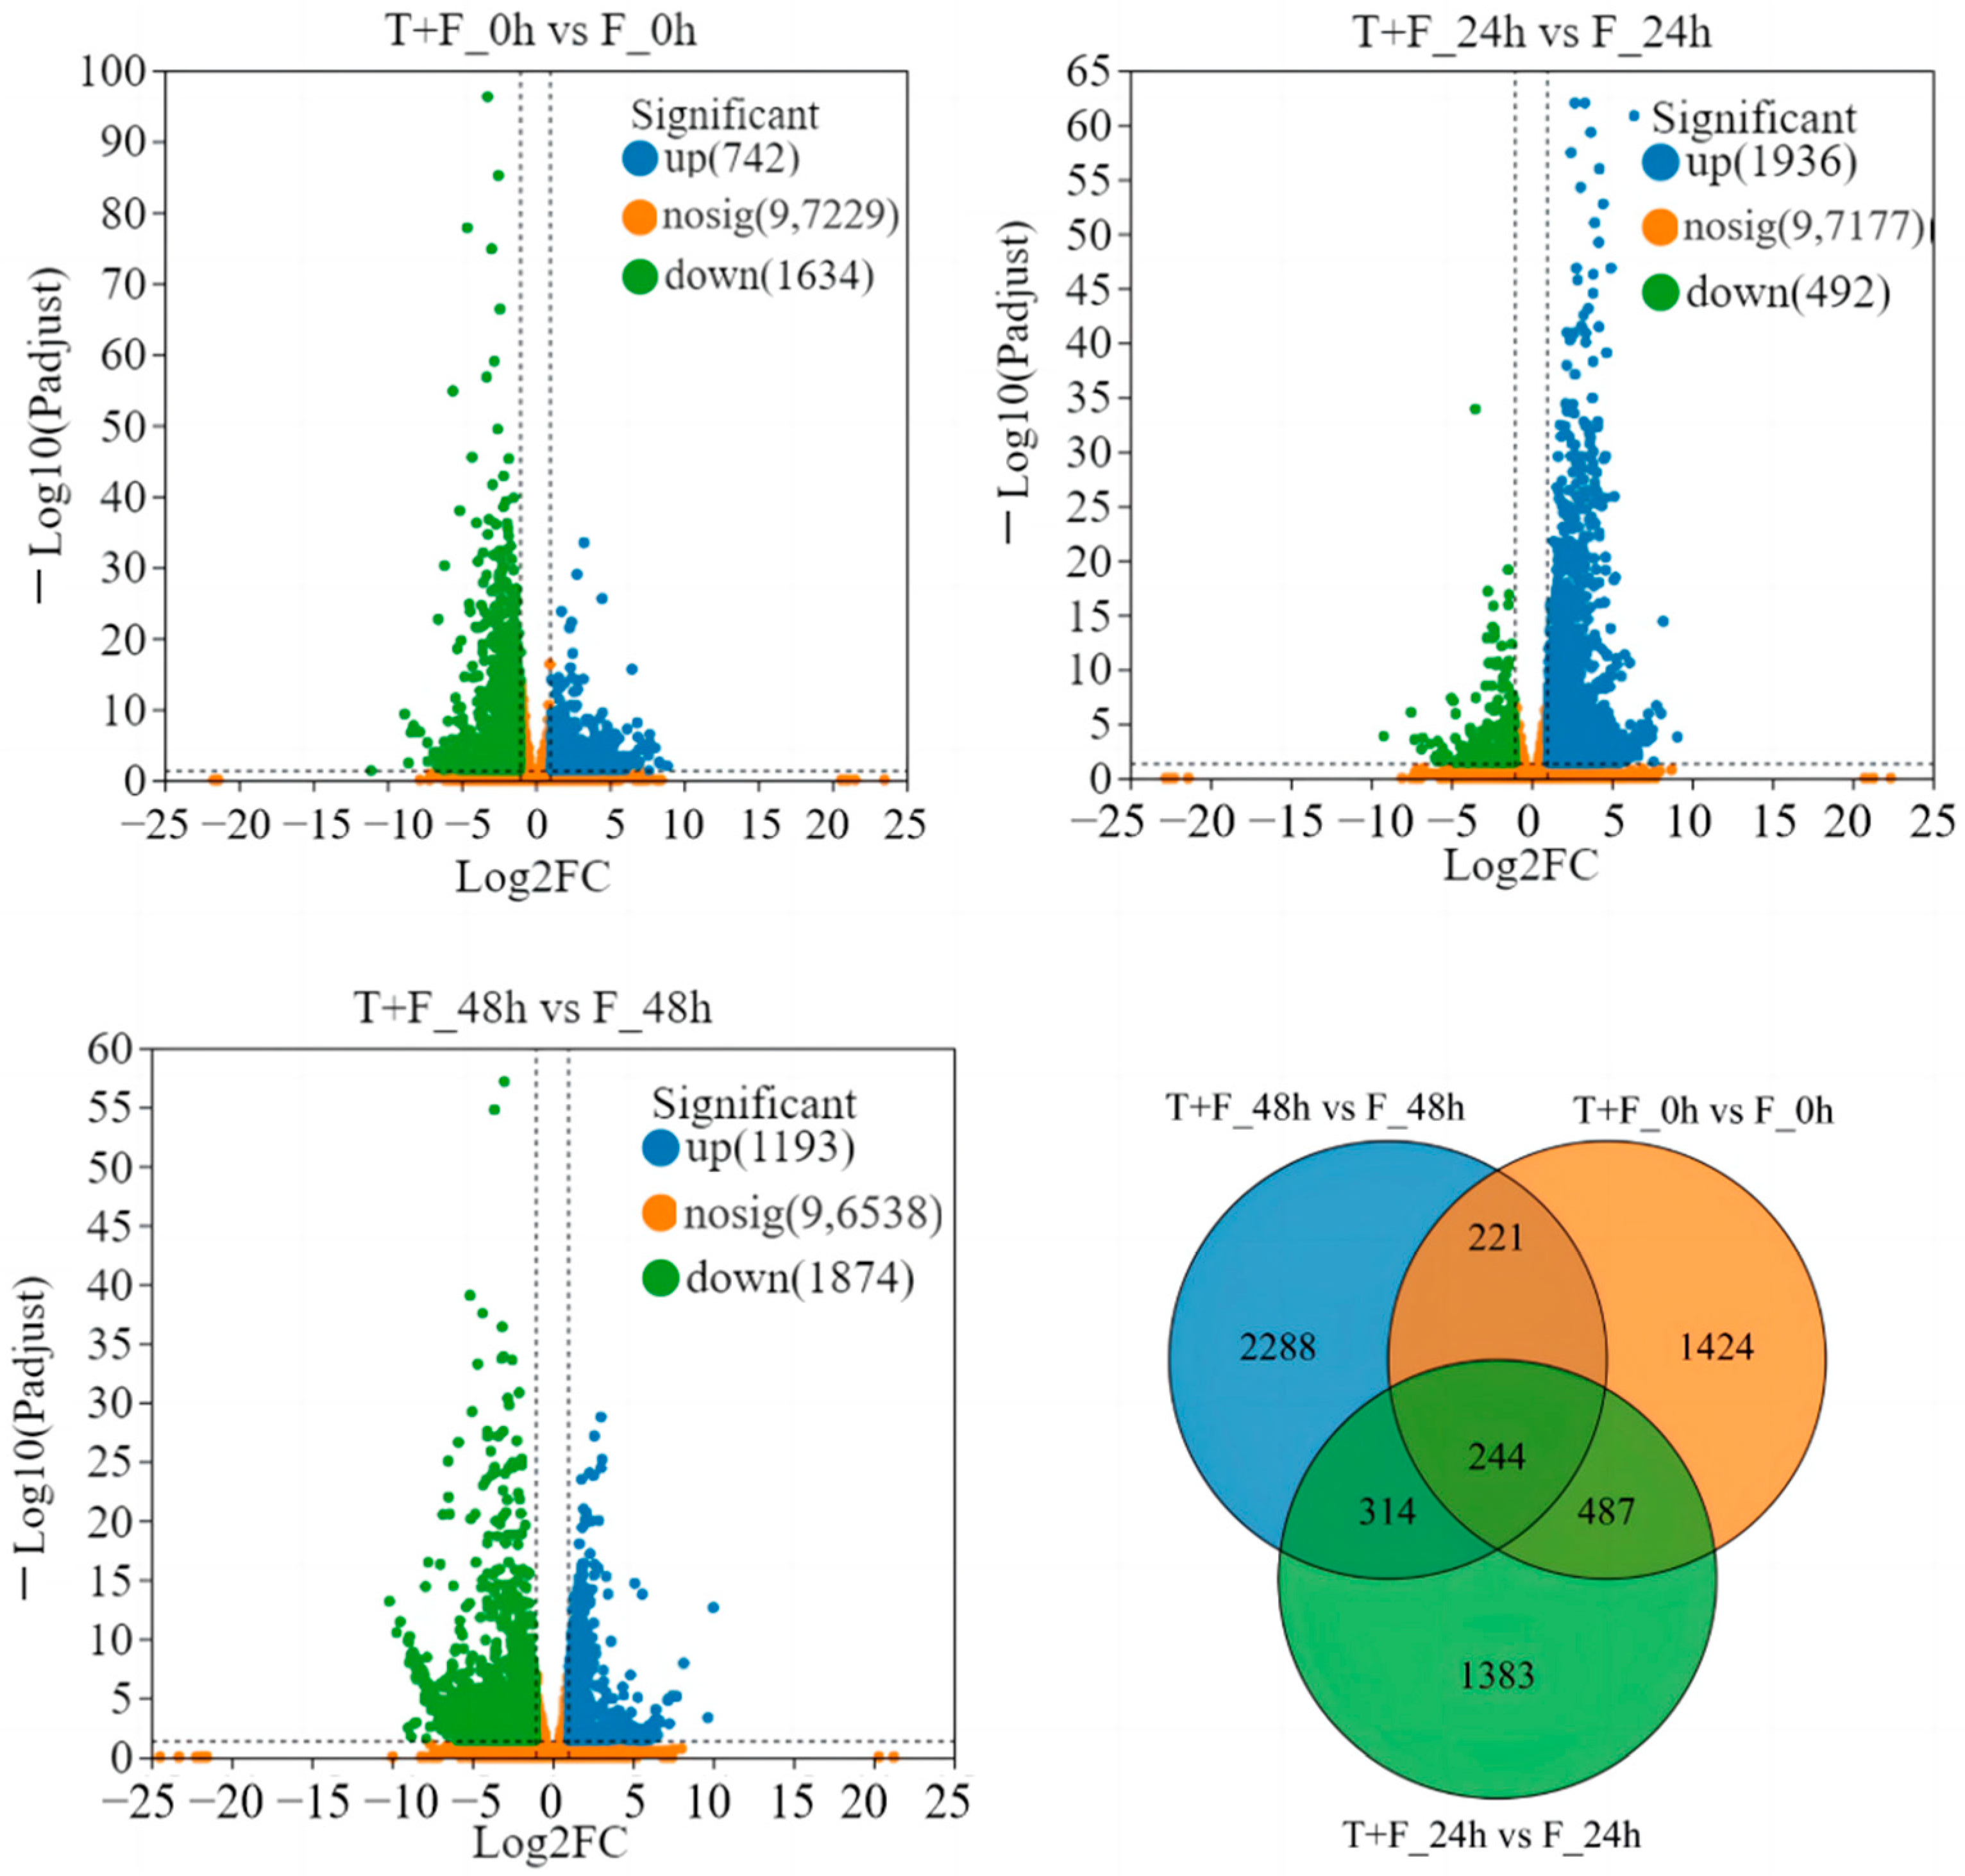
3.2. Transcriptomic Analysis and Identification of Differentially Expressed Genes

To assess the impact of T. harzianum on the A. mongholicus defense response against F. solani, transcriptome sequencing was performed with A. mongholicus from the T + F and F treatment groups at three time points (0, 24, and 48 h). Approximately 48,101,033 clean reads were generated on average (Table S2). The Q20 and Q30 percentages of each sample were greater than 98.23% and 94.65%, respectively (Table S2). The average GC content of all the samples was 42.51% (Table S2). An average of 19,849,736 clean reads were mapped to the transcriptome assemblies. A total of 99,541 unique genes were described, and their expression levels were quantified according to the expected FPKM values.
To identify DEGs that responded to T9-1-3-1 treatment, transcriptome comparisons (T + F_0 h vs. F_0 h, T + F_24 h vs. F_24 h, T + F_48 h vs. F_48 h) were conducted. A total of 2376 DEGs (742 DEGs upregulation and 1634 DEGs downregulation), 2428 DEGs (1936 DEGs upregulation and 492 DEGs downregulation), 3067 DEGs (1193 DEGs upregulation and 1874 DEGs downregulation) with a fold change ≥ 2 and p adjusted < 0.05 were identified in T + F_0 h vs. F_0 h, T + F_24 h vs. F_24 h, and T + F_48 h vs. F_48 h, respectively (Figure 2). The Venn diagram showed that a total of 6361 DEGs were found in three transcriptome comparisons (Figure 2, Table S3).

3.3. Functional Annotation and KEGG Pathway Enrichment Analysis of DEGs

To evaluate the potential functional categories of the DEGs, 6361 DEGs were subjected to GO and KEGG annotation analyses. GO annotation analysis revealed that 4224 of the 6361 DEGs could be classified into 47 functional categories, including 20 biological processes, 12 cellular components, and 15 molecular function terms (Table S4). The top six annotation terms were “binding”, “catalytic activity”, “cellular process”, “metabolic process”, “cell part”, and “membrane part” (Figure S1A). KEGG annotation analysis of 1156 of the 6361 DEGs revealed that the main enriched pathways were “carbohydrate metabolism” and “translation” (Figure S1B).
To further explore the gene-regulation pathways, a KEGG pathway enrichment analysis using a p value < 0.05 was performed on the 6361 DEGs. The results revealed that the top five enriched pathways were “plant–pathogen interaction” (map04626) [46], “flavonoid biosynthesis” (map00941) [47], “isoflavonoid biosynthesis” (map00943) [48], “phenylpropanoid biosynthesis” (map00940) [49], and “MAPK (mitogen-activated protein kinase) signalling pathway” (map04016) [50] (Figure 3) and were associated with disease resistance. In addition, the plant hormone signal transduction pathway (map04075) [51] related to resistance was also enriched (Figure 3).

3.4. Validation of RNA-Seq Data by RT–qPCR

To validate the RNA-Seq results, eight genes from the above top five pathways were randomly selected for RT–qPCR, and the overall expression trends were consistent with the RNA-Seq data for all the genes. The results revealed that the RNA-Seq results were reliable (Figure S2).

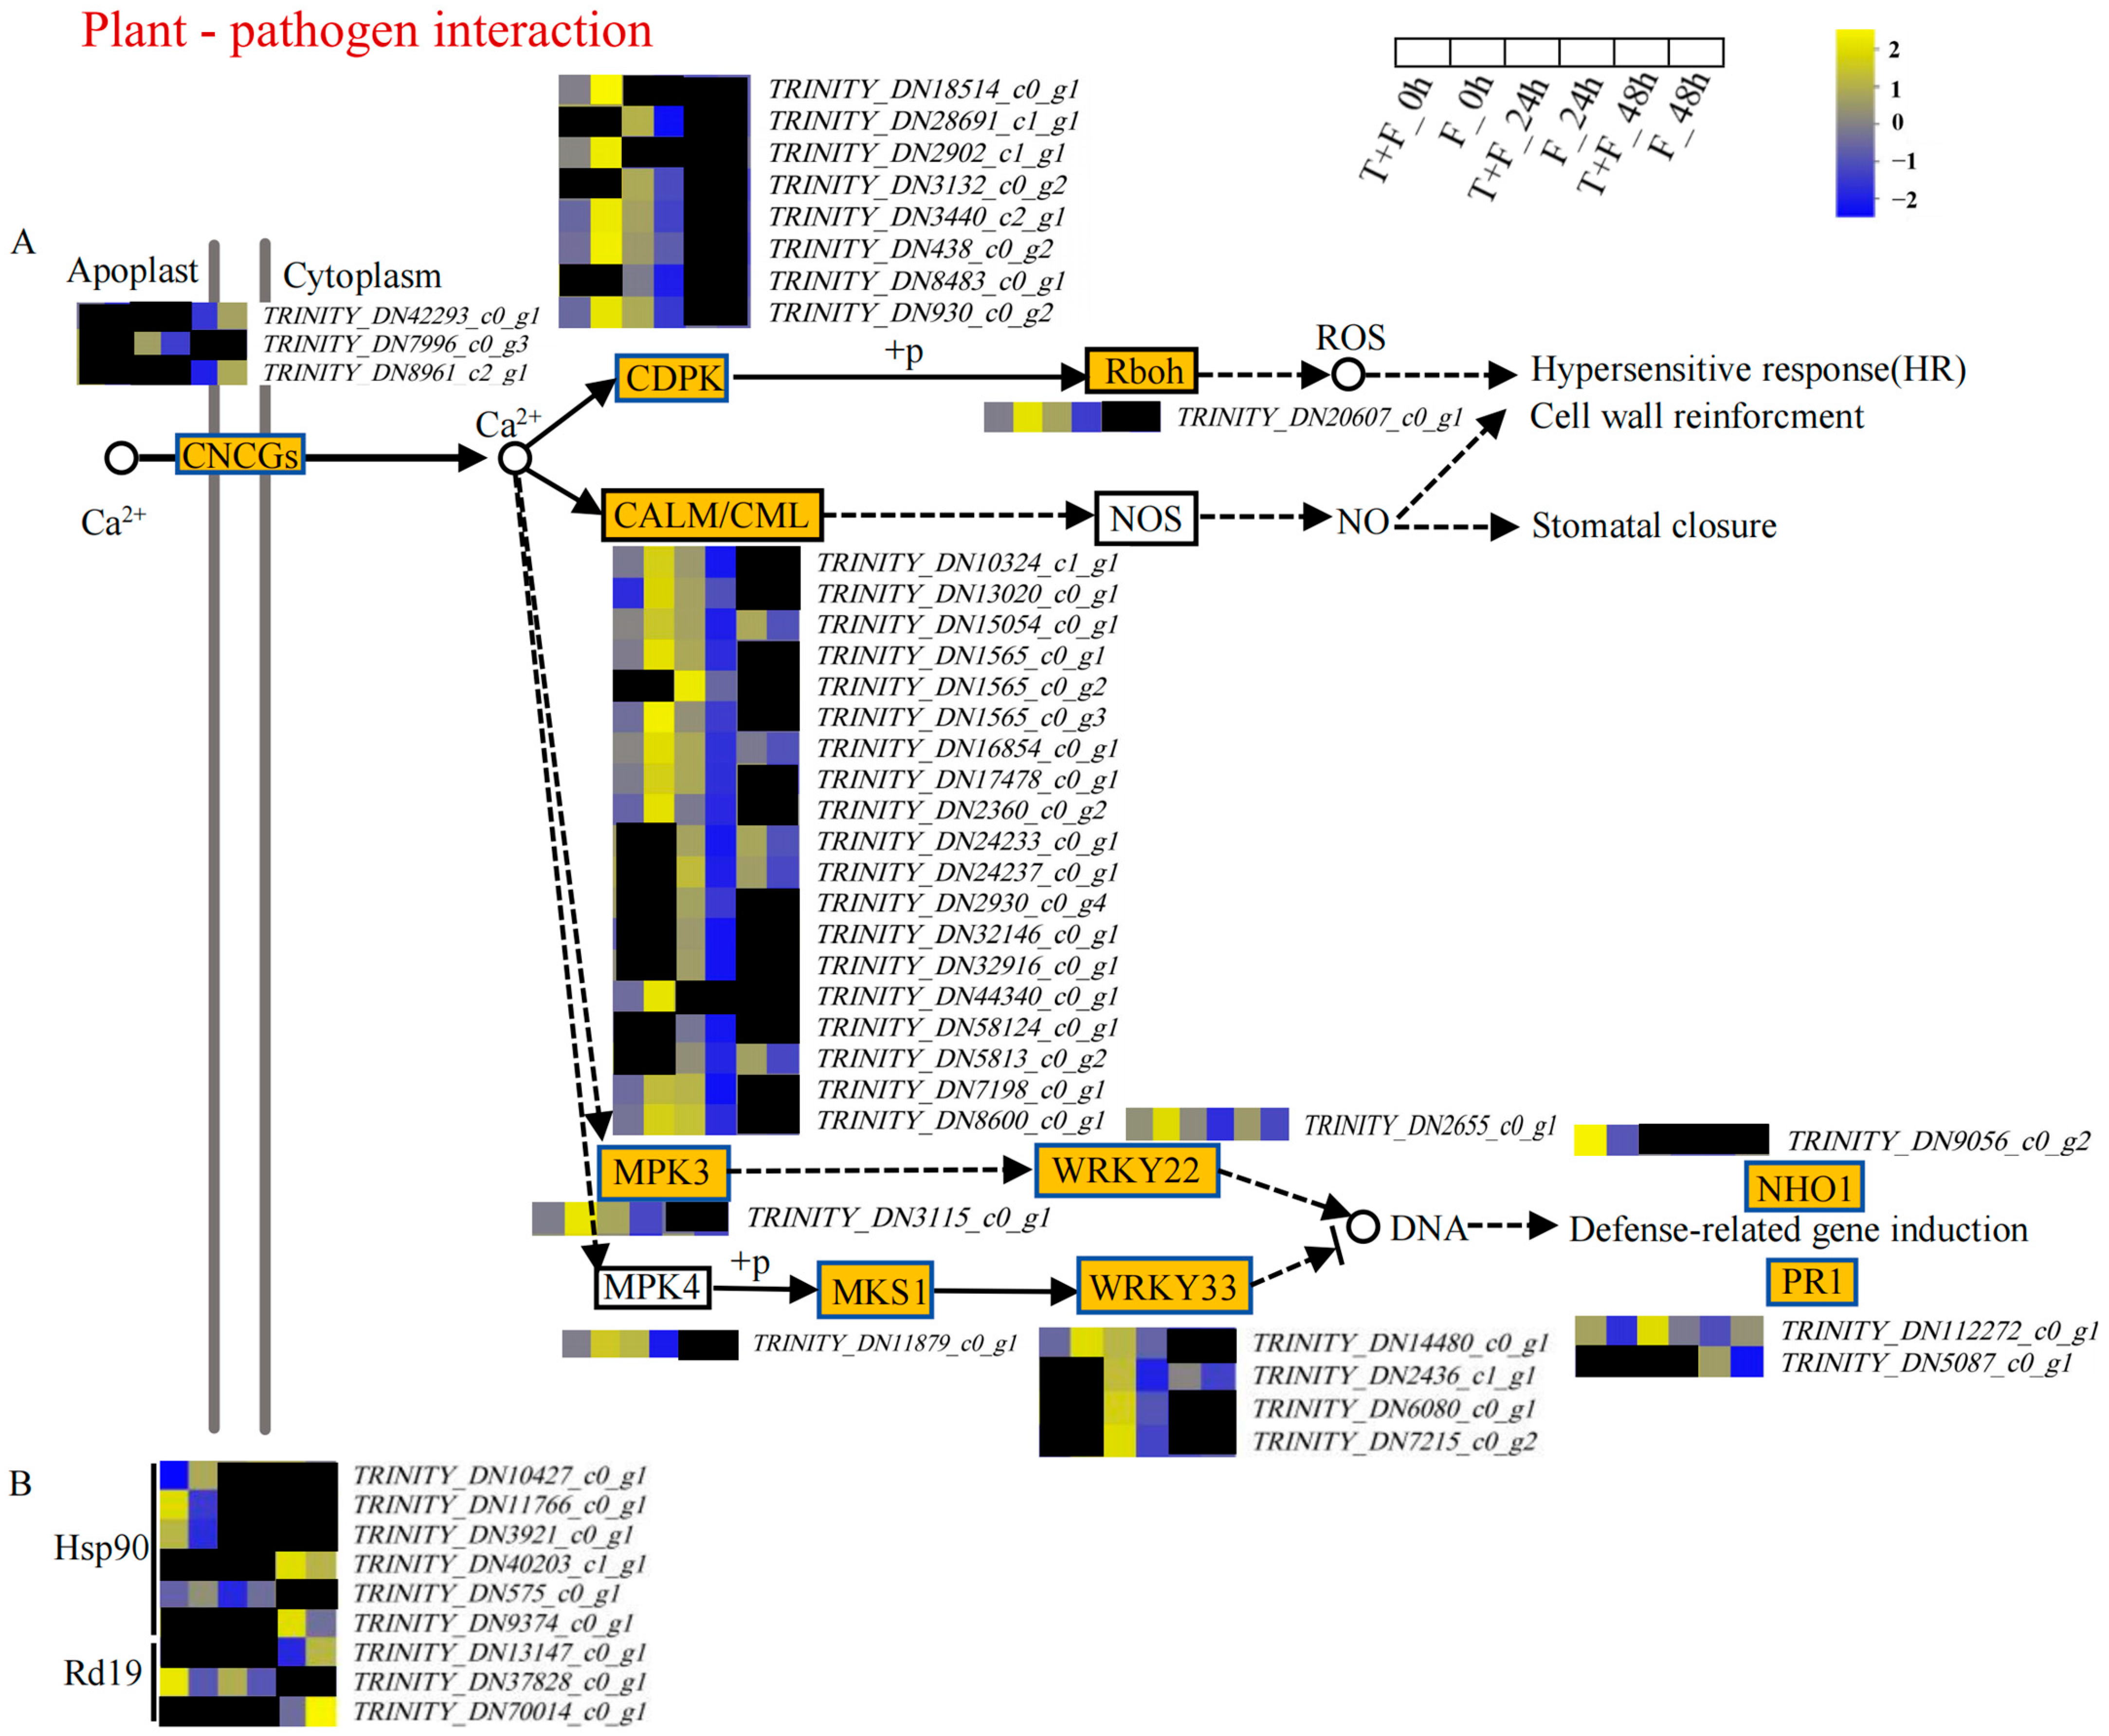
3.5. Plant–Pathogen Interaction Pathway Analysis under T. harzianum Treatment

In this study, 41 Ca2+ signaling-related DEGs were enriched in the plant–pathogen interaction pathway (Figure 4A, Table S5). These genes were grouped into ten subfamilies, namely cyclic nucleotide-gated ion channels (CNGCs), calcium-dependent protein kinases (CDPKs), calmodulin (CaM) and CaM-like proteins (CMLs), respiratory burst oxidase homolog protein (Rboh), mitogen-activated protein kinase (MPK3), WRKY transcription factor 22 (WRKY22), MAP kinase substrate 1 (MKS1), WRKY transcription factor 33 (WRKY33), nonhost resistance 1 (NHO1), and PR protein 1 (PR1). In T + F_0 h vs. F_0 h, only the expression of NHO1- and PR1-related genes was significantly upregulated. In T + F_24 h vs. F_24 h, DEGs related to CNGCs, CDPKs, Rboh, CaM/CMLs, MPK3, WRKY22, MKS1, WRKY33, and PR1 were enriched, and their expression was significantly upregulated. In T + F_48 h vs. F_48 h, the expression of DEGs encoding CaM/CMLs, WRKY22, WRKY33, and PR1 (TRINITY_DN5087_c0_g1) was significantly upregulated.
In addition, DEGs encoding Hsp90 and Rd19 were also enriched (Figure 4B, Table S5). In T + F_0 h vs. F_0 h, the genes TRINITY_DN11766_c0_g1 (Hsp90), TRINITY_DN3921_c0_g1 (Hsp90), and TRINITY_DN37828_c0_g1 (Rd19) were significantly upregulated. TRINITY_DN37828_c0_g1 (Rd19) was significantly upregulated in T + F_24 h vs. F_24 h. TRINITY_DN9374_c0_g1 (Hsp90) was significantly upregulated in T + F_48 h vs. F_48 h.

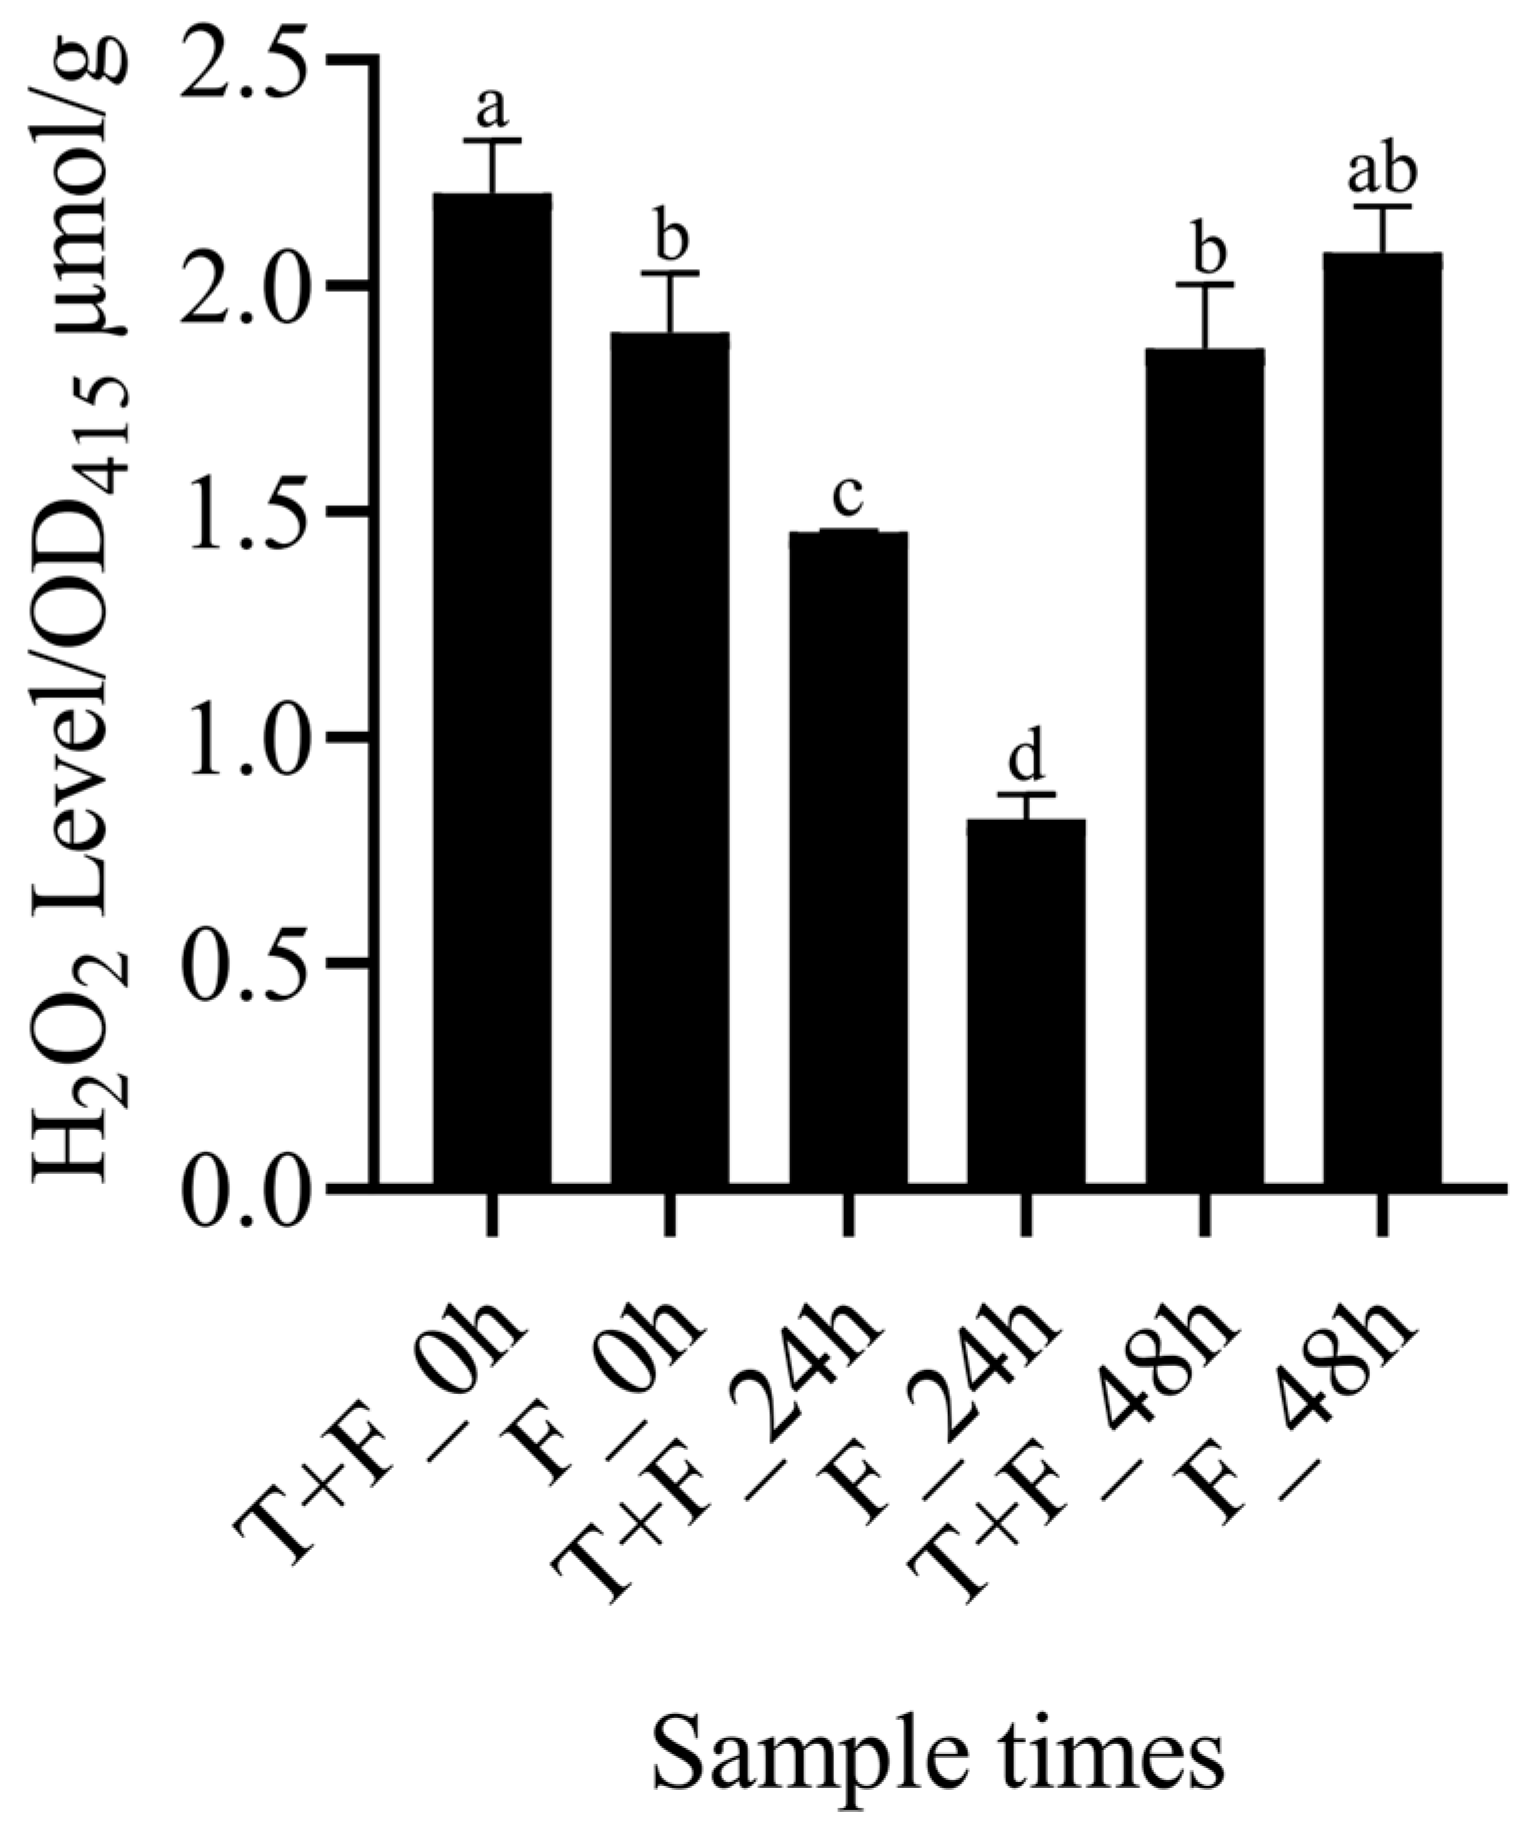
3.6. Assay of H2O2 Levels in the T + F and F Treatments

To confirm the role of H2O2 in the resistance of A. mongholicus to F. solani, H2O2 levels were measured in the T + F and F treatments. The results revealed that H2O2 levels were significantly greater in the T + F treatment than in the F treatment at 0 h, indicating that H2O2 accumulation was induced by T. harzianum treatment for 48 h. Compared with that at 0 h, the H2O2 content was significantly lower in the T + F and F treatments at 24 h. Compared with that at 24 h, the H2O2 content was significantly higher in the T + F and F treatments at 48 h. The H2O2 content in the T + F treatment was lower than the F treatment at 48 h, and no significant difference was found between the two treatments (Figure 5).

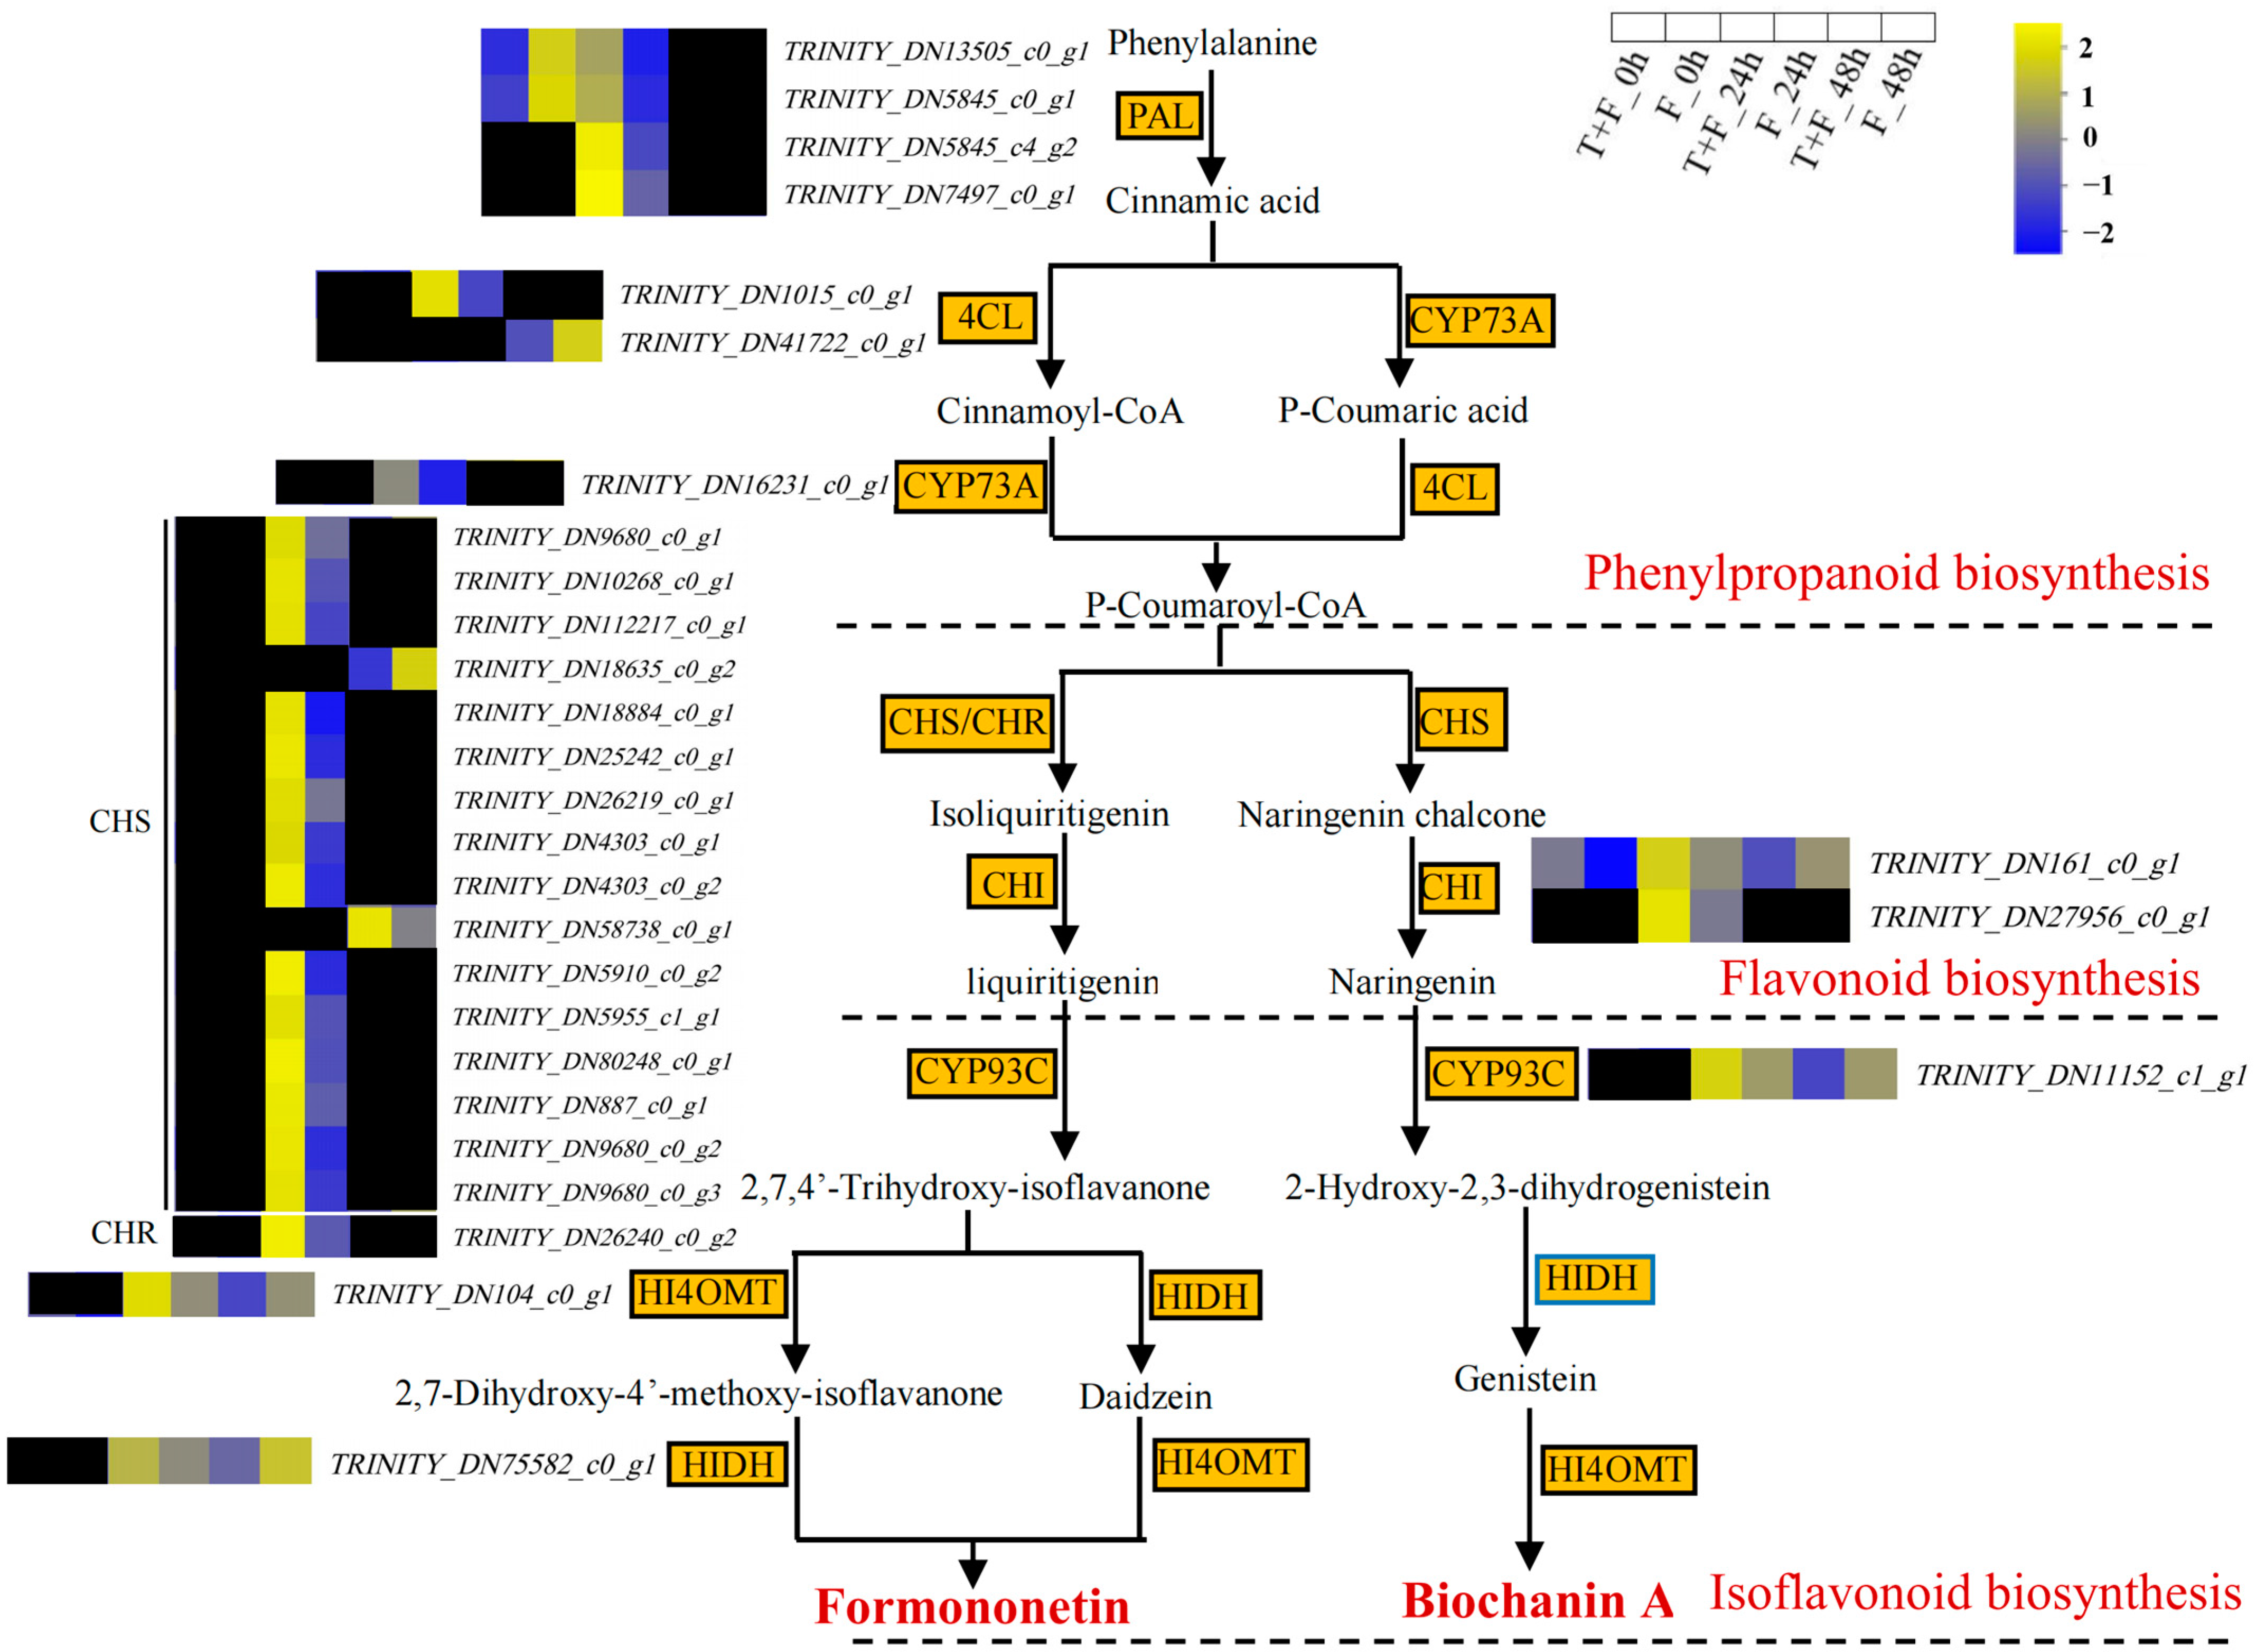
3.7. Formononetin and Biochanin A Biosynthesis Pathway Analysis under T. harzianum Treatment

In this study, 29 DEGs related to the formononetin and biochanin A biosynthesis pathways were identified (Figure 6, Table S5). These genes were grouped into eight subfamilies, namely phenylalanine ammonia lyase (PAL), 4-coumarate-CoA ligase (4CL), trans-cinnamate 4-monooxygenase (YCP73A), chalcone synthase (CHS) and chalcone reductase (CHR), chalcone isomerase (CHI), 2-hydroxyisoflavanone synthase (YCP93C), isoflavone 4′-O-methyltransferase (HI4OMT), and 2-hydroxyisoflavanone dehydratase (HIDH). In T + F_0 h vs. F_0 h, only the expression of TRINITY_DN161_c0_g1 (CHI) was significantly upregulated. In T + F_24 h vs. F_24 h, the expression of DEGs related to formononetin and biochanin A synthesis, such as PAL, 4CL, YCP73A, CHS and CHR, CHI, YCP93C, and HI4OMT, was significantly upregulated, and the expression of DEGs related to another key synthesis gene, HIDH, was also upregulated. In T + F_48 h vs. F_48 h, the expression of only TRINITY_DN58738_c0_g1 (CHS) was significantly upregulated.
In order to preliminarily determine the formononetin and biochanin A inhibitory potential against F. solani, plate inhibition experiments were performed in vitro. Formononetin treatments significantly inhibited the growth of F. solani in a dose-dependent manner (Figure 7A). The rate of mycelial growth inhibition was 3.70% when the concentration of formononetin was 15 mg/mL (Figure 7B). Biochanin A treatment also significantly inhibited the growth of F. solani. There was no significant difference in the inhibition ability in the 1–3 mg/mL concentration range, and the average inhibition rate was 21.49% (Figure 7C). When the concentration was increased to 5%, the inhibition rate increased to 25.8% (Figure 7D).

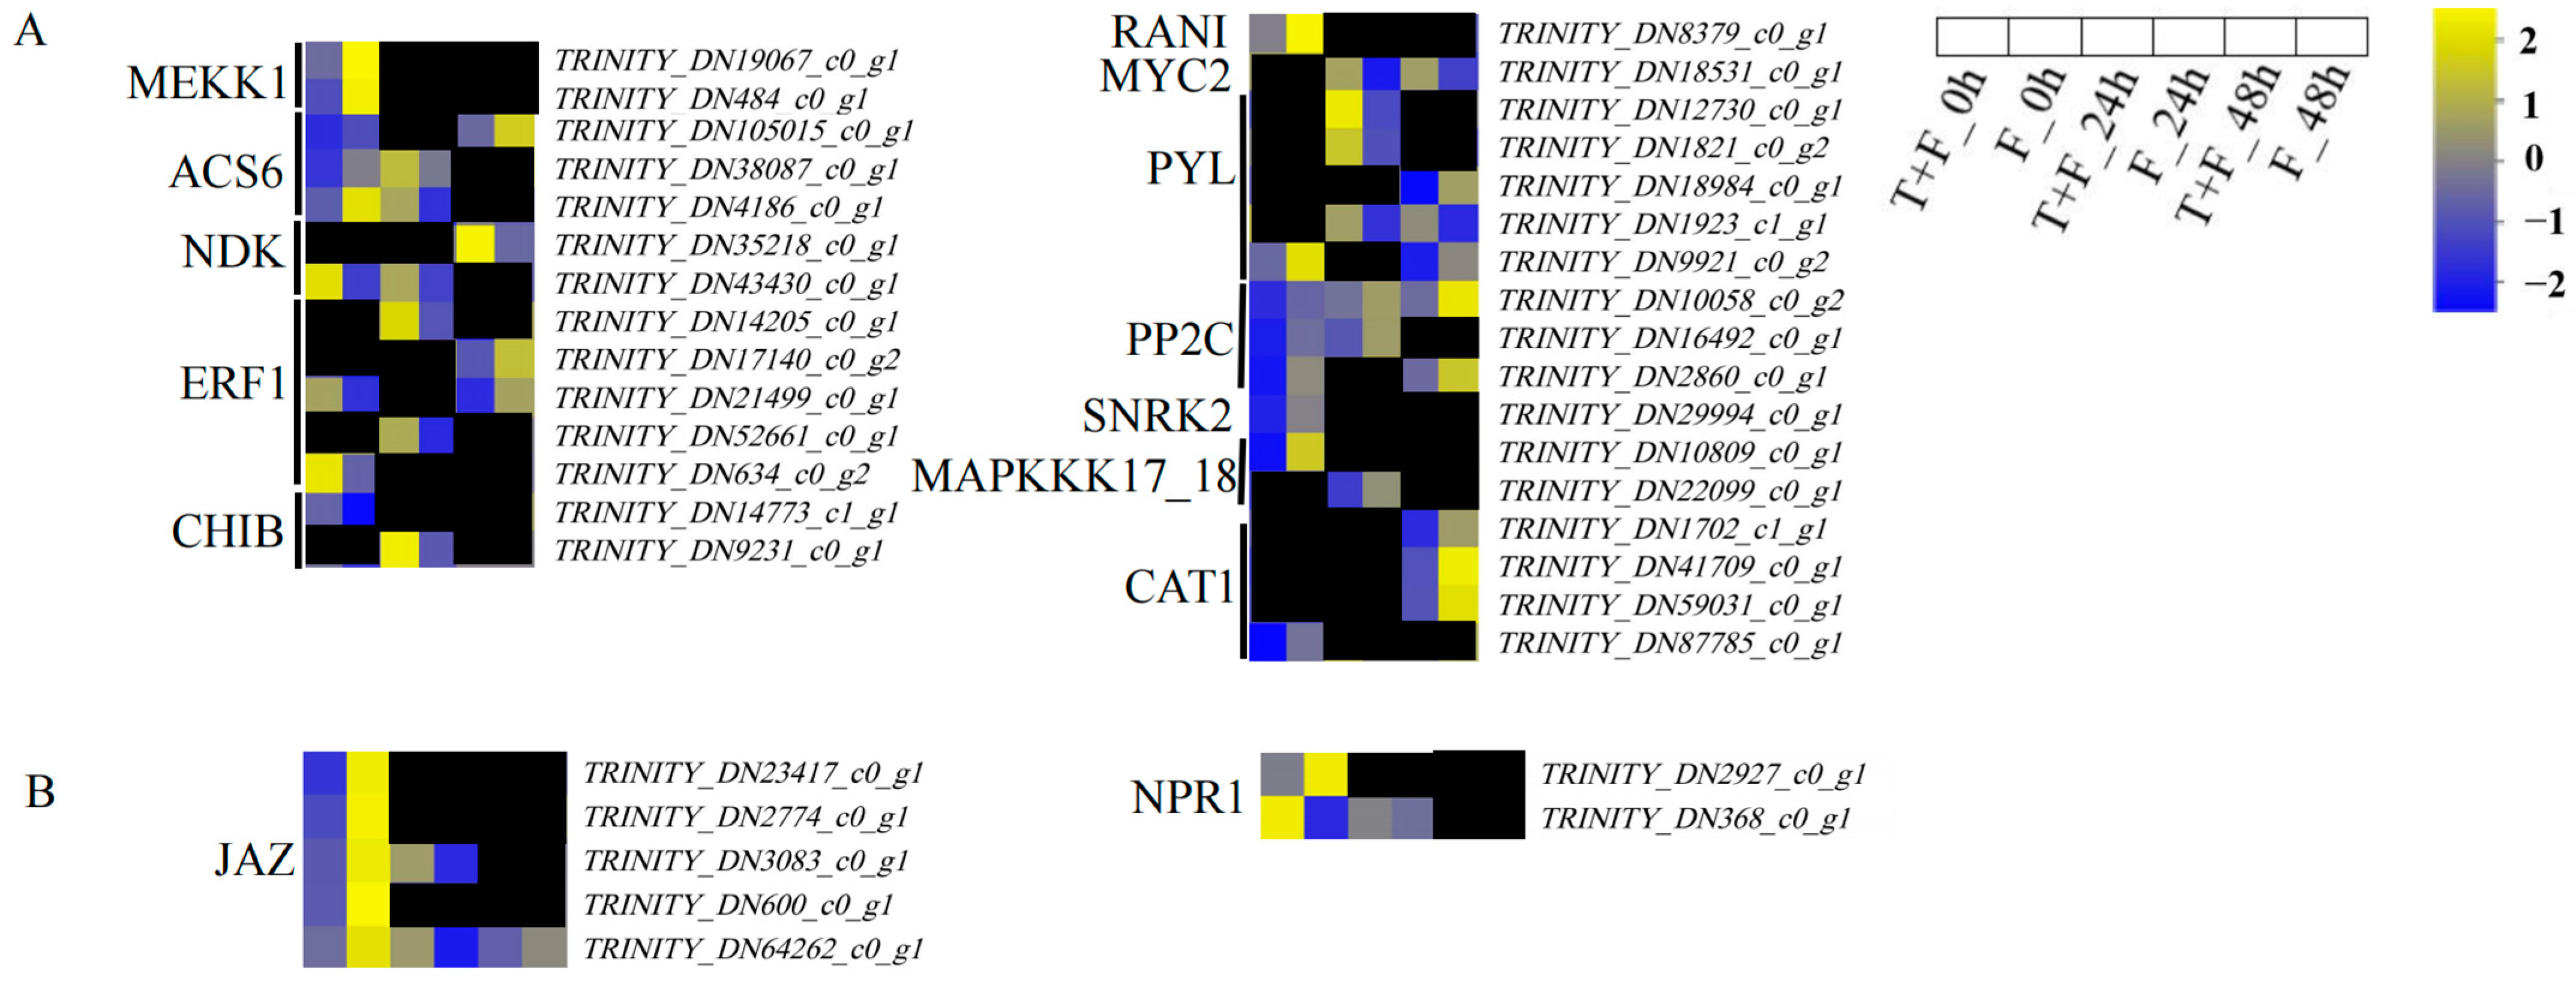
3.8. MAPK Signalling Pathway and Plant Hormone Signal Transduction Pathway Analysis under T. harzianum Treatment

In this study, 32 DEGs were enriched in twelve subfamilies in the MAPK signaling pathway (Figure 8A, Table S5). The twelve subfamilies were as follows: mitogen-activated protein kinase kinase kinase 1-like (MEKK1), 1-aminocyclopropane-1-carboxylate synthase (ACS6), nucleoside-diphosphate kinase (NDK), ethylene-responsive transcription factor 1 (ERF1), basic chitinase (CHIB), copper transporter responsive to antagonist 1 (RAN1), myelocytomatosis transcription factor (MYC2), abscisic acid receptor PYL family (PYL), protein phosphatase 2C (PP2C), serine/threonine-protein kinase SRK2 (SNRK2), mitogen-activated protein kinase kinase kinase 17/18 (MAPKKK17_18), and catalase (CAT1). Among these, ERF1, MYC2, PYL, PP2C, and SNRK2 are also involved in plant hormone signal transduction. In T + F_0 h vs. F_0 h, TRINITY_DN43430_c0_g1 (NDK), TRINITY_DN21499_c0_g1 (ERF1), TRINITY_DN634_c0_g2 (ERF1), and TRINITY_DN14773_c0_g1 (CHIB) were significantly upregulated. In T + F_24 h vs. F_24 h, DEGs in the ACS6, NDK, ERF1, CHIB, MYC2, and PYL subfamilies were significantly upregulated. In T + F_48 h vs. F_48 h, TRINITY_DN35218_c0_g1 (NDK), TRINITY_DN18534_c0_g1 (MYC2), and TRINITY_DN1923_c1_g1 (PYL) were significantly upregulated.
In addition, the JASMONATE-ZIM domain (JAZ) and nonexpressor of PR genes1 (NPR1) were enriched in plant hormone signal transduction (Figure 8B, Table S4). In T + F_0 h vs. F_0 h, TRINITY_DN368_c0_g1 (NPR1) was significantly upregulated. In T + F_24 h vs. F_24 h, the DEGs of the JAZ and NPR1 subfamilies were significantly upregulated.

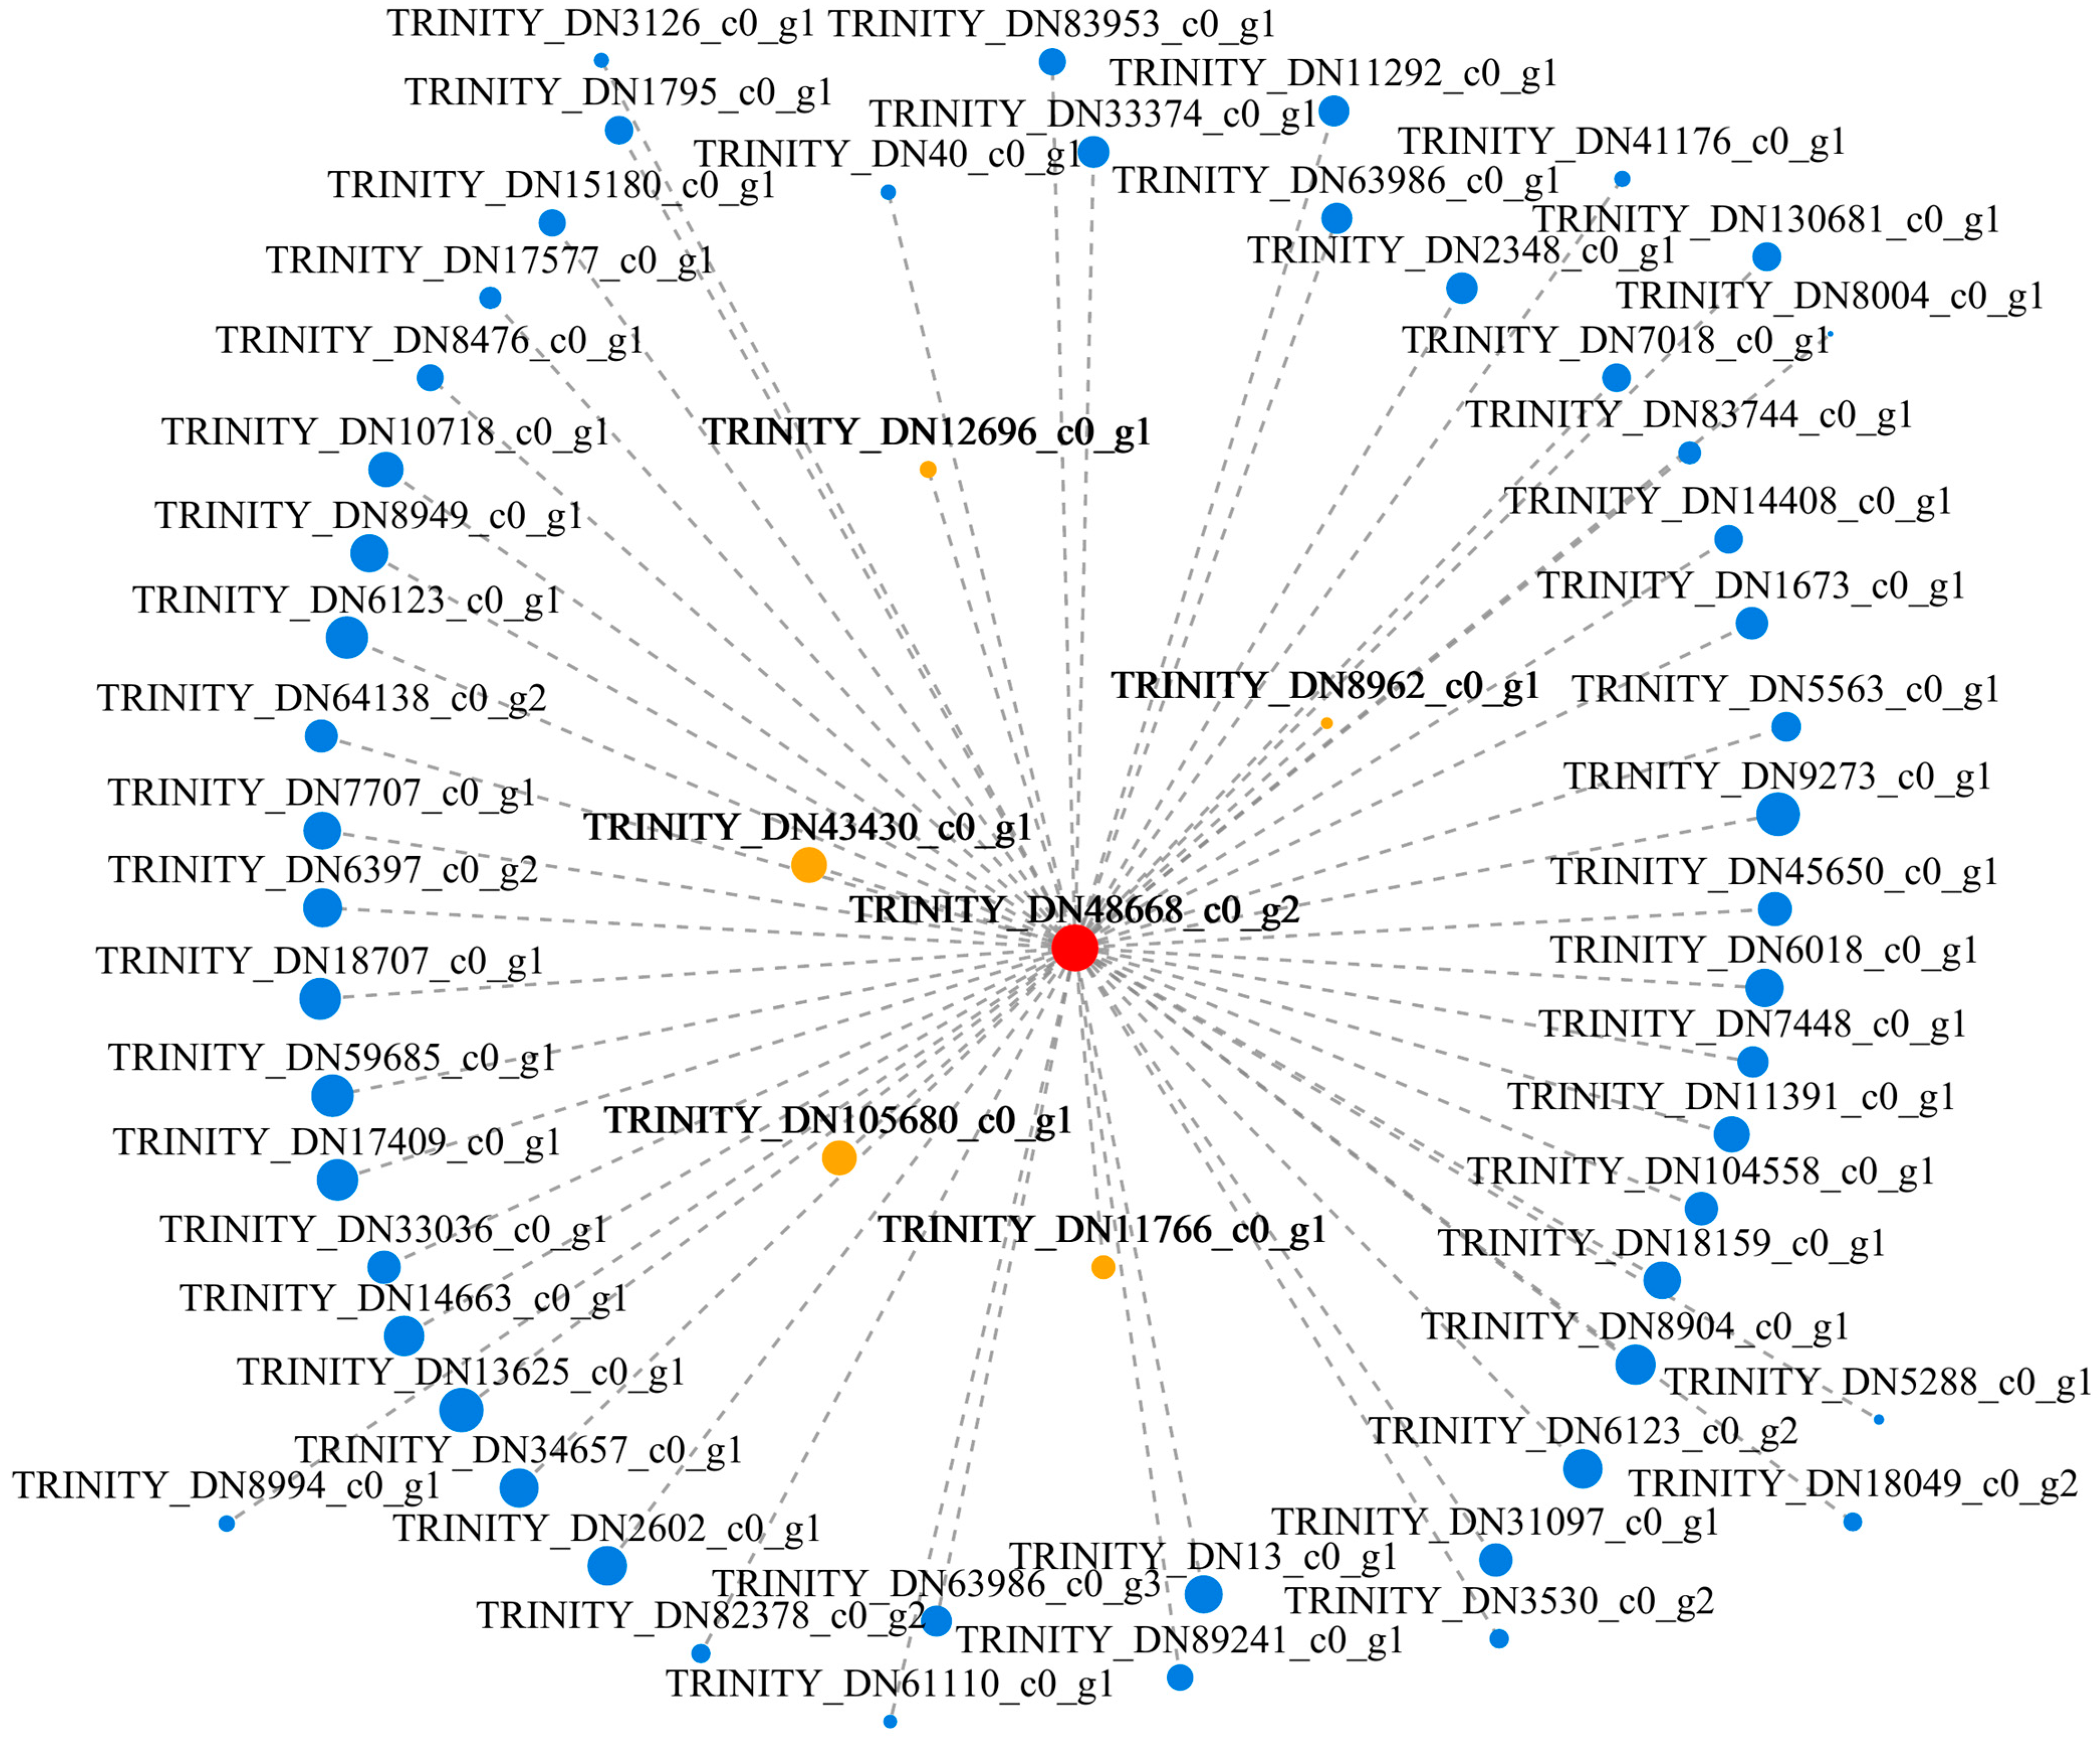
3.9. Gene Coexpression Network Analysis

Coexpressed gene modules were determined via WGCNA on the basis of 4251 DEGs from the GO and KEGG annotations. When the β value was nine (Figure 9A), 11 modules with module sizes ranging from 34 to 1078 genes and 71 genes outside 13 modules were classified into the grey module (Figure 9B). Module eigengenes were evaluated for their correlation with A. mongholicus plants in the T + F treatment. The results revealed that the pink module (R = 0.653, p = 0.0033) eigengenes were significantly (p < 0.01) positively correlated with each other (Figure 9C). There were 58 genes in the pink module.
To screen key genes, the hub genes were identified via a coexpression network of the pink module. One hub gene, TRINITY_DN48668_c0_g2 (RPS25), encoding the 40S ribosomal protein S25-2-like, had the highest module membership value. We then constructed a visual depiction of the coexpression network of this hub gene and found that the coexpressed genes included genes encoding nucleoside diphosphate kinase (NDK) (TRINITY_DN43430_c0_g1) in the MAPK signaling pathway, heat-shock protein 90-like (Hsp90) (TRINITY_DN11766_c0_g1) in plant-pathogen interaction pathway, cyclin D3 (CYCD3) (TRINITY_DN8962_c0_g1) related to Fusarium oxysporum resistance [52], leucine-rich repeat receptor-like protein kinase (LRR-RLK) (TRINITY_DN12696_c0_g1) related to resistance [53], and cytochrome p450 (CYPs) (TRINITY_DN105680_c0_g1) related to Botrytis cinereal and Phytophthora parasitica resistance [54] (Figure 10, Table S6).

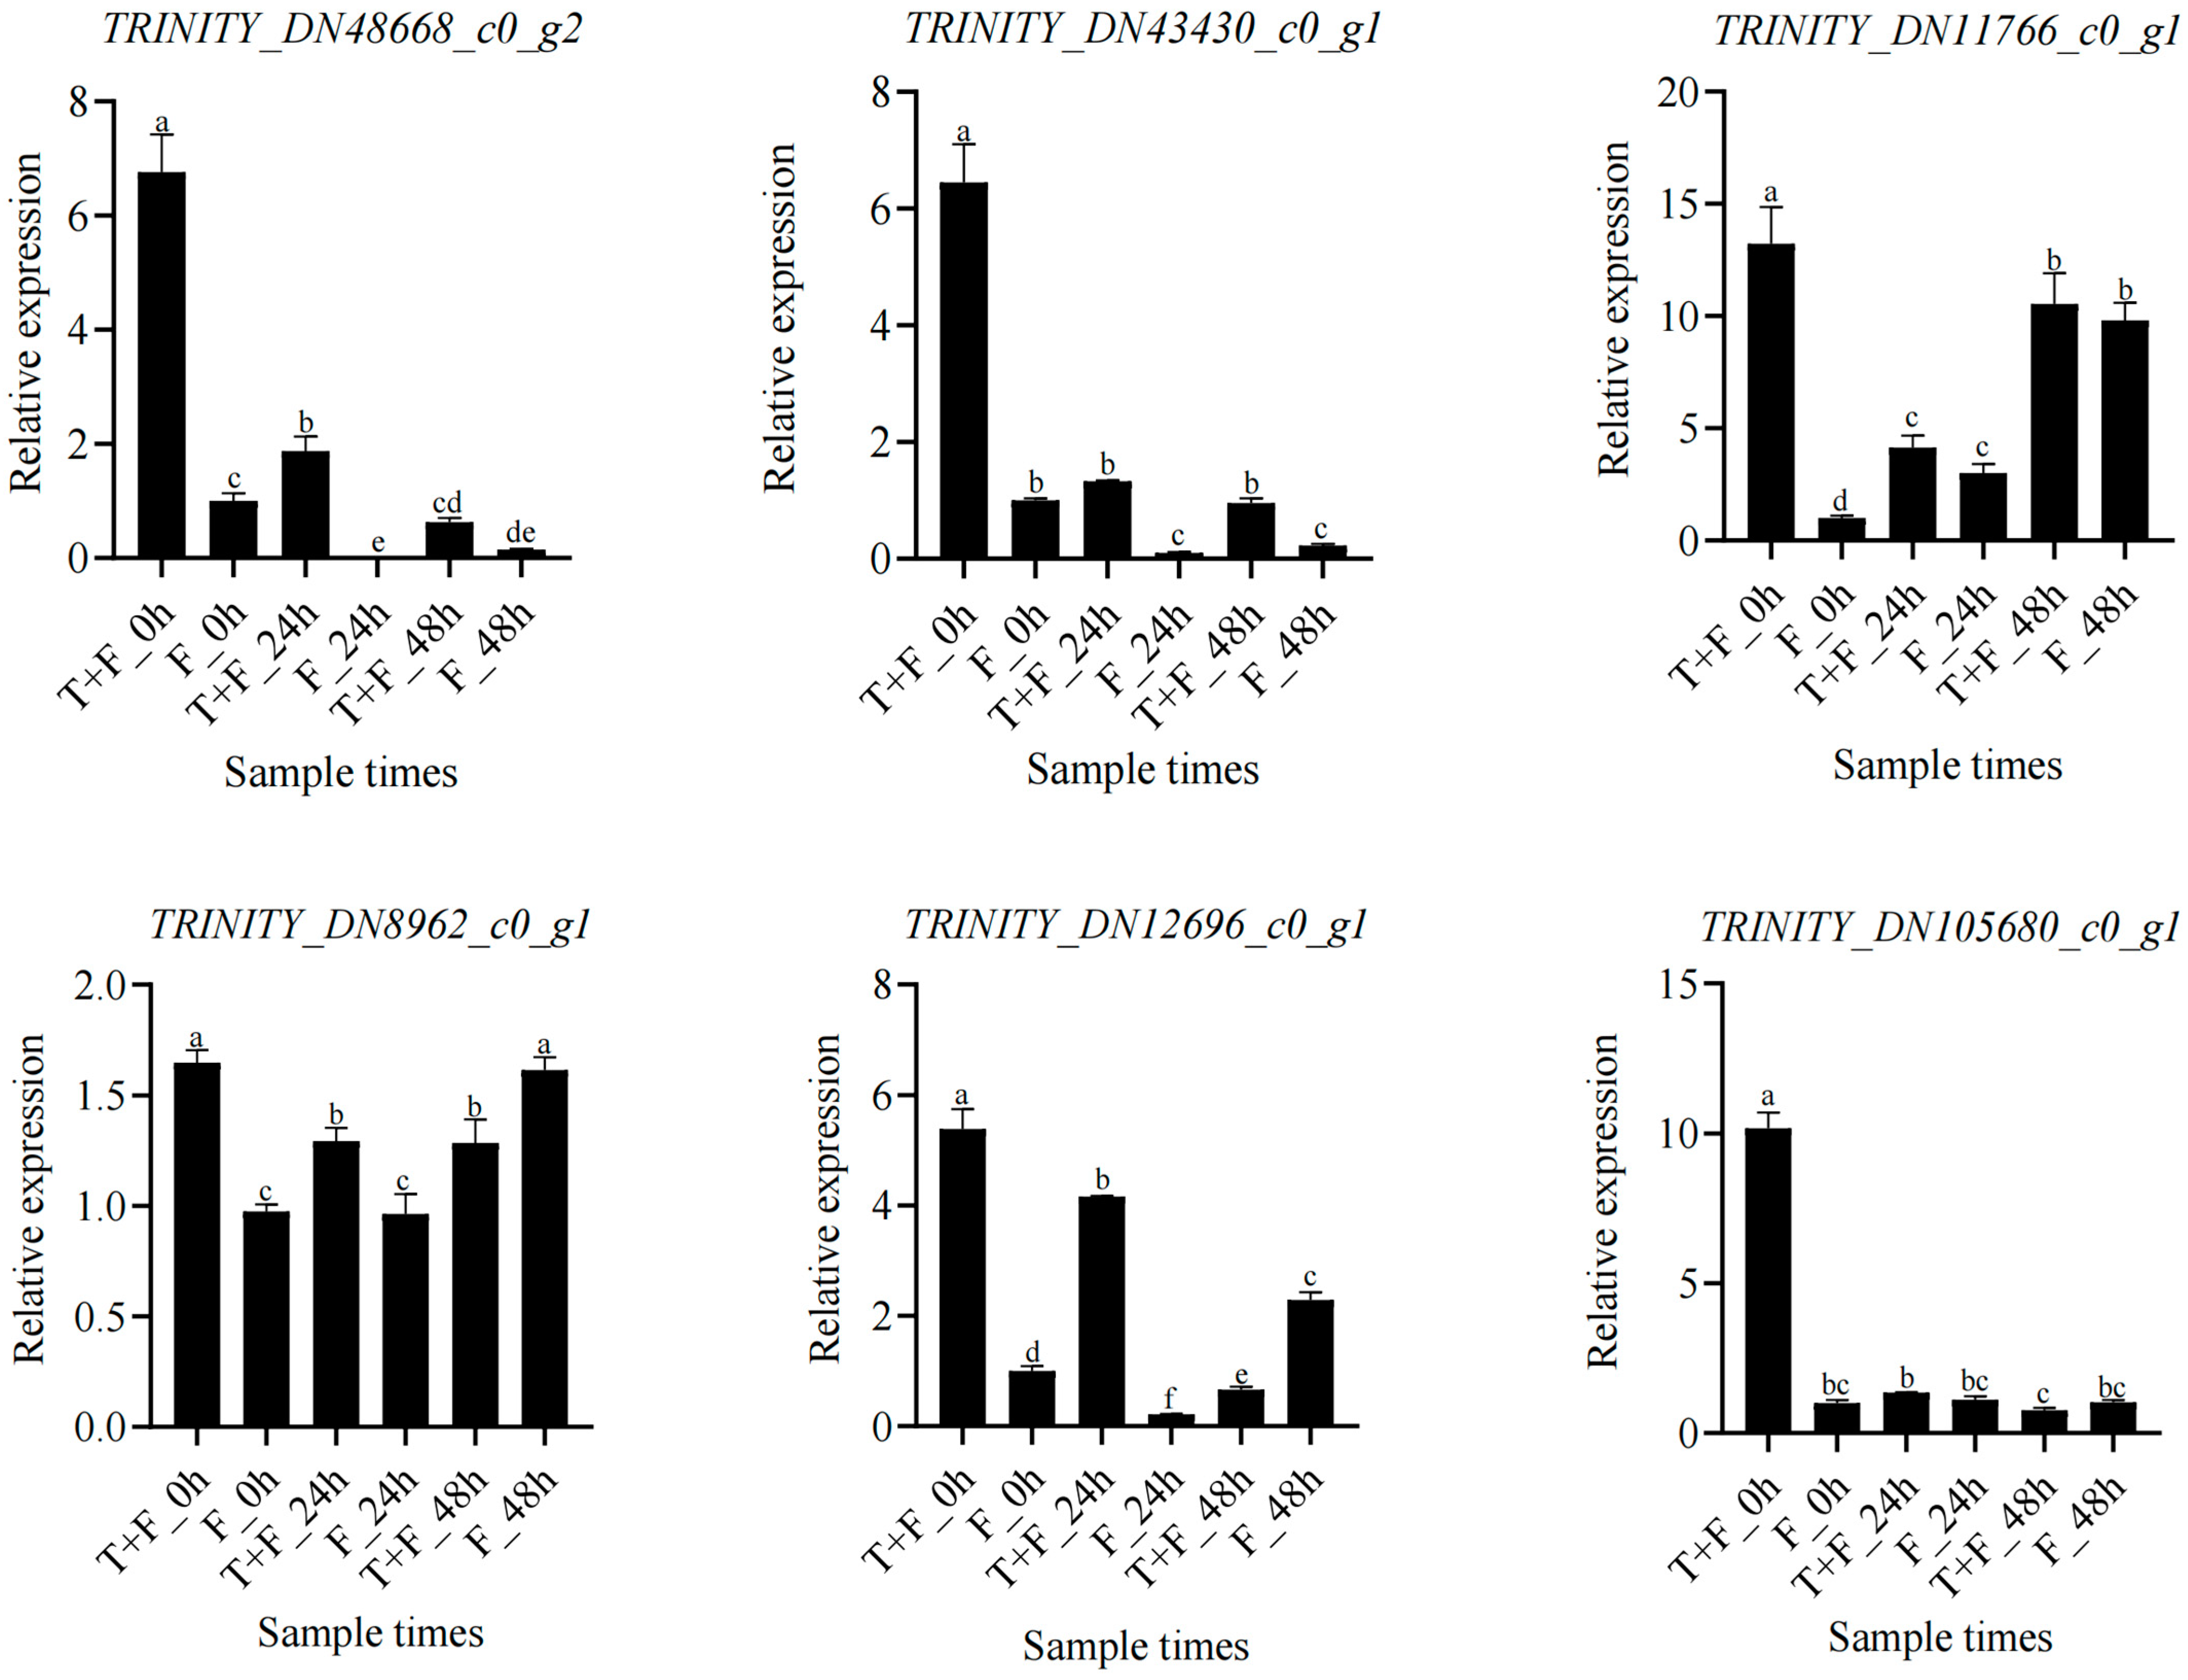
3.10. Expression Analysis of Hub Genes and Coexpressed Genes under T. harzianum Treatment

To confirm that the above hub genes and the coexpressed genes were indeed induced by T. harzianum, an RT–qPCR was performed. The expression of the hub gene TRINITY_DN48668_c0_g2 (RPS25) and the coexpressed genes TRINITY_DN43430_c0_g1 (NDK) and TRINITY_DN11766_c0_g1 (Hsp90) was higher in the T + F treatment group than in the F treatment group overall. In addition, the expression of the coexpressed genes TRINITY_DN8962_c0_g1 (CYCD3), TRINITY_DN12696_c0_g1 (LRR-RLK), and TRINITY_DN105680_c0_g1 (CYPs) was greater in the T + F treatment than in the F treatment at 0 h and 24 h (Figure 11).

3.11. Expression Analysis of RPS25 Induced by the Exogenous Hormones SA, ETH, and MeJA

ISR and SAR depend on the ET/JA- and SA-mediated signaling pathways, respectively. In order to investigate the induction of RPS25 by these pathways, the expression of RPS25 was performed by exogenous hormone inducing. The RT–qPCR results revealed that the expression of the hub gene TRINITY_DN48668_c0_g2 (RPS25) was upregulated by SA and ETH, and its expression peaked at 24 h. Meanwhile, the expression of RPS25 was downregulated by MeJA (Figure 12).

4. Discussion

Conventional transcriptome analysis and WGCNA analysis have been applied to understand the host responses induced by Trichoderma inducing [26,27]. In this study, we used transcriptome analysis and the WGCNA analysis approach to identify resistance pathways and hub genes of A. mongholicus against F. solani elicited by T. harzianum. According to the pathways information, the determination of H2O2 content and formononetin and biochanin A inhibiting F. solani in vitro showed defense-related gene PR1, the production of H2O2, formononetin biosynthesis, biochanin A biosynthesis, CHIB, and HSP90 were the elements that ultimately respond to T. harzianum induction. WGCNA analysis identified one core hub gene, RPS25, which was subsequently proven to respond to hormone-induced expression.

4.1. Induction of PR1 by T. harzianum under F. solani Stress

Calcium (Ca2+) is a common second messenger and changes in the Ca2+ concentration are among the earliest events following the induction of the establishment of plant–microbe symbioses, pathogen defense responses, and stress adaptation [55,56]. Transient increases in intracellular Ca2+ levels and defense responses are activated by metabolite mixtures secreted by the biocontrol fungus T. atroviride [57]. The hydrophobin HYTLO1 secreted by T. longibrachiatum also plays an important role in the early stages of the plant–fungus interaction and influences the Ca2+ level for 30 min, which then activates defense-related genes [58]. In this study, the defense-related gene PR1, which is regulated by the Ca2+ pathway, was upregulated in the three comparison groups. PR proteins offer protection against pathogenic infections by accumulating locally in the affected and surrounding tissues [59]. PR1 expression has been proven to be induced in the roots of potato plantlets by T. harzianum Rifai MUCL 29707 after 168 h and by Arabidopsis root colonization by T. harzianum after 48 h [60,61]. These findings indicate that the induction of PR1 by T. harzianum may be involved in A. mongholicus resistance to F. solani. CaMs/CMLs act as crucial Ca2+-binding sensors that were also induced by T. harzianum in our study. The expression of NbPR1 was significantly upregulated in 35S::AhCML69 tobacco leaves infected with R. solanacearum [62]. We hypothesized that CaMs/CMLs may regulate the expression of PR1 genes.
In addition, the expression of Rd19, which is involved in the plant–pathogen interaction pathway, and NPR1, which is involved in the plant hormone signal transduction pathway, were also upregulated by T. harzianum. In Arabidopsis, overexpression of Rd19 displayed resistance to multiple pathogens. Rd19 protein activity may be activated through SA accumulation and, then, induced PR gene expression [63]. The NPR1 gene is central to the activation of SA-dependent defense genes and is required for the control of Pythium ultimum infection by T. harzianum strain T22 in Arabidopsis seedlings [17,64]. The nuclear localization of NPR1 was found to be required for the activation of PR gene expression [65]. These results indicate that the Rd19 and SA signaling pathway may regulate the expression of the PR1 gene.
Interestingly, SA can increase the endogenous Ca2+ level [66], and both of the regulatory pathways involved can induce the expression of PR genes. This phenomenon suggests that PR genes by T. harzianum inducing may play a key role in A. mongholicus resistance to F. solani. In addition, the expression of PR genes is a good molecular marker for the activation of SAR. These findings indicate that SAR can be activated by T. harzianum induction.

4.2. H2O2 Induction by T. harzianum under F. solani Stress

In our study, CDPK and Rboh were upregulated only in T + F_24 h compared with F_24 h. CDPKs are one of the Ca2+ sensors [66] and can activate the N-terminal EF-hands of Rboh [67]. Rbohs are plant NADPH oxidases that are responsible for ROS generation [68]. H2O2 assays revealed that F. solani infection decreased the accumulation of H2O2 at 24 h, but T. harzianum slowed the decrease in H2O2. ROS generation can promote programmed cell death (PCD) to restrict invading pathogens to infection sites [69]. With the infection of F. solani, the accumulation of H2O2 increased at 48 h, but the presence of T. harzianum decreased the increase of H2O2. Excessive production of ROS can cause damage to DNA, proteins, and lipids [70]. These findings indicate that the Ca2+ pathway by T. Harzianum inducing regulates ROS generation, facilitating resistance to F. solani infection.

4.3. Formononetin and Biochanin A Biosynthesis Pathways Induction by T. harzianum under F. solani Stress

Phenylpropanoid, flavonoid, and isoflavonoid biosynthesis pathways were enriched in this study. Previous studies have shown that phenylpropanoid compounds are precursors to flavonoids and isoflavonoids [71]. Formononetin and biochanin A are plant isoflavones. In our study, formononetin and biochanin A can be regulated by three pathways together in T + F_24 h. These results indicated that the biosynthesis of formononetin and biochanin A can be activated by T. harzianum. Formononetin, when present at high levels, acts as an active fungicidal compound to protect plants against fungal diseases [72]. Biochanin A also showed high antifungal and antibacterial activity [73,74]. In the present study, formononetin and biochanin A have indeed been shown to have the potential to inhibit F. solani growth in vitro. And the inhibitory capacity of biochanin A was greater. When the concentration of biochanin A was 1 mg/mL, the growth of F. solani was significantly inhibited. However, whether the inhibitory concentration can be attained in A. mongholicus under T + F treatment is to be further investigated.

4.4. CHIB Induction by T. harzianum under F. solani Stress

In our study, the expressions of NDK, ACS6, ERF1, and CHIB in the MAPK signaling pathway and the plant hormone signal transduction pathway were upregulated by T. harzianum. The expression of the gene OsNDPK1 (NDK) in rice was also induced by bacterial pathogen infection and SA [75]. NDK can enhance the phosphorylation of activated MPK3 [76]. MPK3 is also capable of phosphorylating ACS6 and ACS2. ACS is the rate-limiting enzyme that catalyzes ET biosynthesis. ACS6 and ACS2 can be mutated to reduce B. cinerea-induced ET production [77]. ERF genes, which activate the expression of downstream ET-responsive genes, were upregulated by T. harzianum T22 [78,79]. While CHIB is an ERF target gene, the expression of CHIB was increased in AtERF14-overexpressing plants [80]. When plant (host) cells are subjected to pathogen stress, plant chitinases are highly expressed and thereby play a crucial role in combating fungal pathogens [59]. These results indicate that the induction of the defense-response gene CHIB by T. harzianum plays a key role in the resistance of A. mongholicus to F. solani. As CHIB was expressed in T + F_0 h vs. F_0 h and T + F_24 h vs. F_24 h, it is active mainly early in the process. The expression of CHIB depends on the ET signaling pathway, which showed that ISR can be activated by T. harzianum induction.

4.5. MYC2 and JAZ Induction by T. harzianum under F. solani Stress

MYC2 and JAZ in the JA signaling pathway were also induced by T. harzianum in our study. MYC serves as the fundamental regulator of the JA signaling branch, which is involved in plant development and multiple stresses [81]. The activation of JA signaling mediated by MYC2 is precisely regulated by its repressor JAZ and a subunit of the mediator complex (MED25) protein [82]. JAZ proteins are negative regulators of the JA signaling pathway [83]. In T + F_48 h vs. F_48 h, the expression of MYC2 was upregulated; the expression of JAZ was the opposite. We hypothesized that MYC2 induced by T. harzianum and activation of the JA signaling pathway were mainly effective in the later stage under F. solani stress. MYC2 could be induced by T. asperellum-secreted protein Epl1-Tas [84] and was required for the ISR of the beneficial rhizobacterial strain Pseudomonas fluorescens WCS417r in Arabidopsis thaliana [85]. These manifestations suggested that the ISR dependent on the JA pathway can be activated by T. harzianum.

4.6. Candidate Hub Gene Mining under T. harzianum Treatment

A total of six genes, namely TRINITY_DN48668_c0_g2 (RPS25), TRINITY_DN43430_c0_g1 (NDK), TRINITY_DN11766_c0_g1 (Hsp90), TRINITY_DN8962_c0_g1 (CYCD3), TRINITY_DN12696_c0_g1 (LRR-RLK), and TRINITY_DN105680_c0_g1 (CYPs), were identified hub genes. Among the expression of RPS25, NDK and Hsp90 were higher in the T + F treatment than in the F treatment. These three genes, by T. harzianum inducing, may play a major role in A. mongholicus against F. solani.
TRINITY_DN48668_c0_g2 (RPS25), encoding the 40S ribosomal protein S25-2-like, was identified. Ribosomes and ribosome-associated proteins are required for protein synthesis [86,87]. The 40S small subunit, which is formed by small ribosomal proteins (RPSs) and 18S rRNA, is part of the eukaryotic ribosome [87,88]. A previous study revealed that the RPS6 mRNA expression and protein levels in Nicotiana benthamiana increased during infection with the turnip mosaic virus (TuMV), tobacco etch virus (TEV), and tobacco mosaic virus (TMV) [89,90]. The RPS21 gene in tomato was upregulated by T. harzianum strain T22 treatment [78]. The increase in protein expression revealed that the expression of RPS25 in Vanilla planifolia Jacks is an early plant response to Fusarium infection [91]. In this study, RPS25, which acts as a hub gene, was identified via WGCNA, and its expression was greater in the T + F treatment than in the F treatment overall. On the basis of the above, we assumed that T. harzianum can activate ISR and SAR. We also found that RPS25 could be induced upregulation by the exogenous hormones SA and ETH. These results indicated that the induction of RPS25 by T. harzianum may play a key role in the resistance of A. mongholicus to F. solani.
Overall, the expression of NDK was greater in the T + F treatment than in the F treatment. NDK plays an important role in regulating the CHIB gene. This finding indicates that CHIB can be reliably used as an important resistance-related gene.
Heat-shock proteins (Hsps) were triggered by virtually all stresses. Hsp90-located cytoplasm is accountable for pathogen resistance through interacting with the resistance protein [92]. It also can be induced by the T. harzianum strain M10 [22] and T. harzianum T39 [93]. In our study, the Hsp90-enriched plan–pathogen interaction pathway was also induced by T. harzianum and belonged to highly connected hub genes. We conjectured that Hsp90 induced by T. harzianum positively regulated A. mongholicus resistance to F. solani.

5. Conclusions

T. harzianum has the potential to induce plant resistance against pathogens [94]. However, the molecular mechanism by which T. harzianum induces resistance to A. mongholicus is unclear. In this study, a total of 6361 DEGs in A. mongholicus were induced by T. harzianum. Analysis shows that resistance of A. mongholicus against F. solani depends mainly on pathways that regulate the defense-related gene PR1, the production of H2O2, formononetin biosynthesis, biochanin A biosynthesis and CHIB, and the gene HSP90. WGCNA revealed one core hub gene, RPS25, responding primarily to the induction of the exogenous hormones SA and ETH. This study contributes to a better understanding of the molecular mechanisms underlying the resistance induced by T. harzianum against F. solani in A. mongholicus roots. The genes identified from this experiment will be useful for selecting candidates for resistance to F. solani in A. mongholicus. The selected genes can be functionally validated by molecular biological methods.

Supplementary Materials

The following supporting information can be downloaded at https://www.mdpi.com/article/10.3390/genes15091180/s1: Figure S1: Functional annotation of 6361 DEGs. (A) GO annotations analysis. (B) KEGG annotations analysis; Figure S2: Validation results of RNA-Seq by RT-qRCR for four genes; Table S1: Primers used for RT-qPCR; Table S2: A statistical summary for all RNA-Seq samples; Table S3: Statistical information of differentially expressed genes; Table S4: GO annotation analysis of Astragalus mongholicus 4224 DEGs for Trichoderma harzianum T9-1-3-1 inducing; Table S5: Expression information of DEGs in key KEGG pathways; Table S6: Information of 58 connected hub genes.

Author Contributions

J.N. and J.L. designed the study. J.N., X.Y., G.L., Y.B., W.L., Y.W., H.L. and Z.S. performed the experiments and analyzed the data. J.N. drafted the manuscript. J.L. revised the paper. All authors have read and agreed to the published version of the manuscript.

Funding

This study was supported by Fundamental Research Program of Shanxi Province (20210302124371); the project of the Science and Technology Achievement Transformation Guidance Project in Shanxi Province (202304021301059); the earmarked fund for Modern Agro-TMC Industry Technology Research System in Shanxi province (2024); Hengshan Huangqi Industry Research Institute Project (XDHZHQY2022-04); and Science and Technology Innovation Funds of Shanxi Agricultural University (2018YJ29).

Institutional Review Board Statement

This study did not include any research involving animal or human subjects.

Informed Consent Statement

Not applicable.

Data Availability Statement

The original contributions presented in the study are included in the article/Supplementary Material.

Conflicts of Interest

The authors declare that they have no conflicts of interest.

References

  1. He, Z.Q.; Findlay, J.A. Constituents of Astragalus mongholicus. J. Nat. Prod. 1991, 54, 810–815. [Google Scholar] [CrossRef]
  2. Tang, W.C.; Eisenbrand, G. Chinese Drugs of Plant Origin; Springer: Berlin/Heidelberg, Germany, 1992; pp. 191–197. [Google Scholar]
  3. Fu, J.; Wang, Z.H.; Huang, L.F.; Zheng, S.H.; Wang, D.M.; Chen, S.L.; Zhang, H.T.; Yang, S.H. Review of the botanical characteristics, phytochemistry, and pharmacology of Astragalus mongholicus (Huangqi). Phytother. Res. 2014, 28, 1275–1283. [Google Scholar] [CrossRef] [PubMed]
  4. Wang, J.L.; Zhang, J.F.; Ma, J.X.; Liu, L.; Li, J.J.; Shen, T.; Tian, Y.Q. The major component of cinnamon oil as a natural substitute against Fusarium solani on Astragalus mongholicus. J. Appl. Microbiol. 2022, 132, 3125–3141. [Google Scholar] [CrossRef] [PubMed]
  5. Ma, Y.Y.; Guan, Y.M.; Wang, Q.X.; Li, M.J.; Pan, X.X.; Zhang, Y.Y. Research progress on main diseases and control measures of Astragalus mongholicus. Spec. Wild Econ. Anim. Plant Res. 2019, 41, 101–107. [Google Scholar]
  6. Wang, L.X.; Sun, X.R.; Bai, Q.J.; Qi, F.M. Pathogen identification of root rot in Astragallus mongholicus. Acta Agric. Boreali-Sin. 1994, 9, 107–109. [Google Scholar]
  7. Zhang, C.H.; Xu, J.P.; Wang, J.; Zhang, G.J.; Li, W.H.; Guo, L.P. Investigation and arrangement of ecological planting pattern of Astragalus radix in Inner Mongolia. Mod. Chin. Med. 2018, 20, 1212–1216. [Google Scholar]
  8. Shi, A.L.; Xing, Z.M.; Guo, Y.W.; Shang, Y.R.; Ma, C.Y. Field control effect of combination of fungicide and insecticide on root rot disease of Astragalusm embranaceus. J. Hebei Agric. Sci. 2016, 20, 55–59. [Google Scholar]
  9. Gao, Y.H.; Zhang, Y.; Cheng, X.Q.; Zheng, Z.H.; Wu, X.H.; Dong, X.H.; Hu, Y.G.; Wang, X.F. Agricultural Jiaosu: An eco-friendly and cost-effective control strategy for suppressing fusarium root rot disease in Astragalus mongholicus. Front. Microbiol. 2022, 13, 823704. [Google Scholar] [CrossRef]
  10. Behiry, S.; Soliman, S.A.; Massoud, M.A.; Abdelbary, M.; Kordy, A.M.; Abdelkhalek, A.; Heflish, A. Trichoderma pubescens elicit induced systemic resistance in tomato challenged by Rhizoctonia solani. J. Fungi 2023, 9, 167. [Google Scholar] [CrossRef]
  11. Erazo, J.G.; Palacios, S.A.; Pastor, N.; Giordano, F.D.; Rovera, M.; Reynoso, M.M.; Venisse, J.S.; Torres, A.M. Biocontrol mechanisms of Trichoderma harzianum ITEM 3636 against peanut brown root rot caused by Fusarium solani RC 386. Biol. Control 2021, 164, 104774. [Google Scholar] [CrossRef]
  12. Thambugala, K.M.; Daranagama, D.A.; Phillips, A.J.; Kannangara, S.D.; Promputtha, I. Fungi vs. fungi in biocontrol: An overview of fungal antagonists applied against fungal plant pathogens. Front. Cell. Infect. Microbiol. 2020, 10, 604923–604942. [Google Scholar] [CrossRef] [PubMed]
  13. Guzmán-Guzmán, P.; Kumar, A.; de Los Santos-Villalobos, S.; Parra-Cota, F.I.; Orozco-Mosqueda, M.D.C.; Fadiji, A.E.; Hyder, S.; Babalola, O.O.; Santoyo, G. Trichoderma species: Our best fungal allies in the biocontrol of plant diseases—A review. Plants 2023, 12, 432. [Google Scholar] [CrossRef]
  14. Teng, Y.P.; Liang, Z.S.; Chen, R. Preliminary study of Trichoderma against the root rot disease of Astragallus. Acta Agric. Boreali-Occident. Sin. 2006, 15, 69–71. [Google Scholar]
  15. Singh, B.N.; Singh, A.; Singh, B.R.; Singh, H.B. Trichoderma harzianum elicits induced resistance in sunflower challenged by Rhizoctonia solani. J. Appl. Microbiol. 2014, 116, 654–666. [Google Scholar] [CrossRef] [PubMed]
  16. Vinale, F.; Sivasithamparam, K.; Ghisalberti, E.L.; Marra, R.; Woo, S.L.; Lorito, M. Trichoderma-plant-pathogen interactions. Soil Biol. Biochem. 2008, 40, 1–10. [Google Scholar] [CrossRef]
  17. Shoresh, M.; Harman, G.E.; Mastouri, F. Induced systemic resistance and plant responses to fungal biocontrol agents. Annu. Rev. Phytopathol. 2010, 48, 21–43. [Google Scholar] [CrossRef]
  18. Vallad, G.E.; Goodman, R.M. Systemic acquired resistance and induced systemic resistance in conventional agriculture. Crop Sci. 2004, 44, 1920–1934. [Google Scholar] [CrossRef]
  19. Saikia, R.; Srivastava, A.K.; Singh, K.; Arora, D.K.; Lee, M.W. Effect of iron availability on induction of systemic resistance to Fusarium wilt of Chickpea by Pseudomonas spp. Mycobiology 2005, 33, 35–40. [Google Scholar] [CrossRef]
  20. Durrant, W.E.; Dong, X. Systemic acquired resistance. Annu. Rev. Phytopathol. 2004, 42, 185–209. [Google Scholar] [CrossRef]
  21. Abbas, A.; Mubeen, M.; Zheng, H.X.; Sohail, M.A.; Shakeel, Q.; Solanki, M.K.; Iftikhar, Y.; Sharma, S.; Kashyap, B.K.; Hussain, S.; et al. Trichoderma spp. genes involved in the biocontrol activity against Rhizoctonia solani. Front. Microbiol. 2022, 13, 884469. [Google Scholar] [CrossRef]
  22. Manganiello, G.; Sacco, A.; Ercolano, M.R.; Vinale, F.; Lanzuise, S.; Pascale, A.; Napolitano, M.; Lombardi, N.; Lorito, M.; Woo, S.L. Modulation of tomato response to Rhizoctonia solani by Trichoderma harzianum and its secondary metabolite harzianic acid. Front. Microbiol. 2018, 9, 1966. [Google Scholar] [CrossRef] [PubMed]
  23. Amira, M.B.; Lopez, D.; Mohamed, A.T.; Khouaja, A.; Chaar, H.; Fumanal, B.; Gousset-Dupont, A.; Bonhomme, L.; Label, P.; Goupil, P.; et al. Beneficial effect of Trichoderma harzianum strain Ths97 in biocontrolling Fusarium solani causal agent of root rot disease in olive trees. Biol. Control 2017, 110, 70–78. [Google Scholar] [CrossRef]
  24. Howell, C.R.; Hanson, L.E.; Stipanovic, R.D.; Puckhaber, L.S. Induction of terpenoid synthesis in cotton roots and control of Rhizoctonia solani by seed treatment with Trichoderma virens. Phytopathology 2000, 90, 248–252. [Google Scholar] [CrossRef] [PubMed]
  25. Li, Z.F.; Bai, X.L.; Jiao, S.; Li, Y.M.; Li, P.R.; Yang, Y.; Zhang, H.; Wei, G.H. A simplified synthetic community rescues Astragalus mongholicus from root rot disease by activating plant-induced systemic resistance. Microbiome 2021, 9, 217. [Google Scholar] [CrossRef] [PubMed]
  26. Aamir, M.; Shanmugam, V.; Dubey, M.K.; Husain, F.M.; Adil, M.; Ansari, W.A.; Rai, A.; Sah, P. Transcriptomic characterization of Trichoderma harzianum T34 primed tomato plants: Assessment of biocontrol agent induced host specific gene expression and plant growth promotion. BMC Plant Biol. 2023, 23, 552. [Google Scholar] [CrossRef]
  27. Pradhan, D.A.; Makandar, R. Delineating host responses induced by Trichoderma in castor through comparative transcriptome analysis. Rhizosphere 2023, 27, 100745–100761. [Google Scholar] [CrossRef]
  28. Niu, J.P.; Zhao, J.; Guo, Q.; Zhang, H.Y.; Yue, A.Q.; Zhao, J.Z.; Yin, C.C.; Wang, M.; Du, W.J. WGCNA reveals hub genes and key gene regulatory pathways of the response of soybean to infection by Soybean mosaic virus. Genes 2024, 15, 566. [Google Scholar] [CrossRef]
  29. Niu, J.P.; Yan, X.; Shi, Z.Y.; Song, S.J.; Liu, J.J.; Du, J.; Yuan, Y.X.; Shi, J.; Liang, J.P. Isolation and identification of pathogens causing Astragalus mongholicus root rot and analysis of its inhibition effects. J. Shanxi Agric. Sci. 2023, 51, 690–695. [Google Scholar]
  30. Grabherr, M.G.; Haas, B.J.; Yassour, M.; Levin, J.Z.; Thompson, D.A.; Amit, I.; Adiconis, X.; Fan, L.; Raychowdhury, R.; Zeng, Q.D.; et al. Full-length transcriptome assembly from RNA-Seq data without a reference genome. Nat. Biotechnol. 2011, 29, 644–652. [Google Scholar] [CrossRef]
  31. Smith-Unna, R.; Boursnell, C.; Patro, R.; Hibberd, J.M.; Kelly, S. TransRate: Reference-free quality assessment of de novo transcriptome assemblies. Genome Res. 2016, 26, 1134–1144. [Google Scholar] [CrossRef]
  32. Deng, Y.Y.; Li, J.Q.; Wu, S.F.; Zhu, Y.P.; Chen, Y.W.; He, F.C. Integrated nr database in protein annotation system and its localization. Comput. Eng. 2006, 32, 71–74. [Google Scholar]
  33. Ashburner, M.; Ball, C.A.; Blake, J.A.; Botstein, D.; Butler, H.; Cherry, J.M.; Davis, A.P.; Dolinski, K.; Dwight, S.S.; Eppig, J.T. Gene ontology: Tool for the unification of biology. Nat. Genet. 2000, 25, 25–29. [Google Scholar] [CrossRef] [PubMed]
  34. Kanehisa, M.; Goto, S.; Kawashima, S.; Okuno, Y.; Hattori, M. The KEGG resource for deciphering the genome. Nucleic Acids Res. 2004, 32, D277–D280. [Google Scholar] [CrossRef]
  35. Tatusov, R.L.; Galperin, M.Y.; Natale, D.A.; Koonin, E.V. The COG database: A tool for genome-scale analysis of protein functions and evolution. Nucleic Acids Res. 2000, 28, 33–36. [Google Scholar] [CrossRef] [PubMed]
  36. Apweiler, R.; Bairoch, A.; Wu, C.H.; Barker, W.C.; Boeckmann, B.; Ferro, S.; Gasteiger, E.; Huang, H.; Lopez, R.; Magrane, M. UniProt: The universal protein knowledgebase. Nucleic Acids Res. 2004, 32, 115–119. [Google Scholar] [CrossRef]
  37. Finn, R.D.; Bateman, A.; Clements, J.; Coggill, P.; Eberhardt, R.Y.; Eddy, S.R.; Heger, A.; Hetherington, K.; Holm, L.; Mistry, J.; et al. Pfam: The protein families database. Nucleic Acids Res. 2014, 42, D222–D230. [Google Scholar] [CrossRef]
  38. Li, B.; Dewey, C.N. RSEM: Accurate transcript quantification from RNA-Seq data with or without a reference genome. BMC Bioinform. 2011, 12, 323. [Google Scholar] [CrossRef]
  39. Love, M.I.; Huber, W.; Anders, S. Moderated estimation of fold change and dispersion for RNA-seq data with DESeq2. Genome Biol. 2014, 15, 550. [Google Scholar] [CrossRef]
  40. Ren, Y.; Yu, G.; Shi, C.P.; Liu, L.M.; Guo, Q.; Han, C.; Zhang, D.; Zhang, L.; Liu, B.X.; Gao, H.; et al. Majorbio Cloud: A one-stop, comprehensive bioinformatic platform for multiomics analyses. IMeta 2022, 1, e12. [Google Scholar] [CrossRef]
  41. Xie, C.; Mao, X.Z.; Huang, J.J.; Ding, Y.; Wu, J.M.; Dong, S.; Kong, L.; Gao, G.; Li, C.Y.; Wei, L.P. KOBAS 2.0: A web server for annotation and identification of enriched pathways and diseases. Nucleic Acids Res. 2011, 39, 316–322. [Google Scholar] [CrossRef]
  42. Langfelder, P.; Horvath, S. WGCNA: An R package for weighted correlation network analysis. BMC Bioinform. 2008, 9, 559. [Google Scholar] [CrossRef] [PubMed]
  43. Luo, C.B.; Li, Y.Q.; Liao, H.; Yang, Y.J. De novo transcriptome assembly of the bamboo snout beetle Cyrtotrachelus buqueti reveals ability to degrade lignocellulose of bamboo feedstock. Biotechnol. Biofuels 2018, 11, 292. [Google Scholar] [CrossRef] [PubMed]
  44. Shannon, P.; Markiel, A.; Ozier, O.; Baliga, N.S.; Wang, J.T.; Ramage, D.; Amin, N.; Schwikowski, B.; Ideker, T. Cytoscape: A software environment for integrated models of biomolecular interaction networks. Genome Res. 2003, 13, 2498–2504. [Google Scholar] [CrossRef]
  45. Liang, J.P.; Li, W.Q.; Jia, X.Y.; Zhang, Y.; Zhao, J.P. Transcriptome sequencing and characterization of Astragalus mongholicus var. mongholicus root reveals key genes involved in flavonoids biosynthesis. Genes Genom. 2020, 42, 901–914. [Google Scholar] [CrossRef] [PubMed]
  46. Dodds, P.N.; Rathjen, J.P. Plant immunity: Towards an integrated view of plant–pathogen interactions. Nat. Rev. Genet. 2010, 11, 539–548. [Google Scholar] [CrossRef] [PubMed]
  47. Treutter, D. Significance of flavonoids in plant resistance: A review. Environ. Chem. Lett. 2006, 4, 147–157. [Google Scholar] [CrossRef]
  48. Wang, L.J.; Li, C.F.; Luo, K.M. Biosynthesis and metabolic engineering of isoflavonoids in model plants and crops: A review. Front. Plant Sci. 2024, 15, 1384091. [Google Scholar] [CrossRef]
  49. Yadav, V.; Wang, Z.Y.; Wei, C.H.; Amo, A.; Ahmed, B.; Yang, X.Z.; Zhang, X. Phenylpropanoid pathway engineering: An emerging approach towards plant defense. Pathogens 2020, 9, 312. [Google Scholar] [CrossRef]
  50. Cristina, M.S.; Petersen, M.; Mundy, J. Mitogen-activated protein kinase signaling in plants. Annu. Rev. Plant Biol. 2010, 61, 621–649. [Google Scholar] [CrossRef]
  51. Ding, L.N.; Li, Y.T.; Wu, Y.Z.; Li, T.; Geng, R.; Cao, J.; Zhang, W.; Tan, X.L. Plant disease resistance-related signaling pathways: Recent progress and future prospects. Int. J. Mol. Sci. 2022, 23, 16200. [Google Scholar] [CrossRef]
  52. Chen, S.C.; Zhao, H.J.; Wang, Z.H.; Zheng, C.X.; Zhao, P.Y.; Guan, Z.H.; Qin, H.Y.; Liu, A.R.; Lin, X.M.; Ahammed, G.J. Trichoderma harzianum-induced resistance against Fusarium oxysporum involves regulation of nuclear DNA content, cell viability and cell cycle-related genes expression in cucumber roots. Eur. J. Plant Pathol. 2017, 147, 43–53. [Google Scholar] [CrossRef]
  53. Wang, Q.; Zhao, X.B.; Sun, Q.X.; Mou, Y.F.; Wang, J.; Yan, C.X.; Yuan, C.L.; Li, C.J.; Shan, S.H. Genome-wide identification of the LRR-RLK gene family in peanut and functional characterization of AhLRR-RLK265 in salt and drought stresses. Int. J. Biol. Macromol. 2024, 254, 127829. [Google Scholar] [CrossRef] [PubMed]
  54. Yan, Q.; Cui, X.X.; Lin, S.; Gan, S.P.; Xing, H.; Dou, D.L. GmCYP82A3, a soybean cytochrome P450 family gene involved in the jasmonic acid and ethylene signaling pathway, enhances plant resistance to biotic and abiotic stresses. PLoS ONE 2016, 11, e0162253. [Google Scholar] [CrossRef]
  55. Aldon, D.; Mbengue, M.; Mazars, C.; Galaud, J.P. Calcium signalling in plant biotic interactions. Int. J. Mol. Sci. 2018, 19, 665. [Google Scholar] [CrossRef] [PubMed]
  56. Costa, A.; Navazio, L.; Szabo, I. The contribution of organelles to plant intracellular calcium signalling. J. Exp. Bot. 2018, 69, 4175–4193. [Google Scholar] [CrossRef] [PubMed]
  57. Navazio, L.; Baldan, B.; Moscatiello, R.; Zuppini, A.; Woo, S.L.; Mariani, P.; Lorito, M. Calcium-mediated perception and defense responses activated in plant cells by metabolite mixtures secreted by the biocontrol fungus Trichoderma atroviride. BMC Plant Biol. 2007, 7, 41. [Google Scholar] [CrossRef]
  58. Moscatiello, R.; Sello, S.; Ruocco, M.; Barbulova, A.; Cortese, E.; Nigris, S.; Baldan, B.; Chiurazzi, M.; Mariani, P.; Lorito, M.; et al. The hydrophobin HYTLO1 secreted by the biocontrol fungus Trichoderma longibrachiatum triggers a NAADP-mediated calcium signalling pathway in Lotus japonicus. Int. J. Mol. Sci. 2018, 19, 2596. [Google Scholar] [CrossRef]
  59. Vaghela, B.; Vashi, R.; Rajput, K.; Joshi, R. Plant chitinases and their role in plant defense: A comprehensive review. Enzym. Microb. Technol. 2022, 159, 110055. [Google Scholar] [CrossRef]
  60. Gallou, A.; Cranenbrouck, S.; Declerck, S. Trichoderma harzianum elicits defence response genes in roots of potato plantlets challenged by Rhizoctonia solani. Eur. J. Plant Pathol. 2009, 124, 219–230. [Google Scholar] [CrossRef]
  61. Morán-Diez, E.; Rubio, B.; Domínguez, S.; Hermosa, R.; Monte, E.; Nicolás, C. Transcriptomic response of Arabidopsis thaliana after 24 h incubation with the biocontrol fungus Trichoderma harzianum. J. Plant Physiol. 2012, 169, 614–620. [Google Scholar] [CrossRef]
  62. Yang, D.; Chen, T.; Wu, Y.S.; Tang, H.Q.; Yu, J.Y.; Dai, X.Q.; Zheng, Y.X.; Wan, X.R.; Yang, Y.; Tan, X.D. Genome-wide analysis of the peanut CaM/CML gene family reveals that the AhCML69 gene is associated with resistance to Ralstonia solanacearum. BMC Genom. 2024, 25, 200–236. [Google Scholar] [CrossRef] [PubMed]
  63. Li, Q.Y.; Shao, J.; Luo, M.Y.; Chen, D.S.; Tang, D.Z.; Shi, H. Brassionsteroid-signaling kinase1 associates with and is required for cysteine protease response to dehydration 19-mediated disease resistance in Arabidopsis. Plant Sci. 2024, 342, 112033. [Google Scholar] [CrossRef] [PubMed]
  64. Wu, Y.; Zhang, D.; Chu, J.Y.; Boyle, P.; Wang, Y.; Brindle, I.D.; Luca, V.D.; Despres, C. The Arabidopsis NPR1 protein is a receptor for the plant defense hormone salicylic acid. Cell Rep. 2012, 1, 639–647. [Google Scholar] [CrossRef] [PubMed]
  65. Kinkema, M.; Fan, W.H.; Dong, X.N. Nuclear localization of NPR1 is required for activation of PR gene expression. Plant Cell 2000, 20, 2339–2350. [Google Scholar] [CrossRef]
  66. Li, Y.Q.; Liu, Y.A.; Jin, L.B.; Peng, R.Y. Crosstalk between Ca2+ and other regulators assists plants in responding to abiotic stress. Plants 2022, 11, 1351. [Google Scholar] [CrossRef]
  67. Marcec, M.J.; Tanaka, K. Crosstalk between calcium and ROS signaling during flg22-triggered immune response in Arabidopsis leaves. Plants 2022, 11, 14. [Google Scholar] [CrossRef]
  68. Otulak-Kozieł, K.; Kozieł, E.; Bujarski, J.J.; Frankowska-Łukawska, J.; Torres, M.A. Respiratory burst oxidase homologs RBOHD and RBOHF as key modulating components of response in turnip mosaic virus—Arabidopsis thaliana (L.) Heyhn System. Int. J. Mol. Sci. 2020, 21, 8510. [Google Scholar] [CrossRef]
  69. Sehrish, A.; Wei, Y.; Yuan, Y.; Khan, M.T.; Qin, L.F.; Powell, C.A.; Chen, B.S.; Zhang, M.Q. Gene expression profiling of reactive oxygen species (ROS) and antioxidant defense system following Sugarcane mosaic virus (SCMV) infection. BMC Plant Biol. 2020, 20, 532. [Google Scholar]
  70. Garg, N.; Manchanda, G. ROS generation in plants: Boon or bane? Plant Biosyst. 2009, 143, 81–96. [Google Scholar] [CrossRef]
  71. Huang, J.L.; Gu, M.; Lai, Z.B.; Fan, B.F.; Shi, K.; Zhou, Y.H.; Yu, J.Q.; Chen, Z.X. Functional analysis of the Arabidopsis PAL gene family in plant growth, development, and response to environmental stress. Plant Physiol. 2010, 153, 1526–1538. [Google Scholar] [CrossRef]
  72. Dutra, J.M.; Espitia, P.J.P.; Batista, R.A. Formononetin: Biological effects and uses—A review. Food Chem. 2021, 359, 129975. [Google Scholar] [CrossRef] [PubMed]
  73. Hu, K.X.; Shi, X.C.; Xu, D.; Laborda, P.; Wu, G.C.; Liu, F.Q.; Laborda, P.; Wang, S.Y. Antibacterial mechanism of biochanin A and its efficacy for the control of Xanthomonas axonopodis pv. glycines in soybean. Pest Manag. Sci. 2021, 77, 1668–1673. [Google Scholar] [CrossRef]
  74. Weidenbörner, M.; Hindorf, H.; Jha, H.C.; Tsotsonos, P.; Egge, H. Antifungal activity of isoflavonoids in different reduced stages on Rhizoctonia solani and Sclerotium rolfsii. Phytochemistry 1990, 29, 801–803. [Google Scholar] [CrossRef]
  75. Cho, S.M.; Shin, S.H.; Kim, K.S.; Kim, Y.C.; Eun, M.Y.; Cho, B.H. Enhanced expression of a gene encoding a nucleoside diphosphate kinase 1 (OsNDPK1) in rice plants upon infection with bacterial pathogens. Mol. Cells 2004, 18, 390–395. [Google Scholar] [CrossRef]
  76. Gan, P.F.; Tang, C.L.; Lu, Y.; Ren, C.R.; Nasab, H.R.; Kun, X.F.; Wang, X.D.; Li, L.Z.; Kang, Z.S.; Wang, X.J.; et al. Quantitative phosphoproteomics reveals molecular pathway network in wheat resistance to stripe rust. Stress Biol. 2024, 4, 32–47. [Google Scholar] [CrossRef]
  77. Han, L.; Li, G.J.; Yang, K.Y.; Mao, G.; Wang, R.; Liu, Y.; Zhang, S. Mitogen-activated protein kinase 3 and 6 regulate botrytis cinerea-induced ethylene production in Arabidopsis. Plant J. 2010, 64, 114–127. [Google Scholar] [CrossRef] [PubMed]
  78. Coppola, M.; Diretto, G.; Digilio, M.C.; Woo, S.L.; Giuliano, G.; Molisso, D.; Pennacchio, F.; Lorito, M.; Rao, R. Transcriptome and metabolome reprogramming in tomato plants by Trichoderma harzianum strain T22 primes and enhances defense responses against aphids. Front. Physiol. 2019, 10, 745. [Google Scholar] [CrossRef]
  79. Li, T.; Xu, Y.X.; Zhang, L.C.; Ji, Y.L.; Tan, D.M.; Yuan, H.; Wang, A.D. The jasmonate-activated transcription factor MdMYC2 regulates ethylene response factor and ethylene biosynthetic genes to promote ethylene biosynthesis during apple fruit ripening. Plant Cell 2017, 29, 1316–1334. [Google Scholar] [CrossRef]
  80. Oñate-Sánchez, L.; Anderson, J.P.; Young, J.; Singh, K.B. AtERF14, a member of the ERF family of transcription factors, plays a nonredundant role in plant defense. Plant Physiol. 2007, 143, 400–409. [Google Scholar] [CrossRef]
  81. Song, C.; Cao, Y.P.; Dai, J.; Li, G.H.; Manzoor, M.A.; Chen, C.W.; Deng, H. The multifaceted roles of MYC2 in plants: Toward transcriptional reprogramming and stress tolerance by jasmonate signaling. Front. Plant Sci. 2022, 13, 868874. [Google Scholar] [CrossRef]
  82. Wu, F.M.; Deng, L.; Zhai, Q.Z.; Zhao, J.H.; Chen, Q.; Li, C.Y. Mediator subunit MED25 couples alternative splicing of JAZ genes with fine-tuning of jasmonate signaling. Plant Cell 2020, 32, 429–448. [Google Scholar] [CrossRef] [PubMed]
  83. Plett, J.M.; Daguerre, Y.; Wittulsky, S.; Vayssieres, A.; Deveau, A.; Melton, S.J.; Kohler, A.; Morrell-Falvey, J.L.; Brun, A.; Veneault-Fourrey, C.; et al. Effector MiSSP7 of the mutualistic fungus Laccaria bicolor stabilizes the Populus JAZ6 protein and represses jasmonic acid (JA) responsive genes. Proc. Natl. Acad. Sci. USA 2014, 111, 8299–8304. [Google Scholar] [CrossRef] [PubMed]
  84. Yu, W.J.; Mijiti, G.; Huang, Y.; Fan, H.J.; Wang, Y.C.; Liu, Z.H. Functional analysis of eliciting plant response protein Epl1-Tas from Trichoderma asperellum ACCC30536. Sci. Rep. 2018, 8, 7974. [Google Scholar] [CrossRef] [PubMed]
  85. Pozo, M.J.; Van, D.E.S.; Van, L.L.C.; Pieterse, C.M. Transcription factor MYC2 is involved in priming for enhanced defense during rhizobacteria-induced systemic resistance in Arabidopsis thaliana. New Phytol. 2008, 180, 511–523. [Google Scholar] [CrossRef]
  86. Ayash, M.; Abukhalaf, M.; Thieme, D.; Proksch, C.; Heilmann, M.; Schattat, M.H.; Hoehenwarter, W. LC-MS based draft map of the Arabidopsis thaliana nuclear proteome and protein import in pattern triggered immunity. Front. Plant Sci. 2021, 12, 744103. [Google Scholar] [CrossRef]
  87. Fakih, Z.; Plourde, M.B.; Germain, H. Differential participation of plant ribosomal proteins from the small ribosomal subunit in protein translation under stress. Biomolecules 2023, 13, 1160. [Google Scholar] [CrossRef]
  88. Carroll, A.J. The Arabidopsis cytosolic ribosomal proteome: From form to function. Front. Plant Sci. 2013, 4, 32. [Google Scholar] [CrossRef]
  89. Rajamäki, M.L.; Xi, D.H.; Sikorskaite-Gudziuniene, S.; Valkonen, J.P.T.; Whitham, S.A. Differential requirement of the ribosomal protein S6 and ribosomal protein S6 kinase for plant-virus accumulation and interaction of S6 kinase with potyviral VPg. Mol. Plant-Microbe Interact. 2017, 30, 374–384. [Google Scholar] [CrossRef]
  90. Yang, C.; Zhang, C.; Dittman, J.D.; Whitham, S.A. Differential requirement of ribosomal protein S6 by plant RNA viruses with different translation initiation strategies. Virology 2009, 390, 163–173. [Google Scholar] [CrossRef]
  91. Solano, C.M.T.; Adame-García, J.; Gregorio-Jorge, J.; Jiménez-Jacinto, V.; Vega-Alvarado, L.; Iglesias-Andreu, L.; Escobar-Hernández, E.E.; Luna-Rodríguez, M. Increase in ribosomal proteins activity: Translational reprogramming in Vanilla planifolia Jacks., against Fusarium infection. BioRxiv 2019. [Google Scholar] [CrossRef]
  92. Al-Whaibi, M.H. Plant heat-shock proteins: A mini review. J. King Saud Univ. Sci. 2011, 23, 139–150. [Google Scholar] [CrossRef]
  93. Roatti, B.; Michele, P.; Cesare, G.; Ilaria, P. Abiotic stresses affect Trichoderma harzianum T39-induced resistance to downy mildew in grapevine. Phytopathology 2013, 103, 1227–1234. [Google Scholar] [CrossRef] [PubMed]
  94. Pani, S.; Kumar, A.; Sharma, A. Trichoderma harzianum: An overview. Bull. Environ. Pharmacol. Life Sci. 2021, 10, 32–39. [Google Scholar]
Figure 1. Response of A. mongholicus to F. solani under T. harzianum treatment. (A) Plant phenotype. (B) Plant wilting rate. F, plant infected with F. solani; T + F, plant infected with F. solani after T. harzianum treatment for 48 h. The error bars represent ±SD values, and different letters indicate significant differences between the two columns (p < 0.05).
Genes 15 01180 g001
Figure 2. Volcano diagram and Venn diagram of differentially expressed genes (DEGs) between pairs of samples (i.e., T + F_0 h vs. F_0 h, T + F_24 h vs. F_24 h, and T + F_48 h vs. F_48 h). The x-axis shows the fold change in gene expression between samples, and the y-axis represents the statistical test result for the difference in gene expression. The blue dots represent the significantly upregulated DEGs, whereas the green dots represent the significantly downregulated DEGs. The orange dots represent the DEGs that were not significantly differentially expressed.
Genes 15 01180 g002
Figure 3. KEGG enrichment analysis of the 6361 DEGs. The x-axis indicates the ratio of the number of DEGs in the pathway to all DEGs. The y-axis indicates the KEGG pathway.
Genes 15 01180 g003
Figure 4. Plant–pathogen interaction pathway information for the DEGs. (A) Ca2+ signaling pathway-related DEGs; (B) other key DEGs. The log2FPKM values are indicated by colors. Yellow, upregulated; blue, downregulated; black, no significant difference in expression in the comparison group.
Genes 15 01180 g004
Figure 5. Determination of H2O2 content in the T + F and F treatments. Error bars represent ±SD values, and different letters indicate significant differences between the two columns (p < 0.05).
Genes 15 01180 g005
Figure 6. Formononetin and biochanin A biosynthesis pathway information for the DEGs. The log2FPKM values are indicated by colors. Yellow, upregulated; blue, downregulated; black, no significant difference in expression in the comparison group at the same time point.
Genes 15 01180 g006
Figure 7. Antifungal activity of formononetin and biochanin A against F. solani in vitro. (A) Colony diameter after formononetin treatment. (B) Mycelial growth inhibition rate after formononetin treatment. (C) Colony diameter after biochanin A treatment. (D) Mycelial growth inhibition rate after biochanin A treatment. The error bars represent ±SD values, and different letters indicate significant differences between the two columns (p < 0.05).
Genes 15 01180 g007
Figure 8. MAPK signaling pathway and plant hormone signal transduction pathway information of the DEGs. (A) DEGs in the MAPK signaling pathway; (B) DEGs in the plant hormone signal transduction pathway. The log2FPKM values are colored. Yellow, upregulated; blue, downregulated; black, no significant difference in expression in the comparison group at the same time point.
Genes 15 01180 g008
Figure 9. Soft threshold power (β value) determination by WGCNA and module detection. (A) Soft threshold determination. The number corresponding to the green line is the most appropriate β value. (B) Gene-cluster dendrogram and module colors. (C) Correlations between modules and the resistance trait. The correlation coefficients are shown above, and the p values are shown below.
Genes 15 01180 g009
Figure 10. Coexpression networks of the 58 connected hub genes in the pink module related to the T + F treatment. The red circle represents the core hub gene TRINITY_DN48668_c0_g2, and the yellow circles represent the coexpressed hub genes TRINITY_DN43430_c0_g1, TRINITY_DN11766_c0_g1, TRINITY_DN8962_c0_g1, TRINITY_DN12696_c0_g1, and TRINITY_DN105680_c0_g1.
Genes 15 01180 g010
Figure 11. Relative expression analysis of hub genes and coexpressed genes in the T + F and F treatments. The error bars represent ±SD values, and different letters indicate significant differences between the two columns (p < 0.05).
Genes 15 01180 g011
Figure 12. Relative expression analysis of the hub genes under SA, ETH, and MeJA induction. The error bars represent ±SD values, and different letters indicate significant differences between the two columns (p < 0.05).
Genes 15 01180 g012
Disclaimer/Publisher’s Note: The statements, opinions and data contained in all publications are solely those of the individual author(s) and contributor(s) and not of MDPI and/or the editor(s). MDPI and/or the editor(s) disclaim responsibility for any injury to people or property resulting from any ideas, methods, instructions or products referred to in the content.

