Article

The Influence of Tornado Activity, Impact, Memory, and Sentiment on Tornado Perception Accuracy among College Students

1
Department of Geography, University of Alabama, Tuscaloosa, AL 35487, USA
2
Department of Geography, University of Tennessee, Knoxville, TN 37996, USA
3
Center for Advanced Public Safety, University of Alabama, Tuscaloosa, AL 35487, USA
*
Author to whom correspondence should be addressed.
Atmosphere 2019, 10(12), 732; https://doi.org/10.3390/atmos10120732
Submission received: 14 October 2019 / Revised: 19 November 2019 / Accepted: 20 November 2019 / Published: 22 November 2019
(This article belongs to the Special Issue Atmospheric Hazards)

Abstract

:
A survey consisting of open-ended and closed responses was administered at three universities in the eastern USA. The home counties of survey participants represented climatological tornado risks spanning from rarely impacted to frequently impacted. The first objective of this research was to classify climatological tornado risk for each county so that analyses of tornado perception accuracy could be evaluated. Perception accuracy was defined as the difference between what each participant perceived minus what actually happened. A manual classification scheme was created that uses the Storm Prediction Center’s Convective Outlook framework as county climatological risk categories. Participants from high-risk counties statistically significantly overestimated the numbers of violent tornadoes compared to participants from every risk category but moderate. Furthermore, participants from high-risk counties had significantly greater tornado impacts, thus validating the classification of high-risk. Participants from high, moderate, and slight-risk counties significantly overestimated the number of strong tornadoes compared to participants from enhanced-risk counties. There appeared to be no relationships between tornado memory and tornado sentiment with tornado perception accuracy. Possible explanations for the overestimation of the numbers of violent tornadoes in high-risk counties are discussed.

1. Introduction

Destructive tornado outbreaks often cause post-traumatic stress disorder (PTSD) and lasting negative memories, especially among children and adolescents [1,2,3]. PTSD and other traumatic symptoms after tornadoes can be mitigated by narrative construction from sensory data [4] and dispositional optimism in the aftermath [5]. Despite attempts at mitigating the psychological impacts of destructive tornadoes, these memories and past experiences with impacts or near impacts linger in the minds of those affected when making safety decisions about tornadoes. It is unknown to what extent past tornado activity, direct or indirect experiences, and memories influence the perception of climatological tornado risk.
The risk perception literature has an abundance of sources on perception of atmospheric hazard events. There is a smaller collection of research devoted to quantifying the differences in the numerical perception of risk for a meteorological or climatological hazard compared to the actual numerical meteorological or climatological risk. This difference between the perceived and actual meteorological or climatological risk is referred to as perception accuracy by the authors.
Perception accuracy has been studied in hurricanes with multiple research objectives. It was first mentioned as a problem for hurricane evacuees who may return home to find damage that was much greater or less than what was forecast to occur [6]. Perception accuracy was evaluated in real time using forecast and actual landfall locations [7], and hurricane hazards at landfall [8,9]. It has also been further evaluated in the role of evacuation decision making using hypothetical scenarios [10,11], and also co-evaluated with optimism bias and hurricane track forecast consistency [12].
Perception accuracy has similarly been researched for tornadoes. In the closest direct comparison with this research, Ellis et al. [13] examined the climatological tornado risk of Tennessee residents for three regions of the state with different tornado risks. Most Tennessee residents underestimated their climatological tornado risk, and this number increased to 80 percent when using a model that accounted for likely missed tornadoes. They found that people with past tornado experience were more likely to accurately estimate or overestimate their actual tornado risk. This is believed to be the only research that has specifically analyzed perception accuracy for tornado frequency, but there are many other factors that combine to influence risk perception for tornadoes. In this research, we concentrate on the impacts of tornado activity, past impacts, memory of past impacts, and tornado safety sentiments on perception accuracy. All of these factors combine with other external stimuli to shape overall perception. Some of these other factors and stimuli are briefly discussed in the following subsection.

Background

An individual’s perception of risk may contribute to the series of actions they take during a tornado event, from receipt to response [14]. Risk perception can be defined multiple ways, including a strict focus on hazard frequency, which we refer to as climatological risk [13], or as a broad concept that includes vulnerability and the potential for the hazard to cause harm [15]. Both aspects of risk, perceived frequency and vulnerability, are important for understanding human behavior surrounding atmospheric hazards, such as tornadoes. Schultz et al. [16] found that survey participants who believed a tornado was likely to occur were more likely to plan for one. Mason et al. [17] found that perceived climatological tornado risk, along with prior experience with tornadoes, was positively associated with the likelihood of receiving a tornado warning at night; meaning if someone perceived a greater hazard frequency they made more effort to receive warnings. Both of these results were based on the frequency aspect of risk. After receiving the tornado warning, Brotzge and Donner [14] explain that personalization of risk is what leads to someone determining if protective action is necessary and feasible. This risk personalization requires an individual to feel personally threatened during an event [14]. Miran et al. [18] showed that proximity to a tornado was more likely to affect actions taken during an event than one’s prior experience, highlighting the importance of feeling immediately threatened. Outside of tornado literature specifically, overall heightened risk perception has been shown to lead to improved preparation for and/or response to various natural hazards [19,20,21,22]. Outside of risk perception, the number of weather information sources [18] and the ways these sources visualize information [23,24,25] are also important factors contributing to warning response.
The factors contributing to one’s perception of risk are numerous and complex. Experiencing a hazard is usually positively associated with a person’s perception of the frequency or likelihood of an event [13,22], and may affect their feelings of vulnerability to harm [26]. Tangible experiences, such as property damage and injury, and intangible ones, including emotional impact and personal distress, may all play a role [27]. However, if a hazard occurred and did not cause any negative consequences, it may lessen one’s perception of risk [28]. Local geography also affects risk perception; for example, people may feel protected from tornadoes because of nearby hills or rivers [29,30]. Socioeconomic characteristics, including gender, age, race, ethnicity, or education, were significantly related to perception of natural hazard risk in some studies, but not others, and their role continues to be debated [28]. Specific to tornadoes, for example, Senkbeil et al. [31] found that risk perception and preparedness varied by race/ethnicity, while Ellis et al. [30] found that socioeconomic characteristics had no notable influence on climatological risk perception.
Brotzge and Donner [14] found that public response to a warning includes a series of actions from reception of the warning, to understanding, belief, confirmation, personalization of risk, and determining if action is necessary and feasible. This means a person takes many steps between receiving a warning and acting, if they choose to do so. Walters et al. [32] found that survey participants could be grouped by the sets of actions they take, with group membership being determined in part by their prior experience with tornadoes. Some survey participants were in the Tech User group, meaning they were likely to gather information from TV, radio, the internet, and/or a cell phone application. Meanwhile, other groups termed “non-reactors” or “passive actors” were not likely to seek additional information or safety [32].
Some researchers have used college courses and campuses as a mechanism for gathering information from large groups of primarily young adults about their perceptions and behaviors surrounding natural hazards [33,34,35,36]. College students were chosen as the focus of this research primarily due to that demographic being the future of tornado warning and watch communication improvement efforts. Shifts in tornado watch and warning communication via social media and multiple modes of information are now normal and thus require evolving emphasis for evaluating weather communication. Previous results from Ellis et al. [13] had an older average participant age and likely fewer social media users during tornado events. In psychological studies on memory, older age demographics did not accurately recall and recognize negative images as accurately as younger demographics, which was believed to be due to a greater investment in emotional regulation with age [37]. In related research older adults were more likely to recall the gist of when an event occurred but less likely to recall why it occurred. Women were more likely to remember time and perceptual details than men [38]. Therefore, our sample in this research was young and evenly balanced between males and females.
The specific objectives of this research are as follows:
  • To develop a methodology to classify counties according to climatological tornado risk to provide a foundation for other analyses;
  • To evaluate perception accuracy;
    • How does strong and violent tornado activity affect perception accuracy?
    • How do tornado impact and tornado memory affect perception accuracy?
  • What are the relationships between tornado sentiment and perception accuracy?
The structure of the Methods and Results sections mirrors the order of the objectives listed here and these sections are followed by a brief conclusion.

2. Methods

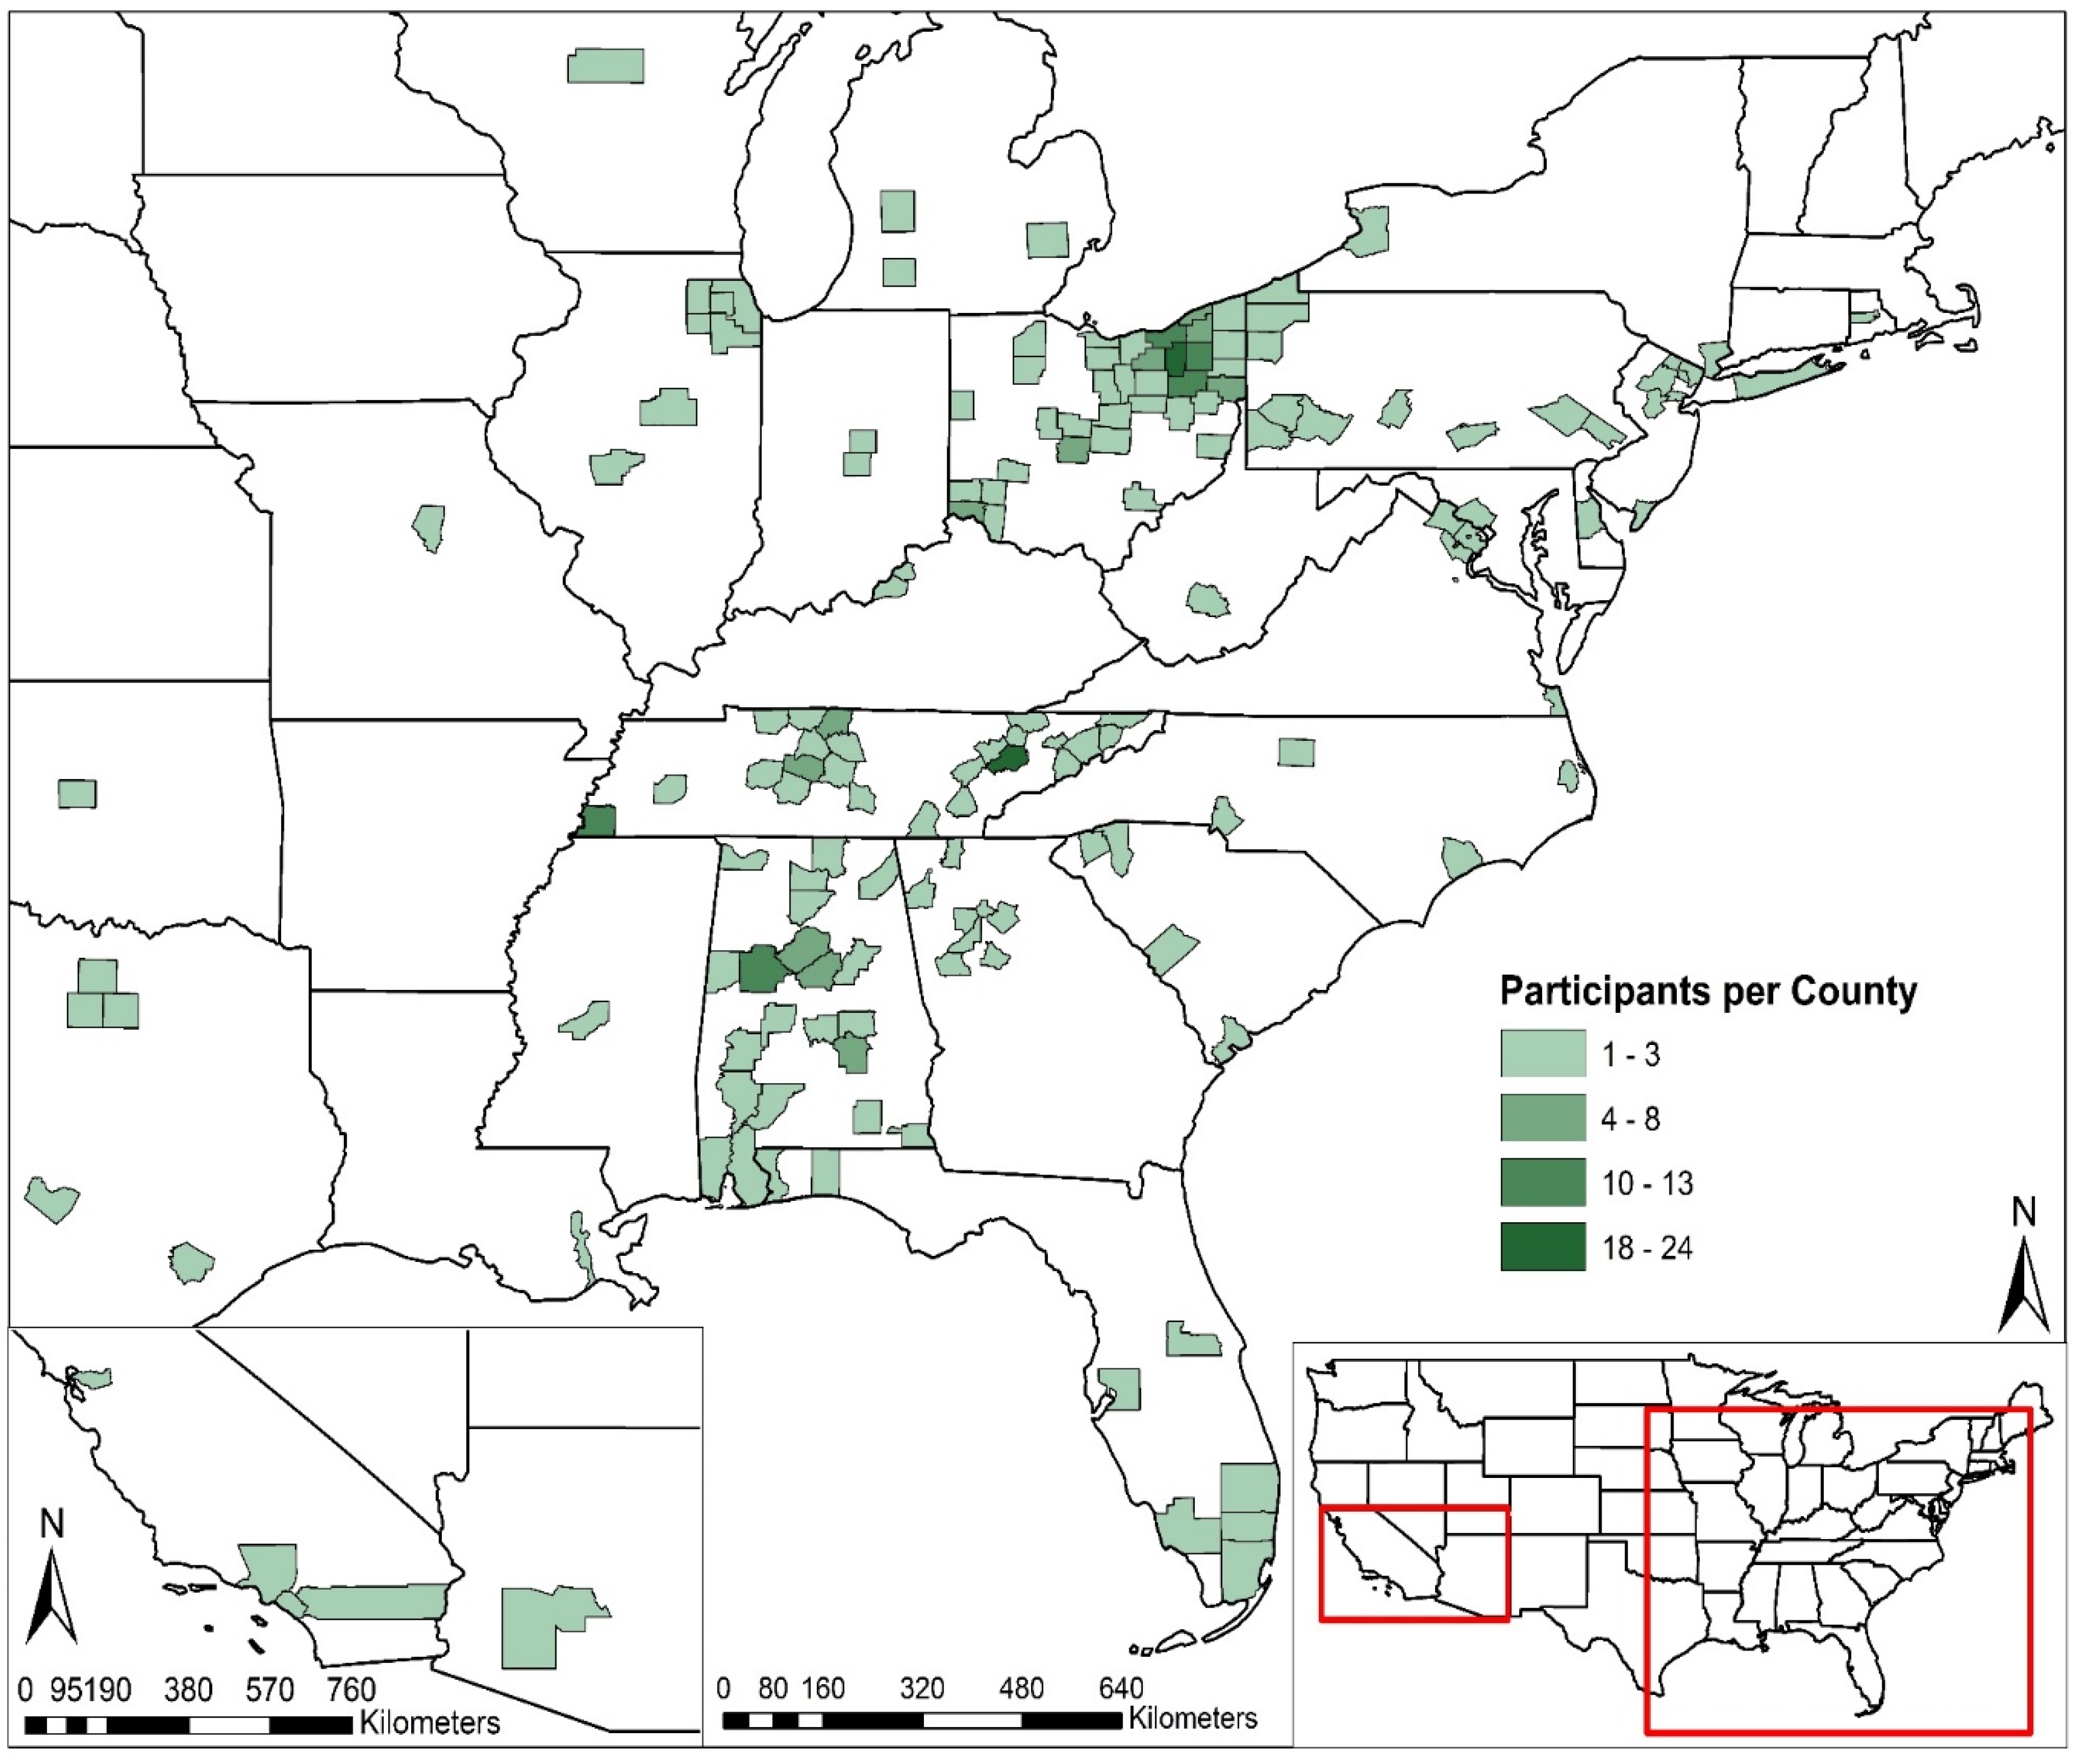
2.1. Data Collection and Survey Information

A survey consisting of open-ended and closed responses was administered in person at three universities in the eastern United States where tornadoes occur. At each university, students completed the surveys individually at their seats in large lecture halls in sections of introductory Geography classes. Questions 1–4 (Table 1) were asked to determine if our sample had equal gender representation and that each participant had lived in that county at least 5 years. Surveys were discarded if a participant had not lived in any one county for more than 5 years. Questions 5 and 6 were devoted to actions taken during tornado watches and warnings. Questions 7–14 were used for the analyses in this research. Instructions were given to provide best estimates for answers to Questions 9 and 10. Despite these instructions, some students did not comply with that request. Additionally, some students only partially completed the survey resulting in uneven response numbers for each question.
The spatial distribution of home counties of participants from all three institutions spans much of the eastern United States with a few western counties in Arizona and California (Figure 1). A total of 161 counties were represented with 364 surveys at least partially completed. At the University of Alabama, questions were asked in large Geography 101 lecture classes not under the instruction of the lead author in fall 2017. These questions were asked at the start of the semester prior to any class lectures on tornadoes. The University of Alabama has an undergraduate enrollment of 33,000 with more out-of-state students than in-state. Thus, the spatial distribution for participant home counties was greater for Alabama students. A total of 131 surveys were at least partially completed at Alabama with Tuscaloosa County, Alabama having the most participants. Similarly, at the University of Tennessee, students completed the surveys in introductory Geography classes. Tennessee had more in-state students than Alabama, but also many out-of-state students. A total of 107 surveys were at least partially completed at Tennessee with Knox County Tennessee (Knoxville) having the most participants from this institution (See Figure 1). The University of Tennessee has an undergraduate enrollment of 22,800. Kent State University, located in northeastern Ohio, has an undergraduate enrollment of 23,178 students; however, compared to Alabama and Tennessee it has a larger percentage of in-state students and many students from adjacent Pennsylvania. A total of 126 surveys were at least partially completed at Kent State with Summit County, Ohio (Akron) having the most participants from this institution (See Figure 1). The tornado activity in home counties from students of the entire sample represents a cross section of counties ranging from rare to frequent tornado activities. The methods for categorizing each county by its historical tornado activity are described in the next subsection.

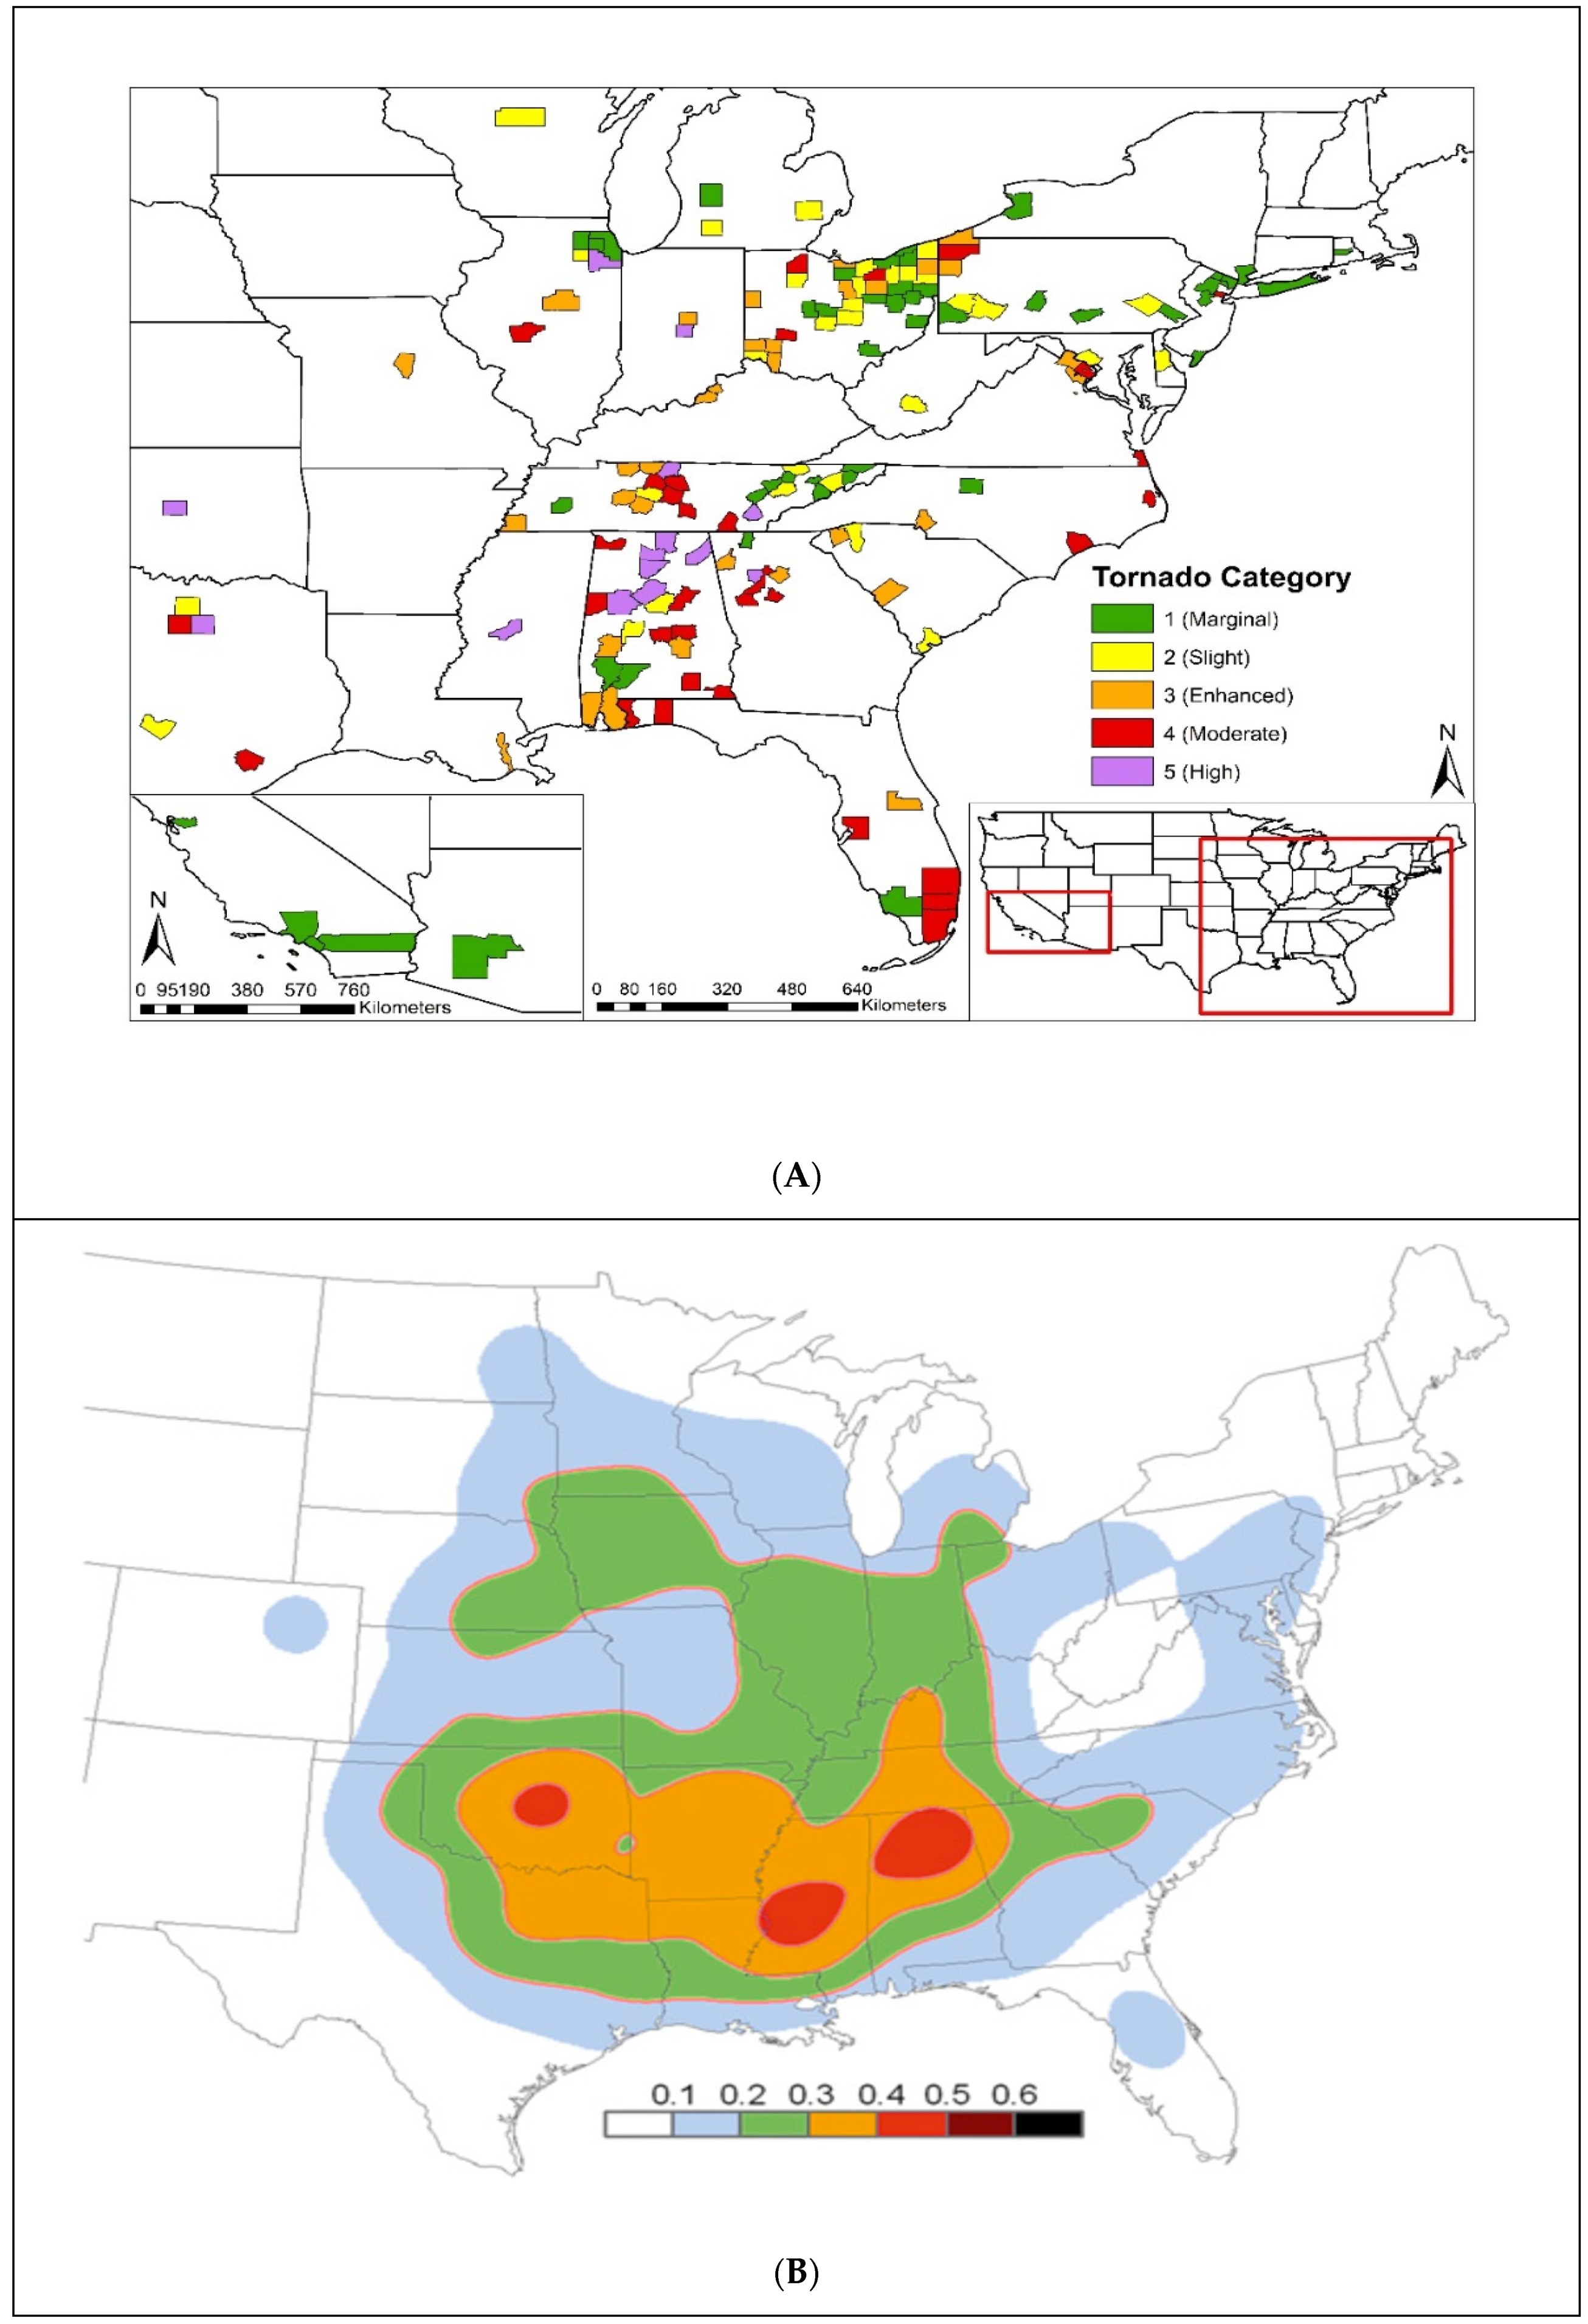
2.2. Categorizing Climatological Tornado Risk for Each County

To explore any influences that historical tornado activity may have on perceived climatological tornado risk, the first step in this research was to develop a way to classify counties according to their historical tornado activity and risk from significant tornadoes (EF2 or F2 and greater) [39]. A variety of Cluster Analysis methods were initially used to classify county tornado risk. These techniques produced uneven category membership size, and results that often contrasted with previous research [39]. For these reasons, a manual classification system was adopted based on guidance from previous research.
This manual classification formula needed to include many variables. Each of these variables is described and explained in the following paragraphs. The counties were classified in a manner similar to the categories used by the Storm Prediction Center (SPC) in Norman, Oklahoma [40]. The SPC issues convective outlooks prior to potential severe weather and tornado outbreaks using five convective outlook categories. The categories in order from greatest risk to least are: (5) High, (4) Moderate, (3) Enhanced, (2) Slight, (1) Marginal. This system used by the SPC has proven to be accurate in predicting the geographic locations of the most hazardous weather one to two days in advance. It is now being widely used by all entities of the meteorological community, thus providing a familiar framework for readers to understand the county classification.
The most obvious variable to include for historical tornado activity was the number of tornadoes that had occurred in each county since 1980. While the number of tornadoes is important, it must be normalized by land area since counties with larger land areas can potentially have more tornadoes. Data on the number of tornadoes between 1980 and 2016 in each county was taken from the Storm Events Database [41]. The year 1980 was used as the starting point due to the shift in Fujita (F) scale rating practices that occurred in the mid-1970s [42]. Prior to this shift, it was more common for tornadoes to receive artificially high F scale ratings. Furthermore, it is also possible to have multiple reports for the same tornado in Storm Data, so tornado days were used instead of the total number of tornadoes. Tornado days are the number of days in which tornadoes have occurred. Using tornado days avoids over-weighting anomalous outbreaks with potential duplicate tornado reports which can skew the perception of total tornado activity. This first metric for each county is called activity. Activity is given by:
Activity = Tornado days/county area km2 × 100.
Another major influence on the perception of tornado activity is injuries and fatalities. The second and third metrics used to classify tornado activity were the total numbers of injuries and fatalities from tornadoes since 1980. Similar to the first metric, counties with more people will have potentially more fatalities and injuries. Therefore, the second and third metrics are given by:
Adjusted fatalities = Number of fatalities/population density km2 × 1,
Adjusted injuries = Number of injuries/population density km2 × 1.
While total activity, fatalities, and injuries are important indicators of tornado activity, particularly intense, damaging, or fatal tornadoes are the events that people remember most vividly, even at ages as young as three [43,44]. Therefore, a county with more strong and violent tornadoes is likely to affect the perception of tornado activity more than a county with weaker tornadoes. Strong tornadoes are those of Fujita or Enhanced Fujita (EF) intensity of two and three. Violent tornadoes are those of Fujita or Enhanced Fujita (EF) intensity of four and five. The fourth, fifth, and sixth metrics for assessing perceived climatological tornado risk are aimed at strong and violent tornadoes. These are given by:
Strong = Number of strong tornadoes/county area km2 × 100,
Violent = Number of violent tornadoes/county area km2 × 100,
SV/TD = Number of strong and violent tornadoes/tornado days.
The values from each of the six metrics are summed for each county to produce an overall risk score, which summarizes the participant’s perception of past tornado activity (Table 2.) The risk scores were then manually scanned for natural break points to divide categories with careful consideration given to demote or promote certain counties into a different classification based on particular circumstances and a comparison with previous significant tornado activity research [39]. For example, the SV/TD metric was used to demote three counties with high risk scores to moderate risk. Dare County, North Carolina is a small coastal county that had 27 tornado days with only three strong tornadoes and no violent tornadoes. It is frequently affected by coastal waterspouts and also hurricane spawned tornadoes of low intensity resulting in no fatalities and 17 injuries in its history. Likewise, Union County, New Jersey is a small and densely populated county with no strong or violent tornadoes in its history, so it was demoted to moderate risk. Broward County, Florida is a large densely populated coastal county with no strong or violent tornadoes in its history so it was also demoted to moderate risk. The natural break between the high and moderate risk counties occurred between risk scores of 2.38 and 2.31, leaving 14 counties as high risk. The moderate, enhanced, and slight categories have equal sample sizes of 33 counties. The marginal category was the largest with 48 counties. In order to conserve space, only the high risk counties are shown in Table 2. The spatial distribution of county risk categories aligns well with research that has identified the most dangerous tornado risk areas for the USA [39] (Figure 2).

2.3. Statistical Analysis

The county risk categories described in the previous section were used to test for statistically significant differences in perception accuracy for a number of different questions in Table 1. Since the county risk categories were used as groups for perception comparisons, it was first necessary to determine if the county risk categories were statistically significantly different. Using Kruskal–Wallis tests, all six metrics that were summed to create the risk scores were statistically significantly different (p < 0.01). Additionally, the individual metric scores were also statistically significantly different for each category (p < 0.01) indicating that this classification of counties was an adequate way to evaluate perception based on historical tornado activity.
Answers to Questions 8, 9, and 10 in Table 1 were used to evaluate perception accuracy for each county risk category. Questions 5 and 6 were not used since there was little variance in responses for those questions. It was hypothesized that participants from higher risk counties would feel that their counties were more frequently threatened, and have more accurate tornado risk perception than participants from lower risk counties. Responses were analyzed for Question 8, “Do you feel your county is frequently threatened by tornadoes?” A chi-square test was conducted with a crosstabs contingency table with yes or no as the response and the counts for the county risk categories as the numerical variable. Differences between expected minus observed results were used to determine statistical significance across all five county risk level categories.
Assessing perception accuracy was performed by subtracting the number of actual strong and violent tornadoes in each county (A) using Storm Data from the number of perceived strong and violent tornadoes (P). Larger differences in P-A indicate greater inaccuracy in tornado perception for each participant. Of the 364 participants, only 259 and 257 answered Questions 11 and 12, despite being urged to provide answers. The perceived tornado question was open-ended, and some participants answered unrealistic large values for the number of strong (1000) and violent (500) tornadoes. Answers of 100 or more were unrealistic for even the most active tornado counties. For this reason, the P for strong and violent tornadoes was capped at 50, and all answers greater than 50 were changed to a value of 50. With the exception of the high-risk counties, the number of “50” responses were randomly distributed across all 5 categories and proportionate to the sample size in each category. Kruskal–Wallis tests and Mann–Whitney tests were used due to unequal sample sizes in each group, and also non-normal data distributions. Kruskal–Wallis tests were used to test for significant differences across all five county risk categories while Mann–Whitney tests were used to test for differences between pairs of county risk categories.
Question 7 provided a chance to probe deeper into the possible relationships between tornado frequency and perception accuracy. A total of 67 participants said that a tornado had come within one mile of their home, work, or car. These answers were investigated to discover how clearly people remembered the details of those events. Similar to the overall perception, it was hypothesized that participants from higher risk counties would have more accurate recollections of their tornado experiences. Participants were instructed to provide the year, month, and date that these tornadoes occurred. These responses were then coded into two attributes: impact and memory, with scores ranging from 0 to 3 given for both attributes. Impact and memory scores were verified by reading accounts of individual tornadoes in Storm Data. For memory, a verified memory was given a score of 3 points if the year, month, and day were correctly answered and matched accurately to the description in Storm Data. A score of 2.5 (2) points was given if the month (season) and year were provided, and a score of 1 point if only the year was given. A score of 1.5 was given if the date and month were correctly answered but the year was wrong. For impact, a verified direct impact was scored as 3 points. This meant that the participant described their residence being hit. A score of 2 points was given if the participant described the tornado in their neighborhood but their residence was not hit directly. Although the question specifically says within 1 mile, many participants described a tornado in their county more than one mile away. These responses were scored as 1 point. A score of 0 was given for a false belief of a tornado occurrence.
The smaller sample size of 67 necessitated a combination of risk categories for the analysis of impact and memory effects. The high and moderate counties were combined into a high group, while the enhanced category had a large enough sample size to remain its own group. The slight and marginal counties were combined into one slight category. Similar to previous methods described earlier, a Kruskal–Wallis test was used to see if there were differences among the 3 groups for memory and impact. Mann–Whitney tests were used to test for differences among group pairs for memory and impact, and memory and impact combined.
Questions 11–14 were collectively labeled as tornado sentiment questions, and these questions asked about beliefs regarding personal abilities for safety in tornadoes. Non-parametric Spearman’s rho correlations were performed for the ordinal responses to the sentiment questions and these responses were correlated with county risk scores, county risk category numbers, and the perceived and actual numbers of strong and violent tornadoes in each county. These correlation results provide greater context in discussing results for the perception, impact, and memory tests.

3. Results and Discussion

3.1. Perception Accuracy

The first analysis for perception involved answers to the question, “Do you feel that your home county is frequently threatened by tornadoes?” The binary response of yes or no was cross-tabulated with the five county risk categories (Table 3). As one would expect, the percentage of participants indicating that their county was frequently threatened increased in each category culminating with 61% saying yes for the high-risk counties. The differences between observed and expected yes and no answers also displayed a similar result (p < 0.001). The marginal and slight categories had lower than expected yes counts, but the enhanced, moderate, and high-risk counties had higher than expected yes counts. These results suggest the majority of participants generally understood whether their county was a higher or lower risk county. The next objective shifted to estimating the number of strong and violent tornadoes that occurred to understand the impacts of tornado activity on perception accuracy.
Perceived minus Actual (P-A) tornado numbers were calculated for each participant. The P-A scores for each participant were again grouped by county tornado risk category. The perception results revealed that there were significant differences among the county risk categories for P-A scores. A Kruskal–Wallis test showed nearly significant results for all county risk categories for strong tornado perception (p = 0.089), but not for violent tornado perception (p = 0.103). The mean ranks for county risk categories for the perceived number of both strong and violent tornadoes increased gradually for each level with the exception of the enhanced counties. Since the results for all county risk categories were nearly significant, individual comparisons between county risk categories using Mann–Whitney tests resulted in several significant findings. Participants from high-risk counties had a statistically significantly greater perception of the number of strong and violent tornadoes that have occurred in their counties since 1980 compared to the enhanced category (strong p = 0.041 and violent p = 0.025), and marginal and slight categories for violent tornadoes (p = 0.019, and p = 0.038) (See Table 3). The moderate and slight risk counties also showed significantly greater perception than the enhanced counties for strong tornadoes (p = 0.035, and p = 0.041) (See Table 3). These results suggest that participants from high-risk counties have an inflated perception of the number of strong and violent tornadoes that have occurred. It is uncertain why participants from enhanced counties have a lower result when that is not the lowest risk category.
A possible explanation for the inflation in perception from higher risk counties is local television weather coverage. Many of the high-risk counties are located in Alabama, and local television meteorologists go live with wall-to-wall coverage for tornado outbreaks in Alabama. Television ratings are very high during these scenarios since these are life-threatening situations. The television meteorologists have an obligation to provide accurate severe weather coverage, and they should continue to do so. Often, these outbreaks persist for several hours with numerous tornado warnings with detailed street level and zip code warning timings. All of these tornado warnings are issued because of a confirmed tornado sighting or likelihood of a tornado from radar data. Many of these tornado warnings on television are for storms that may have once had a tornado but the tornado is not currently on the ground, or it was a radar indicated tornado that never touched-down. This likely inflates the number of perceived strong and violent tornadoes, and is possibly an unfortunate byproduct of providing accurate severe weather coverage. The majority of tornadoes are of EF0 and EF1 intensities, and it is hypothesized that the public largely misunderstands these statistics, leading to another possible inflation explanation.

3.2. Impact and Memory

The impact and memory results were calculated and explored to see if participants from higher risk counties had more accurate memories of the events, and also were more directly impacted. Similar to the previous analyses, a Kruskal–Wallis test was used to see if significant differences existed across all five counties for impact, memory, and the sum of impact and memory. Mann–Whitney tests were used for the individual comparisons.
There were no significant results across all five counties for memory, or impact and memory combined; although impact by itself was nearly significant (p = 0.053). Participants from high-risk counties were significantly more impacted than both the enhanced and slight risk county participants (p = 0.042, and p = 0.025). These results offer further validation of the county risk classification system since impact was nearly significant, but there appears to be no relationship between risk level and memory, at least in the way that memory was assessed in this research.

3.3. Tornado Sentiment

A Spearman’s rho correlation matrix was constructed to explore relationships between tornado sentiment variables (Questions 11–14 Table 1), cumulative county risk scores, county risk levels, and the number of perceived strong and violent tornadoes. There were very few significant relationships for tornado sentiment. The only significant correlations were found with tornado luck. Tornado safety was negatively correlated with tornado luck (ρ = −0.178, p = 0.001), while tornado fatalism was positively correlated with tornado luck (ρ = 0.196, p < 0.001). These results were expected. Participants who answered that their safety was under their control generally indicated that surviving a tornado was not a matter of luck. Likewise, those that said it was a matter of luck scored higher in fatalism. Beyond these results, it can be concluded that memory and sentiment effects on climatological tornado risk perception are randomly distributed and unrelated to counties where the tornado risk is greater.

4. Conclusions

A sample of 364 college students were given a tornado perception survey consisting of open-ended and closed responses. The home counties of each participant were first classified into risk levels corresponding with the climatological tornado risk for each county. These county risk levels were classified as high, moderate, enhanced, slight, and marginal following the system used for convective outlooks by the Storm Prediction Center. The county risk level categories were statistically significantly different, thus providing a framework for the evaluation of climatological tornado risk perception.
The influences of strong and violent tornado activity, tornado impact, tornado memory, and tornado sentiment were then evaluated to understand how each variable potentially impacted climatological risk perception. Only the strong and violent tornado activity appears to play a role in climatological risk perception. Participants generally possessed accurate knowledge of the tornado activity in their counties; however, a pattern emerged when participants from different county risk categories were asked to estimate the number of strong and violent tornadoes that have occurred since 1980. Participants from high-risk counties had a statistically significantly greater perception of the number of strong and violent tornadoes that have occurred in their counties since 1980 compared to the enhanced category, and marginal and slight categories for violent tornadoes. These results suggest that participants from high-risk counties have an inflated perception of the number of strong and violent tornadoes that have occurred.
Two possible explanations were presented. In high-risk counties, wall-to-wall coverage of tornado warnings by television meteorologists provides people with valuable information and saves lives. Many tornado warnings are radar confirmed, and a sizeable portion of these tornadoes never touch the ground. This could lead to inflation of the number of tornadoes. The second possible explanation is using strong and violent tornadoes instead of all tornadoes to assess climatological risk perception. Strong and violent tornadoes were chosen because these events were more likely to be remembered. Although our questions specifically asked about strong and violent tornadoes and explained what intensity this was on the EF scale, it is possible that people did not read the question carefully. Furthermore, it is possible that some of our participants had a poor understanding of EF2 or EF4 and greater wind speeds and potential damage. Since we did not ask what those categories meant to them, we acknowledge that as a potential limitation. Furthermore, perhaps many of the college students in this sample do not consult objective tornado risk when making personal risk decisions? However, it is not believed that asking the number of tornadoes question using all tornadoes in each county would change the overall perception accuracy results found in this research. This is highlighted by our decision to cap unrealistic answers at 50, and eliminate outliers above 50 as explained in the Methods. This more conservative approach allowed us to be more confident that the results presented in this research are more applicable to the population.
The primary findings of this research show that there is potential value in discussing communication efforts to educate the public about climatological tornado risk perception in high-risk counties. This is especially true for those under age 30 who receive their weather using multiple modes of information augmented by social media in addition to television weather. Future research will continue to explore the robustness of overestimation of climatological tornado risk in high-risk counties across a broader range of demographics with a goal of using both quantitative and qualitative methods in conjunction with psychological expertise. Future communication strategies can be discussed once those results are known.

Author Contributions

Conceptualization, J.C.S., K.N.E., J.R.R.; Methodology, J.C.S.; Formal Analysis, J.C.S., J.R.R.; Writing—original draft preparation, J.C.S., K.N.E.; Writing—review and editing, J.C.S., K.N.E., J.R.R.

Funding

This research received no external funding.

Acknowledgments

We would like to thank Tom Schmidlin for IRB assistance at Kent State and instructors of 100 level classes in The Department of Geography at Kent State University for allowing us access to their classrooms.

Conflicts of Interest

The authors declare no conflict of interest.

References

  1. Evans, L.G.; Judy, O.-S. Structure and Prevalence of PTSD Symptomology in Children Who Have Experienced a Severe Tornado. Psychol. Sch. 2006, 43, 283–295. [Google Scholar] [CrossRef]
  2. Niederkrotenthaler, T.; Erin, M.P.; Fernando, O.; Rebecca, S.E.; Bell, J.; Likang, X.; Melissa, A.M.; Caitlin, E.M.; Sugerman, D.E. Injuries and Post-Traumatic Stress Following Historic Tornados: Alabama, April 2011. PLoS ONE 2013, 8. [Google Scholar] [CrossRef] [PubMed]
  3. Xu, W.; Yuan, G.; Liu, Z.; Zhou, Y.; An, Y. Prevalence and Predictors of PTSD and Depression among Adolescent Victims of the Summer 2016 Tornado in Yancheng City. Arch. Psychiatr. Nurs. 2018, 32, 777–781. [Google Scholar] [CrossRef] [PubMed]
  4. Moulton, S.M. How to Remember: The Interplay of Memory and Identity Formation in Post-Disaster Communities. Hum. Organ. 2015, 74, 319–328. [Google Scholar] [CrossRef]
  5. Carbone, G.E.; Echols, E.T. Effects of Optimism on Recovery and Mental Health after a Tornado Outbreak. Psychol. Health 2017, 32, 530–548. [Google Scholar] [CrossRef]
  6. Senkbeil, C.J.; Sheridan, S.C. A Post-landfall Hurricane Classification System for the United States. J. Coast. Res. 2006, 225, 1025–1034. [Google Scholar] [CrossRef]
  7. Senkbeil, C.J.; Brommer, D.M.; Dixon, P.G.; Brown, M.E.; Sherman-Morris, K. The Perceived Landfall Location of Evacuees from Hurricane Gustav. Nat. Hazards 2009, 54, 141–158. [Google Scholar] [CrossRef]
  8. Brommer, M.D.; Senkbeil, J.C. Pre-Landfall Evacuee Perception of the Meteorological Hazards Associated with Hurricane Gustav. Nat. Hazards 2010, 55, 353–369. [Google Scholar] [CrossRef]
  9. Senkbeil, J.; Collins, J.; Reed, J. Evacuee Perception of Geophysical Hazards for Hurricane Irma. Weather Clim. Soc. 2019, 11, 217–227. [Google Scholar]
  10. Villegas, J.; Matyas, C.; Srinivasan, S.; Cahyanto, I.; Thapa, B.; Pennington-Gray, L. Cognitive and Affective Responses of Florida Tourists after Exposure to Hurricane Warning Messages. Nat. Hazards 2012, 66, 97–116. [Google Scholar] [CrossRef]
  11. Saunders, E.M.; Senkbeil, J.C. Perceptions of Hurricane Hazards in the Mid-Atlantic Region. Meteorol. Appl. 2017, 24, 120–134. [Google Scholar] [CrossRef]
  12. Sherman-Morris, K.; del Valle-Martinez, I. Optimistic Bias and the Consistency of Hurricane Track Forecasts. Nat. Hazards 2017, 88, 1523–1543. [Google Scholar] [CrossRef]
  13. Ellis, N.K.; Mason, R.L.; Gassert, N.K.; Elsner, B.J.; Fricker, T. Public perception of climatological tornado risk in Tennessee, USA. Int. J. Biometeorol. 2018, 62, 1557–1566. [Google Scholar] [CrossRef] [PubMed]
  14. Brotzge, J.; Donner, W. The Tornado Warning Process: A Review of Current Research, Challenges, and Opportunities. Bull. Am. Meteorol. Soc. 2013, 94, 1715–1733. [Google Scholar] [CrossRef]
  15. Slovic, P. Perception of risk. Science 1987, 236, 280–285. [Google Scholar] [CrossRef]
  16. Schultz, D.M.; Gruntfest, E.C.; Hayden, M.H.; Benight, C.C.; Drobot, S.; Barnes, L.R. Decision making by Austin, texas, residents in hypothetical tornado scenarios. Weather Clim. Soc. 2010, 2, 249–254. [Google Scholar] [CrossRef]
  17. Mason, R.L.; Ellis, N.K.; Winchester, B.; Schexnayder, S. Tornado warnings at night: Who gets the message? Weather Clim. Soc. 2018, 10, 561–568. [Google Scholar] [CrossRef]
  18. Miran, M.S.; Ling, C.L.R. Factors influencing people’s decision making during three consecutive tornado events. Int. J. Disaster Risk Reduct. 2018. [Google Scholar] [CrossRef]
  19. Dash, N.; Gladwin, H. Evacuation decision making and behavioral responses: Individual and household. Nat. Hazard Rev. 2007, 83, 69–77. [Google Scholar] [CrossRef]
  20. Kalkstein, J.A.; Sheridan, C.S. The social impacts of the heat–health watch/warning system in Phoenix, Arizona: Assessing the perceived risk and response of the public. Int. J. Biometeorol. 2007, 52, 43–55. [Google Scholar] [CrossRef]
  21. Miceli, R.; Sotgiu, I.; Settanni, M. Disaster preparedness and perception of flood risk: A study in an alpine valley in Italy. J. Environ. Psychol. 2007, 28, 164–173. [Google Scholar] [CrossRef]
  22. McClure, J.; Johnston, D.; Henrich, L.; Milfont, T.L.; Becker, J. When a hazard occurs where it is not expected: Risk judgments about different regions after the Christchurch earthquakes. Nat. Hazards 2015, 75, 635–652. [Google Scholar] [CrossRef]
  23. Ash, K.D.; Schumann, R.L., III; Bowser, G.C. Tornado warning trade-offs: Evaluating choices for visually communicating risk. Weather Clim. Soc. 2014, 6, 104–118. [Google Scholar] [CrossRef]
  24. Jon, I.; Huang, S.-K.; Lindell, M.K. Perceptions and expected immediate reactions to severe storm displays. Risk Anal. 2017. [Google Scholar] [CrossRef] [PubMed]
  25. Miran, S.M.; Ling, C.; Gerard, A.; Rothfusz, L. The effect of providing probabilistic information about a tornado threat on people’s protective action. Nat. Hazards 2018. [Google Scholar] [CrossRef]
  26. Greening, L.; Dollinger, S.J. Illusions (and shattered illusions) of invulnerability: Adolescents in natural disaster. J. Trauma. Stress 1992, 5, 63–75. [Google Scholar] [CrossRef]
  27. Demuth, J.L.; Morss, R.E.; Lazo, J.K.; Trumbo, C. The effects of past hurricane experiences on evacuation intentions through risk perception and efficacy beliefs: A mediation analysis. Weather Clim. Soc. 2016, 8, 327–344. [Google Scholar] [CrossRef]
  28. Wachinger, G.; Renn, O.; Begg, C.; Kuhlicke, C. The risk perception paradox-implications for governance and communication of natural hazards. Risk Anal. 2013, 33, 1049–1065. [Google Scholar] [CrossRef]
  29. Klockow, K.E.; Peppler, R.A.; McPherson, R.A. Tornado folk science in Alabama and Mississippi in the 27 April 2011 tornado outbreak. GeoJournal 2014, 79, 791–804. [Google Scholar] [CrossRef]
  30. Ellis, K.N.; Mason, L.R.; Gassert, K.N. Public understanding of local tornado characteristics and perceived protection from land-surface features in Tennessee, USA. PLoS ONE 2019, 14. [Google Scholar] [CrossRef]
  31. Senkbeil, J.C.; Scott, D.A.; Guinazu-Walker, P.; Rockman, M.S. Ethnic and Racial Differences in Tornado Hazard Perception, Preparedness, and Shelter Lead Time in Tuscaloosa. Prof. Geogr. 2013, 66, 610–620. [Google Scholar] [CrossRef]
  32. Walters, J.E.; Mason, L.R.; Ellis, K.N. Examining patterns of intended response to tornado warnings among residents of Tennessee, United States, through a latent class analysis approach. Int. J. Disaster Risk Reduct. 2019, 34, 375–386. [Google Scholar] [CrossRef]
  33. Sherman-Morris, K. Tornado warning dissemination and response at a university campus. Nat. Hazards 2010, 52, 623–638. [Google Scholar] [CrossRef]
  34. Lovekamp, W.E.; McMahon, S.K. I Have a Snickers Bar in the Trunk of My Car: Student Narratives of Disaster Risk, Fear, Preparedness, and Reflections on Union University. Int. J. Mass Emergencies Disasters 2011, 292, 132–148. [Google Scholar]
  35. Van Den Broeke, M.S.; Arthurs, L. Conceptions of tornado wind speed and land surface interactions among undergraduate students in Nebraska. J. Geosci. Educ. 2015, 63, 323–331. [Google Scholar] [CrossRef]
  36. Jauernic, S.T.; Van Den Broeke, M.S. Tornado Warning Response and Perceptions among Undergraduates in Nebraska. Weather Clim. Soc. 2017, 9, 125–139. [Google Scholar] [CrossRef]
  37. Charles, T.S.; Mather, M.; Carstensen, L.L. Aging and Emotional Memory: The Forgettable Nature of Negative Images for Older Adults. J. Exp. Psychol. Gen. 2003, 132, 310–324. [Google Scholar] [CrossRef]
  38. Davis, D.; Alea, N.; Bluck, S. The Difference between Right and Wrong: Accuracy of Older and Younger Adults’ Story Recall. Int. J. Environ. Res. Public Health 2015, 12, 10861–10885. [Google Scholar] [CrossRef] [Green Version]
  39. Coleman, A.T.; Dixon, P.G. An Objective Analysis of Tornado Risk in the United States. Weather Forecast. 2014, 29, 366–376. [Google Scholar] [CrossRef]
  40. Storm Prediction Center. Available online: https://www.spc.noaa.gov/ (accessed on 11 October 2019).
  41. Storm Events Database. Available online: https://www.ncdc.noaa.gov/stormevents/ (accessed on 11 October 2019).
  42. Simmons, M.K.; Sutter, D.; Pielke, R. Normalized Tornado Damage in the United States: 1950–2011. Environ. Hazards 2013, 12, 132–147. [Google Scholar] [CrossRef] [Green Version]
  43. Fivush, R.; Sales, J.M.; Goldberg, A.; Bahrick, L.; Parker, J. Weathering the Storm: Childrens Long-Term Recall of Hurricane Andrew. Memory 2004, 12, 104–118. [Google Scholar] [CrossRef] [PubMed]
  44. Bauer, J.P.; Stark, E.N.; Ackil, J.K.; Larkina, M.; Merrill, N.; Fivush, R. The Recollective Qualities of Adolescents’ and Adults’ Narratives about a Long-Ago Tornado. Memory 2016, 25, 412–424. [Google Scholar] [CrossRef] [PubMed]
Figure 1. Number of participants in each county.
Atmosphere 10 00732 g001
Figure 2. (A) County level risk categories. (B) Average annual number of significant (F2-F5) tornado initiation-locations within 40 km (25 mi) of a point for the 1973–2011 period, adopted from Ref. [39] © American Meteorological Society. Used with permission.
Atmosphere 10 00732 g002
Table 1. List of questions used in this research.
Question
1. What is your age?
2. What is your gender?
3. What is your home state and county?
4. How long have you lived in that home state and county?
5. If a Tornado Watch was issued for your county, what would you do?
6. If a Tornado Warning was issued for your county, what would you do?
7. Has a tornado ever hit or come within 1 mile of your residence, work, or car?
Please specify how close, the location, month, and year
8. Do you think your home county is frequently threatened by tornadoes?
9. Since 1980, how many strong or violent tornadoes have occurred (EF2 or F2 and greater) within your home county?
10. Since 1980, how many violent tornadoes have occurred (EF4 or F4 and greater) within your home county?
Tornado Sentiment QuestionsCategories
11. Tornado warnings are frequently overhyped or overblown4 = strongly agree3 = agree2 = disagree1 = strongly disagree
12. Except in extreme circumstances, my safety is under my control when a tornado threatens4 = strongly agree3 = agree2 = disagree1 = strongly disagree
13. Surviving a tornado is mostly a matter of luck4 = strongly agree3 = agree2 = disagree1 = strongly disagree
14. People die when it is their time and not much can be done about it4 = strongly agree3 = agree2 = disagree1 = strongly disagree
Table 2. The high risk counties. The columns represent: tornado activity, adjusted fatality, adjusted injury, adjusted strong tornadoes, adjusted violent tornadoes, and strong and violent/tornado days as described in Methods. These categories sum to create the RISK score.
StateCountyTornado ActivityAdj FatalityAdj InjuryAdj StrongAdj ViolentSV/TDRISK
AlabamaTuscaloosa1.080.981.740.470.090.514.88
AlabamaDeKalb1.740.910.290.940.200.664.74
AlabamaCullman2.000.190.470.680.050.373.76
IndianaMarion2.340.000.020.780.000.333.47
GeorgiaCobb1.820.010.040.910.110.563.45
OklahomaOklahoma1.740.040.110.650.160.473.18
AlabamaMadison1.830.190.290.430.100.293.13
TennesseeSumner1.600.120.160.660.000.412.95
AlabamaJefferson1.320.240.470.420.070.372.89
TennesseeMadison1.110.280.350.350.210.502.79
IllinoisWill1.480.100.120.600.050.442.78
TexasDallas1.460.010.060.440.090.362.43
MississippiMadison1.570.060.060.380.050.282.39
AlabamaMorgan1.330.000.000.530.070.452.38
Table 3. Question 8 (Top): Chi square results for each county risk level perception of being frequently threatened. Question 9 and 10 (Middle): Strong and violent tornado perception. (Bottom): Mann Whitney paired comparisons between county risk level categories. Bold = significantly greater numbers at the 0.05 level.
8. Do You Think Your Home County is Frequently Threatened by Tornadoes?X2 = 61.7, p < 0.0001
County Risk LevelnYesYes %Expected Count
High362261.18.2
Moderate481837.510.9
Enhanced642132.814.5
Slight1031110.723.4
Marginal9777.222
9. Since 1980, How Many Strong or Violent Tornadoes have Occurred (EF2 or F2 and Greater) Within Your Home County?
10. Since 1980, How Many Violent Tornadoes have Occurred (EF4 or F4 and greater) Within Your Home County?Strong X2 = 8.1, p = 0.089Violent X2 = 7.7, p = 0.103
County Risk LevelnMean RanknMean rank
High2715326158
Moderate3914138141
Enhanced4710746117
Slight7113471124
Marginal7512774122
County Risk Level ComparisonsStrongViolent
pp
High vs. Marginal 0.0800.019
High vs. Slight0.1740.038
High vs. Enhanced0.0410.025
High vs. Moderate0.7150.466
Moderate vs. Enhanced0.0350.147
Moderate vs. Slight0.6590.213
Moderate vs. Marginal0.4220.226
Enhanced vs. Slight0.0410.569
Enhanced vs. Marginal0.1290.636
Slight vs. Marginal0.5270.870

