1. Introduction
General aviation, comprised mainly of light (<12,500 lbs.), single engine, piston-powered airplanes [
1], is defined as all civil aviation excepting revenue-generating, passenger, and freight transport such as air carriers. Unfortunately, general aviation shows an inferior safety record when compared to commercial operations, and accounted for 97% of all civil aviation accidents in the period of 2010 and 2015 [
2].
One of the greatest challenges to general aviation safety is the operation of aircraft with respect to instrument meteorological conditions (IMC), i.e., in the absence of external visual cues, such as clouds, and in particular where ceilings are low. Under such conditions an airman must be able to fly the aircraft solely by reference to instruments. While general aviation pilots, who are instrument flight rule (IFR)-certificated, are trained to this effect, the majority (72%) of general aviation airmen do not carry this rating [
3]. Pilots of the latter encountering IMC are prone to spatial disorientation, often leading to a loss of control [
4]. Such mishaps carry a 2–9-fold higher risk of a fatal outcome compared with accidents unrelated to weather [
5,
6,
7]. Put another way, while only 9% of general aviation accidents occur in IMC, they account for 25% of fatalities [
8]. Accordingly, these airmen are prohibited from operating under such conditions. Furthermore, flight operations restricted to visual flight rules (VFR are defined [
9], in part, by a ceiling of greater than 3000 ft. above the ground (AGL)) are recommended. This altitude is partly determined by man-made structures, some of which extend higher than 2000 ft. AGL. It should be emphasized that general aviation airmen who are IFR-certificated are not immune to the hazards of IMC. Deficient proficiency in flying by reference to instruments represents the major cause of fatal accidents in this challenging environment [
10]. To operate safely, IFR-rated pilots should eschew low IFR (LIFR) weather (ceiling <500 ft. AGL) [
9].
To determine whether a flight can be safely completed with respect to the aforementioned weather and IFR-certification or lack thereof, airmen are mandated to undertake a pre-flight weather briefing for any flight away from the vicinity of the airport [
11]. To this end, a variety of aviation-specific weather tools informing current and forecast conditions are available, i.e., surface analyses and synopses, Meteorological Terminal Aviation Routine weather reports (METARs) and two aerodrome-specific forecast tools: Terminal Aerodrome Forecasts (TAFs) [
12] and the Localized Aviation Model Output Statistics Program (LAMP) [
13,
14]. TAFs (covering an area within 5 statute miles of the airport) are generated by National Weather Service (NWS) Weather Forecast Office meteorologists every six hours [
12] whereas LAMPs, issued hourly, are entirely automated [
15]. Considering that the typical general aviation leisure flight is <100 nautical miles in distance, aerodrome-specific forecasts are of particular utility especially when such forecasts along the route of the flight [
16], in addition to the departure and destination aerodromes, are included in the pre-flight weather briefing.
Unfortunately, of the approximately 5100 civilian aerodromes (also referred herein as stations) in the USA [
17], TAFs are issued for only approximately 750 [
12], with a bias towards larger airports used by commercial services and less so by general aviation [
17]. In contrast, the LAMP, a relatively new forecasting gridded tool only integrated into the NWS in 2010 [
18], represents a potential alternative to the TAF by nature of its wider prevalence at those airports more frequented by general aviation. As of 2018, 1853 airports are served by the LAMP [
19]. The LAMP represents an automated (human input-independent) forecast blended from the current observation, output from three advective models and the Global Forecast System Modeled Output System (GFS MOS) [
15]. However, the Federal Aviation Administration (FAA) presently cautions airmen [
20] to employ LAMP forecasts only as supplementary to the TAF (presumably issued from neighboring airports) rather than as a stand-alone alternative. The reasons for this might be related to the sparsity of studies addressing the accuracy of this forecast tool and the absence of human oversight in the forecast process.
Considering the greater number of general aviation-frequented aerodromes served by LAMP forecasts (relative to TAFs), the objective herein was to determine the predictive accuracy of this forecast tool for the VFR (>3000 ft.) and IFR (500–1000 ft.) ceiling flight categories.
2. Results
The overarching goal herein was to determine if LAMP forecasts, which are more common for aerodromes frequented by general aviation, pose an effective alternative to the TAF for ceiling flight category forecasts. A total of 823 LAMP forecasts across 39 states was used over the five-month (July–December 2018) study period with an average of five events per day. Of these, 317 and 506 were generated for the warm (July–September) and cool (October–December) periods, respectively.
2.1. VFR Forecast Accuracy by the LAMP
The pre-flight weather briefing is crucial for the VFR-only pilot, indicating whether a flight can be undertaken safely, i.e., with ceilings >3000 ft. AGL [
9], as >90% of accidents involving IMC encounters have a fatal outcome [
21]. Consequently, we first determined the accuracy of the LAMP in forecasting VFR conditions over the entire study duration. For comparative purposes, the accuracy of the LAMP in predicting VFR was compared to that based on persistence and the meteorologist-generated TAF.
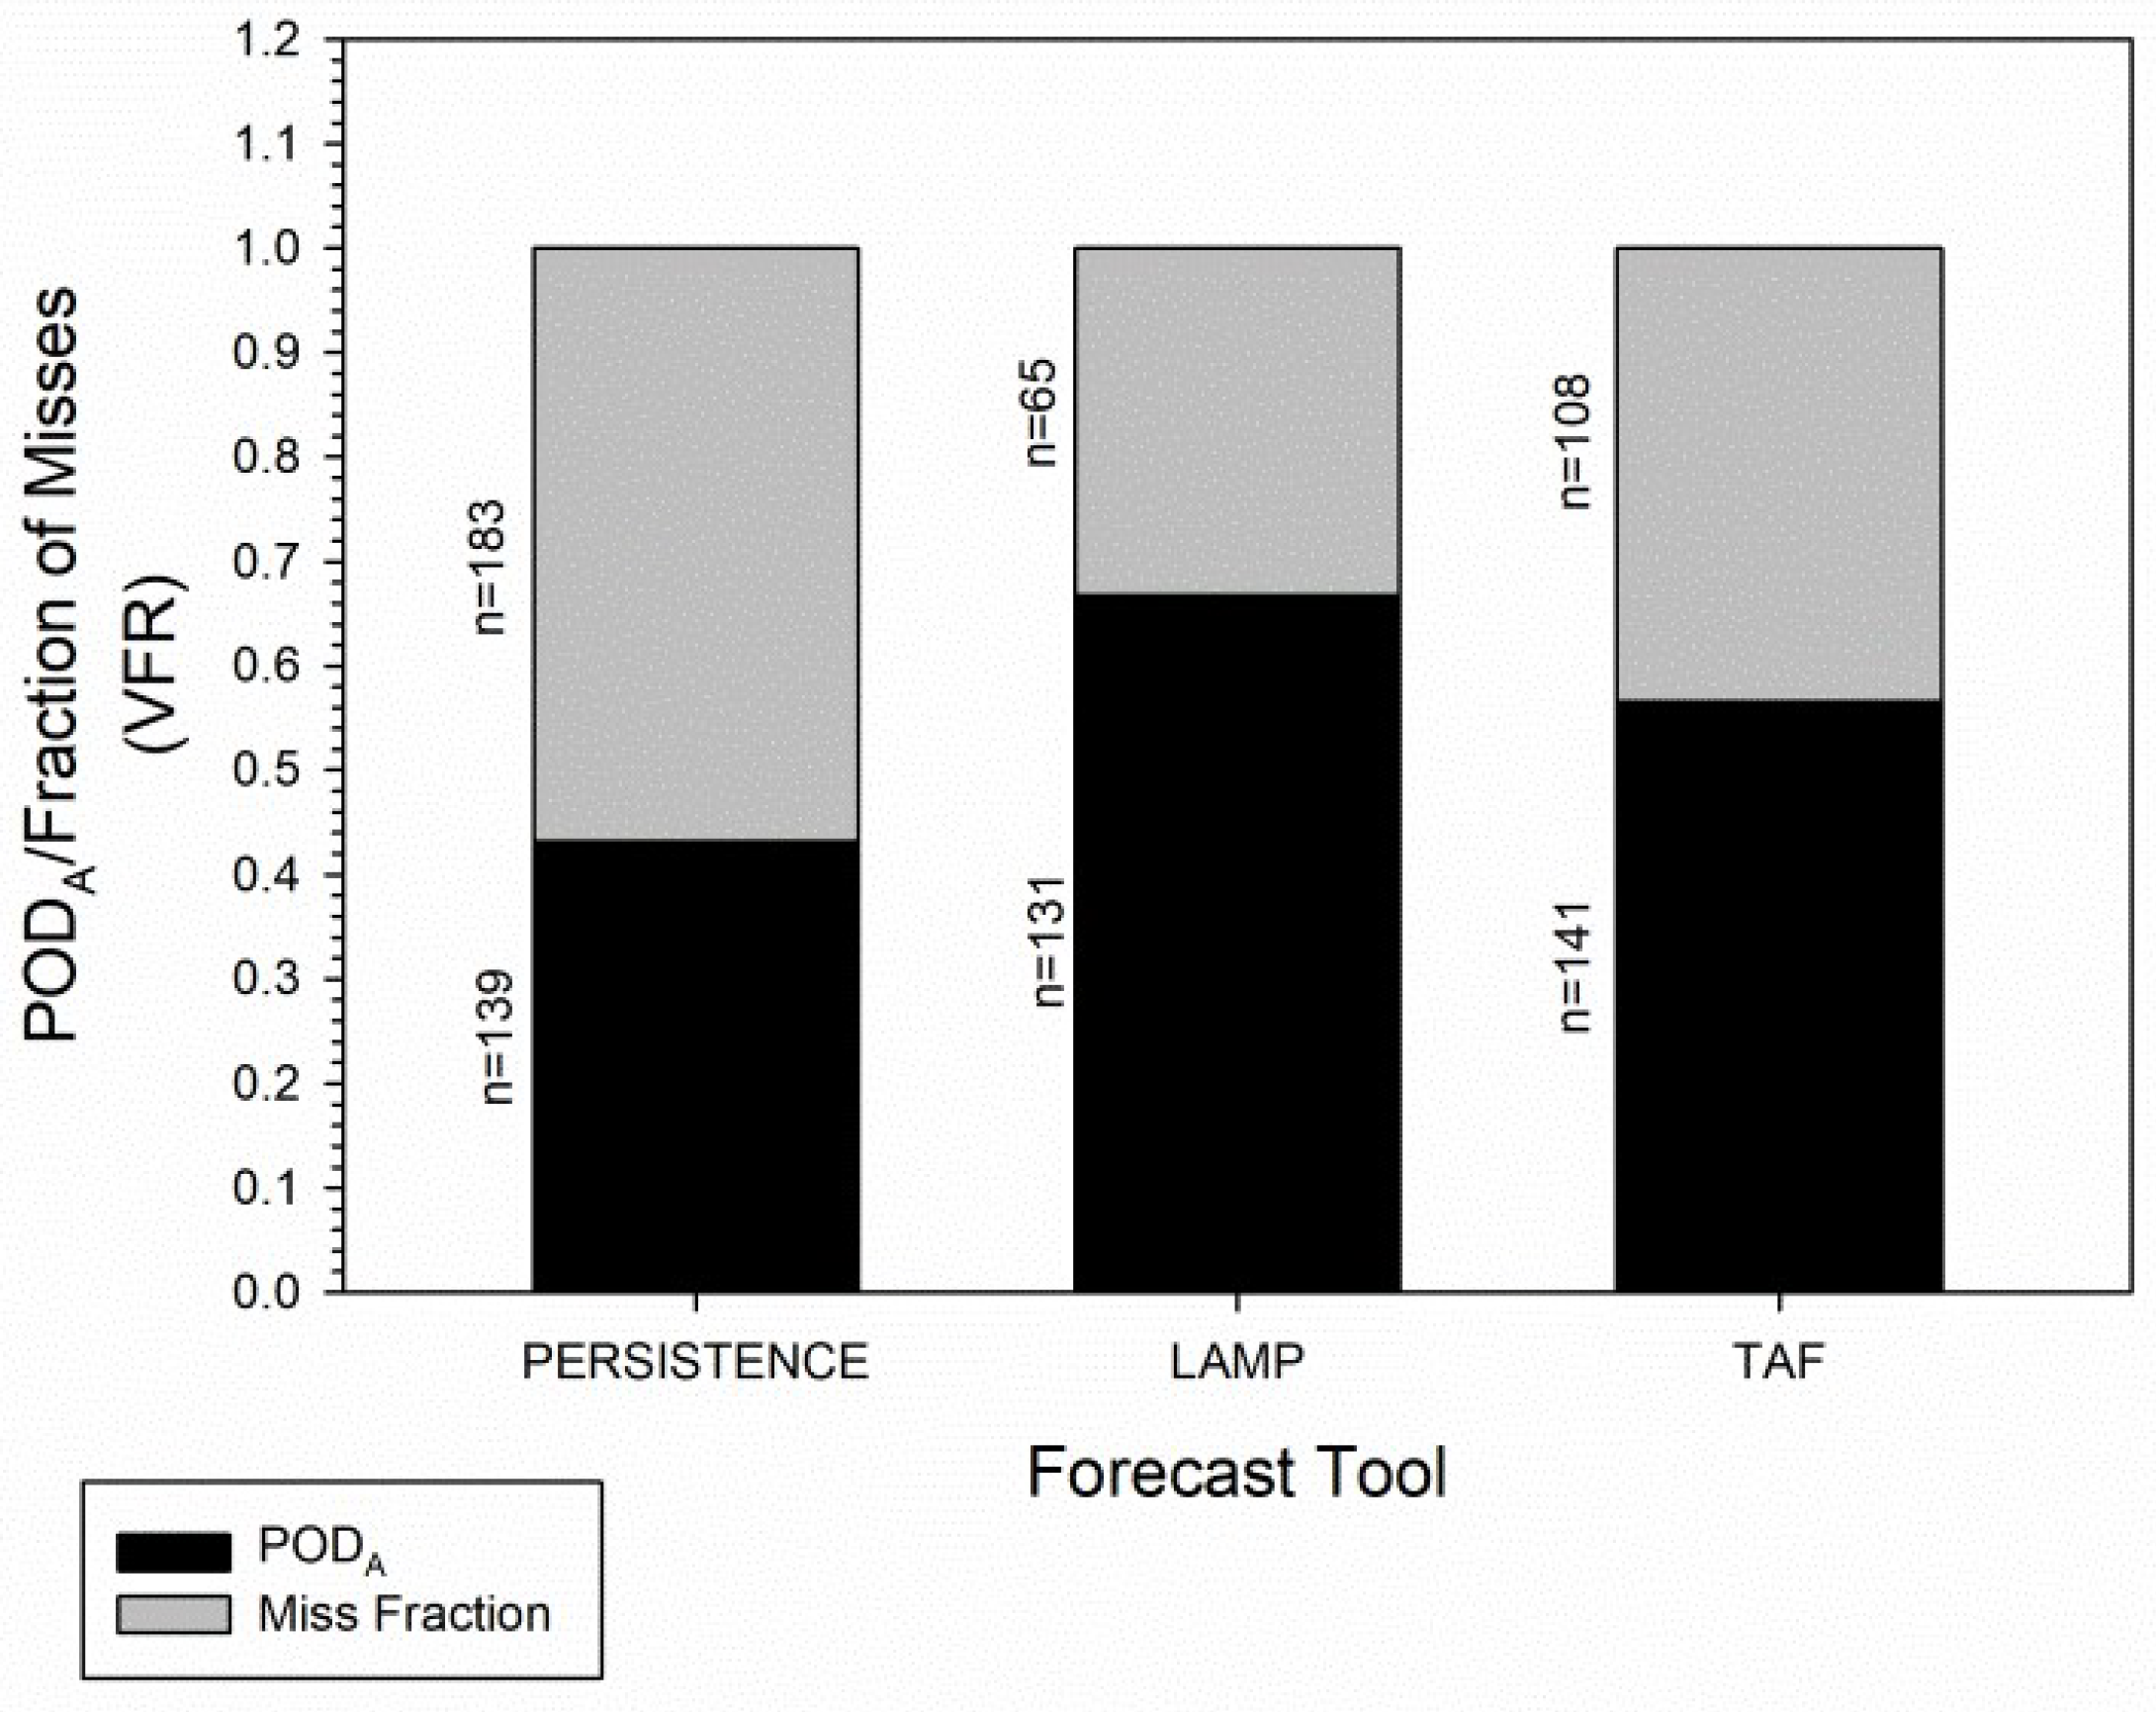
LAMP forecasts for VFR conditions showed an aviation-specific probability of detection (POD
A) of 0.67, a value substantially higher than the 0.43 based on persistence, as seen in
Figure 1. In comparing the LAMP with the corresponding TAF, the POD
A for VFR forecasts was higher for the former when compared to the latter (0.67 and 0.57, respectively), a difference which was statistically significant (
p = 0.031). A corollary is that the “miss fraction”, where ceilings were verified as 3000 ft. AGL or lower, for the LAMP forecast was lower (
p = 0.031) than the corresponding TAF. The latter observation is important from a safety perspective for the non-IFR rated airman who may rapidly experience spatial disorientation upon an IMC encounter, often with a fatal consequence [
21].
PODA/miss fraction for the VFR flight category (ceiling >3000 feet (ft.) AGL) are shown. The Localized Aviation MOS Program (LAMP) forecast was that generated at the hour of the Terminal Aerodrom Forecast (TAF) issue. Persistence data are based on Automated Surface Observation System (ASOS)-derived ceiling data at the time of the TAF issue. A “Miss” refers to a forecast in which verified ceilings were 3,000 ft. or lower. n, count of events. Statistical differences in proportions was undertaken using a Pearson Chi-Square (2-sided) testing of a 2 × 2 contingency table.
2.2. Accuracy of LAMP Forecasts for IFR
Although IFR-rated general aviation pilots are trained to fly solely by reference to the instruments, maintaining this skillset has always posed a challenge [
22]. This lack of proficiency has been identified as a major cause of accidents involving IFR-rated general aviation airmen operating in IMC [
10]. Consequently, forecasts discriminating IFR (ceiling 500–1000 ft. AGL) and the more challenging LIFR (ceiling <500 ft. AGL) flight categories are of importance for the IFR-rated pilot’s decision-making as to whether or not an IMC flight should be undertaken.
Accordingly, the ability of the LAMP forecast to accurately segregate these two flight categories was determined. Since, from a safety-perspective, an event in which a verified ceiling was higher-than-forecast (yielding a marginal VFR (MVFR) or VFR flight category) presents no safety hazard, such forecast flight categories were aggregated with those which accurately predicted IFR and were recorded as “hits.” Over the five-month study period, of 427 forecasts for IFR, the LAMP identified an IFR (or MVFR/VFR) flight category with a POD
A of 0.78, as seen in
Figure 2. While this accuracy was not statistically higher (
p = 0.106) than that for persistence (0.71), it was superior (
p < 0.001) to that of the TAF (POD
A = 0.56). Again, as a corollary, the LAMP showed disproportionately fewer (22% and 44%, respectively) “misses” (i.e., verified LIFR where IFR or better were forecast) compared with the TAF (
p < 0.001).
POD
A/miss fraction for the IFR flight category (ceiling 500–1000 ft. AGL). The “Miss Fraction” group refers to an IFR flight category forecast which was validated as Low IFR (LIFR) (ceilings <500 ft. AGL). The LAMP forecast was generated at the hour of the TAF issue. Persistence data are based on ASOS-derived ceiling data at the time of TAF issue. n, event count. Statistical differences in proportions were tested as per
Figure 1.
2.3. False Alarm Rates and Critical Success Scores for LAMP Forecasts
Whilst the aforementioned analytical method used to evaluate LAMP accuracy is pertinent to real-world operational decision-making by general aviation airmen, it suffers from one shortcoming. Specifically, it excludes events (VFR and IFR in the current study) which were not forecast but did occur (false alarms). A tool which excessively forecasts worse-than-actual conditions may undermine the credibility of the device and ultimately lead to pilots disregarding such forecasts (in common vernacular: “crying wolf” too often). To address this shortcoming, we used both aviation-specific false alarm rates (FARA) and aviation-specific critical success scores (also known as threat scores-CSSA) to evaluate the LAMP for forecasts of VFR and IFR conditions over the five-month data collection period.
The LAMP showed a modestly higher FAR
A (0.25) than persistence (0.19) and the TAF (0.19) for VFR, as seen in
Figure 3, although this difference was not statistically significant (
p = 0.243). However, for IFR forecasts, as seen in
Figure 3, the LAMP FAR
A (0.48) was statistically lower (
p < 0.001) than that of the TAF (0.81) and persistence (0.82). As for CSS
A, the LAMP exceeded the TAF for both VFR (
p = 0.012) and IFR forecasts (
p < 0.001), as seen in
Figure 4A,B, respectively. Collectively, these data suggest that, in comparison with these two other forecast models, the LAMP does not excessively predict worse-than-actual conditions.
FAR
A (range 0.0–1.0) for the study duration (July–December, 2018) are shown for VFR and IFR forecasts by the various tools. n, total number of observations. Scores range from 0 (poor) to 1 (good). Statistical differences in proportions were tested per
Figure 1.
CSS
A (range 0.0–1.0) for the study duration (July–December, 2018) are shown for VFR (Panel A) and IFR (Panel B) forecasts by the various tools. n, total number of observations. This score ranges from zero (0) at the poor end to one (1) at the good end. Statistical differences in proportions were tested per
Figure 1.
2.4. LAMP Forecasts for Warm and Cool Periods
Due to seasonal differences between warm and cool periods (e.g., ceilings related to convective vs. non-convective clouds), we considered the possibility that more robust LAMP forecasting accuracy in one period could mask an inefficacy for the other period. To address this possibility, LAMP forecasts for VFR and IFR were segregated into warm (July–September) and cool (October–December) periods [
23].
However, for both time periods, the POD
A for VFR forecasts by LAMP, as seen in
Figure 5 and
Figure 6, was statistically higher than that for persistence (
p = 0.006 and <0.001 for warm and cool periods, respectively). However, while the LAMP also showed superiority (
p = 0.043) over the TAF in the POD
A for VFR forecasts (0.68 and 0.55, respectively) for the warm period, as seen in
Figure 5, these two tools were comparable (
p = 0.323) for the cool period shown in
Figure 6 (0.65 and 0.58, respectively).
POD
A for the VFR flight category (ceiling >3000 ft. AGL) are shown for data collected July–September 2018 (Warm period) period. The LAMP forecast was that generated at the hour of the TAF issue. Persistence data are per the ASOS-derived ceiling data at the time of the TAF issue. n, event count. Statistical differences used a Pearson Chi-Square (2-sided) test per
Figure 1.
Probability of detection/miss fraction for the VFR flight category (ceiling >3000 ft. AGL) is shown for data collected over the cool period (October–December, 2018). The procedure is as described in
Figure 5.
A similar analysis was performed for LAMP forecasts of IFR conditions in the warm and cool months. For the warm period, as seen in
Figure 7, LAMP forecasts for the IFR flight category showed a high POD
A score (0.84), although this was not superior (
p = 0.548) to that based on persistence alone (0.80). However, the POD
A score (0.84) for LAMP forecasts was statistically higher (
p < 0.001) than the corresponding TAF value (0.59). These findings were paralleled for the cool months, as shown in
Figure 8. The LAMP was superior to the TAF in forecasting the IFR flight category (POD
A scores of 0.75 and 0.55, respectively), a difference which was strongly statistically significant (
p < 0.001). While higher than that for persistence (0.66), the difference between this tool and the LAMP forecast was not statistically significant (
p = 0.122).
Forecast accuracy for the IFR flight category (ceiling 500–1000 ft. AGL) is shown as “POD
A” using data from the warm (July–September 2018) months. The “Miss Fraction” group describes an IFR flight category forecast which was validated as LIFR (ceilings <500 ft. AGL). The LAMP forecast was generated at the hour of the TAF issue. Persistence data are based on ASOS-derived ceiling data at the time of TAF issue. n, event count. Statistical differences in proportions were tested as described in
Figure 1.
Forecast accuracy for the IFR flight category (ceiling 500–1000 ft. AGL) is shown as “POD
A” using data collected over the cool (Octomber–December, 2018) months. Details are as per
Figure 7.
Taken together, these data suggest that the overall efficacy of the LAMP in forecasting VFR and IFR conditions is, at least, comparable for both warm and cold periods.
3. Discussion
The current study demonstrates the LAMP to be at least comparable (and in some instances superior) to the TAF in forecasting accuracy for VFR and IFR conditions. These findings are of immense operational importance regarding pre-flight decision-making by the VFR-only and IFR-rated general aviation airman as to whether an operation should, or should not, be undertaken. Moreover, these findings advocate the use of this forecast tool in the pre-flight weather briefing as a stand-alone tool. This is especially the case for aerodromes in which a TAF is not issued and possibly integrated into the graphical area forecast (which represents a pictorial rather than textual description of the weather) as well. Currently, the FAA only recommends [
20] the use of the LAMP as supplementary to TAF data.
Whilst an earlier study [
23] researched LAMP forecast accuracy, it differed from ours in several respects. First and foremost, a single flight category, IFR (the ceiling employed was below 1000 ft.), was investigated. This had two consequences; specifically, the operational needs of the (i) VFR-only pilot who should restrict flights to ceilings >3000 ft. and (ii) the IFR-rated pilot, often deficient in instrument skills [
9,
10] and who should avoid LIFR (<500 ft.) operations [
22], were not addressed. Additionally, the prior research [
23] was undertaken before re-development of the ceiling and sky cover algorithm in 2012 [
13]. Finally, by including data from all US stations [
23], including those in areas with low temporal (seasonal to diurnal) variability, verification data may have led to positive bias for the earlier study.
From an operational perspective for a general aviation pilot, the LAMP has an additional advantage over the TAF in the hourly issuance of the former compared with every six hours for the latter. While the current study synchronized the analyses of these two forecast tools in “real-world” operations, the general aviation pilot is more likely to undertake a weather briefing several hours after the TAF issue. In contrast, the LAMP forecast, which is updated hourly, is more likely to take into account the most recently verified data as this model is partly based on current conditions [
15]. That said, one disadvantage of the LAMP forecast was a non-statistical trend towards a higher false alarm rate for VFR operations (MVFR or lower forecasted but where the VFR flight category prevailed). Such false calls have the potential to undermine the credibility of this tool, leading some VFR-only pilots to disregard forecasts of marginal weather conditions.
The finding that the LAMP was at least comparable to the TAF forecasts regarding the POD
A for VFR and IFR ceiling-based flight categories was somewhat surprising since the former is entirely automated whilst the latter is generated by a trained meteorologist who may draw on several sources of weather data (including the LAMP) as well as experience. It should be noted, however, that it is at the discretion of each NWS Forecast Office meteorologist as to whether LAMP data are employed to generate the TAF (personal communication with Lance Wood, NWS Forecast Office). Since the LAMP forecast tool is relatively new [
18] and validation studies sparse, it may be that NWS Weather Forecast Office meteorologists have been reluctant to make use of this tool. If so, such reservations combined with the fact that the geographical area covered by each NWS Weather Forecast Office is extensive (122 NWS offices cover the entire USA [
12]) may offset any advantages (e.g., experience) of human-input. The superiority of automation over the human interface is not at all new in aviation. For example, the evolution and integration of fly-by-wire aircraft in commercial aviation and in which computer algorithms mitigate against the aircraft departing its flight envelope is well accepted [
24].
The current study was not without limitations. First, while the standard definition of flight category is based on both ceiling and visibility [
9], only the former was used in the current study. Nevertheless, weather-related general aviation accidents with a fatal outcome are often due to spatial disorientation following an inadvertent encounter with low ceilings [
10,
25,
26]. A second limitation was that, in focusing the study on geographical areas likely to experience marginal weather conditions on a given day based largely on synoptically-driven features (LCL heights and/or frontal regions), aerodromes affected by their own micro-climates may have escaped evaluation. Nevertheless, our strategy was warranted to avoid a positive bias associated with stations located in areas of low temporal (seasonal or diurnal) weather variability.
The current study argues for a greater integration of LAMP forecasts into the pre-flight weather briefing than currently advocated by the FAA [
20], which suggests that such data be used as supplementary to the TAFs only. Nevertheless, considering the imprecise nature of weather forecasting and that the LAMP and TAFs are for geographically discrete areas (i.e., an aerodrome), airmen should always avail themselves of all data applicable to a planned flight—in particular, the recent graphical area forecast even for short distance (<100 nautical miles) operations common to general aviation.


