Abstract
Air quality in transportation microenvironment has received widespread attention. In this study, the exposure levels of volatile organic compounds (VOCs) and particulate matter that have a diameter of less than 2.5 micrometers (PM2.5) in Shanghai metro system were measured simultaneously, and their risks to human health under different driving conditions were then assessed. The results showed that VOCs, PM2.5 concentrations and life cancer risk (LCR) of four VOCs (benzene, formaldehyde, ethylbenzene, and acetaldehyde) in the old metro carriages were about 3 times, 3 times and 2 times higher than those in the new metro carriages, respectively. This difference can be ascribed to the fact that air filtration system in the new metro trains is significantly improved. The VOC levels, PM2.5 concentrations and LCR of VOCs on the above-ground track were slightly higher than those on the underground track. This is due to less outdoor polluted air entering into the carriage on the underground track. Number of passengers also had an effect on VOCs and PM2.5 concentrations in metro carriages. Additionally, the LCR of VOCs inside metro trains should not be ignored (7.69 × 10⁻⁶~1.47 × 10⁻⁵), especially inside old metro trains with the old ventilation system.
1. Introduction
Exposure to particulate matter and Volatile Organic Compounds (VOCs) can cause adverse effects on human health. For example, exposure to VOCs is associated with asthma and PM, in particular PM2.5, is a risk factor for cardiovascular disease [1,2]. Recently, public prefer to commute by subway, since it is one of the most convenient and fastest transportation in a metropolitan city. For instance, as the largest metro traffic systems in the world, the average daily ridership in Shanghai metro system is about 8 million. Accordingly, air quality in metro system has received widespread attention [3,4,5].
Previous studies have reported that VOCs levels inside cars, buses, and boats are higher than those in metro carriages [6,7,8,9,10,11,12,13]. Some studies focus on the concentration and chemical composition of particulate matters in metro carriages [14,15,16,17,18,19,20,21,22]. The PM concentration in metro carriage has been found to be lower than that in buses, cars, and trams [23,24,25,26,27], and PM in metro carriage is highly enriched with iron, which has an adverse effect on human health [28,29,30].
Factors that influenced VOCs and PM concentration in metro carriages are also investigated. Some studies have reported that in-train VOCs concentration under above-ground track is higher than those under underground tracks [31]. Other studies have stated that there is a significant difference of VOCs concentrations inside old metro carriages and new metro carriages [32]. The PM2.5 concentration in metro carriages is reported to be higher when driving under above-ground track than underground tracks [23,33]. Interestingly, Xu et al. [21] found that PM2.5 concentrations increase with passenger number at a ratio of 0.4 μg·m−3. However, these factors are studied individually or in the isolated conditions. Furthermore, few studies focus on benzene and formaldehyde in metro carriage [12,31], and ignore other carcinogens classified by the International Agency for Research on Cancer (IARC) and the U.S. Environmental Protection Agency, such as acetaldehyde and ethylbenzene. With more and more people commuting by subway, there is an urgent need to have a good knowledge of commuters’ health risk in metro carriage. Importantly, until now there is no air quality standard in metro carriage over the world.
In this study, we established an experiment in Shanghai metro system with the aim of (1) examining the concentration of VOCs and PM2.5 (dp ≤ 2.5 μm) in Shanghai metro system under different conditions, including new/old metro carriages, above-ground/underground tracks and number of passengers; and (2) assessing the health risk of PM2.5 and four volatile organic compounds (benzene, formaldehyde, acetaldehyde and ethylbenzene) inside metro carriage.
2. Methodology
2.1. Sampling Schedule
The experiment was conducted in Shanghai metro system during 8:00–10:30 a.m. from Mar. 28 to Oct. 20, 2016. Air samples were collected on sunny days and usually 3 days per week (not include Saturday and Sunday) if weather permitted. The measurement point was at the respiratory level (1.5 m) in the middle of metro carriages. The main features of sample lines (Line 1, Line 4, and Line 10) were described in Table 1. In order to test the number of people in metro carriage influence on the VOC and PM2.5 concentration, Line 10 was selected because there was a pronounced difference of number of people in the carriage between weekends and weekdays. The air samples for VOCs analysis were collected in Teflon sampling bags [34]. Four sets of air samples, used as duplicates, were collected for each trip. A total of 72 samples were collected in metro carriages for VOCs analysis. In this study we combined the VOCs data in 2015 [35] and 2016 to analysis the seasonal variation of VOCs in metro carriage. The sampling methods used in 2015 were the same as those used in 2016. We separated data into two seasons: summer (April to August) and autumn (September to October).

Table 1.
Information about the selected lines and sample routes.
The concentration of PM2.5 in metro carriage was measured by Dustraks (Model 8532, TSI Inc., Shoreview, MN, USA) with a logging interval of 1 s. The instrument was calibrated according to the manufacturer settings before the measurement campaign. Manufacturer-supplied PM2.5 inlet nozzles and impactors were employed in this study. The outdoor PM2.5 was measured for 3 mins at Laoximen station of Line 1, at Shanghai library station of Line 10, at Hongqiao Rd station of Line 4, and at Dongan Rd station of Line 4. In total, there were 2882 samples for outdoor PM2.5 and 17296 samples for PM2.5 in metro carriages. Additionally, few data measured under relative humidity (RH) above 60% were deleted because ambient conditions with RH above 60% favor hygroscopic growth of particles, leading to overestimation of PM2.5 measurements by the DustTrak.
To collect the in-carriage VOC samples by 6-L teflon sampling bags, portable pumps (TWA-300XB, XBXY Inc., China) and stainless-steel tubes filled with Tenax TA (N9307005, PerkinElmer Inc., Waltham, MA, USA) were used for sampling of benzene, toluene, ethylbenzene, xylene, and styrene. Before sampling, all the Tenax TA tubes were conditioned in helium for 2 h at 225 °C. Another portable pump and 2,4-dinitrophenylhydrazine (2,4-DNPH) cartridge (Anpel Inc., Shanghai, China) were used for sampling formaldehyde, acetaldehyde, acetone, and acrolein. Ozone scrubbers (Anpel Inc., Shanghai, China) were used as a pre-cartridge of XPoSure to minimize ozone interference. Flow rates of the pump were set at 0.2 L·min−1 for aromatic VOCs and 0.4 L·min−1 for carbonyl compounds, as calibrated by a gas flow meter (Model 4050, TSI Inc., Shoreview, MN, USA).
2.2. Analytical Methods
The air samples for VOCs analysis were analyzed by gas chromatography/mass spectrometry (GC/MS) (GC/MS, DSQ-II, Thermo Fisher, USA) and high-performance liquid chromatography (HPLC) system (1200-DAD, Agilent Inc., Santa Clara, CA, USA). The details of analysis condition and standard curve were in the Supplementary Materials (Text S1 and Table S1). The method detection limit (MDL) of all measured VOCs was below 0.5 μg/m3. In this study, life cancer risk of VOCs in metro carriage was assessed using the method put forward by USA EPA [36].
2.3. Data Analysis
The average of VOCs, PM concentration and Life cancer risk were arithmetic average in this study. Differences of average VOCs or PM2.5 values in metro carriage under the different conditions were compared using one-way analysis of variance (ANOVA), and Pearson correlation coefficient was used to examine the correlation among VOCs. Additionally, the Student’s t-test was used to investigate the significant difference of VOC concentrations between 2015 and 2016. Also, the Student’s t-test was used to investigate the significant difference of environmental parameters (CO2, CO, relative humidity and air temperature) between 2015 and 2016. SPSS version 20.0 was used in statistical analysis.
3. Results and Discussion
3.1. Concentration of VOCs in Metro Carriages
The average concentration of total VOCs inside metro carriages was 71.43 μg·m−3 in this study. This value is much higher than the VOC concentrations in the metro carriage in Boston (12.5 μg·m−3) [6] and Mexico City (22.2 μg·m−3) [12], while it is comparable with the VOC concentration in metro carriage in Guangzhou (60.5 μg·m−3) [7]. Note that the average concentration of VOCs in this study is much lower than the VOC concentrations in other roadway transports, such as bus (103.1 μg·m−3) and taxi (207.2 μg·m−3) [7]. Vehicular emission is an important source of VOCs [8]. Given the track of metro train is located away from busy street or traffic, the quality of tunnel air, as well as the air in metro carriages, is better than roadway air. Additionally, compared with 2015, benzene and toluene in metro carriage measured in 2016 under above-ground track were about three times higher (Table 2). This was the same pattern in the underground track. Additionally, compared with 2016, formaldehyde in the new metro carriages measured in 2015 was about six times higher, and acetaldehyde in the new metro carriages was about three times higher. This was the same pattern in the old metro carriages. These discrepancy results can be attributed to the meteorological properties. However, we did not find significant difference among those conditions, including new/old metro carriages and above-ground/underground tracks (t-test, P > 0.05; Table 3). One possible reason is the different meteorological properties in the outside environment during the measurement. Unfortunately, those meteorological properties were not measured. The other possible reason is the sources. Vehicle emission is an important source for VOCs in the metro carriages [9]. Accordingly, the VOC concentrations varied among different years can be attributed to the different traffic volumes during the measurement.
Table 2.
The concentration of Volatile organic compounds (VOCs) in metro carriage under different conditions (Mean ± S.E.).
Table 3.
The environmental parameters in metro carriage under different conditions (Mean ± S.E.).
As shown in Figure 1, the concentrations of benzene, toluene, ethylbenzene, xylene and formaldehyde in the new metro carriage were 1~3 times lower than that in the old ones (P < 0.05) during summer and autumn. This difference can be attributed to two reasons. First, water-borne paints are used in new trains while solvent-borne paints are used in old metro trains, which can emit more VOCs. Second, different air filtration methods are used in different metro lines, which may also contribute to the significant differences of VOCs concentration between old and new metro trains. Stainless steel wire mesh is used in old metro trains, while the new metro trains use fibrous air filter, of which filtration efficiency is higher. Additionally, we found that the concentration of VOCs in metro carriage during the summer were ~90% higher than that during the autumn regardless of old/new metro trains, especially formaldehyde increased by 24.8 μg·m−3. This is an expected result considering heavy traffic during the summer holiday in Shanghai. The other explanation for the increase of carbonyl compounds (formaldehyde and acetaldehyde) is that the emission of decorating materials inside the subway trains [31], which can be enhanced under the high air temperature in summer. A large number of commuters during the summer holiday also contribute to the high VOC concentrations in metro carriage. For example, Pang and Mu [10] have demonstrated that acetaldehyde concentration in a subway cabin in Beijing is increased with commuter number.
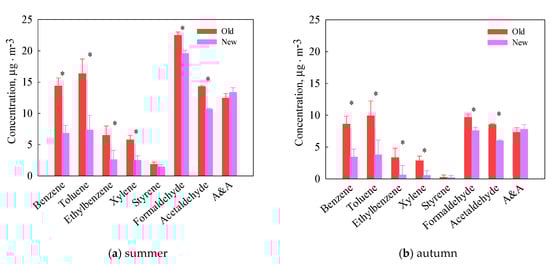
Figure 1.
2015–2016 averaged VOC concentrations in metro carriages of Line 1 (Old) and Line 10 (New) during (a) summer and (b) autumn. The error bar indicates the standard deviation for four replicates. “*” indicates the difference between the average VOCs value in the new and old metro carriage (P < 0.05). A&A: Acetone and Acrolein. 2015 data is from Ref. [35].
Different driving routes also influenced the VOCs concentrations in metro carriages. As shown in Figure 2, the concentrations of benzene, toluene, ethylbenzene, xylene, styrene, formaldehyde and acetaldehyde inside underground carriage were 30~40% lower than that during the above-ground track (P < 0.05) both in summer and autumn seasons. This lower VOCs level in the underground track can be ascribed to the poor air circulation and ventilation, which causes less VOCs in the ambient air entering into the carriage. Our result was consistent with a previous study, which reported that there was a significant difference of in-cabin VOCs levels between underground and above-ground tracks [9]. Furthermore, we also found that the total VOC concentration in metro carriages during summer were ~100% higher than that during the autumn season. This pattern is in line with the VOC concentrations in the new/old metro carriages, which can be ascribed to the heavy traffic and large commuter number during the summer season in Shanghai. Additionally, the concentration of styrene, acetone and acrolein were not affected by the season, underground/above-ground track, and new/old metro carriage. This result indicates that the source of these three air pollutants differs from other VOCs measured in present study. In order to have a good knowledge of the source of VOCs in metro carriages, further research is urgently needed.
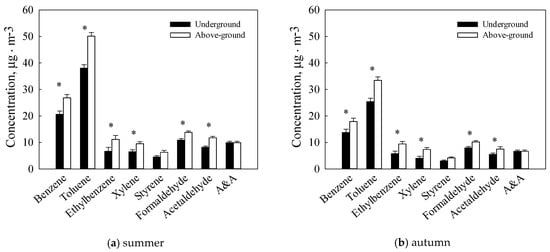
Figure 2.
The 2015–2016 averaged VOC concentrations in metro carriages under above-ground and underground track during (a) summer and (b) autumn. The error bar indicates the standard deviation for four replicates. “*” indicates the difference between the average VOCs value under the above-ground track and underground track conditions (P < 0.05). A&A: Acetone and Acrolein. 2015 data is from Ref. [35].
Besides the new/old metro trains and different driving routes, passenger number was another crucial factor on affecting VOCs concentrations in metro carriages. In this study, there was a significant correlation between acetone and acrolein concentration and commuters’ number (P < 0.05, one-way ANOVA). The concentration of acetone and acrolein increased from 6.71 to 21.27 μg·m−3 with commuters’ number increased from 30 to 200 inside metro carriages. This trend was not observed for other VOCs. There was no difference of average acetone and acrolein concentration in new/old metro carriage and under above-ground/underground driving conditions, as shown in Figure 1 and Figure 2. This result can be attributed to the same number of passengers in the metro carriage. The result is consistent with a previous study, which reported that concentration of acetone increased from 12.3 to 21.67 μg·m−3, as commuter number increased by 300 [10]. This is because acetone can be excreted in the processes of human metabolism [37]. As a result, acetone and acrolein (R < 0.39) concentration were not correlated well with other VOCs as shown in Table 4.
Table 4.
Correlation coefficients of volatile organic compounds (VOCs) measured in metro carriages in Shanghai.
By contrast, five target aromatic volatile organic compounds (benzene, ethylbenzene, toluene, styrene and xylene) had good correlations with each other (R > 0.74). The result indicates that the aromatic VOCs in metro carriage are from the same sources. This is consistent with a previous study, which reported that in-cabin aromatic compounds correlated well with each other [38]. Except for acetone and acrolein, carbonyls were also correlated well with each other in our study (R > 0.80). The poor correlations between carbonyls and the aromatic compounds indicate that they are from different sources. For instance, carbonyls are predominantly formed by photochemical reactions in the air and factories emission while the aromatic VOCs are mainly from vehicle emission.
3.2. Concentration of PM2.5 in Metro Carriages
The average concentration of PM2.5 in metro carriages was about 58 μg·m−3. Compared with roadway transports (~71 μg·m−3) [20], this value is noticeably lower. Given motor vehicle exhausts on the streets is one essential source of PM2.5, the ventilation grids of the Metro system may decrease the PM2.5 concentration in metro carriage by effectively preventing outdoor polluted air entrance [20]. Compared with PM2.5 concentration in metro carriage in London (~130 μg·m−3) [14], the value in this study is also much lower. This can be attributed to the advanced brake system and electric motive power used in the Shanghai metro train which produces less PM2.5 than fuel motive power used in London metro train in 1999. Additionally, the PM2.5 concentration in metro carriage in this study is comparable with that in other cities in China, such as Guangzhou (67 μg·m−3) [19], Hong Kong 44 μg·m−3 [18], Xi’an (43 μg·m−3) [13] and Beijing 56.9 μg·m−3 [26]. The slight difference between them can be owing to the ventilation system and depth of tunnel [20]. The average concentration of PM2.5 inside the old carriages (122 μg·m−3) was about 3 times higher than that in the new metro carriages (Figure 3). This is owing to the different air filtration methods used in old and new metro trains. The old metro trains use wire mesh, while the new metro trains use fibrous air filter. The filtration efficiency of wire mesh is much lower than the filtration efficiency of fibrous air filter. Our result is in agreement with a previous study [21], which reported that the PM2.5 concentrations in the old carriages were much higher than that in new carriages due to the aged ventilation systems in old metro trains.
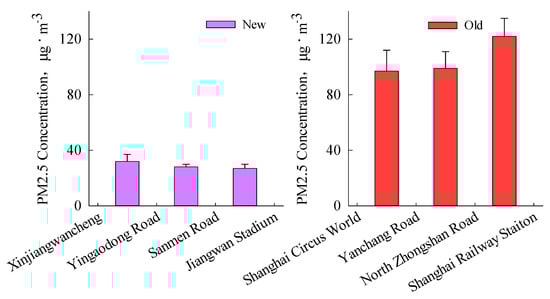
Figure 3.
Average PM2.5 concentrations in metro carriages of line 1 (Old) and line 10 (New). The error bar indicates the standard deviation.
Besides the old/new metro carriages, different driving routes also influenced the concentration of PM2.5 in metro carriage. The average PM2.5 concentrations inside metro carriage increased by 58.3% as the metro was driven from underground to above-ground (Figure 4). This is attributed to the fact that more PM2.5 in the on-road atmosphere (125 μg·m−3) entered into the carriage through the ventilation system. If the air filter efficiency is about 70% [39], the contribution of outdoor PM2.5 to the PM2.5 concentration inside metro train can reach to 62.5%. The significant relationship between outdoor PM2.5 and PM2.5 in metro carriage (R2 = 0.54, P = 0.02) also supports this statement. This is consistent with the previous study [17], which reported that the variations of PM concentrations in metro carriages were influenced by the outdoor PM concentrations and the main contribution was exhaust of motor vehicles. However, this conclusion is inconsistent with the previous study by Kam et al. [40], who found that PM2.5 concentrations are much higher inside the metro carriage in the underground track than that in the aboveground track. This is because the outdoor air conditions in Los Angeles (~ 50 μg·m−3) were better than that in Shanghai (107~248 μg·m−3) [41] during the measurement.
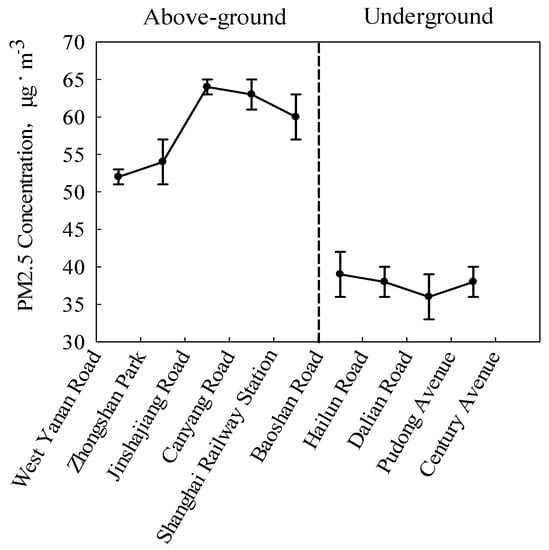
Figure 4.
Average PM2.5 concentrations in metro carriages under above-ground and underground conditions. The error bar indicates the standard deviation.
Figure 5 showed that PM2.5 concentration in metro carriage was increased with passenger number at a ratio of 0.5 μg·m−3 per passenger, which is in agreement with previous studies [21,42], which reported that the concentration of PM2.5 inside the metro carriages increased with the passenger number. This phenomenon is caused by the passengers and luggage movements, which lead to PM resuspension [43,44].
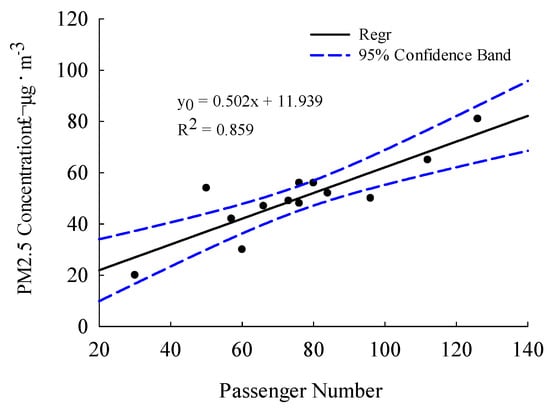
Figure 5.
The relationship between passenger number and PM2.5 concentration.
3.3. Health Risk Assessment
As shown in Figure 6, the life cancer risk (LCR) of commuters in subway ranged from 7.69 × 10⁻⁶ to 1.47 × 10⁻⁵. The LCR in the new metro trains (7.69 × 10⁻⁶) was 47.6% lower than that in the old metro trains (1.47 × 10⁻⁵). This result can be ascribed to the air filtration improvement in the new metro trains. The inside LCR under the above-ground condition, (1.35 × 10⁻⁵) was 46.6% higher than that in the underground track (9.21 × 10⁻⁶), where the inside VOCs are less influenced by outdoor vehicular emission. The results also showed that benzene was the most important air pollutant in the metro carriage, the LCR of which accounted for more than 50% of total LCR. The LCR of formaldehyde in the old metro carriage was the highest among four conditions (above-ground, underground, old metro carriage, and new metro carriage). This high value is partly owing to the solvent-borne paints used in old metro carriage which emit more formaldehyde, and the poor air filter efficiency in old metro carriage causes more polluted air to enter into the metro carriage. Furthermore, compared with the acceptable level of LCR recommended by the World Health Organization (1 × 10⁻⁶~1 × 10⁻⁵), the LCR in the old metro carriage and under above-ground driving condition was larger than it. Additionally, the exposure time in this study was just 2 h for the passengers. This was based on the newly released “2010 Chinese New-Approach Urbanization report”, which showed that the commute time from home to work was about 47 min in Shanghai. Given longer exposure time for some people, such as subway drivers, LCR maybe 3~4 times higher than that in this study.
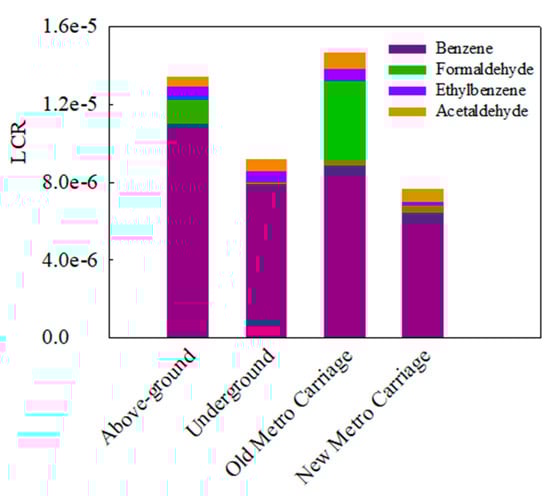
Figure 6.
Life cancer risk (LCR) of VOCs in metro carriages under different conditions during 2015–2016. 2015 data is from Ref. [35].
To obtain a better understanding of the health impacts associated with the exposure of PM2.5, our results were compared to the Air Quality National Standard in China which set a recommended average daily concentration limit of 75 μg·m−3 for indoor PM2.5 exposure. From our data shown in Figure 3 and Figure 4, except the old metro lines with the average PM2.5 concentration of 106 μg·m−3, the PM2.5 concentrations in any other metro lines met the concentration limit.
Although we observed variation of VOCs and PM2.5 in measured metro carriages, there are limitations in this study. First, this study only chose 3 lines of subway in Shanghai. It is unclear whether this number is enough to represent the whole metro system in Shanghai. Second, since outdoor VOCs are not measured at same time when we measured VOCs in metro carriage, less is known that how much of VOCs in metro carriage can be owing to outdoor VOCs. Thus, the source of VOCs metro carriages is still unclear. Third, although there are significant differences of VOCs and PM2.5 in metro carriages under different conditions, the mechanism underlying these phenomena is unclear and needs further research.
4. Conclusions
The average concentration of total VOCs and PM2.5 inside the measured metro lines was 52.2 and 58 μg·m−3, respectively. Their concentrations were significantly affected by the new/old metro carriages, driving conditions (underground/above-ground) and number of passengers. The VOCs, PM2.5 concentrations and LCR in the old metro carriages were 3 times, 3 times and 2 times higher than those in the new metro carriages, respectively. This difference is due to different air filtration methods. The VOCs levels, PM2.5 concentrations and LCR under above-ground track were slightly higher than those under the underground track. This result is attributed to the poor air circulation and ventilation on the underground track, which causes less outdoor polluted air entering into the carriage. Except for the old metro lines with the PM2.5 concentration of 106 μg·m−3, the PM2.5 concentrations in any other metro lines met the concentration limit of 75 μg·m−3 recommended in the Air Quality National Standard in China. The health effect of VOCs exposures inside metro trains should not be ignored, especially in old metro trains with the old ventilation system. Furthermore, the exposure time in this study was just 2 h for the passengers. Given longer exposure time for some people, such as subway drivers, LCR maybe 3~4 times higher than that in this study.
Supplementary Materials
The following are available online at https://www.mdpi.com/2073-4433/10/6/302/s1, Table S1: The equations and correlation coefficients (R2) of standard curves for benzene, toluene, ethylbenzene, p-xylene and m-xylene, styrene, o-xylene, formaldehyde, acetaldehyde, acetone and acrolein, Text S1: The details of standard curve method for the aromatic hydrocarbons and carbonyl compounds.
Author Contributions
Funding acquisition, B.X.; Methodology, Y.G., T.Z. and Y.Z.; Project administration, B.X.; Resources, T.Z. and Y.Z.; Supervision, B.X.; Writing – original draft, Y.G.
Funding
This research was funded by National Key R&D Program of China (grant NO. 2018YFC1901400). The APC was funded by Bin Xu.
Acknowledgments
This study was partially Sponsored by National Key R&D Program of China (Grant No. 2018YFC1901400) and the Shanghai Institute of Pollution Control and Ecological Security. The authors would like to thank China Scholarship Council for the scholarship. The authors would like to acknowledge Jianghua Wu for the guidance in writing.
Conflicts of Interest
The authors declare that they have no conflict of interest.
References
- Pope, C.A.; Burnett, R.T.; Thurston, G.D.; Thun, M.J.; Calle, E.E.; Krewski, D.; Godleski, J.J. Cardiovascular mortality and long-term exposure to particulate air pollution: Epidemiological evidence of general pathophysiological pathways of disease. Circulation 2004, 109, 71–77. [Google Scholar] [CrossRef] [PubMed]
- Tagiyeva, N.; Sheikh, A. Domestic exposure to volatile organic compounds in relation to asthma and allergy in children and adults. Expert Rev. Clin. Immunol. 2014, 10, 1611–1639. [Google Scholar] [CrossRef] [PubMed]
- Reche, C.; Moreno, T.; Martins, V.; Minguillón, M.C.; Jones, T.; de Miguel, E.; Capdevila, M.; Centelles, S.; Querol, X. Factors controlling particle number concentration and size at metro stations. Atmos. Environ. 2017, 156, 169–181. [Google Scholar] [CrossRef]
- Kim, M.J.; Braatz, R.D.; Kim, J.T.; Yoo, C.K. Economical control of indoor air quality in underground metro station using an iterative dynamic programming-based ventilation system. Indoor Built Environ. 2016, 25, 949–961. [Google Scholar] [CrossRef]
- Hwang, S.H.; Jang, S.; Park, W.M.; Park, J.B. Concentrations and identification of culturable airborne fungi in underground stations of the Seoul metro. Environ. Sci. Pollut. Res. 2016, 23, 20680–20686. [Google Scholar] [CrossRef] [PubMed]
- Chan, C.-C.; Spengler, J.D.; Özkaynak, H.; Lefkopoulou, M. Commuter exposures to VOCs in Boston, Massachusetts. J. Air Waste Manag. Assoc. 1991, 41, 1594–1600. [Google Scholar] [CrossRef]
- Chan, L.Y.; Lau, W.L.; Wang, X.M.; Tang, J.H. Preliminary measurements of aromatic VOCs in public transportation modes in Guangzhou, China. Environ. Int. 2003, 29, 429–435. [Google Scholar] [CrossRef]
- Gómez-Perales, J.E.; Colvile, R.N.; Fernández-Bremauntz, A.A.; Gutiérrez-Avedoy, V.; Páramo-Figueroa, V.H.; Blanco-Jiménez, S.; Bueno-López, E.; Bernabé-Cabanillas, R.; Mandujano, F.; Hidalgo-Navarro, M.; et al. Bus, minibus, metro inter-comparison of commuters’ exposure to air pollution in Mexico City. Atmos. Environ. 2007, 41, 890–901. [Google Scholar] [CrossRef]
- Lau, W.L.; Chan, L.Y. Commuter exposure to aromatic VOCs in public transportation modes in Hong Kong. Sci. Total Environ. 2003, 308, 143–155. [Google Scholar] [CrossRef]
- Pang, X.; Mu, Y. Characteristics of carbonyl compounds in public vehicles of Beijing city: Concentrations, sources, and personal exposures. Atmos. Environ. 2007, 41, 1819–1824. [Google Scholar] [CrossRef]
- Xu, B.; Hao, J. Air quality inside subway metro indoor environment worldwide: A review. Environ. Int. 2017, 107, 33–46. [Google Scholar] [CrossRef]
- Shiohara, N.; Fernández-Bremauntz, A.A.; Blanco Jiménez, S.; Yanagisawa, Y. The commuters’ exposure to volatile chemicals and carcinogenic risk in Mexico City. Atmos. Environ. 2005, 39, 3481–3489. [Google Scholar] [CrossRef]
- Qiu, Z.; Song, J.; Xu, X.; Luo, Y.; Zhao, R.; Zhou, W.; Xiang, B.; Hao, Y. Commuter exposure to particulate matter for different transportation modes in Xi’an, China. Atmos. Pollut. Res. 2017, 8, 940–948. [Google Scholar] [CrossRef]
- Adams, H.S.; Nieuwenhuijsen, M.J.; Colvile, R.N.; McMullen, M.A.S.; Khandelwal, P. Fine particle (PM2.5) personal exposure levels in transport microenvironments, London, UK. Sci. Total Environ. 2001, 279, 29–44. [Google Scholar] [CrossRef]
- Aarnio, P.; Yli-Tuomi, T.; Kousa, A.; Mäkelä, T.; Hirsikko, A.; Hämeri, K.; Räisänen, M.; Hillamo, R.; Koskentalo, T.; Jantunen, M. The concentrations and composition of and exposure to fine particles (PM2.5) in the Helsinki subway system. Atmos. Environ. 2005, 39, 5059–5066. [Google Scholar] [CrossRef]
- Chillrud, S.N.; Epstein, D.; Ross, J.M.; Sax, S.N.; Pederson, D.; Spengler, J.D.; Kinney, P.L. Elevated airborne exposures of teenagers to manganese, chromium, and iron from steel dust and New York City’s subway system. Environ. Sci. Technol. 2004, 38, 732–737. [Google Scholar] [CrossRef]
- Li, T.T.; Bai, Y.-H.; Liu, Z.R.; Liu, J.F.; Zhang, G.S.; Li, J.L. Air quality in passenger cars of the ground railway transit system in Beijing, China. Sci. Total Environ. 2006, 367, 89–95. [Google Scholar] [CrossRef]
- Chan, L.Y.; Lau, W.L.; Lee, S.C.; Chan, C.Y. Commuter exposure to particulate matter in public transportation modes in Hong Kong. Atmos. Environ. 2002, 36, 3363–3373. [Google Scholar] [CrossRef]
- Chan, L.Y.; Lau, W.L.; Zou, S.C.; Cao, Z.X.; Lai, S.C. Exposure level of carbon monoxide and respirable suspended particulate in public transportation modes while commuting in urban area of Guangzhou, China. Atmos. Environ. 2002, 36, 5831–5840. [Google Scholar] [CrossRef]
- Gómez-Perales, J.E.; Colvile, R.N.; Nieuwenhuijsen, M.J.; Fernández-Bremauntz, A.; Gutiérrez-Avedoy, V.J.; Páramo-Figueroa, V.H.; Blanco-Jiménez, S.; Bueno-López, E.; Mandujano, F.; Bernabé-Cabanillas, R.; et al. Commuters’ exposure to PM2.5, CO, and benzene in public transport in the metropolitan area of Mexico City. Atmos. Environ. 2004, 38, 1219–1229. [Google Scholar] [CrossRef]
- Xu, B.; Yu, X.; Gu, H.; Miao, B.; Wang, M.; Huang, H. Commuters’ exposure to PM2.5 and CO2 in metro carriages of Shanghai metro system. Transp. Res. Part D Transp. Environ. 2016, 47, 162–170. [Google Scholar] [CrossRef]
- Seaton, A.; Cherrie, J.; Dennekamp, M.; Donaldson, K.; Hurley, J.F.; Tran, C.L. The London underground: Dust and hazards to health. Occup. Environ. Med. 2005, 62, 355–362. [Google Scholar] [CrossRef] [PubMed]
- Yang, F.; Kaul, D.; Wong, K.C.; Westerdahl, D.; Sun, L.; Ho, K.-f.; Tian, L.; Brimblecombe, P.; Ning, Z. Heterogeneity of passenger exposure to air pollutants in public transport microenvironments. Atmos. Environ. 2015, 109, 42–51. [Google Scholar] [CrossRef]
- Yan, C.; Zheng, M.; Yang, Q.; Zhang, Q.; Qiu, X.; Zhang, Y.; Fu, H.; Li, X.; Zhu, T.; Zhu, Y. Commuter exposure to particulate matter and particle-bound PAHs in three transportation modes in Beijing, China. Environ. Pollut. 2015, 204, 199–206. [Google Scholar] [CrossRef]
- Moreno, T.; Reche, C.; Rivas, I.; Cruz Minguillon, M.; Martins, V.; Vargas, C.; Buonanno, G.; Parga, J.; Pandolfi, M.; Brines, M.; et al. Urban air quality comparison for bus, tram, subway and pedestrian commutes in Barcelona. Environ. Res. 2015, 142, 495–510. [Google Scholar] [CrossRef]
- Liu, W.T.; Ma, C.M.; Liu, I.J.; Han, B.C.; Chuang, H.C.; Chuang, K.J. Effects of commuting mode on air pollution exposure and cardiovascular health among young adults in Taipei, Taiwan. Int. J. Hyg. Environ. Health 2015, 218, 319–323. [Google Scholar] [CrossRef] [PubMed]
- Suarez, L.; Mesias, S.; Iglesias, V.; Silva, C.; Caceres, D.D.; Ruiz-Rudolph, P. Personal exposure to particulate matter in commuters using different transport modes (bus, bicycle, car and subway) in an assigned route in downtown Santiago, Chile. Environ. Sci. Process. Impacts 2014, 16, 1309–1317. [Google Scholar] [CrossRef] [PubMed]
- Lu, S.; Liu, D.; Zhang, W.; Liu, P.; Fei, Y.; Gu, Y.; Wu, M.; Yu, S.; Yonemochi, S.; Wang, X.; et al. Physico-chemical characterization of PM2.5 in the microenvironment of Shanghai subway. Atmos. Res. 2015, 153, 543–552. [Google Scholar] [CrossRef]
- Cusack, M.; Talbot, N.; Ondráček, J.; Minguillón, M.C.; Martins, V.; Klouda, K.; Schwarz, J.; Ždímal, V. Variability of aerosols and chemical composition of PM10, PM2.5 and PM1 on a platform of the Prague underground metro. Atmos. Environ. 2015, 118, 176–183. [Google Scholar] [CrossRef]
- Byeon, S.H.; Willis, R.; Peters, T.M. Chemical characterization of outdoor and subway fine (PM(2.5-1.0)) and coarse (PM(10-2.5)) particulate matter in Seoul (Korea) by computer-controlled scanning electron microscopy (CCSEM). Int. J. Environ. Res. Public Health 2015, 12, 2090–2104. [Google Scholar] [CrossRef]
- Feng, Y.; Mu, C.; Zhai, J.; Li, J.; Zou, T. Characteristics and personal exposures of carbonyl compounds in the subway stations and in-subway trains of Shanghai, China. J. Hazard. Mater. 2010, 183, 574–582. [Google Scholar] [CrossRef]
- Barmparesos, N.; Assimakopoulos, V.D.; Niki Assimakopoulos, M.; Tsairidi, E. Particulate matter levels and comfort conditions in the trains and platforms of the Athens underground metro. AIMS Environ. Sci. 2016, 3, 199–219. [Google Scholar] [CrossRef]
- Li, Z.; Che, W.; Frey, H.C.; Lau, A.K.H.; Lin, C. Characterization of PM2.5 exposure concentration in transport microenvironments using portable monitors. Environ. Pollut. 2017, 228, 433–442. [Google Scholar] [CrossRef]
- Ras, M.R.; Borrull, F.; Marcé, R.M. Sampling and preconcentration techniques for determination of volatile organic compounds in air samples. TrAC Trends Anal. Chem. 2009, 28, 347–361. [Google Scholar] [CrossRef]
- Gong, Y.; Wei, Y.; Cheng, J.; Jiang, T.; Chen, L.; Xu, B. Health risk assessment and personal exposure to Volatile Organic Compounds (VOCs) in metro carriages—A case study in Shanghai, China. Sci. Total Environ. 2017, 574, 1432–1438. [Google Scholar] [CrossRef]
- US EPA. Guidelines Exposure Assessment. 1992. Available online: https://www.epa.gov/risk/guidelines-exposure-assessment (accessed on 30 November 2016).
- Miekisch, W.; Kischkel, S.; Sawacki, A.; Liebau, T.; Mieth, M.; Schubert, J.K. Impact of sampling procedures on the results of breath analysis. J. Breath Res. 2008, 2, 026007. [Google Scholar] [CrossRef]
- Li, J.; Feng, Y.L.; Xie, C.J.; Huang, J.; Yu, J.Z.; Feng, J.L.; Sheng, G.Y.; Fu, J.M.; Wu, M.H. Determination of gaseous carbonyl compounds by their pentafluorophenyl hydrazones with gas chromatography/mass spectrometry. Anal. Chim. Acta 2009, 635, 84–93. [Google Scholar] [CrossRef] [PubMed]
- Xu, B.; Wu, Y.; Cui, P. Semi-analytical and computational investigation of different dust loading structures affecting the performance of a fibrous air filter. Particuology 2014, 13, 60–65. [Google Scholar] [CrossRef]
- Kam, W.; Cheung, K.; Daher, N.; Sioutas, C. Particulate matter (PM) concentrations in underground and ground-level rail systems of the Los Angeles metro. Atmos. Environ. 2011, 45, 1506–1516. [Google Scholar] [CrossRef]
- Shanghai Environmental Monitoring Center (SEMC), China. Available online: http://www.semc.gov.cn/aqi/home/English.aspx (accessed on 20 November 2016).
- Xu, B.; Cui, P.; Xu, H.; Chen, H.; Lin, Y. Commuter exposure to particle matter and carbon dioxide inside high-speed rail carriages. Transp. Res. Part D Transp. Environ. 2013, 20, 1–6. [Google Scholar] [CrossRef]
- Martins, V.; Moreno, T.; Mendes, L.; Eleftheriadis, K.; Diapouli, E.; Alves, C.A.; Duarte, M.; de Miguel, E.; Capdevila, M.; Querol, X.; et al. Factors controlling air quality in different European subway systems. Environ. Res. 2016, 146, 35–46. [Google Scholar] [CrossRef]
- Praml, G.; Schierl, R. Dust exposure in Munich public transportation: A comprehensive 4-year survey in buses and trams. Int. Arch. Occup. Environ. Health 2000, 73, 209–214. [Google Scholar] [CrossRef]
© 2019 by the authors. Licensee MDPI, Basel, Switzerland. This article is an open access article distributed under the terms and conditions of the Creative Commons Attribution (CC BY) license (http://creativecommons.org/licenses/by/4.0/).