Abstract
In most countries, PMV is the reference index for the assessment of thermal comfort conditions in mechanically conditioned environments. It is also the basis to settle input values of the operative temperature for heating and cooling load calculations, sizing of equipment, and energy calculations according to EN 16798-1 and 16798-2 Standards. Over the years, great effort has been spent to study the reliability of PMV, whereas few investigations were addressed to its calculation. To study this issue, the most significant apps devoted to its calculation have been compared with a reference software compliant with EN ISO 7730 and the well-known ASHRAE Thermal Comfort Tool. It has been revealed that only few apps consider all six variables responsible for the thermal comfort. Relative air velocity is not considered by ASHRAE Thermal Comfort Tool and, finally, the correction of basic insulation values due to body movements introduced by EN ISO 7730 and EN ISO 9920 Standards has only been considered in one case. This implies that most software and apps for the calculation of PMV index should be used with special care, especially by unexperienced users. This applies to both research and application fields.
1. Introduction
1.1. Background
The building stock in the world uses approximately 40% of the total energy and it is responsible for one third of the global greenhouse gases emissions [1,2]. As a consequence, achieving sustainable energy usage in buildings has received significant attention in the past years [2,3]. The requirements of high levels of Indoor Environmental Quality (IEQ) in terms of thermal, visual and acoustic comfort and indoor air quality may increase the energy demand. This means that especially thermal comfort conditions for occupants must be accurately calculated in designs of new buildings or refurbishments of existing buildings to evaluate the energy performance and safeguard the well-being of occupants [4,5,6,7].
In buildings with mechanical cooling, the basis for establishing thermal comfort criteria is the use of the PMV-PPD and local thermal discomfort indices [8,9,10]. PMV is also the basis for energy calculations, as underlined by European Standards EN 16798-1 [11] EN 16798-2 [12]. EN 16798-1 specifies indoor environmental input parameters for design and assessment of energy performance of buildings addressing IEQ, whereas EN 16798-2 explains how to use EN 16798-1 by specifying additional information as: (i) input parameters for building system design and energy performance calculations; (ii) methods for long term evaluation of the indoor environment; (iii) criteria for measurements which can be used if required to measure compliance by inspection; (iv) parameters to be used by monitoring and displaying the indoor environment in existing buildings. With reference to thermal comfort, EN 16798-1 suggests specific design ranges of operative temperature consistent with the desired level of environmental quality (see Table 1).

Table 1.
Temperature ranges for hourly calculation of cooling and heating energy for some indoor environment (Category II) according to EN 16798-1 and EN 16798-2 Standards [11,12]. Resultant insulation values Icl,r to be used [6] are 0.5 clo (cooling) and 1.0 clo (heating).
Finally, PMV is used for the attribution of the class of risk in the prevention of stress or discomfort in thermal working conditions according to ISO 15265 Standard [13,14], and in the field of the thermal bioclimate [15,16] where more specific metrics should be applied [17,18].
1.2. Open Issues about the Evaluation of PMV/PPD Indices
In the past, several studies have been undertaken to highlight the limitations of PMV in predicting thermal comfort conditions in naturally ventilated buildings (and in hot and humid climates) where adaptation phenomena have to be considered. Despite this interest that has led to the formulation of modified PMV indices (e.g., ePMV [19] and aPMV [20,21]), two issues remain unresolved in the scientific debate: the effect of measurement uncertainties and its calculation.
To calculate PMV and PPD indices, the evaluation/measurement of six variables are required: the air temperature, the mean radiant temperature, the relative humidity, the air velocity, the metabolic rate and finally the clothing insulation [8]. These quantities can be measured or evaluated according to the Standards in the field of the Ergonomics of the Thermal Environment [22,23,24,25].
Although technical Standards specify methods, protocol of measurement and accuracy levels [23], due to the sensitivity of PMV to each involved quantity, the uncertainty on its final value can reach 2–3 decimals points on the PMV scale (for each single input variable) as shown in Figure 1. This phenomenon might affect the category of the environmental quality as prescribed by ISO 7730 and EN 16798-1 (See Table 2). This implies that the most accurate measurement methods for the assessment of the variables should be used [26,27,28].
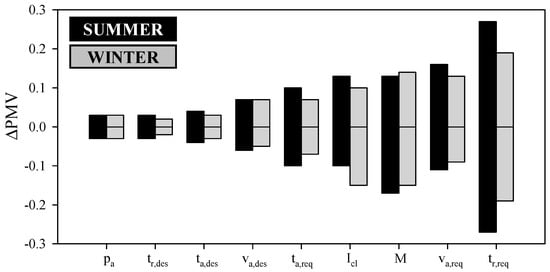
Figure 1.
PMV sensitivity (ΔPMV) to the accuracy of each quantity required for the thermal environment assessment according to ISO 7730 Standard [9] under thermal neutrality conditions (PMV = 0). M = 1.2 met [20]. “req” and “des” subscripts are referred to the required and desired accuracy levels prescribed by ISO Standard 7726 [23].
Table 2.
The classification proposed by ISO 7730 [9] and EN 16798-1 [11] Standards.
For calculating the PMV, ISO 7730 Standard reports two different procedures:
- Using tables in the ANNEX E of the Standard;
- Using the computer program in BASIC in the Annex A.
To obtain reliable results both procedures (see Figure 2) require some specific conditions often not clearly reported by standards or ignored even by skilled users [29].
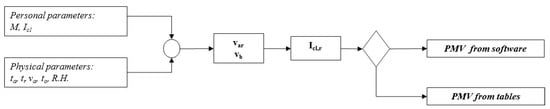
Figure 2.
Flow chart for the calculation of PMV as required by ISO 7730 Standard [9].
ISO 7730 explicitly states that PMV values given in tables in Annex E only apply to a relative humidity of 50%. However, slight deviations from this reference value do not affect significantly the PMV, due to the relatively small influence of humidity in Fanger’s thermal comfort model [30]. In addition, since the input value of tables is the operative temperature [9], the accuracy of PMV values is acceptable provided that the difference between air temperature ta and mean radiant temperature tr is less than 5 °C [6,9,31]. Although slight differences between mean radiant temperature and air temperature might result in negligible differences of PMV values, some problems occur in terms of environmental category assignment. As seen from Table 3, while keeping constant the operative temperature value, PMV index can vary as air temperature and mean radiant temperature vary. Consequently, the attribution of the environmental category becomes uncertain [9].
Table 3.
Effect of the operative temperature on the PMV evaluation. M = 1.2 met, va = 0.10 m/s, R.H. = 40% in winter (60% in summer), Icl,r = 1.0 clo in winter (0.5 clo in summer).
Another very important issue concerns the calculation of the PMV by software. Firstly, ISO 7730 requires the correction of the basic values of the clothing insulation related to the effect of body movements with the algorithms described in ISO 9920 Standard [9,22,32,33]. This is not the case of ASHRAE Standard 55 [10], because the correction is optional and restricted only for moving occupants with the following equation:
with the metabolic rate M expressed in met.
In addition, to evaluate the heat transfer coefficient by convection, ISO and ASHRAE algorithms require the relative air velocity var given by:
where vb is given by:
In short, the BASIC program in ISO 7730 requires additional information not clearly reported in the text with unforeseeable consequences in the implementation of software devoted to the calculation of the PMV as recently discussed by our team in a short communication devoted to Fanger’s equation [29]. In particular, the wrong calculation of PMV via software [29] results in uncertainties even greater than one point on the ASHRAE thermal sensation scale that is unacceptable if compared to the “physiological” uncertainty due to the measurement precision of input variables.
This applies not only to researchers and scientific studies but also to less skilled users performing the calculation of PMV during an inspection or auditing for conformity checking.
1.3. Aim of the Paper
50 years after Fanger’s studies, the PMV index remains the most used tool for the objective assessment of indoor thermal comfort. The index is used both for evaluation in existing buildings and in building simulations for the prediction of thermal comfort levels [34]. The lack of clear information in technical Standards and wrong interpretations of the standards [29,35,36,37] result in increased inaccuracy in its calculation. This also applies to microclimatic dataloggers provided with built-in software.
Until a few years ago ISO and ASHRAE software ran only on Windows platform. Today, the continuous innovation of smartphones and tablets with high performances and unique portability characteristics has favored the release of web applications (web apps) and specific applications for mobile devices (apps) for thermal comfort and heat stress assessment.
Based on the above, in this investigation the reliability and the compliance with International Standards of commonly used software, web apps and apps available in the stores will be verified. This will help both professionals and researchers in the correct use of such tools, which are designed under specific conditions that are often not clearly specified. Finally, the main findings from the present study will be useful for standardization aimed at verification/certification of software.
2. Methods
In this study we investigated the most popular apps available on the web and apps available on the market (Apple Store and Google Play), as summarized in Table 4.
Table 4.
Summary of web apps and apps used for the present investigation.
As reference for comparisons, we have used: (i) the values reported in the tables of the Annex E of ISO 7730 Standard; (ii) a software consistent with the code reported in Annex D of EN ISO 7730 Standard (TEE, Thermal Environment Evaluation) [29,43,44]; (iii) the well-known ASHRAE Thermal Comfort Tool [45] validated by ASHRAE and provided with a user-friendly interface for calculating thermal comfort parameters and making thermal comfort predictions.
The microclimatic conditions for comparisons have been based on standards EN 16798-1 and 2 [11,12] that recommend typical values of operative temperature for energy calculation for four categories of Indoor Environmental Quality (see Table 1). The air velocity value used for the investigation was 0.10 m s−1 because it is the minimum value accepted by the ASHRAE Thermal Comfort Tool (despite in several environments lower values can be observed), whereas reference relative humidity values were 40% (60%) for heating (cooling) according to EN 16798-1 [11].
The comparison phase consists of the following steps:
- PMV calculation
- Comparison among obtained results
- Analysis of inconsistent results
- Attribution of possible causes of inconsistencies
In Table 5 are reported more specific information strictly related to input and output variables considered by each software.
Table 5.
Input and output data for software and apps used for comparisons. (×) Included; (-) not included. 1 Input value for clothing is the resultant clothing insulation Icl,r. 2 Input value is the air speed. 3 Input value is a “generic” clothing level or value. 4 Input value is the relative air velocity, var. 5 Only specific values for the metabolic rate can be used (e.g., 1.2, 1.8 and 2.0 met). 6 Data sliders move with a random step. 7 Input value is a generic temperature (probably the air temperature). 8 Only one decimal value is accepted. 9 PMV value is rounded to one decimal place. 10 Only integer values are accepted. 11 This app returns only the value of PPD index according to and the sign of the thermal sensation. 12 Does not work on Android 4.4 and later based devices (data sliders do not appear).
It is important to emphasise that only apps A, B, E and F take into account all the variables required for the calculation of the PMV. Apps C and D do not consider the mean radiant temperature (or, probably, they assume ta = tr). This implies that they are not accurate in non-uniform environments (e.g., near windows or terminal units of HVAC systems) where the difference between air and mean radiant temperature may be significant [6]. The app C does not consider the air velocity and, similarly to the app G does not consider clothing insulation among input variables. In short, apps C, D and G are poorly designed due to the lack of one or more variable necessary to solve the heat balance equation on which PMV is based [7,9,29].
3. Results and Discussion
3.1. Uniform Environments (tr = ta)
In Table 6 are summarized the values of the PMV index calculated by means of all investigated apps for the operative temperature values in Table 1 and under homogeneous conditions (ta = tr = to). This hypothesis allows to investigate even apps C and D which consider only one temperature input value. No values have been reported for the app F because it crashes.
Table 6.
PMV values and comfort categories obtained with the investigated software and comparison with values from ISO 7730 tables. Relative velocity has been calculated according to Equation (2). (1) PMV value has been calculated by means of Equation (4). (2) It is not allowed changing the metabolic rate value.
According to output data of each app, PMV values reported in Table 6 are those directly obtained only for A, B and D. In case of the app E, which returns only the PPD and the sign of the thermal sensation, the PMV has been calculated from the standard equation [7,9]:
As the apps C and G return as output values only the description of the thermal state consistent with the ASHRAE 7-point thermal sensation scale [46,47], in these cases the PMV values were attributed by converting them into a thermal sensation vote (e.g., +1 for slightly warm, 0 for neutral and so on) [47].
From a quick analysis of data in Table 6 it seems that only the TEE, app B, and, partially, app E return values compliant with the ISO 7730 tables, especially if the comparison is based on the agreement of the environmental category. The difference between the values obtained by the TEE and the tables is often negligible and consistent with the different values of relative humidity used for our comparison.
The ASHRAE Thermal Comfort Tool and the web app A give values similar to those obtained by using a program consistent with ISO 7730 only at low metabolic rate (M = 1.2 met). At higher metabolic rate value (1.6 met), the PMV values are about 3–4 decimal points higher than those obtained by ISO 7730 tables. A reasonable explanation of this apparent inconsistency could be the input value used by the ASHRAE Comfort Tool for the air velocity. Particularly, the ASHRAE Comfort Tool requires as input value the air speed that, according to ASHRAE Standard 55 [10] is defined as “the rate of air movement at a point without regard to direction”. However, according to Fanger’s model [8,9], the input value for air velocity is the air velocity relative to the person which includes body movements as expressed by Equation (2). This implies that the overestimation of PMV values at higher metabolic rate could be related to the underestimation of the heat transfer by convection which occurs when air velocity does not take into account body movements.
To verify this hypothesis, we have analysed the difference between PMV values calculated with the ASHRAE Thermal Comfort Tool (PMVASHRAE) and by tables of the Annex E (PMV7730). The analysis has been carried out as a function of the operative temperature both in summer (Icl,r = 0.50 clo) and in winter (Icl,r = 1.0 clo) by using as input value the air velocity va and the relative air velocity var calculated by means of Equation (2). Obtained results are depicted in Figure 3.
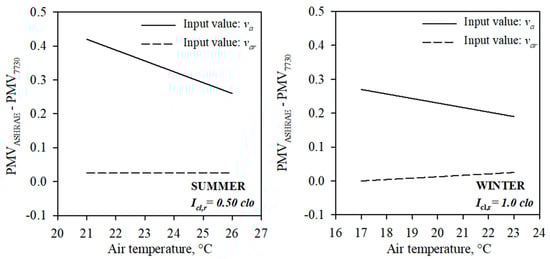
Figure 3.
Difference between PMV values calculated by means of the ASHRAE Thermal Comfort Tool and tables reported in the Annex E of ISO 7730 Standard by using as input value air velocity (continuous lines) and relative velocity (dashed lines). M = 1.6 met; ta = tr = to; va = 0.10 m s−1; RH = 50%.
All plots reported in Figure 3 clearly demonstrate that the ASHRAE Comfort Tool is consistent with tables of ISO 7730 Standard provided that the input value for air velocity is var. However, in the case of the wrong use of the input value of the air velocity, the overestimation of the PMV value varies from 0.26 to 0.42 in summer and from 0.19 to 0.27 in winter that is of the same order of magnitude of the effect of uncertainty due to the measurements of each microclimatic parameter [26,27].
3.2. Non-Uniform Environments (tr≠ta)
To verify the reliability of investigated software also under non-uniform conditions (tr ≠ ta), we have calculated the PMV index under the same operative temperature conditions summarized in Table 6 by applying slight differences between mean radiant temperature and air temperature (1 °C and 2 °C).
Results are summarized in Table 7 and show that only app B gives values consistent with those reported in ISO 7730 Standard and those obtained by the TEE. To the contrary, ASHRAE Thermal Comfort Tool and web app A are in agreement with each other only when the effects of the body movements are negligible as observed above (e.g., at low metabolic rate and in winter, when the contribution of the air boundary layer to the total clothing insulation is less significant).
Table 7.
PMV values and comfort categories obtained with the investigated software and comparison with values from ISO 7730 tables for the operative temperature values in Table 6 with (tr–ta) values of 1 °C and 2 °C. Apps C and D were not considered as they allow only one data input value for the temperature. (1) PMV value has been calculated by means of Equation (4).
3.3. Clothing Insulation Input Value
The last issue regarding the comparison is devoted to the verification of possible effects of the input value for the clothing insulation [22,32,33]. The PMV values under the microclimatic conditions in Table 6 have been calculated by using as input value the basic clothing insulation Icl instead of the resultant clothing insulation Icl,r as specifically required by ISO 7730 [9]. Results (see Table 8) clearly prove that PMV varies only for the app B, which is the only explicitly based on the basic clothing insulation (see Table 5). This means that only the software designed by the Lund University (B) is compliant with procedures reported in ISO 7730 Standard. Unlike ISO, the ASHRAE Thermal Comfort tool—consistently with ASHRAE 55 [10]—does not take into account both the adjustment of the basic clothing insulation and the relative air velocity, and, consequently, it returns higher PMV values. However, this software can be used provided that the input value for clothing is the resultant clothing insulation and the air speed input value is the relative velocity.
Table 8.
PMV values and comfort categories calculated with the investigated software and comparison with values from ISO 7730 tables. Relative velocity has been calculated according to Equation (2). (1) PMV value has been calculated by means of Equation (4). (2) It is not allowed changing the metabolic rate value.
3.4. Final Observations
In Table 9 precautions to be adopted when using all investigated software are briefly summarized.
Table 9.
Summary of precautions to be adopted when using investigated software or apps.
Unfortunately, no further discussion can be provided for the other investigated software because their algorithms and listings are not accessible to users.
These results also rise some interesting questions that cannot be easily answered:
- Is the assessment of thermal comfort conditions easy enough to be carried out merely with a software, without experience and ergonomic skills?
- Are smartphones suitable replacements for commercial equipment and able to measure all the needed physical variables (particularly, the air velocity and the mean radiant temperature)?
- With accurate commercial equipment, are the standards defined completely enough and clearly enough that non experts can assess thermal comfort accurately?
4. Conclusions
Software for the evaluation of thermal comfort conditions by means of PMV index, presently on the market, have to be used with special care. This is also for software designed by Academics and posted on Universities web pages in the absence of clear specifications for input values (e.g., the relative air velocity and the resultant clothing insulation). In addition, most apps do not consider one or more variables affecting the thermal sensation. Regarding the mean radiant temperature this means that calculated values of PMV index are reliable only in homogeneous environments (or in the presence of very small differences between air temperature and mean radiant temperature). This is not acceptable, especially in environments with large windows or close to HVAC terminal units.
Software developers should be aware that all computer programs available in annexes of international Standards give correct results only when all specifications are considered. In particular, ISO 7730 Standard requires that basic clothing insulation values have to be preliminary adjusted for wind and body movements.
Professional and experts should be aware of the risks related to the use of unvalidated evaluation tools. This is even more important in case of cold and hot environments, where the goal of the thermal environment assessment is the safety of working conditions.
The analysis reported in this paper is not able to provide further details about the reasons why some of the investigated software fail, because their code is inaccessible to the users (closed code).
This investigation has demonstrated that the unreliability of software/apps is mainly related to a wrong interpretation of International Standards and not to inaccurate coding. This implies that International Standards should be written to avoid ambiguous or undefined input parameters (i.e., relative air velocity) resulting in inaccurate tools.
Finally, this study has emphasized that the assessment of the thermal environments requires specific skills and robust tools. Software and apps are only the final step of the objective measurement of the variables responsible for the thermal sensation. This is another crucial issue, because all measurement devices required for the objective survey are impossible to miniaturize in a smartphone. However, beyond the intrinsic limitations of the PMV model and of measurement uncertainties, it is unthinkable that the main cause of unreliable assessments might be caused by poor software implementations of the standard.
Author Contributions
All authors contributed in equal amounts to the whole research activity here discussed. F.R.d.A. and B.I.P. designed this research; the numerical campaign has been carried out by G.R. and D.P., finally B.W.O. supervised, reviewed and edited the manuscript. All authors have read and agreed to the published version of the manuscript.
Funding
This research has been carried out within the “Renovation of existing buildings in NZEB vision (nearly Zero Energy Buildings)” Project of National Interest (Progetto di Ricerca di Interesse Nazionale - PRIN) funded by the Italian Ministry of Education, Universities and Research (MIUR), Protocol no. 2015S7E247_005.
Conflicts of Interest
The authors declare no conflict of interest.
Acronyms and Symbols
| Icl | Basic clothing insulation, m2 K W−1 or clo |
| Icl,r | Resultant clothing insulation adjusted for wind and body movements, m2 K W−1 or clo |
| M | Metabolic rate, W m−2 or met |
| nZEB | Nearly Zero Energy Buildings |
| pa | Water vapor partial pressure, Pa |
| RH | Relative humidity, % |
| PMV | Predicted Mean Vote, 1 |
| PMVASHRAE | PMV value calculated by means of the ASHRAE Thermal Comfort Tool, 1 |
| PMV7730 | PMV value calculated from tables in the Annex E of ISO 7730 Standard, 1 |
| PPD | Predicted Percentage of Dissatisfied, % |
| ta | Air temperature, °C |
| ta,des | Air temperature measured within desired accuracy prescribed by ISO 7726, °C |
| ta,req | Air temperature measured within required accuracy prescribed by ISO 7726, °C |
| to | Operative temperature, °C |
| tr | Mean radiant temperature, °C |
| tr,des | Mean radiant temperature measured within desired accuracy prescribed by ISO 7726, °C |
| tr,req | Mean radiant temperature measured within required accuracy prescribed by ISO 7726, °C |
| va | Absolute air velocity, m s−1 |
| va,des | Absolute air velocity measured within desired accuracy prescribed by ISO 7726, m s−1 |
| var | Relative air velocity, m s−1 |
| va,req | Absolute air velocity measured within required accuracy prescribed by ISO 7726, m s−1 |
| vb | Velocity due to body movement, m s−1 |
References
- Buildings Performance Institute Europe. Europe’s Buildings under the Microscope; Buildings Performance Institute Europe: Brussels, Belgium, 2011. [Google Scholar]
- Ruparathna, R.; Hewage, K.; Sadiq, R. Improving the energy efficiency of the existing building stock: A critical review of commercial and institutional buildings. Renew. Sustain. Energy Rev. 2016, 53, 1032–1045. [Google Scholar] [CrossRef]
- Parliament of the European Union. Council directive of 16 December 2002 on the energy performance of buildings (2002/91/EC). Off. J. Eur. Commun. 2003, 1, 65–71. [Google Scholar]
- Parliament of the European Union. Directive 2018/844/EU of the European Parliament and of the council of 30 may 2018 amending directive 2010/31/EU on the energy performance of buildings and directive 2012/27/EU on energy efficiency. Off. J. Eur. Commun. 2018, 156, 75–91. [Google Scholar]
- US Environmental Protection Agency. Available online: https://www.epa.gov/sites/production/files/2015-08/documents/vision.pdf (accessed on 25 November 2019).
- d’Ambrosio Alfano, F.R.; Olesen, B.W.; Palella, B.I.; Riccio, G. Thermal comfort: Design and assessment of energy saving. Energy Build. 2014, 81, 326–336. [Google Scholar] [CrossRef]
- De Santoli, L.; Garcia, D.A.; Groppi, D.; Bellia, L.; Palella, B.I.; Riccio, G.; Cuccurullo, G.; d’Ambrosio Alfano, F.R.; Stabile, L.; Dell’Isola, M.; et al. A general approach for retrofit of existing buildings towards NZEB: The windows retrofit effects on indoor air quality and the use of low temperature district heating. In Proceedings of the 2018 IEEE International Conference on Environment and Electrical Engineering and 2018 IEEE Industrial and Commercial Power Systems Europe, EEEIC/I and CPS Europe 2018, Palermo, Italy, 12–15 June 2018. [Google Scholar] [CrossRef]
- Fanger, P.O. Thermal Comfort; Danish Technical Press: Copenhagen, Denmark, 1970. [Google Scholar]
- ISO. ISO Standard 7730. Ergonomics of the Thermal Environment—Analytical Determination and Interpretation of Thermal Comfort Using Calculation of the PMV and PPD Indices and Local Thermal Comfort; International Organization for Standardization: Geneva, Switzerland, 2005. [Google Scholar]
- ASHRAE. ANSI/ASHRAE Standard 55. Thermal Environmental Conditions for Human Occupancy; American Society of Heating, Refrigerating and Air Conditioning Engineers: Atlanta, GA, USA, 2017. [Google Scholar]
- CEN EN Standard 16798-1. Indoor Environmental Input Parameters for Design and Assessment of Energy Performance of Buildings Addressing Indoor Air Quality, Thermal Environment, Lighting and Acoustics—Module M1-6; European Committee for Standardization: Brussels, Belgium, 2019. [Google Scholar]
- CEN EN Standard 16798-2. Energy Performance of Buildings—Ventilation for Buildings—Part. 2: Interpretation of the Requirements in EN 16798-1—Indoor Environmental Input Parameters for Design and Assessment of Energy Performance of Buildings Addressing Indoor Air Quality, Thermal Environment, Lighting and Acoustics—Module M1-6; European Committee for Standardization: Brussels, Belgium, 2019. [Google Scholar]
- ISO. ISO Standard 15265. Ergonomics of the Thermal Environment—Risk Assessment Strategy for the Prevention of Stress or Discomfort in Thermal Working Conditions; International Organization for Standardization: Geneva, Switzerland, 2004. [Google Scholar]
- d’Ambrosio Alfano, F.R.; Palella, B.I.; Riccio, G. On the transition thermal discomfort to heat stress as a function of the PMV value. Ind. Health 2013, 51, 285–296. [Google Scholar] [CrossRef]
- Matzarakis, A.; Rutz, F.; Mayer, H. Modelling radiation fluxes in simple and complex environments—Application of the RayMan model. Int. J. Biometeorol. 2007, 51, 323–334. [Google Scholar] [CrossRef]
- de Freitas, C.R.; Grigorieva, E.A. A comprehensive catalogue and classification of human thermal climate indices. Int. J. Biometeorol. 2015, 59, 109–120. [Google Scholar] [CrossRef]
- Hoppe, P. The physiological equivalent temperature—A universal index for the biometeorological assessment of the thermal environment. Int. J. Biometeorol. 1999, 43, 71–75. [Google Scholar] [CrossRef]
- Bröde, P.; Błazejczyk, K.; Fiala, D.; Havenith, G.; Holmér, I.; Jendritzky, G.; Kuklane, K.; Kampmann, B. The universal thermal climate index UTCI compared to ergonomics standards for assessing the thermal environment. Ind. Health 2013, 51, 16–24. [Google Scholar] [CrossRef]
- Fanger, P.O.; Toftum, J. Extension of the PMV model to non-air-conditioned buildings in warm climates. Energy Build. 2002, 34, 533–536. [Google Scholar] [CrossRef]
- Yao, R.; Li, B.; Liu, J. A theoretical adaptive model of thermal comfort—Adaptive predicted mean vote (aPMV). Build. Environ. 2009, 44, 2089–2096. [Google Scholar] [CrossRef]
- Carlucci, S.; Bai, L.; de Dear, R.; Yang, L. Review of adaptive thermal comfort models in built environmental regulatory documents. Build. Environ. 2018, 137, 73–89. [Google Scholar] [CrossRef]
- ISO. ISO Standard 9920. Ergonomics of the Thermal Environment—Estimation of the Thermal Insulation and Evaporative Resistance of a Clothing Ensemble; International Organization for Standardization: Geneva, Switzerland, 2009. [Google Scholar]
- ISO. ISO Standard 7726. Ergonomics of the Thermal Environment—Instruments for Measuring Physical Quantities; International Organization for Standardization: Geneva, Switzerland, 1998. [Google Scholar]
- ISO. ISO Standard 8996. Ergonomics of the Thermal Environment—Determination of Metabolic Rate; International Organization for Standardization: Geneva, Switzerland, 2004. [Google Scholar]
- Malchaire, J.; d’Ambrosio Alfano, F.R.; Palella, B.I. Evaluation of the metabolic rate based on the recording of the heart rate. Ind. Health 2017, 55, 219–232. [Google Scholar] [CrossRef] [PubMed]
- d’Ambrosio Alfano, F.R.; Palella, B.I.; Riccio, G. The role of measurement accuracy on the thermal environment assessment by means of PMV index. Build. Environ. 2011, 46, 1361–1369. [Google Scholar] [CrossRef]
- Ricciu, R.; Galatioto, A.; Desogus, G.; Besalduch, L.A. Uncertainty in the evaluation of the Predicted Mean Vote index using Monte Carlo analysis. J. Environ. Manag. 2018, 223, 16–22. [Google Scholar] [CrossRef]
- d’Ambrosio Alfano, F.R.; Dell’Isola, M.; Palella, B.I.; Riccio, G.; Russi, A. On the measurement of the mean radiant temperature and its infuence on the indoor thermal environment assessment. Build. Environ. 2013, 63, 79–88. [Google Scholar] [CrossRef]
- d’Ambrosio Alfano, F.R.; Palella, B.I.; Riccio, G.; Toftum, J. Fifty years of Fanger’s equation: Is there anything to discover yet? Int. J. Ind. Ergon. 2018, 66, 157–160. [Google Scholar] [CrossRef]
- Fanger, P.O. Air humidity, Comfort and Health. In Proceedings of the CISCO-ITBTP Seminar Humidity in building, Saint Remy les Chevreuse, France, November 1982; pp. 192–195. [Google Scholar]
- Alfano, G.; Cannistraro, G.; d’Ambrosio, F.R.; Rizzo, G. Notes on the use of the tables of standard ISO 7730 for the evaluation of the PMV index. Indoor Built Environ. 1996, 5, 355–357. [Google Scholar] [CrossRef]
- Havenith, G.; Nilsson, H. Correction of clothing insulation for movement and wind effects, a meta-analysis. Eur. J. Appl. Physiol. 2004, 92, 636–640. [Google Scholar] [CrossRef]
- d’Ambrosio Alfano, F.R.; Palella, B.I.; Riccio, G.; Malchaire, J. On the effect of thermophysical properties of clothing on the heat strain predicted by PHS model. Ann. Occup. Hygiene 2016, 60, 231–251. [Google Scholar] [CrossRef]
- U.S. Department of Energy’s (DOE) Building Technologies Office (BTO). EnergyPlus 9.2.0. 2019. Available online: https://www.energyplus.net/sites/default/files/docs/site_v8.3.0/EMS_Application_Guide/EMS_Application_Guide/index.html (accessed on 19 November 2019).
- Broday, E.E.; de Paula Xavier, A.A.; de Oliveira, R. Comparative analysis of methods for determining the metabolic rate in order to provide a balance between man and the environment. Int. J. Ind. Ergon. 2014, 44, 570–580. [Google Scholar] [CrossRef]
- Broday, E.E.; de Paula Xavier, A.A.; de Oliveira, R. Comparative analysis of methods for determining the clothing surface temperature (tcl) in order to provide a balance between man and the Environment. Int. J. Ind. Ergon. 2017, 57, 80–87. [Google Scholar] [CrossRef]
- Broday, E.E.; Moreto, J.A.; Xavier, A.A.D.P.; de Oliveira, R. The approximation between thermal sensation votes (TSV) and predicted mean vote (PMV): A comparative analysis. Int. J. Ind. Ergon. 2019, 69, 1–8. [Google Scholar] [CrossRef]
- Center for the Built Environment, University of California Berkeley. CBE Thermal Comfort Tool. Available online: http://comfort.cbe.berkeley.edu/ (accessed on 19 November 2019).
- Schiavon, S.; Hoyt, T.; Piccioli, A. Web application for thermal comfort visualization and calculation according to ASHRAE Standard 55. Build. Simul. 2014, 7, 321–334. [Google Scholar] [CrossRef]
- Lund University Faculty of Engineering. JAVA Applet for ISO 7730 Calculation of Predicted Mean Vote (PMV), and Predicted Percentage Dissatisfied (PPD), PMV 2008 Ver 1.0. Available online: http://www.eat.lth.se/fileadmin/eat/Termisk_miljoe/PMV-PPD.html (accessed on 19 November 2019).
- Lee, M.C.; Mui, K.W.; Wong, L.T.; Chan, W.Y.; Lee, E.W.M.; Cheung, C.T. Student learning performance and indoor environmental quality (IEQ) in air-conditioned university teaching rooms. Build. Environ. 2012, 49, 238–244. [Google Scholar] [CrossRef]
- Mui, K.W.; Wong, L.T.; Cheung, C.T.; Yu, H.C. An application-based indoor environmental quality (IEQ) calculator for residential buildings. Int. J. Arch. Environ. Eng. 2015, 9, 822–825. [Google Scholar]
- d’Ambrosio Alfano, F.R.; Palella, B.I.; Riccio, G. TEE (thermal environment assessment): A friendly tool for thermal environment evaluation. In Proceedings of the 11th International Conferences on Environmental Ergonomics, Ystad, Sweden, 22–26 May 2005; pp. 503–506. [Google Scholar]
- d’Ambrosio Alfano, F.R.; Palella, B.I.; Riccio, G. Notes on the implementation of the IREQ model for the assessment of extreme cold environments. Ergonomics 2013, 56, 707–724. [Google Scholar] [CrossRef]
- American Society of Heating, Refrigerating and Air Conditioning Engineers. ASHRAE Thermal Comfort Tool Version 2; American Society of Heating, Refrigerating and Air Conditioning Engineers: Atlanta, GA, USA, 2013. [Google Scholar]
- ISO. ISO Standard 10551. Ergonomics of the Thermal Environment—Subjective Judgement Scales for Assessing Physical Environments; International Organization for Standardization: Geneva, Switzerland, 2019. [Google Scholar]
- American Society of Heating, Refrigerating and Air Conditioning Engineers. Thermal comfort. In ASHRAE Handbook of Fundamentals; American Society of Heating, Refrigerating and Air Conditioning Engineers: Atlanta, GA, USA, 2017. [Google Scholar]


© 2019 by the authors. Licensee MDPI, Basel, Switzerland. This article is an open access article distributed under the terms and conditions of the Creative Commons Attribution (CC BY) license (http://creativecommons.org/licenses/by/4.0/).