Abstract
Wetlands store a large amount of carbon (C) and many are vulnerable to potential global warming. It is critical to quantify the temperature sensitivity of soil nitrogen (N) and C mineralization in response to external labile C or N addition in different types of wetland. Through incubation experiments, the effects of temperature and the addition of N or C on soil C and N mineralization were tested using soils from the Sanjiang Plain wetland (SW), Zoigê alpine wetland (ZW), Yellow River estuary wetland (YW), and Baiyangdian Lake (BL). Our findings showed that temperature, available C and wetland type were dominant factors in the regulation of soil C loss, with soil C in SW and ZW being less stable and poorly resistant to increases in temperature. The response of net N mineralization to N addition showed regional differences. A lack of long-term effects of the deposition of N on soil mineralization suggested that there may be a particular N addition threshold level for changed C and N mineralization. It is predicted that an increase in labile C supply due to elevated carbon dioxide (CO2) and its interactions with wetland types will increase CO2 efflux more than N deposition in wetland soils.
1. Introduction
The decomposition of soil organic matter (SOM) releases carbon dioxide (CO2) and nitrogen compounds into the soil and atmospheric environment, which is mainly influenced by the soil microenvironment, the properties of the substrate and nutrient availability to the microbes in the soil [1,2,3]. Ongoing global changes such as global warming and nitrogen (N) deposition possibly affect the mineralization of SOM by altering the factors discussed above. For instance, enhanced temperature can change the microbial abundance and increase microbial activity to enhance CO2 flux, resulting in global warming by producing a positive feedback loop [2,3]. Higher soil temperatures and N deposition may be associated with greater increases in available N in the soil, subsequently leading to an increase in plant growth, as many terrestrial ecosystems are N limited, and thus enhancing the sequestration of CO2 and altering the quantity and quality of substrate input to the soil [4,5,6]. The changes in nutrient availability in the soil will, in turn, influence SOM mineralization and regulate the C balance in terrestrial ecosystems.
Temperature is known to regulate almost all microbial-mediated processes in soil, such as C and N mineralization, etc. [2,3,7]. A number of studies have reported increases in SOM mineralization with increased temperatures [7,8,9]. Substrate availability is an important factor affecting SOM decomposition [10]. Labile C, such as dissolved organic carbon (DOC) and microbial biomass C mainly composed of low molecular weight organic compounds, acts as an energy source and a substrate to drive the growth and activity of microbes. It is used in early decomposition processes and is depleted first; the more complex C dominates the later stages [11]. Consequently, adding labile C to soil can lead to greater soil microbial biomass and respiration. Furthermore, increased microbial biomass stimulates microbial demand for N and the immobilization of available N [12]. Thus, in N-limited soil, as N mineralization is characterized by soil microbe immobilization, N addition increases the availability of N in soil and promotes microbial growth, which may enhance the decomposition and mineralization of soil organic C (SOC) and organic N, producing a positive excitation effect [13,14]. In contrast, it has also been reported that the addition of N has neutral [15] and negative [16,17,18] effects on SOM mineralization, depending on the ecosystem type and soil properties.
Although studies on the correlation between CO2 efflux and net N mineralization rate have been widely conducted, the results were complex and contradictory, and largely depended on C and N availability and the soil C:N ratio [19,20,21]. When the organic matter input into the soil has a lower C:N ratio, microorganisms are less limited by N, which will lead to more mineralization of organic N than immobilization, resulting in a positive relationship between soil C to N mineralization [22]. However, substrates containing a higher C:N ratio often promote microbial communities which are severely N-limited and show more N immobilization to meet their needs in N-limited soils, leading to a negative correlation between soil C and N mineralization [23].
Wetland soils are of particular interest when considering sensitivity to global warming, storing 25–30% of the terrestrial SOC pool in 5–8% of the terrestrial area [24]. The response of soil mineralization to global change (rising temperatures and increased N deposition) may differ among various wetland types, as the litterfall quality and quantity and soil physical and chemical properties vary widely. How soil mineralization alters with wetland type and climate change is worthy of comprehensive assessment. We studied four wetland soils from different regions in China to investigate soil CO2 flux and net N mineralization rate in response to temperature, wetland type, and N or C addition, thereby determining the mechanisms affecting mineralization. We hypothesized that (1) the temperature sensitivity of soil mineralization in different wetland types would respond to N or C addition differently, and the addition of N or C would lead to high temperature sensitivity of mineralization (compared with the control); (2) the correlation between soil CO2 flux and N mineralization would be negative, as N mineralization is characterized by soil microbe immobilization in N-limited soil, while external N or C addition would shift the relationship from negative to positive, which may be driven mainly by the excitation effect.
2. Materials and Methods
2.1. Experimental Sites
The soil samples were collected from four wetlands in different geographical locations in China: Sanjiang Plain wetland (SW), Zoigê alpine wetland (ZW), Yellow River estuary wetland (YW) and Baiyangdian Lake (BL) (Figure 1). SW, located in China’s northeast corner (47°35′ N, 133°31′ E) is the largest natural peat wetland, where the thickness of the peat layer is generally about 3–17 m [25]. The mean annual temperature and precipitation in this region are approximately 1.9 °C and 600 mm, respectively. Calamagrostis angustifolia and Carex lasiocarpa are dominant plant communities in SW. ZW, in the eastern region of the Tibetan Plateau, is recognized as one of the world’s largest alpine wetlands. The Tibetan Plateau covers nearly one-quarter of China’s land area and is regarded as “the roof of the world” and “the third pole”. It has the highest average altitude in the world (3452 m above sea level) and is sensitive to climate change [26]. The mean annual temperature and precipitation in this area are approximately 1.4 °C (min: −10.6 °C in January, max: 10.8 °C in July) and 700 mm, respectively [22]. The soil here is peaty, acidic, and rich in organic C, with a peat layer thickness of 2–5 m, on average [27]. Carex muliensis and C. lasiocarpa are dominant plant communities in peatland. In general, long cold winters and short, cool summers characterize the climate in SW and ZW, given their relatively high latitude and high altitude, respectively. YW and BL are in Shandong Province and Hebei Province, respectively. BL is an inland lake; both are in the south of North China, where the mean annual temperature is 12.1 °C and the climate is warm. Phragmites australis is a dominant plant in YW and BL. It varies geographically due to soil substrate quantity and quality, nutrient availability, location, altitude and soil climate, i.e., temperature and precipitation across the four wetland ecosystems (Table 1 and Table 2). The soil SOC, labile C, and C:N ratio were higher in SW and ZW than in YW and BL, but the pH and microbial biomass C:N were similar in the four wetlands (Table 2).
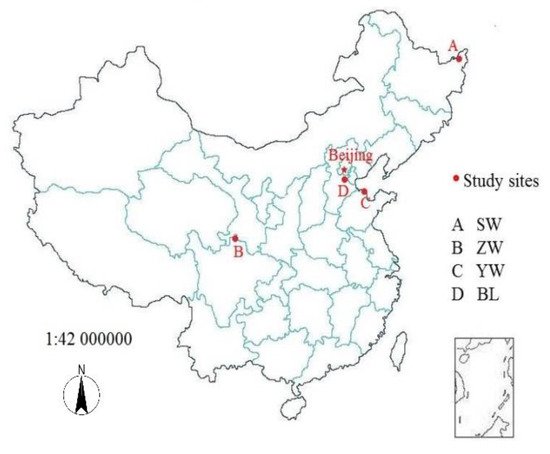
Figure 1.
Locations of Sanjiang Plain wetland (SW), Zoigê alpine wetland (ZW), Yellow River estuary wetland (YW), Baiyangdian Lake (BL) from different regions of China.

Table 1.
Research overview of four study sites. SW: Sanjiang Plain wetland; ZW: Zoigê alpine wetland; YW: Yellow River estuary wetland; BL: Baiyangdian Lake.
Table 2.
Initial physical-chemical properties in the top 15 cm at the four sampling sites (Mean ± SE). SW: Sanjiang Plain wetland; ZW: Zoigê alpine wetland; YW: Yellow River estuary wetland; BL: Baiyangdian Lake.
2.2. Soil Samples and Analyses
Surface litter was first carefully removed from the ground and twelve soil cores, 0–15 cm in depth, were randomly collected at each location from 12 random points along 3 arbitrarily laid transects using 3.5 cm diameter corers. The four soil cores from each region were mixed together in the laboratory, and composite samples were replicated three times. The composite samples were passed through a 2 mm sieve to remove any roots and stones. These sieved samples were used to measure the wetland soil physicochemical characteristics, including soil water content, pH, and inorganic N among others, with the remaining samples stored at 4 °C for the incubation experiment.
Soil water content and pH were measured using the oven-drying method (at 105 °C, for 8 h) and the potential method, respectively. The NH4+-N and NO3−-N in soil were extracted with 2 mol L−1 KCl using a rotary shaker for 1 h. After centrifugation, the supernatant was filtered through filter paper, and the filtrates were analyzed by colorimetry analysis using a continuous flow injection analyzer (Seal AutoAnalyzer 3, Seal Analytical, Norderstedt, Germany). Total N was determined using the Kjeldahl method after wet digestion with sulfuric acid. DOC was extracted from the fresh soil samples (equivalent to 20 g oven-dried) with 60 ml deionized water (1:3 soil: water ratio) on a rotary shaker for 1 h. After centrifugation (4000 rpm for 20 min), the supernatants were filtered through 0.45-μm filter paper (Whatman, Clifton NJ, USA), and the filtrates were then analyzed for DOC using a Jena multi N/C 3100 analyzer (Germany). TC was measured by the dry combustion method (Multi N/C 2100 Analyser, Analytik Jena, Germany). Soil microbial biomass was determined using a chloroform fumigation-extraction method [28]. Soil microbial biomass C and DOC are important components of labile C [3]. The soil water content was considered in the calculation of the soil analysis results.
2.3. Soil Incubation Experiment
A 4 × 3 × 2 × 2 × 3 factorial experiment was established corresponding to four wetland types, three incubation temperatures, two levels of C or N addition, and three replicates. The two levels of C addition were 2 (C1) and 10 (C2) mg glucose (C6H12O6)-C g−1 soil, respectively. The two levels of nitrogen addition were 0.005 (N1) and 0.025 (N2) mg NH4NO3-N g−1 soil according to the mean mineralized N level in the wetland soil, respectively. For each of the treatments, 30 g of air-dried soil was evenly distributed into 250 mL airtight Schott jars and incubated at 5, 15 and 25 °C for 28 days. Soil moisture was periodically adjusted in each soil sample to a water holding capacity of 60% throughout the incubation period, as this is commonly considered to be the most suitable for microbial respiration [29]. A small cup filled with 25 mL of 1 mol L−1 NaOH was placed in the jar to trap the released CO2. Additions of glucose and NH4NO3 were dissolved in 10 mL of deionized water and sprayed evenly on the soil surface with a sprayer, and 10 mL of deionized water was sprayed on the control to reduce the impact of water on the samples. In addition, at each temperature, a series of NaOH solutions in the Schott jars without soil were also titrated in order to determine the amount of CO2 from the atmosphere enclosed in the bottles. On the 1st, 3rd, 5th, 7th, 14th, 21st, and 28th days, the CO2-trapped small cups were replaced with new cups. The amount of remaining NaOH was titrated with a standard HCl solution by adding BaC12; then, the amount of CO2 released was calculated according to the amount of NaOH solution that had been consumed. Finally, the soil respiration rate was expressed as the total amount of CO2 released during the incubation days divided by the number of days of incubation and soil mass. The net N mineralization rate was calculated as the difference between NH4+-N and NO3−-N before and after soil incubation divided by the number of days of incubation and soil mass. The relationship between soil mineralization rate and temperature was calculated as follows [30]:
where CMRd is the soil CO2 flux or net N mineralization; CMR0 is the soil CO2 flux or net N mineralization at 0 °C; T is the incubation temperature (°C); and b is a temperature reaction coefficient. The temperature sensitivity Q10 was calculated as follows:
2.4. Statistical Analysis
SPSS 22.0 software (IBM Corp., Armonk, NY, USA) was used for statistical analyses. Statistical results were significant when p < 0.05. A repeated-measures ANOVA (analysis of variance) was used to analyze the effects of temperature, the N or C addition, and their interactions on soil CO2 efflux over time (the blocking factor). Differences in the temperature sensitivity response of C or N mineralization rate, labile C, and net N mineralization rate to N or C addition (three treatments) among the four wetland soils were examined using separate one-way ANOVAs and Tukey’s honestly significant difference (HSD) test. Linear regressions were used to quantify the relationship between soil CO2 efflux and the net N mineralization rate following the addition of N and C to the wetland soils.
3. Results
3.1. The Positive Response of Soil CO2 Flux to Temperature and N or C Addition
In the four wetland soils, the SOM mineralization rate decreased and the cumulative CO2 efflux increased over time during the incubation period (Figure A1 and Figure 2). The cumulative CO2 efflux was promoted with increases in incubation temperature (Figure 2). However, the temperature had different promoting effects on different types of wetland soils: the strongest effect occurred in the SW, for which the cumulative CO2 efflux at 15 °C and 25 °C was respectively 62% and 124% higher than that at 5 °C for the CK treatment (Figure 2). In contrast, the cumulative CO2 efflux at 15 °C and 25 °C was significantly increased by 40% and 86% in ZW, by 20% and 62% in YW, and by 23% and 58% in BL, respectively, and were higher than that at 5 °C for the CK treatment (Figure 2). The sensitivity responses of CO2 efflux to temperature (expressed by Q10) in soils from SW and ZW were 1.516 and 1.474, respectively, with both being significantly higher than those from YW and BL (1.201 and 1.227) for the CK treatment (Table 3).

Figure 2.
Cumulative CO2 efflux four wetland soils with or without addition of NH4NO3 (N1 and N2) or glucose (C1 and C2) incubated at 5, 15, and 25 °C (SW: Sanjiang Plain wetland; ZW: Zoigê alpine wetland; YW: Yellow River estuary wetland; BL: Baiyangdian Lake). CK: The control without C or N addition; N1: 0.005 mg N g−1 soil; N2: 0.025 mg and N g−1 soil; C1: 2 mg C g−1 soil; C2: 10 mg C g−1 soil.
Table 3.
Temperature reaction coefficient b and Q10 value based on soil CO2 flux and N mineralization rate in four wetland soils with or without N or C addition in China (Mean ± SE). SW: Sanjiang Plain wetland; ZW: Zoigê alpine wetland; YW: Yellow River estuary wetland; BL: Baiyangdian Lake. CK: The control without C or N addition; N1: 0.005 mg N g−1 soil; N2: 0.025 mg N g−1 soil; C1: 2 mg C g−1 soil; C2: 10 mg C g−1 soil.
The addition of C (C1 and C2) significantly affected the CO2 efflux; this was consistently greater for the C2 addition than the C1 addition. The average CO2 efflux was increased by 0.34, 0.22, 0.09 and 0.09 mg C kg−1 d−1 in SW, ZW, YW and BL soils, respectively (Figure 2). Considering the CO2 efflux in all four wetlands, a positive response of CO2 flux to temperature and C addition was found, yet there was no significant interaction between temperature and C addition. External N addition did not significantly change in CO2 efflux (Figure 2, Table 4). The differences in the CO2 efflux from these four wetland soils due to temperature and N addition levels were also found to be insignificant (Table 4). The Q10 value of soil CO2 flux following labile C addition was significantly higher than that of the CK and N addition in the four wetland soils (Table 3), indicating that the labile external C supply increased the sensitivity of SOM decomposition to temperature.
Table 4.
Repeated measures ANOVA analysis for the effects of temperature, N or C treatments on mean CO2-C efflux from different wetland soil (T: temperature; N: N addition; C: C addition). SW: Sanjiang Plain wetland; ZW: Zoigê alpine wetland; YW: Yellow River estuary wetland; BL: Baiyangdian Lake.
3.2. Different Response of Net N Mineralization Rate to Temperature and N or C Addition
The soil net N mineralization rate increased at higher incubation temperatures in YW and BL, a result consistent with their CO2 efflux, whereas it decreased with higher incubation temperatures in SW and ZW (Figure 3). The Q10 values of the net N mineralization rates in response to temperature in SW and ZW were 1.563 and 1.552, respectively, i.e., significantly higher than those in YW and BL (Table 3).
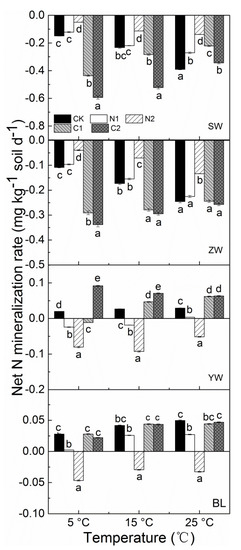
Figure 3.
Net N mineralization rate under different temperature, N or C treatments from different wetland soil (SW: Sanjiang Plain wetland; ZW: Zoigê alpine wetland; YW: Yellow River estuary wetland; BL: Baiyangdian Lake) (CK: The control without C or N addition; N1: 0.005 mg N g−1 soil; N2: 0.025 mg N g−1 soil; C1: 2 mg C g−1 soil; C2: 10 mg C g−1 soil). Means with different lowercase letters within different treatment types of same temperature are significantly different at p < 0.05.
The soil net N mineralization rate was significantly increased by N addition, especially in SW and ZW, but this reduced the net N mineralization rate in YW and BL (Figure 3). On average, it increased from −0.15 to −0.07 mg kg−1 soil d−1 in SW and from −0.11 to −0.06 mg kg−1 soil d−1 in ZW following N addition at 5 °C, whereas the soil net N mineralization rate significantly decreased from an average of 0.02 to −0.05 mg kg−1 soil d−1 in YW and from 0.03 to −0.02 mg kg−1 soil d−1 in BL under the same conditions (Figure 3). The addition of N had a significant effect on the Q10 value for soil net N mineralization rate in SW and ZW, while the difference in the Q10 value between the control and N addition was insignificant (Table 3).
3.3. Relationship of Soil CO2 Flux to Net N Mineralization Rate
Soil CO2 flux was negatively correlated with net N mineralization rate in the CK and N addition treatments in SW and ZW; however, after C addition, this negative correlation changed to a positive one. However, in YW and BL, a positive correlation between CO2 flux and net N mineralization rate was found in the CK and C addition treatments, but this relationship was no longer apparent when N was added (Figure 4, Table 5).
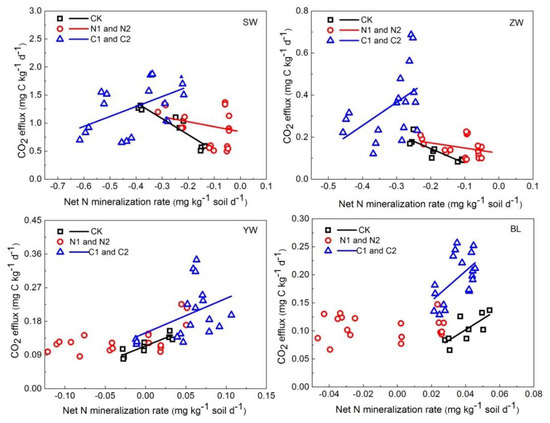
Figure 4.
Relationships between CO2 efflux and net N mineralization rate in four wetland soils with or without addition of NH4NO3 (N1 and N2) or glucose (C1 and C2) incubated at 5, 15, and 25 °C (CK: the control without C or N addition; N1: 0.005 mg N g−1 soil; N2: 0.025 mg N g−1 soil; C1: 2 mg C g−1 soil; C2: 10 mg C g−1 soil; SW: Sanjiang Plain wetland; ZW: Zoigê alpine wetland; YW: Yellow River estuary wetland; BL: Baiyangdian Lake).
Table 5.
Line equations between soil CO2 efflux and net N mineralization rate under N or C addition incubated at 5, 15, and 25 °C in four wetland soils (CK: the control without C or N addition; N1: 0.005 mg N g−1 soil; N2: 0.025 mg N g−1 soil; C1: 2 mg C g−1 soil; C2: 10 mg C g−1 soil; SW: Sanjiang Plain wetland; ZW: Zoigê alpine wetland; YW: Yellow River estuary wetland; BL: Baiyangdian Lake).
3.4. The Response of Soil Labile C to Temperature, Labile C and N Addition
In postincubated soils, soil labile C in SW and ZW was 1272.17 and 1046.06 mg kg−1, respectively, and was lower in YW (128.92 mg kg−1) and BL (165.37 mg kg−1) (Figure 5). Generally, labile C significantly decreased with increasing the temperature in the four wetland soils, and C and N addition did not influence the trend in labile C with temperature.
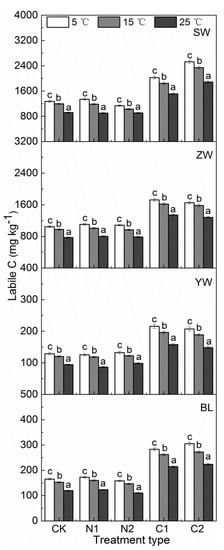
Figure 5.
Labile C under N or C treatments from wetland soils (SW: Sanjiang Plain wetland; ZW: Zoigê alpine wetland; YW: Yellow River estuary wetland; BL: Baiyangdian Lake), Vertical bars represent ± SE. CK: The control without C or N addition; N1: 0.005 mg N g−1 soil; N2: 0.025 mg N g−1 soil; C1: 2 mg C g−1 soil; C2: 10 mg C g−1 soil. Means with different lowercase letters at different temperatures (i.e., 5, 15 and 25 °C) of the same treatment type were considered significantly different at p < 0.05.
4. Discussion
4.1. Positive Response of Soil C Mineralization to Temperature and C Addition
Our findings showed that soil C mineralization was influenced by the incubation temperature, labile C addition, and wetland type, but not the addition of inorganic N. Higher temperatures increased the soil C mineralization rate, especially in SW and ZW, showing that low temperature was a limiting factor in this process at our study sites. It was shown that soil labile C significantly decreased with the increasing of temperature, suggesting that the labile C pool is an important source of CO2 in soil. The Q10 value of soil CO2 flux increased up to a maximum with labile C addition (C2 addition) in the four wetland soils (Table 3), indicating that the labile external C supply increased the sensitivity of SOM decomposition to temperature [11]. Thus, if global warming increases, the biomass of leaves and roots, the supply of labile C through leaves and roots turnover will enhance and drive the growth and activity of soil microorganisms and the regulation of CO2 production.
4.2. Neutral Impact of N Addition on Soil C Mineralization
A neutral effect of N addition on C mineralization rates was seen in the four wetland soils, i.e., similar to that in other studies carried out in wetland ecosystems [15,31,32]. This phenomenon was probably due to the microbial community structure and function, which had a certain tolerance to N in wetland soils; thus, there was a particular N addition threshold level for increased N mineralization [16]. In addition, the short incubation time used (28 days) and the small amount of N added might have precluded the detection of statistically significant changes in the C mineralization process. If the research had been carried out over a longer period, the increased N deposition may have affected soil C processes by enhancing plant biomass and changing plant community composition, thereby providing more organic matter to soil microbes to increase soil C mineralization [14]. Hence, further research is needed to verify how increasing N deposition can regulate soil C over longer periods.
4.3. Soil Net N Mineralization Rate Responses to Temperature and the Addition of N in Four Wetland Soils
The effect of increasing temperature on N mineralization was soil-specific and enhanced the net N mineralization rate in YW and BL, but decreased this it in SW and ZW. The response of soil N mineralization rate to the increasing of temperature depended on the wetland type and soil nutrient availability. The soil ratio of C: N in SW and ZW was 18.89 and 21.68, and 6.60 and 6.19 in YW and BL, respectively. The lower soil C:N ratio in YW and BL suggested that microbes associated with N mineralization were likely limited by C availability, rather than N availability. In addition, the microbial biomass C:N ratio in SW and ZW was 5.54 and 5.61, respectively. Thus, the lower soil microbial biomass C:N ratio and N limitation allowed soil microbes from wetland soils to immobilize all available N to meet their N needs [30], resulting in a negative mineralization rate. Soil net N mineralization rates were significantly decreased by increasing temperature in SW and ZW; this may be partly attributable to the limited N status and higher N immobilization in those soils. Furthermore, the response of net N mineralization to N addition also showed regional differences, which reduced net N mineralization after the addition of N in YW and BL, but increased in SW and ZW. Adding inorganic N could alleviate N-limitation, improve microbial turnover efficiency, and promote a positive excitation effect of N mineralization in SW and ZW soils, which ought to increase the overall N mineralization rate [16,17,33]. In YW and BL, labile C was only 11% of that in SW and ZW. Microbial N mineralization is the process by which some microorganisms obtain N by using labile C to decompose recalcitrant SOM [34], whereas in short-term incubation experiments, the greater N availability after N addition, and the lack of labile C, led to recalcitrant C mining for N suppression, thereby reducing the net N mineralization rate [35].
Typically, net N release in mineral form (NO3- and NH4+) only occurs after the N demand of soil microbes has been satisfied [36]. Soil organic matter is primarily decomposed by microbial decomposers, and their C/N ratio is lower than that of most litter types [36]. This leads to higher N demand. Although decomposers need a considerable fraction of assimilated C, inorganic N is required, at least in the early stages of decomposition. Globally, the initial nitrogen concentration of litter is a dominant driver of net N immobilization and release during long-term litter decomposition. Their results also showed that N could be released early in the decomposition process of high-quality litter in an environment with a low decomposition rate [37]. The C:N ratio was 13:34 in the senesced plant materials, 7:22 in the soil, and 4:6 in the soil microbial biomass for the wetland studied. The C:N ratio of soil microbial biomass is low, which makes soil microorganisms immobilize all available N in the short-term cultivation process to meet their high nitrogen demands.
4.4. Correlation Between Soil CO2 Efflux and Net N Mineralization Responses to Soil Type, and Addition of N or C in Four Wetland Soils
Based on previous studies, there are three relationships between soil CO2 emissions and net N mineralization rate. Positive correlations were observed in soils limited by C availability [23,38] and negative correlations in an N-limited soil (Bosatta and Berendse, 1984; Schimel, 1986). No correlations were observed in soils with a large variability in soil C:N ratios [38,39]. No correlation between respiration and net N mineralization was detected in soils with a large variability in soil C:N ratios [20,40].
We analyzed the correlation between soil CO2 efflux and net N mineralization rate in response to N or C addition. A negative relationship between soil CO2 efflux and net N mineralization rate was found in the control in SW and ZW soils. This may be attributed to the fact that these soils had a higher C:N ratio and were more limited by N. N mineralization is characterized by microbe immobilization, as microbes need additional available N to metabolize organic matter with high C content [41]. Higher N immobilization is often accompanied by high rates of C mineralization, as C substrates probably promote N retention by microbes [42]. The decomposition of labile C and recalcitrant C was susceptible to increasing temperature, and produced more CO2 efflux in SW and ZW soils [43,44]. However, N addition did not shift the correlation between soil CO2 flux and net N mineralization rate in SW and ZW, which suggested that soil microbes from those wetlands immobilized nearly all the added N to meet their N needs. C addition shifted the relationship between soil CO2 flux and net N mineralization rate in SW and ZW, which was consistent with the theory that available N (ammonium and nitrate) does not appear in the definition of the critical C:N ratio [45]. The addition of C increased the pool of labile C, which, in turn, altered the C:N critical ratio and microbial turnover efficiency [46]. Our results showed that positive correlations between soil CO2 flux and net N mineralization rate were observed in YW and BL with lower C availability, and in the four wetland soils with labile C addition, unlike those in other studies of wetland [30] or forest ecosystems [21,47]. However, the soil CO2 flux and net N mineralization rate seemed to be unrelated to N addition in YW and BL; this may be partly attributable to the fact that a lower temperature sensitivity (Q10) and N addition had neutral effects on CO2 efflux in those soils.
The response of soil mineralization rate to both temperature increases and the addition of N or C had high spatial variability among the studied wetland ecosystems, differing due to climate environment and soil substrate availability. The average Q10 values of soil mineralization rate in soils from SW and ZW were significantly higher than those from YW and BL. SW and ZW are cold and humid environments, which hold a lot of C in the soil. Due to the fragility of ecosystems in high latitudes and altitudes, they are highly sensitive to climate change. For instance, in the past 40 years, the temperature of the Tibetan Plateau has increased by 0.016 °C year−1, higher than the national average, i.e., 0.004 °C year−1 [30]. These regions showed a faster warming rate and higher temperature sensitivity to carbon mineralization.
5. Conclusions
In conclusion, soil CO2 flux was not regulated by N addition, but by elevated temperature, wetland type, and labile C addition, especially with high C doses. The temperature sensitivity of soil CO2 flux (Q10 values) in wetland soils under labile C addition was significantly higher than that under control and N addition, showing that labile C content was the most important factor affecting SOM mineralization. Soil C mineralization response to elevated temperature was mediated by wetland type. Q10 values in SW and ZW were significantly higher than those in YW and BL. The SOC was unstable and decomposed more readily in soil from wetlands SW and ZW. In contrast to the lack of response to C addition, net N mineralization was inconsistently affected by elevated temperature and N addition, and mediated by wetland type. Furthermore, the correlation between soil CO2 flux and net N mineralization rate varied among different wetland soils, which was intensively regulated by soil labile C content and the C:N ratio. In conclusion, wetland type and labile C addition were shown to control the temperature sensitivity of soil C and N mineralization more than N addition in wetland soils in China.
Author Contributions
Conceptualization, C.W.; methodology, C.W.; software, Y.Z., Y.L.; validation, C.W. and Z.Z.; formal analysis, Y.Z.; investigation, Y.Z., Y.L.; resources, C.W.; data curation, Y.Z. and Y.L.; writing—original draft preparation, Y.Z.; writing—review and editing, C.W. and Y.Z.; visualization, Y.Z. and Y.L.; supervision, C.W.; project administration, C.W.; funding acquisition, C.W. All authors have read and agreed to the published version of the manuscript.
Funding
This research was funded by the National Natural Science Foundation of China, grant number 41373069 and 41971024.
Conflicts of Interest
The authors declare no conflict of interest.
Appendix A

Figure A1.
Mean CO2 efflux under different temperature, N or C treatments from wetland soils in China (SW: Sanjiang Plain wetland; ZW: Zoigê alpine wetland; YW: Yellow River estuary wetland; BL: Baiyangdian Lake), Vertical bars represent ± SE. CK: The control without C or N addition; N1: 0.005 mg N g−1 soil; N2: 0.025 mg N g−1 soil; C1: 2 mg C g−1 soil; C2: 10 mg C g−1 soil.
References
- Jin, V.L.; Haney, R.L.; Fay, P.A.; Polley, H.W. Soil type and moisture regime control microbial C and N mineralization in grassland soils more than atmospheric CO2-induced changes in litter quality. Soil Biol. Biochem. 2013, 58, 172–180. [Google Scholar] [CrossRef]
- Sun, S.; Liu, J.; Chang, S.X. Temperature sensitivity of soil carbon and nitrogen mineralization: Impacts of nitrogen species and land use type. Plant Soil 2013, 372, 597–608. [Google Scholar] [CrossRef]
- Song, Y.; Song, C.; Hou, A.; Ren, J.; Wang, X.; Cui, Q.; Wang, M. Effects of temperature and root additions on soil carbon and nitrogen mineralization in a predominantly permafrost peatland. Catena 2018, 165, 381–389. [Google Scholar] [CrossRef]
- Jiang, C.; Yu, G.; Fang, H.-J.; Cao, G.; Li, Y. Short-term effect of increasing nitrogen deposition on CO2, CH4 and N2O fluxes in an alpine meadow on the Qinghai-Tibetan Plateau, China. Atmos. Environ. 2010, 44, 2920–2926. [Google Scholar] [CrossRef]
- Fisk, M.C.; Ratliff, T.J.; Goswami, S.; Yanai, R.D. Synergistic soil response to nitrogen plus phosphorus fertilization in hardwood forests. Biogeochemistry 2013, 118, 195–204. [Google Scholar] [CrossRef]
- Lund, M.; Christensen, T.R.; Mastepanov, M.; Lindroth, A.; Ström, L. Effects of N and P fertilization on the greenhouse gas exchange in two northern peatlands with contrasting N deposition rates. Biogeosciences 2009, 6, 2135–2144. [Google Scholar] [CrossRef]
- Grenon, F.; Bradley, R.; Titus, B. Temperature sensitivity of mineral N transformation rates, and heterotrophic nitrification: Possible factors controlling the post-disturbance mineral N flush in forest floors. Soil Biol. Biochem. 2004, 36, 1465–1474. [Google Scholar] [CrossRef]
- Zhang, J.L.; Liang, W.; He, F.; Cheng, S.P.; Wu, Z.B. Effects of nutrients on the substrate biofilms in the integrated vertical-flow constructed wetland. Fresen Environ. Bull. 2008, 17, 732–737. [Google Scholar]
- Weedon, J.T.; Kowalchuk, G.A.; Aerts, R.; Van Hal, J.; Van Logtestijn, R.; Taş, N.; Röling, W.F.M.; Van Bodegom, P.M.; Van Logtestijn, R.S.P. Summer warming accelerates sub-arctic peatland nitrogen cycling without changing enzyme pools or microbial community structure. Glob. Chang. Biol. 2011, 18, 138–150. [Google Scholar] [CrossRef]
- Weedon, J.T.; Aerts, R.; A Kowalchuk, G.; Van Logtestijn, R.; Andringa, D.; Van Bodegom, P.M. Temperature sensitivity of peatland C and N cycling: Does substrate supply play a role? Soil Biol. Biochem. 2013, 61, 109–120. [Google Scholar] [CrossRef]
- Kong, A.Y.Y.; Six, J. Tracing Root vs. Residue Carbon into Soils from Conventional and Alternative Cropping Systems. Soil Sci. Soc. Am. J. 2010, 74, 1201–1210. [Google Scholar] [CrossRef]
- Yamasaki, A.; Tateno, R.; Shibata, H. Effects of carbon and nitrogen amendment on soil carbon and nitrogen mineralization in volcanic immature soil in southern Kyushu, Japan. J. For. Res. 2011, 16, 414–423. [Google Scholar] [CrossRef]
- Waldrop, M.; Zak, D.R. Response of Oxidative Enzyme Activities to Nitrogen Deposition Affects Soil Concentrations of Dissolved Organic Carbon. Ecosystems 2006, 9, 921–933. [Google Scholar] [CrossRef]
- Li, X.; Han, H.; Ninga, T.; Lal, R. CO2–C evolution rate in an incubation study with straw input to soil managed by different tillage systems. RSC Adv. 2018, 8, 12588–12596. [Google Scholar] [CrossRef]
- Liu, X.-R.; Ren, J.-Q.; Li, S.-G.; Zhang, Q.-W. Effects of Simulated Nitrogen Deposition on Soil Net Nitrogen Mineralization in the Meadow Steppe of Inner Mongolia, China. PLoS ONE 2015, 10, e0134039. [Google Scholar] [CrossRef]
- Yoshitake, S.; Uchida, M.; Koizumi, H.; Nakatsubo, T. Carbon and nitrogen limitation of soil microbial respiration in a High Arctic successional glacier foreland near Ny-Ålesund, Svalbard. Polar Res. 2007, 26, 22–30. [Google Scholar] [CrossRef]
- Fisk, M.C.; Santangelo, S.; Minick, K. Carbon mineralization is promoted by phosphorus and reduced by nitrogen addition in the organic horizon of northern hardwood forests. Soil Biol. Biochem. 2015, 81, 212–218. [Google Scholar] [CrossRef]
- Zang, H.; Wang, J.; Kuzyakov, Y. N fertilization decreases soil organic matter decomposition in the rhizosphere. Appl. Soil Ecol. 2016, 108, 47–53. [Google Scholar] [CrossRef]
- Scott, N.A.; Parfitt, R.L.; Ross, D.J.; Salt, G.J. Carbon and nitrogen transformations in New Zealand plantation forest soils from sites with different N status. Can. J. For. Res. 1998, 28, 967–976. [Google Scholar] [CrossRef]
- Jensen, L.S.; Salo, T.; Palmason, F.; Breland, T.A.; Henriksen, T.M.; Stenberg, B.; Pedersen, A.; Lundström, C.; Esala, M. Influence of biochemical quality on C and N mineralisation from a broad variety of plant materials in soil. Plant Soil 2005, 273, 307–326. [Google Scholar] [CrossRef]
- Kelliher, F.; Ross, D.; Law, B.E.; Baldocchi, D.; Rodda, N. Limitations to carbon mineralization in litter and mineral soil of young and old ponderosa pine forests. For. Ecol. Manag. 2004, 191, 201–213. [Google Scholar] [CrossRef]
- Tian, Q.; Wang, X.; Wang, D.; Wang, M.; Liao, C.; Yang, X.; Liu, F. Decoupled linkage between soil carbon and nitrogen mineralization among soil depths in a subtropical mixed forest. Soil Biol. Biochem. 2017, 109, 135–144. [Google Scholar] [CrossRef]
- Gao, J.-Q.; Ouyang, H.; Xu, X.; Zhou, C.-P.; Zhang, F. Effects of Temperature and Water Saturation on CO2 Production and Nitrogen Mineralization in Alpine Wetland Soils. Pedosphere 2009, 19, 71–77. [Google Scholar] [CrossRef]
- Wang, Y.; Wang, H.; He, J.-S.; Feng, X. Iron-mediated soil carbon response to water-table decline in an alpine wetland. Nat. Commun. 2017, 8, 15972. [Google Scholar] [CrossRef]
- Song, C.; Wang, L.; Tian, H.; Liu, D.; Lu, C.; Xu, X.; Zhang, L.; Yang, G.; Wan, Z. Effect of continued nitrogen enrichment on greenhouse gas emissions from a wetland ecosystem in the Sanjiang Plain, Northeast China: A 5 year nitrogen addition experiment. J. Geophys. Res. Biogeosci. 2013, 118, 741–751. [Google Scholar] [CrossRef]
- Xing, Y.; Jiang, Q.; Li, W. Landscape spatial patterns changes of the wetland in Qinghai-Tibet Plateau. Ecol. Environ. Sci. 2009, 18, 1010–1015. [Google Scholar]
- Ding, W.; Cai, Z.; Wang, D. Preliminary budget of methane emissions from natural wetlands in China. Atmos. Environ. 2004, 38, 751–759. [Google Scholar] [CrossRef]
- Vance, E.; Brookes, P.; Jenkinson, D. Microbial biomass measurements in forest soils: The use of the chloroform fumigation-incubation method in strongly acid soils. Soil Biol. Biochem. 1987, 19, 697–702. [Google Scholar] [CrossRef]
- Rey, A.; Pegoraro, E.; Jarvis, P.G. Carbon mineralization rates at different soil depths across a network of European forest sites (FORCAST). Eur. J. Soil Sci. 2008, 59, 1049–1062. [Google Scholar] [CrossRef]
- Song, M.-H.; Jiang, J.; Xu, X.; Shi, P.-L. Correlation Between CO2 Efflux and Net Nitrogen Mineralization and Its Response to External C or N Supply in an Alpine Meadow Soil. Pedosphere 2011, 21, 666–675. [Google Scholar] [CrossRef]
- Liu, W.; Xu, W.; Han, Y.; Wang, C.; Wan, S. Responses of microbial biomass and respiration of soil to topography, burning, and nitrogen fertilization in a temperate steppe. Biol. Fertil. Soils 2007, 44, 259–268. [Google Scholar] [CrossRef]
- Li, Y.C.; Song, C.C.; Hou, C.C.; Wang, X.W. Effects of nitrogen addition on carbon mineralization in boreal peatlands soil in Northeast China: A laboratory study. Fresen Environ. Bull. 2014, 23, 970–975. [Google Scholar]
- Hodge, A.; Robinson, D.; Fitter, A. Are microorganisms more effective than plants at competing for nitrogen? Trends Plant Sci. 2000, 5, 304–308. [Google Scholar] [CrossRef]
- Moorhead, D.L.; Sinsabaugh, R.L. A theoretical model of litter decay and microbial interaction. Ecol. Monog. 2006, 76, 151–174. [Google Scholar] [CrossRef]
- Hagedorn, F.; Spinnler, D.; Bundt, M.; Blaser, P.; Siegwolf, R.T.W. The input and fate of new C in two forest soils under elevated CO2. Glob. Chang. Biol. 2003, 9, 862–872. [Google Scholar] [CrossRef]
- Berg, B.; McClaugherty, C.A. Plant Litter: Decomposition, Humus Formation, Carbon Sequestration; Springer: Berlin/Heidelberg, Germany, 2003. [Google Scholar]
- Craine, J.M.; Morrow, C.; Fierer, N. Microbial nitrogen limitation increases decomposition. Ecology 2007, 88, 2105–2113. [Google Scholar] [CrossRef]
- Schimel, D.S.; Parton, W.J.; Adamsen, F.J.; Woodmansee, R.G.; Senft, R.L.; Stillwell, M.A. The role of cattle in the volatile loss of nitrogen from a shortgrass steppe. Biogeochemistry 1986, 2, 39–52. [Google Scholar] [CrossRef]
- Bosatta, E.; Berendse, F. Energy or nutrient regulation of decomposition: Implications for the mineralization-immobilization response to perturbations. Soil Biol. Biochem. 1984, 16, 63–67. [Google Scholar] [CrossRef]
- Luxhøi, J.; Bruun, S.; Stenberg, B.; Breland, T.A.; Jensen, L.S. Prediction of Gross and Net Nitrogen Mineralization-Immobilization-Turnover from Respiration. Soil Sci. Soc. Am. J. 2006, 70, 1121–1128. [Google Scholar] [CrossRef]
- Janssen, B.H. Nitrogen mineralization in relation to C:N ratio and decomposability of organic materials. Plant Soil 1996, 181, 39–45. [Google Scholar] [CrossRef]
- Barrett, J.; Burke, I. Potential nitrogen immobilization in grassland soils across a soil organic matter gradient. Soil Biol. Biochem. 2000, 32, 1707–1716. [Google Scholar] [CrossRef]
- Biasi, C.; Rusalimova, O.; Meyer, H.; Kaiser, C.; Wanek, W.; Barsukov, P.; Junger, H.; Richter, A. Temperature-dependent shift from labileto recalcitrant carbon sources of arctic heterotrophs. Rapid Commun. Mass Spectom. 2005, 19, 1401–1408. [Google Scholar] [CrossRef] [PubMed]
- He, Y.; Xu, X.; Kueffer, C.; Zhang, X.; Shi, P. Leaf litter of a dominant cushion plant shifts nitrogen mineralization to immobilization at high but not low temperature in an alpine meadow. Plant Soil 2014, 383, 415–426. [Google Scholar] [CrossRef]
- Manzoni, S.; Porporato, A. A theoretical analysis of nonlinearities and feedbacks in soil carbon and nitrogen cycles. Soil Biol. Biochem. 2007, 39, 1542–1556. [Google Scholar] [CrossRef]
- Manzoni, S.; Jackson, R.B.; Trofymow, J.A.; Porporato, A. The Global Stoichiometry of Litter Nitrogen Mineralization. Science 2008, 321, 684–686. [Google Scholar] [CrossRef]
- Parfitt, R.; Scott, N.; Ross, D.; Salt, G.; Tate, K. Land-use change effects on soil C and N transformations in soils of high N status: Comparisons under indigenous forest, pasture and pine plantation. Biogeochemistry 2003, 66, 203–221. [Google Scholar] [CrossRef]
© 2020 by the authors. Licensee MDPI, Basel, Switzerland. This article is an open access article distributed under the terms and conditions of the Creative Commons Attribution (CC BY) license (http://creativecommons.org/licenses/by/4.0/).