Article

Disproportionate Changes in the CH4 Emissions of Six Water Table Levels in an Alpine Peatland

1
Institute of Wetland Research, Chinese Academy of Forestry, Beijing 100091, China
2
Beijing Key Laboratory of Wetland Services and Restoration, Beijing 100091, China
3
Sichuan Zoige Wetland Ecosystem Research Station, Tibetan Autonomous Prefecture of Aba 624500, China
*
Author to whom correspondence should be addressed.
Atmosphere 2020, 11(11), 1165; https://doi.org/10.3390/atmos11111165
Submission received: 15 October 2020 / Revised: 25 October 2020 / Accepted: 27 October 2020 / Published: 28 October 2020
(This article belongs to the Special Issue Climate-Ecosystem Interaction in Northern Wetlands)

Abstract

:
The Zoige alpine peatlands are one of the highest and largest alpine peatlands in the world and play an important role in the global carbon cycle. Drainage is the main disturbance at Zoige, and the drawdown of the water table level changes CH4 emissions. There is still much uncertainty relating to how CH4 emissions respond to multiple water table levels. Here, we simulated six gradients (−30 cm, −20 cm, −10 cm, 0 cm, 10 cm, and 20 cm) of the water table level through a mesocosm manipulation experiment in the Zoige peatlands. The water table level had a significant effect on CH4 emissions. CH4 emissions did not change with water table levels from −30 cm to −10 cm, but significantly increased as the water table level increased above −10 cm. A significant log-linear relationship (R2 = 0.44, p < 0.001) was found between CH4 emissions and a water table level range from −10 to 20 cm. This study characterized the responses of CH4 emissions to multiple water table levels and provide additional data for accurately evaluating CH4 emissions. The results of this study also have several conservation implications for alpine peatlands.

1. Introduction

Peatlands play a critical role in the global carbon cycle, as they store a large amount of carbon in the form of peat [1,2]. The total carbon stored in peatlands is estimated to be 500 Pg C, accounting for 30% of the total terrestrial carbon storage globally [3,4]. However, peatlands are also a major natural source of greenhouse gases, such as carbon dioxide (CO2) and methane (CH4), especially at high latitudes [5,6,7,8]. CH4 is an important greenhouse gas because its relative potential for thermal absorption is 25 times greater compared with CO2 [9,10]. The area of peatlands has been reduced substantially because of habitat destruction, largely mediated by climate change and an increase in anthropogenic activities. Drainage, one of the most important human disturbances, causes water table level drawdown, which alter the redox status conditions and affects CH4 emissions by affecting the activity of methanogens and methanotrophs [11].
Located on the eastern edge of the Qinghai–Tibetan Plateau, the Zoige alpine peatlands are some of the highest and largest alpine peatlands in the world (4605 km2); consequently, they play an extremely important role in regulating regional climate change. Large-scale drainage was undertaken at Zoige starting in the 1950s to promote the development of animal husbandry [12,13,14]. There are now more than 1600 drainage ditches with a total length of 371 km, affecting 43.5% of the total area of the peatlands. Field studies and satellite data analysis have revealed that drainage is one of the main reasons for the degradation of the Zoige peatlands [14].
Several controlled experiments and field surveys in peatlands across several different sites have revealed that CH4 emissions were significantly reduced after water table drawdown, but the magnitude of their decrease varies with the peatland type and water table level [15,16,17,18]. Furthermore, the mathematical relationship between CH4 emissions and water table levels can be more complex; for example, the significant linear relationships observed based on field surveys and manipulative experiments [19,20,21]. However, other studies have found nonlinear or nonmonotonic relationships [11,22].
Thus, how peatlands’ CH4 emissions change in response to multiple water table levels requires further study. Our objectives were to (1) characterize the effects of the water table level on CH4 emissions and (2) explore the relationships between CH4 emissions and multiple water table levels in the Zoige alpine peatlands.

2. Experiments

2.1. Study Area

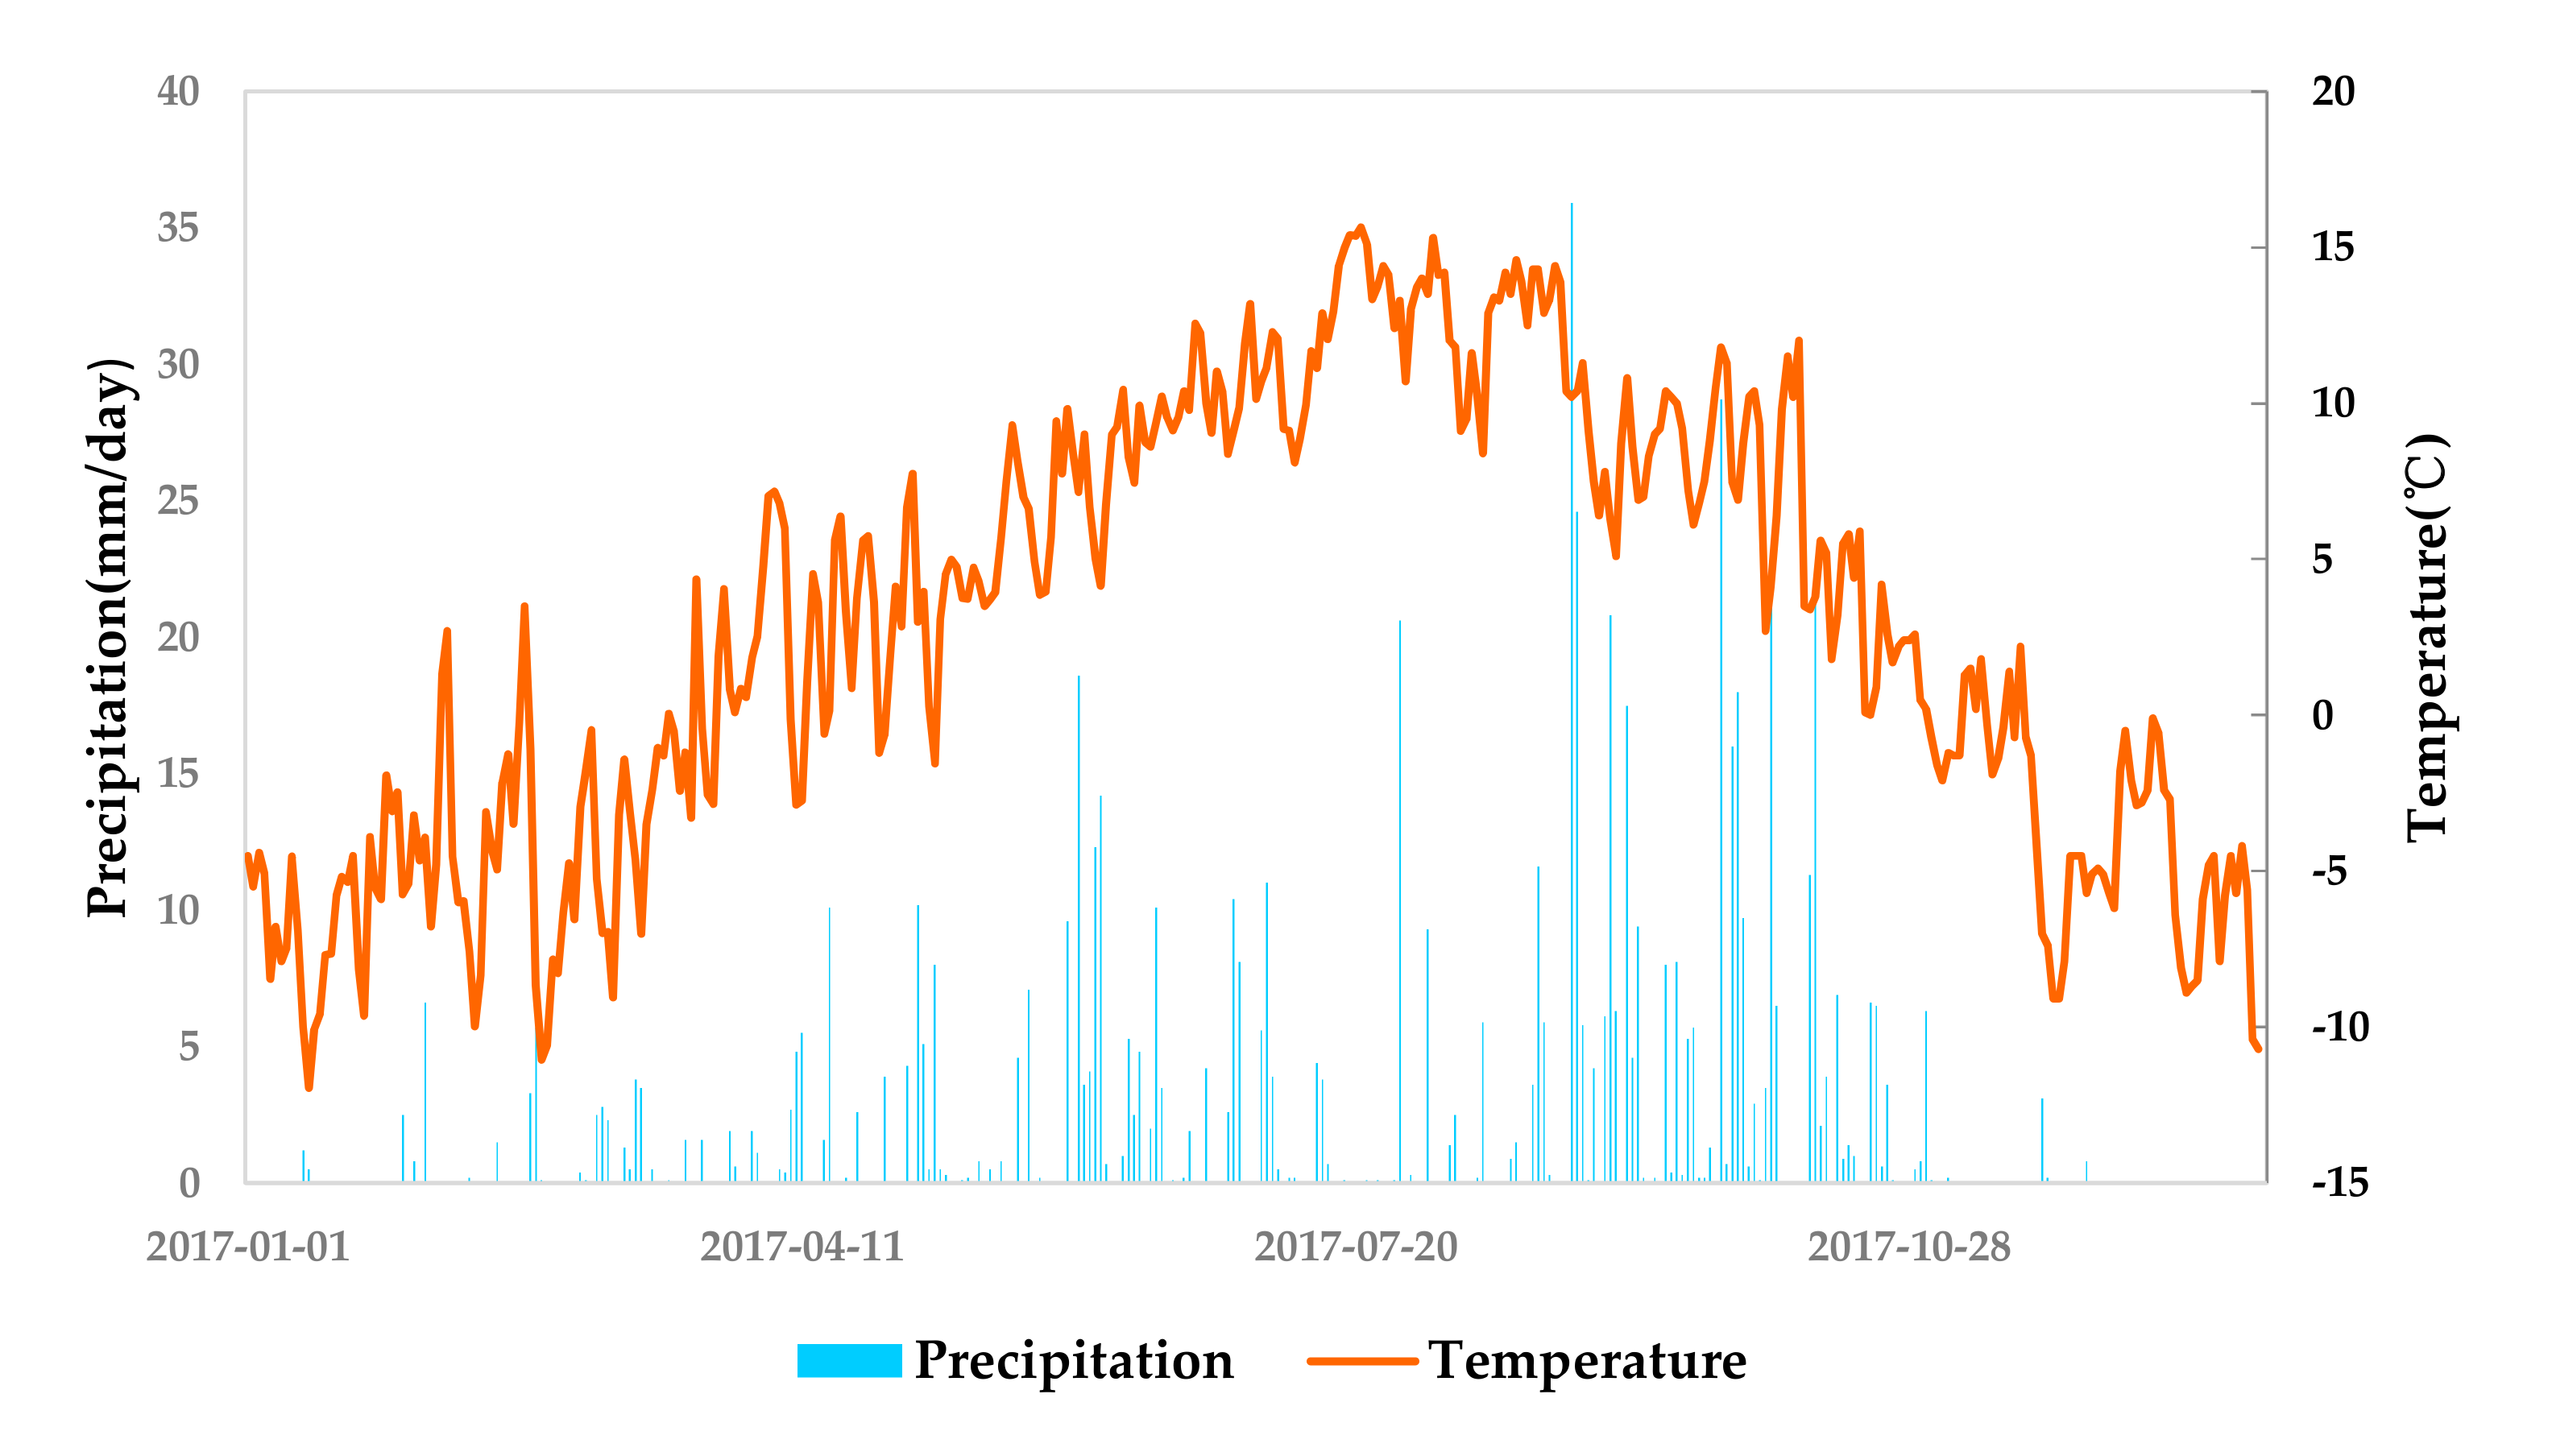
This study was conducted in Zoige County (33°54′ N, 102°50′ E; 3490 m a.s.l.), Aba Autonomous Prefecture, Sichuan Province, China (Figure 1a,b). Zoige County is located on the eastern edge of the Tibetan Plateau and is characterized by a continental monsoon climate, with a mean annual temperature of 2.9 °C and annual precipitation of 691 mm (based on data from 2017; Figure 2). Approximately 90% of the precipitation falls between April and September [23]. The soil type predominantly consists of peat and marsh soil. The dominant species are Kobresia tibetica and Carex muliensis. The water table level of the study site ranged from −39.7 to 29.5 cm [24].

2.2. Experimental Design

The design of the experiment consisted of six water table levels—30 cm below the soil surface (−30 cm), 20 cm below the soil surface (−20 cm), 10 cm below the soil surface (−10 cm), at the soil surface (0 cm), 10 cm above the soil surface (10 cm), and 20 cm above the soil surface (20 cm)—to simulate different magnitudes of water table drawdown by simulation mesocosms (Figure 1c). The simulation mesocosms consisted of steel boxes (60 cm × 60 cm × 60 cm), and each water table level was performed in triplicate. Eighteen soil blocks (60 cm × 60 cm × 50 cm) with surface vegetation (the height of the plants ranged from 5 to 15 cm) intact and from a representative homogeneous area of peatland habitat were collected and immediately placed in the mesocosms (Figure 1d) [16,23]. The water table level was automatically manipulated.

2.3. CH4 Emissions and Environmental Measurements

We began the observations 20 days after initiating the mesocosms so that the mesocosms had sufficient time to settle. A total of six observations were made from 9:00 to 13:00 on sunny days with an approximately 10-day interval during the growing season. The CH4 emissions were measured by the static chamber method combined with a rapid, laser-based greenhouse gas analyzer (DLT-100, Los Gatos Research, San Jose, CA, USA). A stainless-steel base (50 cm × 50 cm × 20 cm) was set in each mesocosm, and the base was inserted 10 cm into the soil. The base was filled with water during measurements. There were two 2-cm round holes at the top of the transparent chamber, which were occupied by rubber stoppers linked to two 20-m pipes. The gas went to the analyzer through one pipe and returned to the chamber through another pipe. The chamber was equipped with two small fans to maintain an even gas concentration. The chamber in each plot was continuously closed for 3 min, and the chamber was opened until the CH4 emissions on the analyzer were stable. The air temperature (°C), soil temperature (°C), and moisture (% of volume) at depths of 5 cm, 10 cm, and 20 cm below the soil surface were measured simultaneously. The temperature was obtained by a TZS-5X (Hangzhou Tuopu Instrument Manufacturing Inc., Hangzhou, China), and the soil moisture was measured by a TDR 300 (Spectrum Technologies, Inc., CST, Aurora, IL, USA).

2.4. Data Analysis

The CH4 emissions ( F C H 4 ) were calculated by the linear slope of the gas concentration with time:
F C H 4 = d c d t × M V 0 × P P 0 × T 0 T × H
where the units of F C H 4 are mg/(m2·h); d c d t (ppm/h) represents the slope of the CH4 concentration changing with time; M (g/mol) is the molar mass of CH4; V0 is the standard molar volume with a value of 22.4 L/mol; P/P0 is the ratio of atmospheric pressure of the chamber to standard atmospheric pressure (Pa); T0/T represents the ratio of absolute temperature at the standard atmospheric pressure to the absolute temperature of the chamber (T); and H is the height of the chamber (cm).
We conducted a multiple comparison analysis of six water table levels, including repeated observations, by conducting a Tukey post-hoc test with Bonferroni correction [25]. The effects of water table level on CH4 emissions were assessed by performing repeated-measures analysis within a mixed-effect model in the package “lme4” in R (ver. 3.6.2, URL: https://www.R-project.org). We included water table level as a fixed effect, and the number of each mesocosm as a random factor (1|numbers) to control the effects of multiple observations during the growing season [26]. The CH4 emissions were log-transformed prior to conducting the analysis. We calculated the changing percent between treatments by taking the arithmetic mean of the repeated samples from each mesocosm and then taking the mean of the replicates for each treatment.

3. Results

3.1. Temporal Patterns of CH4 Emissions

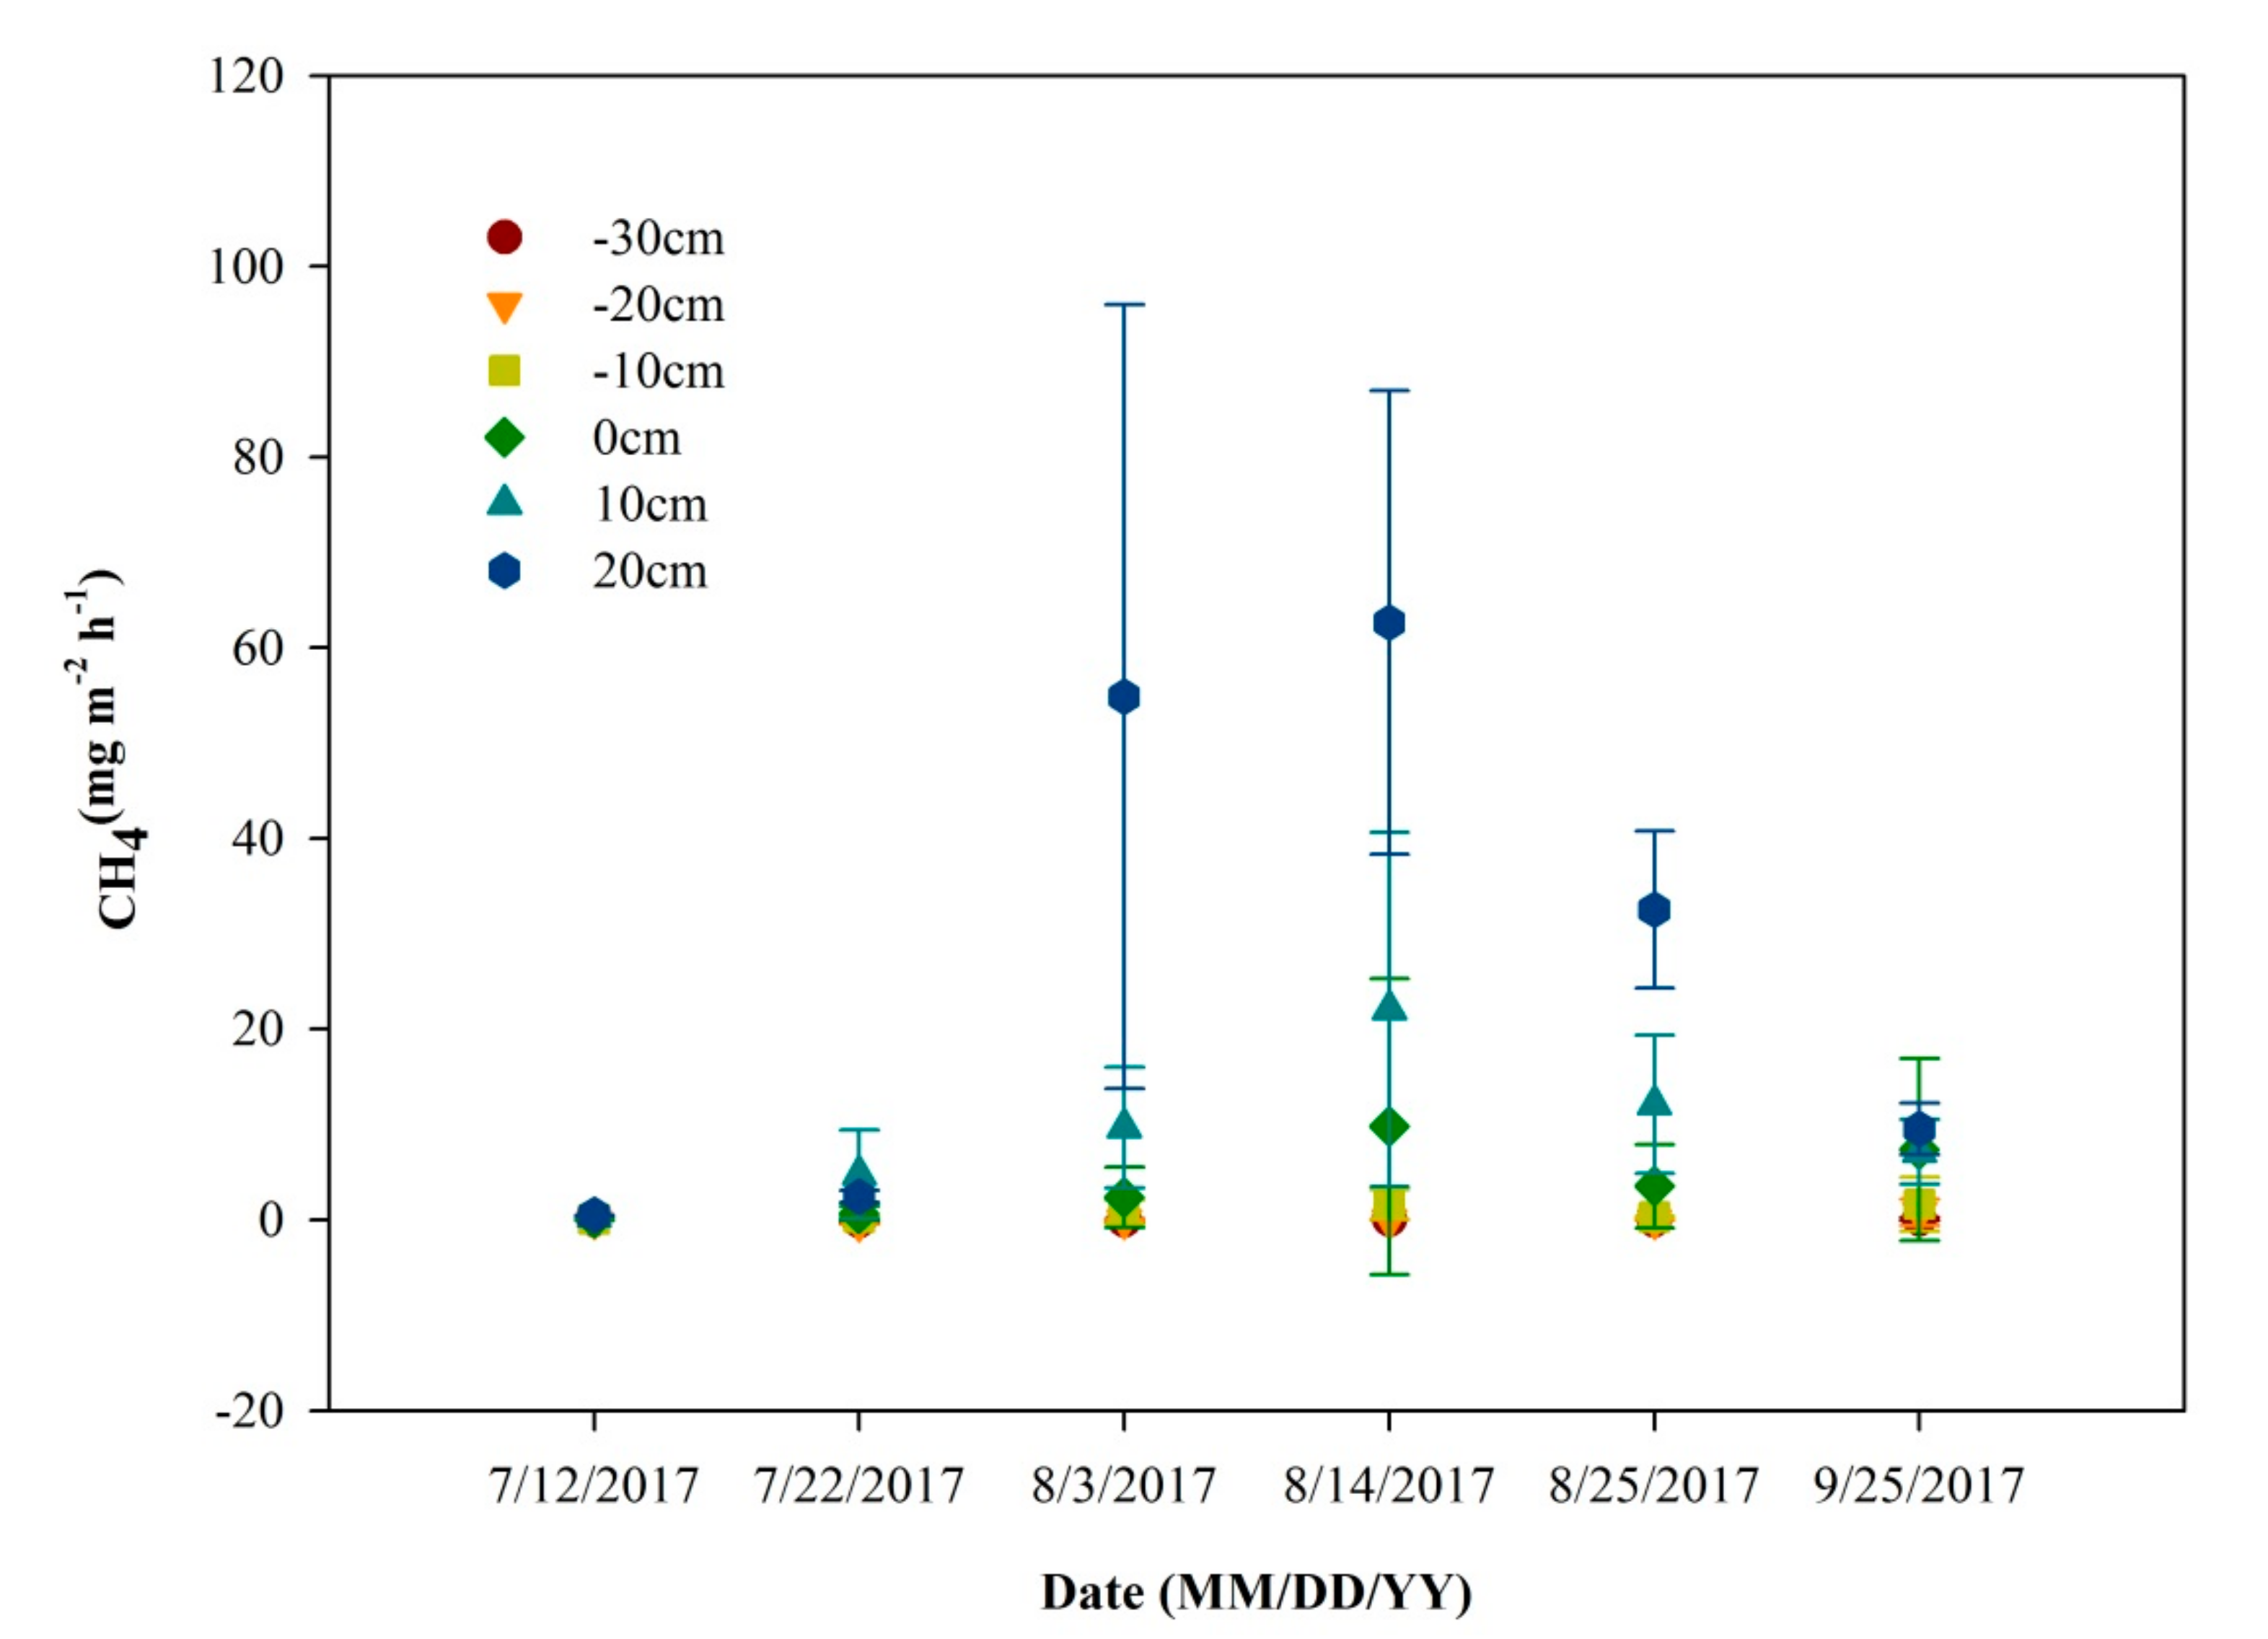
The methane flux was relatively low when the water table level was between −30 cm and −10 cm, with an average value of 0.28 mg m−2h−1 (range: −0.42~4.89 mg m−2h−1). When the water table level was above 0 cm, the methane emissions were higher and increased as the water table level increased, especially at 20 cm; emissions peaked in mid-to-late August at a value of 90.74 mg m−2h−1 (Figure 3).

3.2. Relationship between Water Table Level and CH4 Emissions

The water table level had a significant impact on CH4 emissions. Multiple comparison analysis showed that there was a significant difference in CH4 emissions between lower water table levels (−30 cm, −20 cm, and −10 cm) and higher water table levels (10 cm and 20 cm). No significant difference was observed when the water table level was below −10 cm. However, CH4 emissions at the water table levels of 10 cm and 20 cm were significantly different from that at 0 cm (Table 1).
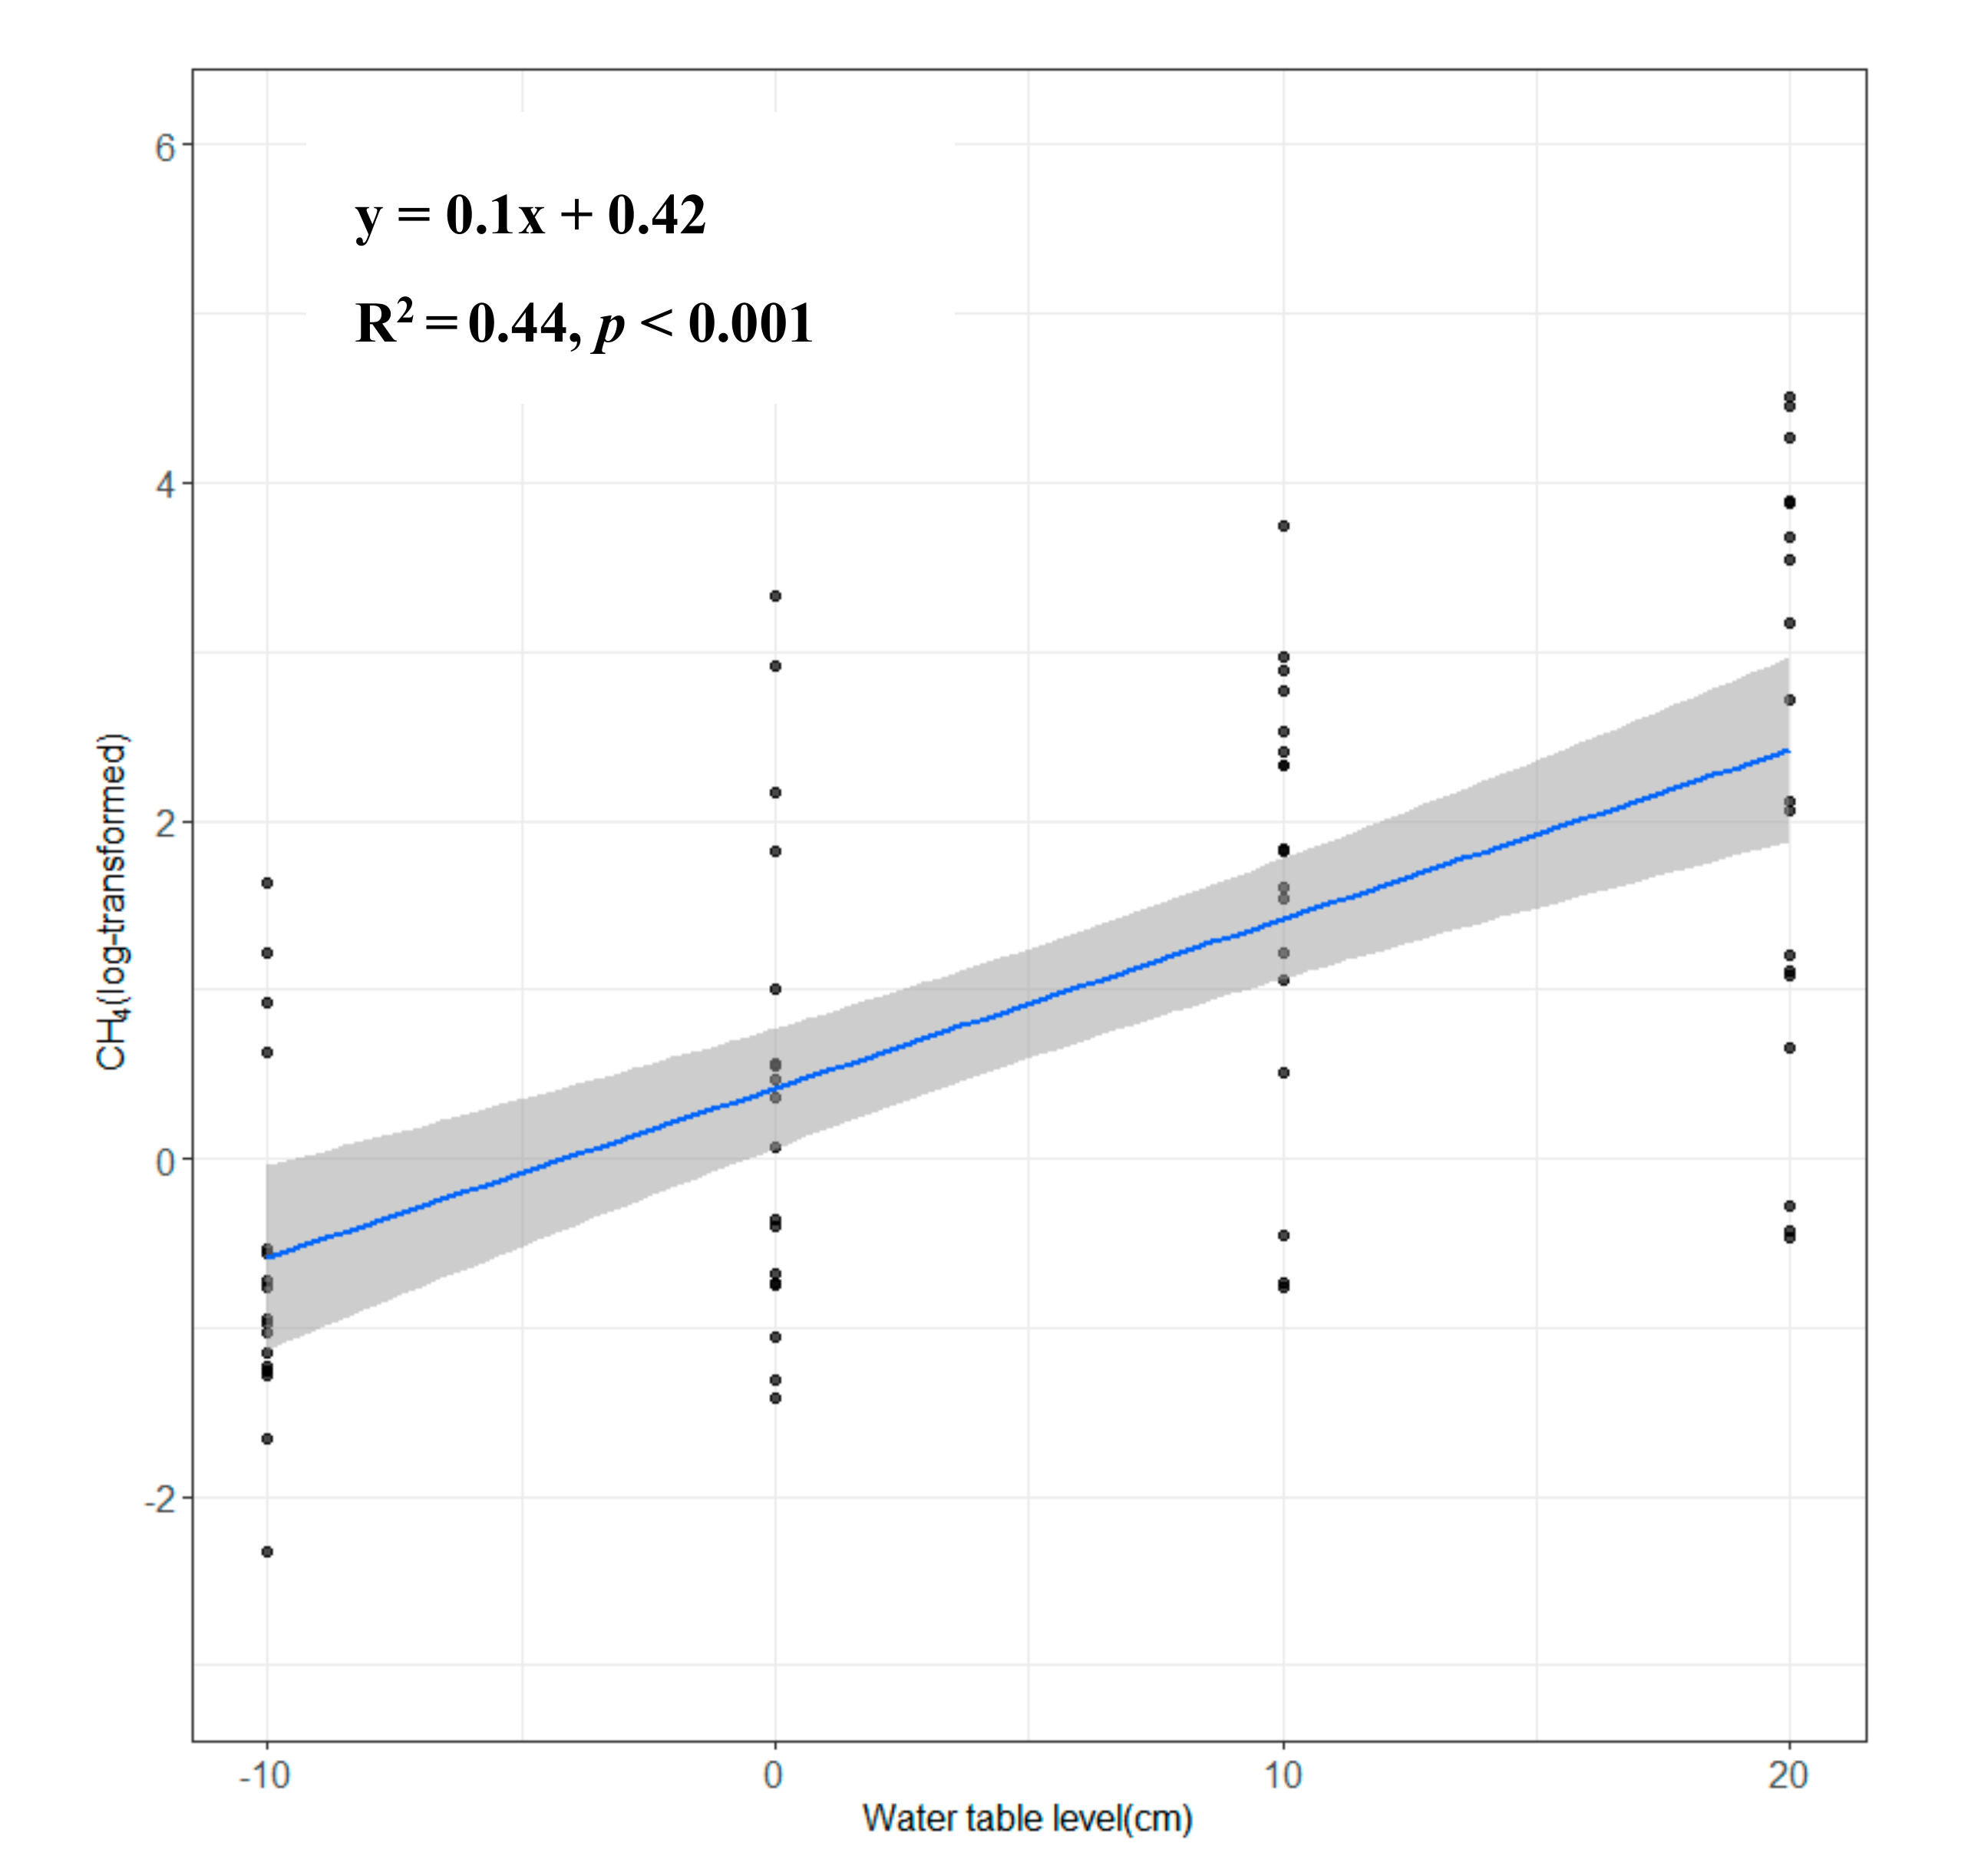
A significant log-linear relationship was observed between the water table level (x) ranging from −10 cm to 20 cm and the log-transformed CH4 emissions (y, y = 0.1x + 0.42, p < 0.001, Figure 4). CH4 emissions increased as the water table level increased. Fixed effects (water table level) accounted for 40% of the variation in CH4 emissions, whereas the fixed and random effects explained 44% of the total variation (Table 2).

4. Discussion

4.1. Significant Effects of Water Table Level and Their Relationship with CH4 Emissions

We found that the water table level had a significant impact on CH4 emissions. CH4 is produced by methanogens and oxidized by methanotrophs [27]. As an interface dweller, methanotrophs have the unique ability to grow on methane as their sole source of carbon and energy and play a major role in the removal of CH4 from the soil before it is released into the atmosphere [28]. Thus, a lower water table beneath the soil surface provided a deeper oxic layer, where more CH4 can be oxidized by methanotrophs as it diffuses upwards. At the lowest water table level (−30 cm), CH4 emissions shut off completely. When the water table level was above the soil surface, it not only provided anoxic conditions for CH4 production, but also affected the transportation of CH4 by affecting the soil temperature and vegetation. Our estimates of the reduction in CH4 emissions from the highest water table level (20 cm) to the lowest (−30 cm) were higher than the estimates of previous studies (Table 3). Changes in CH4 emissions caused by changes in the water table level are known to be related to peatland type, vegetation composition and structure, and the degree and timing of the change in the water table level [29]. More importantly, the controlled experiment had a consistent background except for the controlled factor, thus permitting us to characterize the relationship between water table levels and CH4 emissions. However, the controlled experiment had its limitations in representing a real senario. In our controlled mesocosms, the water table level was constantly maintained at a specific level; thus, the hydrological variability differed from that of real wetlands from field surveys. At the drained sites found in the literature, the water table level decreased but was not maintained at an artificially low level; consequently, the water table level fluctuated, causing the soils to be temporarily wet and emit methane.
Changes in CH4 emissions in response to a water table drawdown of 1 cm were disproportionately large. The CH4 emissions did not change for water table levels from −30 cm to −10 cm, as CH4 emissions ceased or were negligibly small because of the oxic condition of the soil. However, CH4 emissions significantly increased with the water table level when it was in the positive domain. This finding could be used for the restoration of the Zoige peatlands: specifically, a considerable increase in CH4 emissions results when the water level is raised above the soil surface. Based on our observations, peatland with a 20 cm water table level above the soil surface in our study site would emit seven-fold higher CH4 (161 g/m2) during the growing season compared with CH4 emissions at 0 cm (23 g/m2).
Field surveys of four northern boreal peatlands in Sweden and laboratory studies of five northern peat sites in Canada found significant log-linear relationships between daily CH4 production and the average water table level [19,20]. This log-linear relationship was also found in a controlled experiment with three water levels at a fen and a bog in Minnesota based on daily emissions, but the coefficient and intercept varied among years [21]. Our controlled experiment of six water table levels comfirmed the significant log-linear relationship at the instantaneous time scale. However, more complex relationships were observed based on observations during two summer seasons based on the eddy covariance method at the Mer Bleue bog and a poor fen in Canada [11,32]. These studies differed in peatland type, water table level (controlled or fluctuated), and observation method (chamber, eddy covariance), which likely resulted in the recovery of different relationships. To better predict the effects of both climate change and drainage on peatlands, meta-analyses of studies from other regions need to be conducted, and these data should be incorporated into ecosystems models.

4.2. Limitations and Suggestions

Our study was conducted during the growing season, but some studies have shown that non-growing season emissions are also important and can contribute around 45% of the annual emissions in Haibei alpine peatlands [33] or around 35–47% of the annual emissions in degraded alpine fens, based on a field survey [34]. The water table level also plays an important role in shaping the microbial community structure of peatlands, which is linked to CH4 emissions [30]. CH4 emissions are regulated not only by abiotic factors but also by biotic factors, such as microbial activity and community composition [34,35]. A field study conducted in the Zoige peatlands found that methanogens were reduced at lower water tables in both surface and deep soils [36]. Thus, additional studies are needed to quantify non-growing season methane emissions and characterize the microbial mechanisms mediating the variation in methane emissions.
Ecosystem models are an effective way to predict ecosystem processes; future models should not only consider climate change but also human disturbances. Some models include the effect of grazing [37,38], while others consider fire disturbance [39,40]. Drainage, which is a major human disturbance of peatlands, needs to be incorporated into ecosystem models to simulate different durations and intensities of drainage at various temporal and spatial scales. These models could be used to accurately assess regional methane emissions under different climate and human disturbance regimes and provide critical data that could aid peatland conservation and management.

5. Conclusions

The findings of this study confirmed that water table level is a key factor controlling CH4 emissions in Zoige peatlands. We found that there was a significant log-linear relationship between water table level and CH4 emissions based on an experiment that included six water table levels. Our results highlight the quantitative relationship between water table levels and CH4 emissions; these results could be incorporated into ecosystem models to better predict the effects of both climate change and human disturbances on alpine peatlands. The results also provide important data that could contribute to improving the science-based management policy of alpine peatlands.

Author Contributions

L.Y. and X.K. conceived and designed the experiments; X.Z., H.W., Y.L. and J.W. performed the experiments; L.Y. and X.Z. analyzed the data; L.Y. and X.K. wrote the paper; K.Z., Z.Y. and E.K. revised the manuscript. All authors have read and agreed to the published version of the manuscript.

Funding

This research was funded by National Natural Science Foundation of China (41701113,31770511, 41877421) and the National Key Research and Development Program of China (2016YFC0501804).

Acknowledgments

The authors thank Hamo Dangzhou and Jia Ba from Sichuan Zoige Wetland Ecosystem Research Station for their assistance with the field work.

Conflicts of Interest

The authors declare no conflict of interest.

References

  1. Hooijer, A. Current and future CO2 emissions from drained peatlands in Southeast Asia. Biogeosciences Discuss. 2009, 7, 1505–1514. [Google Scholar] [CrossRef] [Green Version]
  2. Xu, J.; Morris, P.J.; Liu, J.; Holden, J. PEATMAP: Refining estimates of global peatland distribution based on a meta-analysis. Catena 2018, 160, 134–140. [Google Scholar] [CrossRef] [Green Version]
  3. Mitsch, W.J.; Bernal, B.; Nahlik, A.M.; Mander, Ü.; Zhang, L.; Anderson, C.J.; Jørgensen, S.E.; Brix, H. Wetlands, carbon, and climate change. Landsc. Ecol. 2013, 28, 583–597. [Google Scholar] [CrossRef]
  4. Yuan, Y.; Yan, D.; Wang, H.; Wang, Q.; Weng, B. Quantitative assessment of drought in a lacustrine wetland based on a water balance model. Nat. Hazards 2014, 70, 693–703. [Google Scholar] [CrossRef]
  5. Zeng, X.; Gao, Y. Short-term effects of drying and rewetting on CO2 and CH4 emissions from high-altitude peatlands on the Tibetan Plateau. Atmosphere 2016, 7, 148. [Google Scholar] [CrossRef] [Green Version]
  6. Koffi, E.N.; Bergamaschi, P.; Alkama, R.; Cescatti, A. An observation-constrained assessment of the climate sensitivity and future trajectories of wetland methane emissions. Sci. Adv. 2020, 6, eaay4444. [Google Scholar] [CrossRef] [Green Version]
  7. Camacho, A.; Picazo, A.; Rochera, C.; Santamans, A.C.; Morant, D.; Miralles-Lorenzo, J.; Castillo-Escrivà, A. Methane Emissions in Spanish Saline Lakes: Current Rates, Temperature and Salinity Responses, and Evolution under Different Climate Change Scenarios. Water 2017, 9, 659. [Google Scholar] [CrossRef] [Green Version]
  8. Moore, T.R.; Knowles, R. The influence of water table levels on methane and carbon dioxide emissions from peatland soils. Can. J. Soil Sci. 1989, 69, 33–38. [Google Scholar] [CrossRef]
  9. Yrjälä, K.; Tuomivirta, T.; Juottonen, H.; Putkinen, A.; Lappi, K.; Tuittila, E.S.; Penttilä, T.; Minkkinen, K.; Laine, J.; Peltoniemi, K. CH4 production and oxidation processes in a boreal fen ecosystem after long-term water table drawdown. Glob. Chang. Biol. 2011, 17, 1311–1320. [Google Scholar] [CrossRef] [Green Version]
  10. Tiwari, S.; Singh, C.; Singh, J.S. Wetlands: A Major Natural Source Responsible for Methane Emission. In Restoration of Wetland Ecosystem: A Trajectory Towards a Sustainable Environment; Upadhyay, A.K., Singh, R., Singh, D.P., Eds.; Springer: Singapore, 2020; pp. 59–74. [Google Scholar] [CrossRef]
  11. Strack, M.; Waddington, J.M.; Tuittila, E.S. Effect of water table drawdown on northern peatland methane dynamics: Implications for climate change. Glob. Biogeochem. Cycles 2004, 18, 18. [Google Scholar] [CrossRef] [Green Version]
  12. Minkkinen, K.; Korhonen, R.; Savolainen, I.; Laine, J. Carbon balance and radiative forcing of Finnish peatlands 1900–2100–the impact of forestry drainage. Glob. Chang. Biol. 2002, 8, 785–799. [Google Scholar] [CrossRef]
  13. Turetsky, M.R.; Benscoter, B.; Page, S.; Rein, G.; Van Der Werf, G.R.; Watts, A. Global vulnerability of peatlands to fire and carbon loss. Nat. Geosci. 2015, 8, 11–14. [Google Scholar] [CrossRef]
  14. Zhang, X.; Liu, H.; Baker, C.; Graham, S. Restoration approaches used for degraded peatlands in Ruoergai (Zoige), Tibetan Plateau, China, for sustainable land management. Ecol. Eng. 2012, 38, 86–92. [Google Scholar] [CrossRef]
  15. Ellis, T.; Hill, P.; Fenner, N.; Williams, G.; Godbold, D.; Freeman, C. The interactive effects of elevated carbon dioxide and water table draw-down on carbon cycling in a Welsh ombrotrophic bog. Ecol. Eng. 2009, 35, 978–986. [Google Scholar] [CrossRef]
  16. Wang, H.; Yu, L.; Zhang, Z.; Liu, W.; Chen, L.; Cao, G.; Yue, H.; Zhou, J.; Yang, Y.; Tang, Y. Molecular mechanisms of water table lowering and nitrogen deposition in affecting greenhouse gas emissions from a Tibetan alpine wetland. Glob. Chang. Biol. 2017, 23, 815–829. [Google Scholar] [CrossRef] [Green Version]
  17. Yang, J.; Liu, J.; Hu, X.; Li, X.; Wang, Y.; Li, H. Effect of water table level on CO2, CH4 and N2O emissions in a freshwater marsh of Northeast China. Soil Biol. Biochem. 2013, 61, 52–60. [Google Scholar] [CrossRef]
  18. Järveoja, J.; Peichl, M.; Maddison, M.; Soosaar, K.; Vellak, K.; Karofeld, E.; Teemusk, A.; Mander, Ü. Impact of water table level on annual carbon and greenhouse gas balances of a restored peat extraction area. Biogeosciences 2016, 13, 2637. [Google Scholar] [CrossRef] [Green Version]
  19. Sundh, I.; Nilsson, M.; Granberg, G.; Svensson, B.H. Depth distribution of microbial production and oxidation of methane in northern boreal peatlands. Microb. Ecol. 1994, 27, 253–265. [Google Scholar] [CrossRef]
  20. Moore, T.R.; Roulet, N.T. Methane flux: Water table relations in northern wetlands. Geophys. Res. Lett. 1993, 20, 587–590. [Google Scholar] [CrossRef] [Green Version]
  21. Updegraff, K.; Bridgham, S.D.; Pastor, J.; Weishampel, P.; Harth, C. Response of CO2 and CH4 emissions from peatlands to warming and water table manipulation. Ecol. Appl. 2001, 11, 311–326. [Google Scholar] [CrossRef]
  22. Zona, D.; Oechel, W.C.; Kochendorfer, J.; Paw, U.K.T.; Salyuk, A.N.; Olivas, P.C.; Oberbauer, S.F.; Lipson, D.A. Methane fluxes during the initiation of a large-scale water table manipulation experiment in the Alaskan Arctic tundra. Glob. Biogeochem. Cycles 2009, 23. [Google Scholar] [CrossRef]
  23. Cui, L.; Kang, X.; Li, W.; Hao, Y.; Zhang, Y.; Wang, J.; Yan, L.; Zhang, X.; Zhang, M.; Zhou, J.; et al. Rewetting Decreases Carbon Emissions from the Zoige Alpine Peatland on the Tibetan Plateau. Sustainability 2017, 9, 948. [Google Scholar] [CrossRef] [Green Version]
  24. Zhou, W.; Cui, L.; Wang, Y.; Li, W.; Kang, X. Characteristics of methane emission fluxes in the Zoigê Plateau wetland on microtopography. Chin. J. Plant Ecol. 2016, 40, 902–911. [Google Scholar]
  25. Bretz, F.; Hothorn, T.; Westfall, P. Multiple Comparisons Using R; Chapman and Hall/CRC: New York, NY, USA, 2016. [Google Scholar] [CrossRef]
  26. Nakagawa, S.; Schielzeth, H. A general and simple method for obtaining R2 from generalized linear mixed-effects models. Methods Ecol. Evol. 2013, 4, 133–142. [Google Scholar] [CrossRef]
  27. Zhu, Y.; Purdy, K.J.; Eyice, Ö.; Shen, L.; Harpenslager, S.F.; Yvon-Durocher, G.; Dumbrell, A.J.; Trimmer, M. Disproportionate increase in freshwater methane emissions induced by experimental warming. Nat. Clim. Chang. 2020, 10, 685–690. [Google Scholar] [CrossRef]
  28. Kalyuzhnaya, M.G.; Gomez, O.A.; Murrell, J.C. The Methane-Oxidizing Bacteria (Methanotrophs). In Taxonomy, Genomics and Ecophysiology of Hydrocarbon-Degrading Microbes; McGenity, T.J., Ed.; Springer International Publishing: Cham, Switzerland, 2019; pp. 1–34. [Google Scholar] [CrossRef]
  29. Deshmukh, C.S.; Julius, D.; Evans, C.D.; Nardi; Susanto, A.P.; Page, S.E.; Gauci, V.; Laurén, A.; Sabiham, S.; Agus, F.; et al. Impact of forest plantation on methane emissions from tropical peatland. Glob. Chang. Biol. 2020, 26, 2477–2495. [Google Scholar] [CrossRef] [Green Version]
  30. Limpert, K.E.; Carnell, P.E.; Trevathan-Tackett, S.M.; Macreadie, P.I. Reducing Emissions From Degraded Floodplain Wetlands. Front. Environ. Sci. 2020, 8, 18. [Google Scholar] [CrossRef]
  31. Wang, D.-X.; Gao, Y.-H.; An, X.-J.; Wang, R.; Xie, Q.-Y. Responses of greenhouse gas emissions to water table fluctuations in an alpine wetland on the Qinghai-Tibetan Plateau. Acta Prataculturae Sin. 2016, 25, 27–35. [Google Scholar]
  32. Brown, M.G.; Humphreys, E.R.; Moore, T.R.; Roulet, N.T.; Lafleur, P.M. Evidence for a nonmonotonic relationship between ecosystem-scale peatland methane emissions and water table depth. J. Geophys. Res. Biogeosci. 2014, 119, 826–835. [Google Scholar] [CrossRef] [Green Version]
  33. Song, W.; Wang, H.; Wang, G.; Chen, L.; Jin, Z.; Zhuang, Q.; He, J.S. Methane emissions from an alpine wetland on the Tibetan Plateau: Neglected but vital contribution of the nongrowing season. J. Geophys. Res. Biogeosci. 2015, 120, 1475–1490. [Google Scholar] [CrossRef]
  34. Zhang, H.; Yao, Z.; Ma, L.; Zheng, X.; Wang, R.; Wang, K.; Liu, C.; Zhang, W.; Zhu, B.; Tang, X. Annual methane emissions from degraded alpine wetlands in the eastern Tibetan Plateau. Sci. Total Environ. 2019, 657, 1323–1333. [Google Scholar] [CrossRef] [PubMed]
  35. Zhong, Q.; Xue, D.; Chen, H.; Liu, L.; He, Y.; Zhu, D.; He, Z. Structure and distribution of nitrite-dependent anaerobic methane oxidation bacteria vary with water tables in Zoige peatlands. FEMS Microbiol. Ecol. 2020, 96. [Google Scholar] [CrossRef] [PubMed]
  36. Yang, G.; Tian, J.; Chen, H.; Jiang, L.; Zhan, W.; Hu, J.; Zhu, E.; Peng, C.; Zhu, Q.; Zhu, D.; et al. Peatland degradation reduces methanogens and methane emissions from surface to deep soils. Ecol. Indic. 2019, 106, 105488. [Google Scholar] [CrossRef]
  37. Wang, J.; Li, A.; Bian, J. Simulation of the grazing effects on grassland aboveground net primary production using DNDC model combined with time-series remote sensing data—A case study in Zoige Plateau, China. Remote Sens. 2016, 8, 168. [Google Scholar] [CrossRef] [Green Version]
  38. Boke-Olén, N.; Lehsten, V.; Abdi, A.M.; Ardö, J.; Khatir, A.A. Estimating Grazing Potentials in Sudan Using Daily Carbon Allocation in Dynamic Vegetation Model. Rangel. Ecol. Manag. 2018, 71, 792–797. [Google Scholar] [CrossRef]
  39. Thonicke, K.; Venevsky, S.; Sitch, S.; Cramer, W. The role of fire disturbance for global vegetation dynamics: Coupling fire into a Dynamic Global Vegetation Model. Glob. Ecol. Biogeogr. 2001, 10, 661–677. [Google Scholar] [CrossRef] [Green Version]
  40. Li, F.; Zeng, X.; Levis, S. A process-based fire parameterization of intermediate complexity in a Dynamic Global Vegetation Model. Biogeosciences 2012, 9. [Google Scholar] [CrossRef] [Green Version]
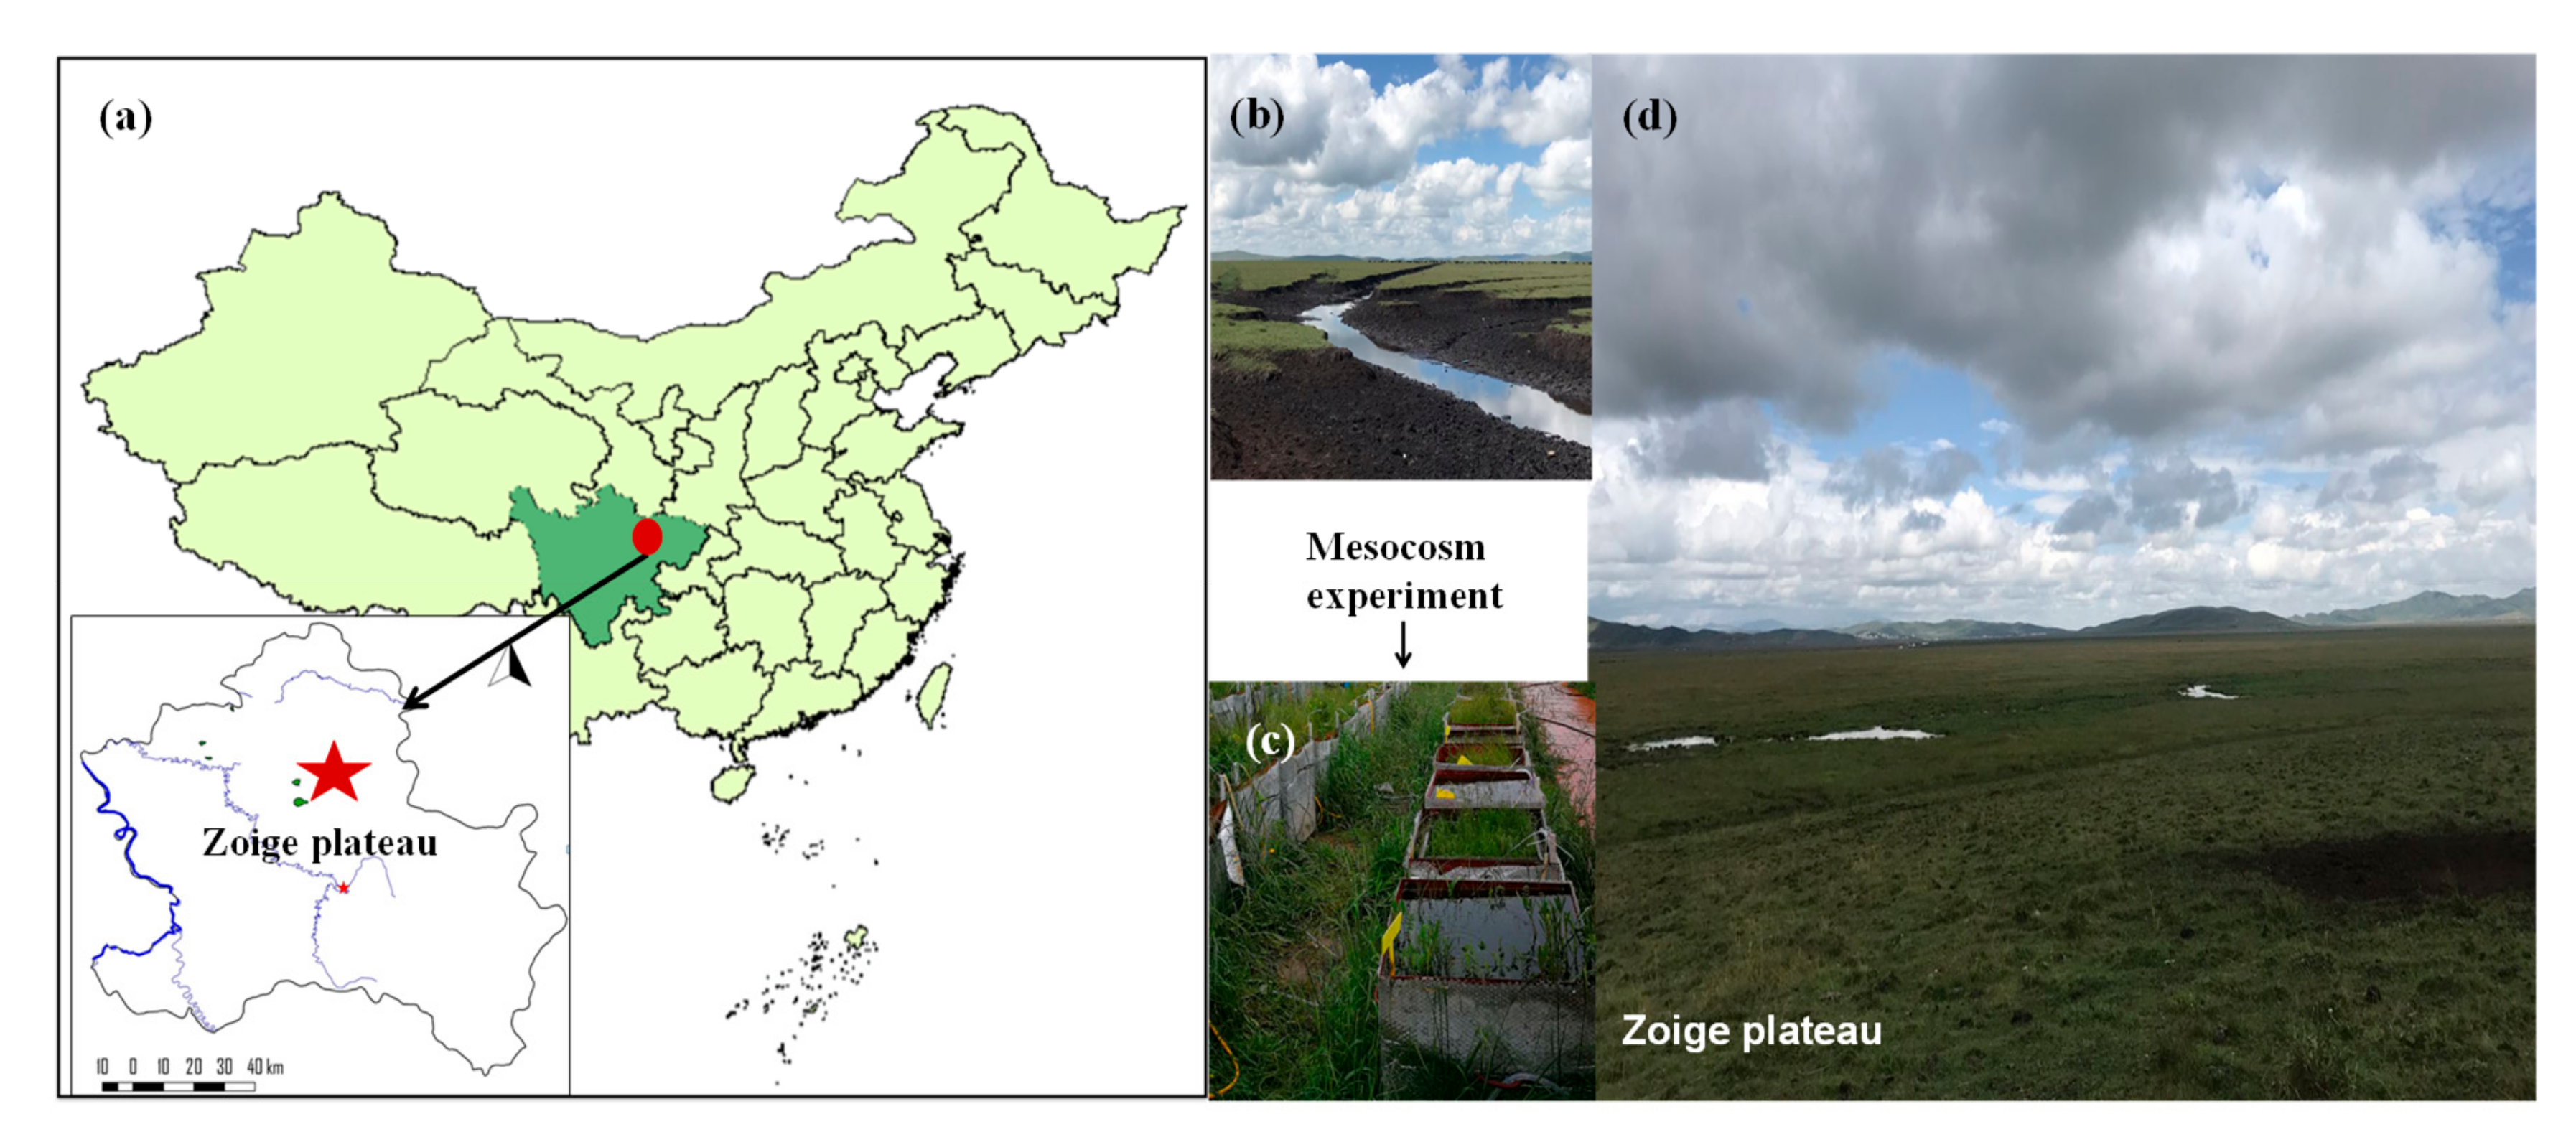
Figure 1. The location of (a) the Zoige plateau; (b) drainage ditch in a Zoige peatland; (c) simulation mesocosms of the experiment; and (d) area where the soil blocks and surface vegetation used in mesocosms were obtained.
Atmosphere 11 01165 g001
Figure 2. Dynamics of daily precipitation and temperature of Zoige in 2017.
Atmosphere 11 01165 g002
Figure 3. Observations of CH4 emissions (mean ± SD) at six water table levels (WTLs) at Zoige.
Atmosphere 11 01165 g003
Figure 4. Relationships between water table levels and CH4 emissions; x represents the water table level and y represents the log-transformed CH4 emissions. The blue line and grey region indicate the regression line and 95% confidence interval, respectively.
Atmosphere 11 01165 g004
Table 1. Results of the multiple comparison analysis using the Tukey post-hoc test with Bonferroni correction. ** and *** indicate significant differences between two groups.
Water Table Level−30 cm−20 cm−10 cm0 cm10 cm20 cm
−30 cm-
−20 cm1 ns-
−10 cmnsns
0 cm2 ****ns
10 cm3 *********ns
20 cm************ns-
1 ns: no significant differences; 2 ** p < 0.01; 3 *** p < 0.001.
Table 2. Estimates of the mixed-effect model as well as the predictors, p values, and marginal and conditional R2.
PredictorsCH4 (Log-Transformed)
EstimatesCIp
Intercept0.420.00–0.830.04
1 WTL0.100.07–0.13<0.001
2 Marginal R2/3 Conditional R20.40/0.44
1 WTL: water table level; 2 Marginal R2: the marginal R2 considers only the variance of the fixed effects; 3 Conditional R2: the conditional R2 considers both the fixed and random effects.
Table 3. Comparison of the percent changes of CH4 emissions with other studies.
SitesLat (°N)Long (°)WTL (cm)Percent Changes in CH4 (%)Reference
Migneint Valley, North Wales, UKN.A.N.A.−5 cm29[15]
Duck Creek North, Australian35.50 S143.87 EN.A38[30]
St. Charles-de-Bellechasse, Canada46.47 N70.17 WN.A55[11]
Central Estonia58.53 N25.85 EN.A.72[18]
Central Estonia58.53 N25.85 EN.A.38[18]
Sanjiang plain, China47.58 N133.52 EN.A75[17]
Zoige, China33.9 N102.6 E−45 cm then recovery52[31]
Haibei, China37.58 N101.33 E−20 cm57[16]
Our study33.9 N102.8 E20 cm to −30 cm100
Lat: latitude; Long: longitude; WTL: water table level.
Publisher’s Note: MDPI stays neutral with regard to jurisdictional claims in published maps and institutional affiliations.