Next Issue
Volume 11, December
Previous Issue
Volume 11, October


Atmosphere, Volume 11, Issue 11 (November 2020) – 128 articles

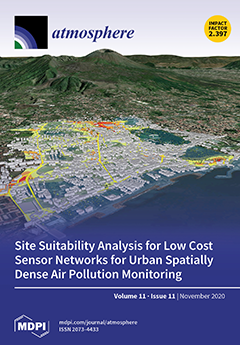
Cover Story (view full-size image): Urban air pollution continues to represent a primary concern for human health. For spatially dense air pollution monitoring, networks of low-cost stations can be deployed, supplementing the sparsely distributed regulatory networks. The determination of appropriate installation locations for these stations is an important consideration. In this study, a site suitability map was generated for deploying a network of low-cost multi-sensor traffic-oriented stations across a city. A site suitability analysis was developed based on the traffic-related emissions (PM2.5, NOx) and street canyon effects. Air quality hotspot areas were identified for capturing the local spatial variability of the air pollutants within the city. View this paper
  • Issues are regarded as officially published after their release is announced to the table of contents alert mailing list.
  • You may sign up for e-mail alerts to receive table of contents of newly released issues.
  • PDF is the official format for papers published in both, html and pdf forms. To view the papers in pdf format, click on the "PDF Full-text" link, and use the free Adobe Reader to open them.
Order results
Result details
Section
Select all
Export citation of selected articles as:
13 pages, 2295 KiB  
Article
Modeling Maximum Tsunami Heights Using Bayesian Neural Networks
by Min-Jong Song and Yong-Sik Cho
Atmosphere 2020, 11(11), 1266; https://doi.org/10.3390/atmos11111266 - 23 Nov 2020
Cited by 12 | Viewed by 2972
Abstract
Tsunamis are distinguished from ordinary waves and currents owing to their characteristic longer wavelengths. Although the occurrence frequency of tsunamis is low, it can contribute to the loss of a large number of human lives as well as property damage. To date, tsunami [...] Read more.
Tsunamis are distinguished from ordinary waves and currents owing to their characteristic longer wavelengths. Although the occurrence frequency of tsunamis is low, it can contribute to the loss of a large number of human lives as well as property damage. To date, tsunami research has concentrated on developing numerical models to predict tsunami heights and run-up heights with improved accuracy because hydraulic experiments are associated with high costs for laboratory installation and maintenance. Recently, artificial intelligence has been developed and has revealed outstanding performance in science and engineering fields. In this study, we estimated the maximum tsunami heights for virtual tsunamis. Tsunami numerical simulation was performed to obtain tsunami height profiles for historical tsunamis and virtual tsunamis. Subsequently, Bayesian neural networks were employed to predict maximum tsunami heights for virtual tsunamis. Full article
(This article belongs to the Special Issue Meteorological Extremes in Korea: Prediction, Assessment, and Impact)
Show Figures

Figure 1

14 pages, 2676 KiB  
Article
The Temporal Evolution of PM2.5 Pollution Events in Taiwan: Clustering and the Association with Synoptic Weather
by Shih-Hao Su, Chiao-Wei Chang and Wei-Ting Chen
Atmosphere 2020, 11(11), 1265; https://doi.org/10.3390/atmos11111265 - 23 Nov 2020
Cited by 8 | Viewed by 3302
Abstract
This study conducted a cluster analysis on the fine particulate matter (PM2.5) data over Taiwan from 2006 to 2015 and diagnosed their association with the synoptic weather patterns. Five clusters are identified via a hierarchical clustering algorithm; three of them correspond [...] Read more.
This study conducted a cluster analysis on the fine particulate matter (PM2.5) data over Taiwan from 2006 to 2015 and diagnosed their association with the synoptic weather patterns. Five clusters are identified via a hierarchical clustering algorithm; three of them correspond to severe events, each with a distinct pattern of temporal evolution within the 240-h window. The occurrence of the different clusters exhibits strong seasonal variation. Two of the polluted clusters are more frequently associated with weak synoptic weather, while the other one is related to northeasterly winds and fronts. Detailed case studies show that the weather patterns’ temporal evolutions clearly modulate the transition among various pollution clusters by influencing the changes in local circulation and atmospheric stability. In winter, the clusters characterizing severe PM2.5 pollution events occur when Taiwan is influenced by persistent weak synoptic condition, while in autumn, the long-range transport by strong northerly winds leads to the occurrence of severe PM2.5 pollution. The current results shed light on the potential of combining the data-driven approach and the numerical weather forecasting model to provide extended range forecasts of local air pollution forecasts. Full article
(This article belongs to the Section Air Quality)
Show Figures

Figure 1

17 pages, 4755 KiB  
Article
Performance Evaluation of an Operational Rapid Response Fire Spread Forecasting System in the Southeast Mediterranean (Greece)
by Theodore M. Giannaros, Konstantinos Lagouvardos and Vassiliki Kotroni
Atmosphere 2020, 11(11), 1264; https://doi.org/10.3390/atmos11111264 - 23 Nov 2020
Cited by 12 | Viewed by 3605
Abstract
The current work presents the operational implementation and evaluation of a rapid response fire spread forecasting system, named IRIS, that was developed to provide support to the tactical wildfire suppression activities of the Hellenic Fire Corps. The system was operationally employed during the [...] Read more.
The current work presents the operational implementation and evaluation of a rapid response fire spread forecasting system, named IRIS, that was developed to provide support to the tactical wildfire suppression activities of the Hellenic Fire Corps. The system was operationally employed during the 2019 fire season in Greece, providing on-demand wildfire spread predictions for 17 incidents. Satellite remote sensing data were employed for quantitatively assessing IRIS’s predictions for eight selected events. Our results suggest an overall satisfactory model performance. More importantly, this study demonstrates that, as coupled fire-atmosphere modeling becomes an increasingly popular approach, the respective models have great potential to support operational agencies and wildfire managers during the incident phase. Full article
(This article belongs to the Special Issue Coupled Fire-Atmosphere Simulation)
Show Figures

Figure 1

17 pages, 2930 KiB  
Article
Forecast Uncertainty of Rapid Intensification of Typhoon Dujuan (201521) Induced by Uncertainty in the Boundary Layer
by Xiaohao Qin and Wansuo Duan
Atmosphere 2020, 11(11), 1263; https://doi.org/10.3390/atmos11111263 - 23 Nov 2020
Cited by 3 | Viewed by 2154
Abstract
Using ensemble forecast experiments generated by the weather research and forecasting model, the forecast uncertainties of intensity and its rapid intensification (RI) induced by the uncertainty occurring in the boundary layer are investigated for Typhoon Dujuan (201521). The results show that the uncertainty [...] Read more.
Using ensemble forecast experiments generated by the weather research and forecasting model, the forecast uncertainties of intensity and its rapid intensification (RI) induced by the uncertainty occurring in the boundary layer are investigated for Typhoon Dujuan (201521). The results show that the uncertainty in the boundary layer in the typhoon area, compared with that in other areas of the model domain, not only leads to a much larger forecast uncertainty of the typhoon intensity but also considerably perturbs the RI forecast uncertainty. Particularly, the uncertainty in the gale area in the boundary layer, compared with that in the inner-core and other areas, makes a much larger contribution to the forecast uncertainty of typhoon intensity, with the perturbations including moisture component being most strongly correlated with the occurrence of RI. Further analyses show that such perturbations increase the maximum tangential wind in the boundary layer and enhance the vorticity in the eyewall, which then facilitate the spin-up of the inner-core and induce the occurrence of RI. It is inferred that more observations, especially those associated with the moisture, should be preferentially assimilated in the gale area within the boundary layer of a tropical cyclone, which will help improve the forecast skill of the RI. These results also tell us that the boundary layer parameterization scheme should be further developed to improve the forecast skill of tropical cyclone intensity and its RI behavior. Full article
(This article belongs to the Special Issue Asia-Pacific Region: Monsoons and Typhoons)
Show Figures

Figure 1

16 pages, 5230 KiB  
Article
Impact of VOCs and NOx on Ozone Formation in Moscow
by Elena Berezina, Konstantin Moiseenko, Andrei Skorokhod, Natalia V. Pankratova, Igor Belikov, Valery Belousov and Nikolai F. Elansky
Atmosphere 2020, 11(11), 1262; https://doi.org/10.3390/atmos11111262 - 23 Nov 2020
Cited by 43 | Viewed by 7399
Abstract
Volatile organic compounds (VOCs), ozone (O3), nitrogen oxides (NOx), carbon monoxide (CO), meteorological parameters, and total non-methane hydrocarbons (NMHC) were analyzed from simultaneous measurements at the MSU-IAP (Moscow State University—Institute of Atmospheric Physics) observational site in Moscow from 2011–2013. Seasonal and [...] Read more.
Volatile organic compounds (VOCs), ozone (O3), nitrogen oxides (NOx), carbon monoxide (CO), meteorological parameters, and total non-methane hydrocarbons (NMHC) were analyzed from simultaneous measurements at the MSU-IAP (Moscow State University—Institute of Atmospheric Physics) observational site in Moscow from 2011–2013. Seasonal and diurnal variability of the compounds was studied. The highest O3 concentration in Moscow was observed in the summer daytime periods in anticyclonic meteorological conditions under poor ventilation of the atmospheric boundary layer and high temperatures (up to 105 ppbv or 210 μg/m3). In contrast, NOx, CO, and benzene decreased from 8 a.m. to 5–6 p.m. local time (LT). The high positive correlation of daytime O3 with secondary VOCs affirmed an important role of photochemical O3 production in Moscow during the summers of 2011–2013. The summertime average concentrations of the biogenic VOCs isoprene and monoterpenes were observed to be 0.73 ppbv and 0.53 ppbv, respectively. The principal source of anthropogenic VOCs in Moscow was established to be local vehicle emissions. Yet, only about 5% of the observed isoprene was safely attributed to anthropogenic sources, suggesting significant contribution of biogenic sources into the total levels of ozone precursors. The non-linear O3–NOx dependence shows a decrease in ground-level O3 with an increase in NOx during the summers of 2011–2013, which is typical for the VOC-sensitive photochemical regime of O3 formation. Nevertheless, during the elevated ozone episodes in July 2011, the photochemical regime of ozone production was either transitional or NOx-sensitive. Contribution of various anthropogenic and biogenic VOCs into the measured ozone values was evaluated. The ozone-forming potential (OFP) of total VOCs was 31–67 μg/m3 on average and exceeded 100 μg/m3 in the top 10% of high ozone events, reaching 136 μg/m3. Acetaldehyde, 1.3-butadiene, and isoprene have the highest ozone production potential in Moscow compared to that of other measured VOCs. Full article
(This article belongs to the Special Issue Tropospheric Ozone Observations)
Show Figures

Figure 1

28 pages, 2523 KiB  
Article
Spatio-Temporal Variation of Ozone Concentrations and Ozone Uptake Conditions in Forests in Western Germany
by Hanieh Eghdami, Willy Werner and Patrick Büker
Atmosphere 2020, 11(11), 1261; https://doi.org/10.3390/atmos11111261 - 23 Nov 2020
Cited by 4 | Viewed by 2679
Abstract
The study analyzes the long-term trends (1998–2019) of concentrations of the air pollutants ozone (O3) and nitrogen oxides (NOx) as well as meteorological conditions at forest sites in German midrange mountains to evaluate changes in O3 uptake conditions [...] Read more.
The study analyzes the long-term trends (1998–2019) of concentrations of the air pollutants ozone (O3) and nitrogen oxides (NOx) as well as meteorological conditions at forest sites in German midrange mountains to evaluate changes in O3 uptake conditions for trees over time at a plot scale. O3 concentrations did not show significant trends over the course of 22 years, unlike NO2 and NO, whose concentrations decreased significantly since the end of the 1990s. Temporal analyses of meteorological parameters found increasing global radiation at all sites and decreasing precipitation, vapor pressure deficit (VPD), and wind speed at most sites (temperature did not show any trend). A principal component analysis revealed strong correlations between O3 concentrations and global radiation, VPD, and temperature. Examination of the atmospheric water balance, a key parameter for O3 uptake, identified some unusually hot and dry years (2003, 2011, 2018, and 2019). With the help of a soil water model, periods of plant water stress were detected. These periods were often in synchrony with periods of elevated daytime O3 concentrations and usually occurred in mid and late summer, but occasionally also in spring and early summer. This suggests that drought protects forests against O3 uptake and that, in humid years with moderate O3 concentrations, the O3 flux was higher than in dry years with higher O3 concentrations. Full article
Show Figures

Figure 1

14 pages, 4443 KiB  
Article
Wet Inorganic Nitrogen Deposition at the Daheitin Reservoir in North China: Temporal Variation, Sources, and Biomass Burning Influences
by Leixiang Wu, Xiaobo Liu, Kun Li, Wanyun Xu, Wei Huang, Panwei Zhang, Xiaohui Zhao, Chang Liu, Gen Zhang and Linlin Liang
Atmosphere 2020, 11(11), 1260; https://doi.org/10.3390/atmos11111260 - 23 Nov 2020
Cited by 6 | Viewed by 2550
Abstract
Atmospheric nitrogen deposition is of great concern to both air quality and the ecosystem, particularly in northern China, which covers one-quarter of China’s cultivated land and has many heavily air polluted cities. To understand the characteristics of wet N deposition at rural sites [...] Read more.
Atmospheric nitrogen deposition is of great concern to both air quality and the ecosystem, particularly in northern China, which covers one-quarter of China’s cultivated land and has many heavily air polluted cities. To understand the characteristics of wet N deposition at rural sites in northern China, one-year wet deposition samples were collected in the Daheitin reservoir region. Due to the intense emissions of gaseous nitrogen compounds from heating activities during cold seasons and distinct dilution effects under different rainfall intensities and frequencies, the volume weighted mean concentrations of wet N deposition showed higher levels in dry seasons but lower levels in wet seasons. In contrast, the wet N deposition rates varied consistently with precipitation, i.e., high during the wet season and lower during the dry season. The annual wet deposition rate of total inorganic ions (the sum of NO3–N and NH4+–N) at the rural site in North China from July 2019 to June 2020 was observed at 18.9 kg N ha−1 yr−1, still remained at a relatively high level. In addition, biomass burning activities are ubiquitous in China, especially in northern China; however, studies on its impact on wet N deposition are limited. Non-sea salt potassium ion (nss-K+) was employed as a molecular tracer to investigate the characteristics of biomass burning activities as well as their impact on the chemical properties of wet N deposition. Three precipitation events with high nss-K+ levels were captured during the harvest season (June to July). The variations in the patterns of nss-K+, deposited N species, and ratios of nss-K+ to nitrogen species as well as their relationships all indicated that biomass burning emissions contributed remarkably to NO3–N but had a minor influence on NH4+–N. Full article
(This article belongs to the Section Biosphere/Hydrosphere/Land–Atmosphere Interactions)
Show Figures

Figure 1

16 pages, 3246 KiB  
Article
Future Changes in the Free Tropospheric Freezing Level and Rain–Snow Limit: The Case of Central Chile
by Piero Mardones and René D. Garreaud
Atmosphere 2020, 11(11), 1259; https://doi.org/10.3390/atmos11111259 - 23 Nov 2020
Cited by 13 | Viewed by 3933
Abstract
The freezing level in the free troposphere often intercepts the terrain of the world’s major mountain ranges, creating a rain–snow limit. In this work, we use the free tropospheric height of the 0 °C isotherm (H0) as a proxy [...] Read more.
The freezing level in the free troposphere often intercepts the terrain of the world’s major mountain ranges, creating a rain–snow limit. In this work, we use the free tropospheric height of the 0 °C isotherm (H0) as a proxy of both levels and study its distribution along the western slope of the subtropical Andes (30°–38° S) in present climate and during the rest of the 21st century. This portion of the Andes corresponds to central Chile, a highly populated region where warm winter storms have produced devastating landslides and widespread flooding in the recent past. Our analysis is based on the frequency distribution of H0 derived from radiosonde and surface observations, atmospheric reanalysis and climate simulations. The future projections primarily employ a scenario of heavy greenhouse gasses emissions (RCP8.5), but we also examine the more benign RCP4.5 scenario. The current H0 distribution along the central Chile coast shows a gradual decrease southward, with mean heights close to 2600 m ASL (above sea level) at 30 °C S to 2000 m ASL at 38° S for days with precipitation, about 800 m lower than during dry days. The mean value under wet conditions toward the end of the century (under RCP8.5) is close to, or higher than, the upper quartile of the H0 distribution in the current climate. More worrisome, H0 values that currently occur only 5% of the time will be exceeded in about a quarter of the rainy days by the end of the century. Under RCP8.5, even moderate daily precipitation can increase river flow to levels that are considered hazardous for central Chile. Full article
Show Figures

Figure 1

12 pages, 3547 KiB  
Article
Contribution of Regional PM2.5 Transport to Air Pollution Enhanced by Sub-Basin Topography: A Modeling Case over Central China
by Weiyang Hu, Tianliang Zhao, Yongqing Bai, Lijuan Shen, Xiaoyun Sun and Yao Gu
Atmosphere 2020, 11(11), 1258; https://doi.org/10.3390/atmos11111258 - 22 Nov 2020
Cited by 24 | Viewed by 2938
Abstract
The Twain-Hu basin (THB), covering the lower plain of Hubei and Hunan provinces in Central China, has experienced severe air pollution in recent years. However, the terrain effects of such sub-basin on air quality over the THB have been incomprehensibly understood. A heavy [...] Read more.
The Twain-Hu basin (THB), covering the lower plain of Hubei and Hunan provinces in Central China, has experienced severe air pollution in recent years. However, the terrain effects of such sub-basin on air quality over the THB have been incomprehensibly understood. A heavy PM2.5 pollution event occurred over the THB during 4–10 January 2019. By using the observations and WRF-Chem simulations, we investigated the underlying mechanisms of sub-basin effects on the air pollution with several sensitivity experiments. Observationally, air pollution in the western THB urban area with an average PM2.5 concentration of 189.8 μg m−3, which was more serious than the eastern urban area with the average PM2.5 concentration of 106.3 μg m−3, reflecting a different influence of topography on air pollution over the THB. Simulation results revealed that the terrain effect can contribute 12.0% to increasing the PM2.5 concentrations in the western THB, but slightly mitigate the pollution extent in the eastern THB with the contribution of −4.6% to PM2.5 during the heavy pollution episode. In particular, the sub-basin terrain was conducive to the accumulation of PM2.5 by regional transport with the contribution of 39.1 %, and contrarily lowered its local pollution by −57.0% via the enhanced atmospheric boundary layer height and ventilation coefficients. Given a heavy air pollution episode occurring over the THB, such inverse contribution of terrain effects reflected a unique importance of sub-basin topography in regional transport of air pollutants for air pollution in central China. Full article
(This article belongs to the Special Issue Aerosol Pollution in Asia)
Show Figures

Graphical abstract

26 pages, 12025 KiB  
Article
Air-Traffic Restrictions at the Madeira International Airport Due to Adverse Winds: Links to Synoptic-Scale Patterns and Orographic Effects
by Margarida Belo-Pereira and João A. Santos
Atmosphere 2020, 11(11), 1257; https://doi.org/10.3390/atmos11111257 - 22 Nov 2020
Cited by 11 | Viewed by 3699
Abstract
The Madeira International Airport (MIA) lies on the island’s south-eastern coast and it is known to be exposed to wind hazards. A link between these adverse winds at MIA and the synoptic-scale circulation is established using a weather type (WT) classification. From April [...] Read more.
The Madeira International Airport (MIA) lies on the island’s south-eastern coast and it is known to be exposed to wind hazards. A link between these adverse winds at MIA and the synoptic-scale circulation is established using a weather type (WT) classification. From April to September (summer period), five WTs prevail, cumulatively representing nearly 70% of days. These WTs reflect the presence of well-established Azores high, with some variations on location and strength. Although with a low frequency of occurrence (<5%), this anticyclone occasionally strengthens and extends towards Iberia, inducing anomalously strong NNE/NE up to 3–5 km over Madeira. The most severe and longer-lasting wind conditions at the MIA, with a higher frequency of gusts above 35 kt, are driven by this synoptic-scale pattern and are more common in summer. An episode of adverse winds at the MIA is analysed, illustrating the occurrence of upstream stagnation, flow splitting, and lee wake formation. The upstream conditions include a low-level inversion, strong NNE/NE winds near and above the inversion and a Froude number less than 1. The AROME (Application of Research to Operations at Mesoscale) model predicted the occurrence of downslope winds, in association with a large-amplitude mountain wave. At this time, the strongest wind gusts were registered and one aircraft executed a missed approach. The wind regime in different places of the island suggests that these conditions are relatively frequent, mostly in summer. Finally, objective verification of AROME wind forecast, for a three-year period and from June to August, is discussed. Full article
(This article belongs to the Special Issue Weather and Aviation Safety)
Show Figures

Figure 1

22 pages, 4118 KiB  
Article
Extending Limited In Situ Mountain Weather Observations to the Baseline Climate: A True Verification Case Study
by Marlis Hofer and Johannes Horak
Atmosphere 2020, 11(11), 1256; https://doi.org/10.3390/atmos11111256 - 21 Nov 2020
Viewed by 2470
Abstract
The availability of in situ atmospheric observations decreases with elevation and topographic complexity. Data sets based on numerical atmospheric modeling, such as reanalysis data sets, represent an alternative source of information, but they often suffer from inaccuracies, e.g., due to insufficient spatial resolution. [...] Read more.
The availability of in situ atmospheric observations decreases with elevation and topographic complexity. Data sets based on numerical atmospheric modeling, such as reanalysis data sets, represent an alternative source of information, but they often suffer from inaccuracies, e.g., due to insufficient spatial resolution. sDoG (statistical Downscaling for Glacierized mountain environments) is a reanalysis data postprocessing tool designed to extend short-term weather station data from high mountain sites to the baseline climate. In this study, sDoG is applied to ERA-Interim predictors to produce a retrospective forecast of daily air temperature at the Vernagtbach climate monitoring site (2640 MSL) in the Central European Alps. First, sDoG is trained and cross-validated using observations from 2002 to 2012 (cross-validation period). Then, the sDoG retrospective forecast and its cross-validation-based uncertainty estimates are evaluated for the period 1979–2001 (hereafter referred to as the true evaluation period). We demonstrate the ability of sDoG to model air temperature in the true evaluation period for different temporal scales: day-to-day variations, year-to-year and season-to-season variations, and the 23-year mean seasonal cycle. sDoG adds significant value over a selection of reference data sets available for the site at different spatial resolutions, including state-of-the-art global and regional reanalysis data sets, output by a regional climate model, and an observation-based gridded product. However, we identify limitations of sDoG in modeling summer air temperature variations particularly evident in the first part of the true evaluation period. This is most probably related to changes of the microclimate around the Vernagtbach climate monitoring site that violate the stationarity assumption underlying sDoG. When comparing the performance of the considered reference data sets, we cannot demonstrate added value of the higher resolution data sets over the data sets with lower spatial resolution. For example, the global reanalyses ERA5 (31 km resolution) and ERA-Interim (80 km resolution) both clearly outperform the higher resolution data sets ERA5-Land (9 km resolution), UERRA HARMONIE (11 km resolution), and UERRA MESCAN-SURFEX (5.5 km resolution). Performance differences among ERA5 and ERA-Interim, by contrast, are comparably small. Our study highlights the importance of station-scale uncertainty assessments of atmospheric numerical model output and downscaling products for high mountain areas both for data users and model developers. Full article
(This article belongs to the Special Issue Climatological and Hydrological Processes in Mountain Regions)
Show Figures

Figure 1

11 pages, 1463 KiB  
Article
Effectiveness and Eco-Costs of Air Cleaners in Terms of Improving Fungal Air Pollution in Dwellings Located in Southern Poland—A Preliminary Study
by Ewa Brągoszewska, Magdalena Bogacka and Krzysztof Pikoń
Atmosphere 2020, 11(11), 1255; https://doi.org/10.3390/atmos11111255 - 21 Nov 2020
Cited by 3 | Viewed by 2827
Abstract
Epidemiological evidence shows that air pollution is responsible for several million premature deaths per year. By virtue of being responsible for these deaths, economic evidence shows that air pollution also imposes a so-called economic cost to society of several trillion dollars per year. [...] Read more.
Epidemiological evidence shows that air pollution is responsible for several million premature deaths per year. By virtue of being responsible for these deaths, economic evidence shows that air pollution also imposes a so-called economic cost to society of several trillion dollars per year. The diseases caused by biological air pollutants are of primary global concern for both social and economic reasons, and given that people may spend more than 90% of their time in enclosed spaces, the investigation into methods to remove indoor air pollutants is of paramount importance. One of the methods to improve indoor air quality (IAQ) is to use air cleaners (ACLs) with high-efficiency particulate air filters (HEPA) that remove biological indoor air pollutants from indoor environments. This work presents the results of a study of fungal aerosol samples collected during the summer season from inside two dwellings (DG1 and DG2) before and after starting the use of ACLs. The fungal aerosol samples collected from each of the six stages of the sampler were incubated on agar plates at 26 °C, and the colony forming units (CFU) were manually counted and statistically corrected. The concentration of living airborne fungi was expressed as the CFU in the volume of air (CFU·m−3). The average concentration of fungal aerosol decreased the most when the ACLs were active for 24 min. The reduction was from 474 CFU·m−3 to 306 CFU·m−3, and from 582 CFU·m−3 to 338 CFU·m−3 in DG1 and DG2, respectively. The use of ACLs was assessed by the life cycle assessment (LCA) methodology. This study highlights the benefits of controlling biological air pollutants in order to keep occupants of buildings happy and healthy. Full article
Show Figures

Figure 1

37 pages, 22354 KiB  
Article
A Practicable Measurement Strategy for Compliance Checking Number Concentrations of Airborne Nano- and Microscale Fibers
by Asmus Meyer-Plath, Daphne Bäger, Nico Dziurowitz, Doris Perseke, Barbara Katrin Simonow, Carmen Thim, Daniela Wenzlaff and Sabine Plitzko
Atmosphere 2020, 11(11), 1254; https://doi.org/10.3390/atmos11111254 - 20 Nov 2020
Cited by 8 | Viewed by 2989 | Correction
Abstract
Despite compelling reports on asbestos-like pathogenicity, regulatory bodies have been hesitant to implement fiber number-based exposure limits for biodurable nanoscale fibers. One reason has been the lack of a practicable strategy for assessing airborne fiber number concentrations. Here, a method is proposed, detailed [...] Read more.
Despite compelling reports on asbestos-like pathogenicity, regulatory bodies have been hesitant to implement fiber number-based exposure limits for biodurable nanoscale fibers. One reason has been the lack of a practicable strategy for assessing airborne fiber number concentrations. Here, a method is proposed, detailed and tested for compliance checking concentrations of airborne nano- and microscale fibers. It relies on Poisson statistical significance testing of the observed versus a predicted number of fibers on filters that have sampled a known volume of aerosol. The prediction is based on the exposure concentration to test. Analogous to the established counting rules for WHO-fibers, which use a phase contrast microscopy-related visibility criterion of 200 nm, the new method also introduces a cut-off diameter, now at 20 nm, which is motivated by toxicological findings on multi-walled carbon nanotubes. This cut-off already reduces the workload by a factor of 400 compared to that necessary for imaging, detecting and counting nanofibers down to 1 nm in diameter. Together with waiving any attempt to absolutely quantify fiber concentrations, a compliance check at the limit-of-detection results in an analytical workload that renders our new approach practicable. The proposed method was applied to compliance checking in 14 very different workplaces that handled or machined nanofiber-containing materials. It achieved detecting violations of the German benchmark exposure level of 10,000 nanofibers per cubic meter. Full article
(This article belongs to the Special Issue Advancements in the Reduction of Submicron Particle Concentrations)
Show Figures

Figure 1

18 pages, 3866 KiB  
Article
Seasonal Variations of High-Frequency Gravity Wave Momentum Fluxes and Their Forcing toward Zonal Winds in the Mesosphere and Lower Thermosphere over Langfang, China (39.4° N, 116.7° E)
by Caixia Tian, Xiong Hu, Yurong Liu, Xuan Cheng, Zhaoai Yan and Bing Cai
Atmosphere 2020, 11(11), 1253; https://doi.org/10.3390/atmos11111253 - 20 Nov 2020
Cited by 5 | Viewed by 2165
Abstract
Meteor radar data collected over Langfang, China (39.4° N, 116.7° E) were used to estimate the momentum flux of short-period (less than 2 h) gravity waves (GWs) in the mesosphere and lower thermosphere (MLT), using the Hocking (2005) analysis technique. Seasonal variations in [...] Read more.
Meteor radar data collected over Langfang, China (39.4° N, 116.7° E) were used to estimate the momentum flux of short-period (less than 2 h) gravity waves (GWs) in the mesosphere and lower thermosphere (MLT), using the Hocking (2005) analysis technique. Seasonal variations in GW momentum flux exhibited annual oscillation (AO), semiannual oscillation (SAO), and quasi-4-month oscillation. Quantitative estimations of GW forcing toward the mean zonal flow were provided using the determined GW momentum flux. The mean flow acceleration estimated from the divergence of this flux was compared with the observed acceleration of zonal winds displaying SAO and quasi-4-month oscillations. These comparisons were used to analyze the contribution of zonal momentum fluxes of SAO and quasi-4-month oscillations to zonal winds. The estimated acceleration from high-frequency GWs was in the same direction as the observed acceleration of zonal winds for quasi-4-month oscillation winds, with GWs contributing more than 69%. The estimated acceleration due to Coriolis forces to the zonal wind was studied; the findings were opposite to the estimated acceleration of high-frequency GWs for quasi-4-month oscillation winds. The significance of this study lies in estimating and quantifying the contribution of the GW momentum fluxes to zonal winds with quasi-4-month periods over mid-latitude regions for the first time. Full article
Show Figures

Figure 1

26 pages, 5562 KiB  
Article
Inter-Comparison of Gauge-Based Gridded Data, Reanalysis and Satellite Precipitation Product with an Emphasis on Hydrological Modeling
by Sridhara Setti, Rathinasamy Maheswaran, Venkataramana Sridhar, Kamal Kumar Barik, Bruno Merz and Ankit Agarwal
Atmosphere 2020, 11(11), 1252; https://doi.org/10.3390/atmos11111252 - 20 Nov 2020
Cited by 32 | Viewed by 4637
Abstract
Precipitation is essential for modeling the hydrologic behavior of watersheds. There exist multiple precipitation products of different sources and precision. We evaluate the influence of different precipitation product on model parameters and streamflow predictive uncertainty using a soil water assessment tool (SWAT) model [...] Read more.
Precipitation is essential for modeling the hydrologic behavior of watersheds. There exist multiple precipitation products of different sources and precision. We evaluate the influence of different precipitation product on model parameters and streamflow predictive uncertainty using a soil water assessment tool (SWAT) model for a forest dominated catchment in India. We used IMD (gridded rainfall dataset), TRMM (satellite product), bias-corrected TRMM (corrected satellite product) and NCEP-CFSR (reanalysis dataset) over a period from 1998–2012 for simulating streamflow. The precipitation analysis using statistical measures revealed that the TRMM and CFSR data slightly overestimate rainfall compared to the ground-based IMD data. However, the TRMM estimates improved, applying a bias correction. The Nash–Sutcliffe (and R2) values for TRMM, TRMMbias and CFSR, are 0.58 (0.62), 0.62 (0.63) and 0.52 (0.54), respectively at model calibrated with IMD data (Scenario A). The models of each precipitation product (Scenario B) yielded Nash–Sutcliffe (and R2) values 0.71 (0.76), 0.74 (0.78) and 0.76 (0.77) for TRMM, TRMMbias and CFSR datasets, respectively. Thus, the hydrological model-based evaluation revealed that the model calibration with individual rainfall data as input showed increased accuracy in the streamflow simulation. IMD and TRMM forced models to perform better in capturing the streamflow simulations than the CFSR reanalysis-driven model. Overall, our results showed that TRMM data after proper correction could be a good alternative for ground observations for driving hydrological models. Full article
Show Figures

Figure 1

25 pages, 3470 KiB  
Article
New Record of Dust Input and Provenance During Glacial Periods in Western Australia Shelf (IODP Expedition 356, Site U1461) from the Middle to Late Pleistocene
by Margot Courtillat, Maximilian Hallenberger, Maria-Angela Bassetti, Dominique Aubert, Catherine Jeandel, Lars Reuning, Chelsea Korpanty, Pierre Moissette, Stéphanie Mounic and Mariem Saavedra-Pellitero
Atmosphere 2020, 11(11), 1251; https://doi.org/10.3390/atmos11111251 - 20 Nov 2020
Cited by 11 | Viewed by 4775
Abstract
International Ocean Discovery Program (IODP) Expedition 356 Site U1461 represents one of the few records from the North West Australian shelf that provides information about aridity fluctuations in Australia during the Quaternary. A combination of chronostratigraphic indicators revealed the (partial) preservation of two [...] Read more.
International Ocean Discovery Program (IODP) Expedition 356 Site U1461 represents one of the few records from the North West Australian shelf that provides information about aridity fluctuations in Australia during the Quaternary. A combination of chronostratigraphic indicators revealed the (partial) preservation of two major glaciations (Marine Isotope Stage (MIS) 2 and MIS 12) in the sedimentary record. The faunal content (mainly benthic foraminifera, corals and bryozoans) was analyzed to estimate paleo-environments and paleo-depths in order to determine if these sediments have been remobilized by reworking processes. Despite the occurrence of a depositional hiatus (including MIS 5d to MIS 9-time interval), the excellent preservation of faunal content suggests that the preserved sediment is in situ. The geochemical composition of the sediments (Nd and major elements) indicates that during MIS 12 riverine input was likely reduced because of enhanced aridity, and the sediment provenance (mainly atmospheric dust) is likely in the central (Lake Eyre) or eastern (Murray Darling Basin) parts of the Australian continent. MIS 2 is confirmed to be one of the driest periods recorded in Australia but with mixed dust sources from the eastern and western parts of the continent. More humid conditions followed the glacial maximum, which might correspond to the peak of the Indian-Australian Summer Monsoon. Full article
(This article belongs to the Special Issue Paleoclimate and Its Connection with Future Climate Change)
Show Figures

Figure 1

3 pages, 167 KiB  
Editorial
Regional Climate Modelling with COSMO-CLM: History and Perspectives
by Christian Steger and Edoardo Bucchignani
Atmosphere 2020, 11(11), 1250; https://doi.org/10.3390/atmos11111250 - 20 Nov 2020
Cited by 12 | Viewed by 2932
Abstract
The history of the COSMO (COnsortium for Small-scale Modelling) model goes back to the early 1990s, when the Deutscher Wetterdienst (German Meteorological Service, DWD) decided to develop a non-hydrostatic model, the Lokalmodell (LM) [...] Full article
26 pages, 33162 KiB  
Article
Mutual Interference of Local Gravity Wave Forcings in the Stratosphere
by Nadja Samtleben, Aleš Kuchař, Petr Šácha, Petr Pišoft and Christoph Jacobi
Atmosphere 2020, 11(11), 1249; https://doi.org/10.3390/atmos11111249 - 19 Nov 2020
Cited by 2 | Viewed by 2817
Abstract
Gravity wave (GW) breaking and associated GW drag is not uniformly distributed among latitudes and longitudes. In particular, regions of enhanced GW breaking, so-called GW hotspots, have been identified, major Northern Hemisphere examples being located above the Rocky Mountains, the Himalayas and the [...] Read more.
Gravity wave (GW) breaking and associated GW drag is not uniformly distributed among latitudes and longitudes. In particular, regions of enhanced GW breaking, so-called GW hotspots, have been identified, major Northern Hemisphere examples being located above the Rocky Mountains, the Himalayas and the East Asian region. These hotspots influence the middle atmosphere circulation both individually and in combination. Their interference is here examined by performing simulations including (i) the respective single GW hotspots, (ii) two GW hotspots, and (iii) all three GW hotspots with a simplified global circulation model. The combined GW hotspots lead to a modification of the polar vortex in connection with a zonal mean flow decrease and an increase of the temperature at higher latitudes. The different combinations of GW hotspots mainly prevent the stationary planetary wave (SPW) 1 from propagating upward at midlatitudes leading to a decrease in energy and momentum transfer in the middle atmosphere caused by breaking SPW 1, and in turn to an acceleration of the zonal mean flow at lower latitudes. In contrast, the GW hotspot above the Rocky Mountains alone causes an increase in SPW 1 amplitude and Eliassen–Palm flux (EP flux), inducing enhanced negative EP divergence, decelerating the zonal mean flow at higher latitudes. Consequently, none of the combinations of different GW hotspots is comparable to the impact of the Rocky Mountains GW hotspot alone. The reason is that the GW hotspots mostly interfere nonlinearly. Depending on the longitudinal distance between two GW hotspots, the interference between the combined Rocky Mountains and East Asian GW hotspots is more additive than the interference between the combined Rocky Mountains and Himalaya GW hotspots. While the Rocky Mountains and the East Asian GW hotspots are longitudinally displaced by 105°, the Rocky Mountains are shifted by 170° to the Himalayas. Moreover, while the East Asian and the Himalayas are located side by side, the interference between these GW hotspots is the most nonlinear because they are latitudinally displaced by 20°. In general, the SPW activity, e.g., represented in SPW amplitudes, EP flux or Plumb flux, is strongly reduced, when the GW hotspots are interacting with each other. Thus, the interfering GW hotspots mostly have a destructive effect on SPW propagation and generation. Full article
(This article belongs to the Special Issue Coupling of Lower, Middle, and Upper Atmosphere)
Show Figures

Figure 1

17 pages, 5829 KiB  
Article
The Influence of Five Teleconnection Patterns on Wintertime Extratropical Cyclones over Northwest Pacific
by Naru Xie, Yidi Sun and Meng Gao
Atmosphere 2020, 11(11), 1248; https://doi.org/10.3390/atmos11111248 - 19 Nov 2020
Cited by 3 | Viewed by 2209
Abstract
Extratropical cyclones (ETCs) over the Northwest Pacific are identified and tracked by applying an objective tracking algorithm to the 6-h time interval relative vorticity fields from the European Center for Medium-range Weather Forecasts (ECMWF) reanalysis data. A total of 2145 ETCs in the [...] Read more.
Extratropical cyclones (ETCs) over the Northwest Pacific are identified and tracked by applying an objective tracking algorithm to the 6-h time interval relative vorticity fields from the European Center for Medium-range Weather Forecasts (ECMWF) reanalysis data. A total of 2145 ETCs in the November–February winters for the period of 1979–2018 were identified. First, by comparing the ETC track densities in the two periods 1979–1998 and 1999–2018, a significant difference in ETC track density was detected over the Japan Sea, Japan, and North Pacific. Next, the influence of five teleconnection patterns, the El Niño-Southern Oscillation (ENSO), Western Pacific (WP), North Atlantic Oscillation (NAO), Pacific/North American (PNA), and Pacific Decadal Oscillation (PDO) on the ETC track density was investigated by using composite analysis and correlation analysis. WP, NAO, and PDO patterns contributed more to the interannual variability of ETC track density, and higher cyclone densities usually occur in the negative phase of these teleconnection patterns. In contrast, the effects of ENSO and PNA were relatively weak. Finally, a Poisson generalized linear regression model for the ETC counts with respect to the five teleconnection indices was also developed for the purpose of linking all the teleconnection patterns with ETC activities over Northwest Pacific; and the Bayesian model averaging (BMA) procedure was used for model selection in the statistical modeling. The influence of the five teleconnection patterns on ETC track density was also verified in the regression model. The predicted winter ETC counts agreed well with the historical records during 1979–2018 over the Northwest Pacific. Full article
(This article belongs to the Section Climatology)
Show Figures

Figure 1

20 pages, 3587 KiB  
Article
Acceleration-Based In Situ Eddy Dissipation Rate Estimation with Flight Data
by Zhenxing Gao, Haofeng Wang, Kai Qi, Zhiwei Xiang and Debao Wang
Atmosphere 2020, 11(11), 1247; https://doi.org/10.3390/atmos11111247 - 19 Nov 2020
Cited by 6 | Viewed by 3006
Abstract
Inducing civil aviation aircraft to bumpiness, atmospheric turbulence is a typical risk that seriously threatens flight safety. The Eddy Dissipation Rate (EDR) value, as an aircraft-independent turbulence severity indicator, is estimated by a vertical wind-based or aircraft vertical acceleration-based algorithm. Based on the [...] Read more.
Inducing civil aviation aircraft to bumpiness, atmospheric turbulence is a typical risk that seriously threatens flight safety. The Eddy Dissipation Rate (EDR) value, as an aircraft-independent turbulence severity indicator, is estimated by a vertical wind-based or aircraft vertical acceleration-based algorithm. Based on the flight data of civil aviation aircraft, the vertical turbulence component is obtained as the input of both algorithms. A new method of computing vertical acceleration response in turbulence is put forward through the Unsteady Vortex Lattice Method (UVLM). The lifting surface of the target aircraft is assumed to be a combination of wing and horizontal tail in a turbulent flight scenario. Vortex rings are assigned on the mean camber surface, forming a non-planar UVLM, to further improve the accuracy. Moreover, the neighboring vortex lattices are placed as close as possible to the structural edge of control surfaces. Thereby, a complete algorithm for estimating vertical acceleration and in situ EDR value from Quick Access Recorder (QAR) flight data is proposed. Experiments show that the aerodynamic performance is computed accurately by non-planar UVLM. The acceleration response by non-planar UVLM is able to track the recorded acceleration data with higher accuracy than that of the linear model. Different acceleration responses at different locations are also obtained. Furthermore, because the adverse effects of aircraft maneuvers are separated from turbulence-induced aircraft bumpiness, the new acceleration-based EDR algorithm shows better accuracy and stability. Full article
(This article belongs to the Special Issue Weather and Aviation Safety)
Show Figures

Figure 1

21 pages, 11437 KiB  
Article
Five-Year Climatology of Local Convections in the Dabie Mountains
by Linlin Zheng, Jianhua Sun, Xuexing Qiu and Zuxiang Yang
Atmosphere 2020, 11(11), 1246; https://doi.org/10.3390/atmos11111246 - 18 Nov 2020
Cited by 2 | Viewed by 2185
Abstract
Local Convection in Dabie Mountains (LCDM) occurs more frequently over the Dabie Mountains and brings severe weather to adjacent areas. In order to understand the characteristics of LCDM, their spatial distribution, the monthly and diurnal variations, and possible mechanisms are investigated. Based on [...] Read more.
Local Convection in Dabie Mountains (LCDM) occurs more frequently over the Dabie Mountains and brings severe weather to adjacent areas. In order to understand the characteristics of LCDM, their spatial distribution, the monthly and diurnal variations, and possible mechanisms are investigated. Based on radar composite reflectivity data over the 5-y period of 2014–2018 during warm seasons (April–September), a total of 195 cases of LCDM are identified. The LCDM exhibits maximum frequency on the windward slopes of the Dabie Mountains with a secondary maximum on lee slopes. It is demonstrated that LCDM peaks in July and August, while their diurnal variation exhibits a major peak in the afternoon during 12:00–16:00 local solar time (LST). Most LCDM does not leave the Dabie Mountains (NoOut-Type), accounting for 89.7% overall, and has an average 3.5 h lifespan. In contrast, the lifespans of Out-Types (i.e., LCDMs that move away from the Dabie Mountains) are longer (5.8 h on average), while most Out-Type LCDMs develop on southern slopes (‘South-Type’) and a few are also reinforced on northern slopes (‘North-Type’). The South-Type mainly produces short-duration heavy precipitation, while the ‘North-Type’ predominately generates thunderstorms high winds. It is suggested that LCDM is thermally induced, and that both the ‘South-Type’ and ‘North-Type’ are controlled by southerly wind perturbation. Lifting by upslope wind and heat sources over windward slopes has led to ‘South-Type’ development, while ascent induced by wave-like perturbations on lee slopes has led to ‘North-Type’. These mechanisms should be further investigated in future work by using field experiments and numerical simulations. Full article
Show Figures

Figure 1

19 pages, 2030 KiB  
Article
Statistically Downscaled CMIP6 Projections Show Stronger Warming for Germany
by Frank Kreienkamp, Philip Lorenz and Tobias Geiger
Atmosphere 2020, 11(11), 1245; https://doi.org/10.3390/atmos11111245 - 18 Nov 2020
Cited by 19 | Viewed by 5305
Abstract
Climate modelling output that was provided under the latest Coupled Model Intercomparison Project (CMIP6) shows significant changes in model-specific Equilibrium Climate Sensitivity (ECS) as compared to CMIP5. The newer versions of many Global Climate Models (GCMs) report higher ECS values that result in [...] Read more.
Climate modelling output that was provided under the latest Coupled Model Intercomparison Project (CMIP6) shows significant changes in model-specific Equilibrium Climate Sensitivity (ECS) as compared to CMIP5. The newer versions of many Global Climate Models (GCMs) report higher ECS values that result in stronger global warming than previously estimated. At the same time, the multi-GCM spread of ECS is significantly larger than under CMIP5. Here, we analyse how the differences between CMIP5 and CMIP6 affect climate projections for Germany. We use the statistical-empirical downscaling method EPISODES in order to downscale GCM data for the scenario pairs RCP4.5/SSP2-4.5 and RCP8.5/SSP5-8.5. We use data sets of the GCMs CanESM, EC-Earth, MPI-ESM, and NorESM. The results show that the GCM-specific changes in the ECS also have an impact at the regional scale. While the temperature signal under regional climate change remains comparable for both CMIP generations in the MPI-ESM chain, the temperature signal increases by up to 3 °C for the RCP8.5/SSP5-8.5 scenario pair in the EC-Earth chain. Changes in precipitation are less pronounced and they only show notable differences at the seasonal scale. The reported changes in the climate signal will have direct consequences for society. Climate change impacts previously projected for the high-emission RCP8.5 scenario might occur equally under the new SSP2-4.5 scenario. Full article
(This article belongs to the Section Climatology)
Show Figures

Figure 1

15 pages, 20857 KiB  
Article
Assessment of Vulnerability to Drought Disaster in Agricultural Reservoirs in South Korea
by Young-Sik Mun, Won-Ho Nam, Min-Gi Jeon, Na-Kyoung Bang and Taegon Kim
Atmosphere 2020, 11(11), 1244; https://doi.org/10.3390/atmos11111244 - 18 Nov 2020
Cited by 19 | Viewed by 3712
Abstract
Drought is a natural disaster affecting agriculture worldwide. Drought mitigation and proactive response require a comprehensive vulnerability mapping approach considering various factors. This study investigates the vulnerability to agricultural drought in South Korea based on exposure, sensitivity, and adaptability. The evaluation of agricultural [...] Read more.
Drought is a natural disaster affecting agriculture worldwide. Drought mitigation and proactive response require a comprehensive vulnerability mapping approach considering various factors. This study investigates the vulnerability to agricultural drought in South Korea based on exposure, sensitivity, and adaptability. The evaluation of agricultural drought factors yielded 14 items, which are categorized into meteorological, agricultural reservoir, social, and adaptability factors. Each item is assigned a weight using the analytical hierarchy process (AHP). We analyzed vulnerability to drought disaster in agricultural reservoirs, and generated vulnerability maps by applying the vulnerability framework for climate change. The generated map was divided into four categories based on drought vulnerability: A (Very high), B (High), C (Moderate), and D (Low). The weights for the meteorological (0.498), agricultural reservoir (0.286), social (0.166), and adaptability (0.05) factors were obtained using AHP. The rating frequencies were 41.91%, 19.76%, 9.58%, and 5.39% for A, B, C, and D, respectively. The western region is extremely vulnerable to meteorological and agricultural reservoir factors, whereas the eastern region is more vulnerable to adaptability. The results of this study visually represent agricultural drought and can be used for evaluating regional drought vulnerability for assisting preemptive drought responses to identify and support drought-prone areas. Full article
(This article belongs to the Special Issue Meteorological Extremes in Korea: Prediction, Assessment, and Impact)
Show Figures

Figure 1

16 pages, 565 KiB  
Article
Variability in Observation-Based Onroad Emission Constraints from a Near-Road Environment
by Heather Simon, Barron H. Henderson, R. Chris Owen, Kristen M. Foley, Michelle G. Snyder and Sue Kimbrough
Atmosphere 2020, 11(11), 1243; https://doi.org/10.3390/atmos11111243 - 18 Nov 2020
Cited by 2 | Viewed by 2406
Abstract
This study uses Las Vegas near-road measurements of carbon monoxide (CO) and nitrogen oxides (NOx) to test the consistency of onroad emission constraint methodologies. We derive commonly used CO to NOx ratios (∆CO:∆NOx) from cross-road gradients and from [...] Read more.
This study uses Las Vegas near-road measurements of carbon monoxide (CO) and nitrogen oxides (NOx) to test the consistency of onroad emission constraint methodologies. We derive commonly used CO to NOx ratios (∆CO:∆NOx) from cross-road gradients and from linear regression using ordinary least squares (OLS) regression and orthogonal regression. The CO to NOx ratios are used to infer NOx emission adjustments for a priori emissions estimates from EPA’s MOtor Vehicle Emissions Simulator (MOVES) model assuming unbiased CO. The assumption of unbiased CO emissions may not be appropriate in many circumstances but was implemented in this analysis to illustrate the range of NOx scaling factors that can be inferred based on choice of methods and monitor distance alone. For the nearest road estimates (25 m), the cross-road gradient and ordinary least squares (OLS) agree with each other and are not statistically different from the MOVES-based emission estimate while ∆CO:∆NOx from orthogonal regression is significantly higher than the emitted ratio from MOVES. Using further downwind measurements (i.e., 115 m and 300 m) increases OLS and orthogonal regression estimates of ∆CO:∆NOx but not cross-road gradient ∆CO:∆NOx. The inferred NOx emissions depend on the observation-based method, as well as the distance of the measurements from the roadway and can suggest either that MOVES NOx emissions are unbiased or that they should be adjusted downward by between 10% and 47%. The sensitivity of observation-based ∆CO:∆NOx estimates to the selected monitor location and to the calculation method characterize the inherent uncertainty of these methods that cannot be derived from traditional standard-error based uncertainty metrics. Full article
(This article belongs to the Section Air Quality)
Show Figures

Figure 1

20 pages, 8305 KiB  
Article
Assessing the Impact of Land Use and Land Cover Data Representation on Weather Forecast Quality: A Case Study in Central Mexico
by Erika Danaé López-Espinoza, Jorge Zavala-Hidalgo, Rezaul Mahmood and Octavio Gómez-Ramos
Atmosphere 2020, 11(11), 1242; https://doi.org/10.3390/atmos11111242 - 18 Nov 2020
Cited by 19 | Viewed by 3477
Abstract
In atmospheric modeling, an accurate representation of land cover is required because such information impacts water and energy budgets and, consequently, the performance of models in simulating regional climate. This study analyzes the impact of the land cover data on an operational weather [...] Read more.
In atmospheric modeling, an accurate representation of land cover is required because such information impacts water and energy budgets and, consequently, the performance of models in simulating regional climate. This study analyzes the impact of the land cover data on an operational weather forecasting system using the Weather Research and Forecasting (WRF) model for central Mexico, with the aim of improving the quality of the operative forecast. Two experiments were conducted using different land cover datasets: a United States Geological Survey (USGS) map and an updated North American Land Change Monitoring System (NALCMS) map. The experiments were conducted as a daily 120 h forecast for each day of January, April, July, and September of 2012, and the near-surface temperature, wind speed, and hourly precipitation were analyzed. Both experiments were compared with observations from meteorological stations. The statistical analysis of this study showed that wind speed and near-surface temperature prediction may be further improved with the updated and more accurate NALCMS dataset, particularly in the forecast covering 48 to 72 h. The Root Mean Square Error (RMSE) of the average wind speed reached a maximum reduction of up to 1.2 m s−1, whereas for the near-surface temperature there was a reduction of up to 0.6 °C. The RMSE of the average hourly precipitation was very similar between both experiments, however the location of precipitation was modified. Full article
Show Figures

Graphical abstract

15 pages, 2876 KiB  
Article
Automatic Fire and Smoke Detection Method for Surveillance Systems Based on Dilated CNNs
by Yakhyokhuja Valikhujaev, Akmalbek Abdusalomov and Young Im Cho
Atmosphere 2020, 11(11), 1241; https://doi.org/10.3390/atmos11111241 - 18 Nov 2020
Cited by 66 | Viewed by 8070
Abstract
The technologies underlying fire and smoke detection systems play a crucial role in ensuring and delivering optimal performance in modern surveillance environments. In fact, fire can cause significant damage to lives and properties. Considering that the majority of cities have already installed camera-monitoring [...] Read more.
The technologies underlying fire and smoke detection systems play a crucial role in ensuring and delivering optimal performance in modern surveillance environments. In fact, fire can cause significant damage to lives and properties. Considering that the majority of cities have already installed camera-monitoring systems, this encouraged us to take advantage of the availability of these systems to develop cost-effective vision detection methods. However, this is a complex vision detection task from the perspective of deformations, unusual camera angles and viewpoints, and seasonal changes. To overcome these limitations, we propose a new method based on a deep learning approach, which uses a convolutional neural network that employs dilated convolutions. We evaluated our method by training and testing it on our custom-built dataset, which consists of images of fire and smoke that we collected from the internet and labeled manually. The performance of our method was compared with that of methods based on well-known state-of-the-art architectures. Our experimental results indicate that the classification performance and complexity of our method are superior. In addition, our method is designed to be well generalized for unseen data, which offers effective generalization and reduces the number of false alarms. Full article
(This article belongs to the Section Air Quality and Health)
Show Figures

Figure 1

32 pages, 14164 KiB  
Article
PUFF Model Prediction of Volcanic Ash Plume Dispersal for Sakurajima Using MP Radar Observation
by Hiroshi L. Tanaka, Haruhisa Nakamichi and Masato Iguchi
Atmosphere 2020, 11(11), 1240; https://doi.org/10.3390/atmos11111240 - 18 Nov 2020
Cited by 4 | Viewed by 3029
Abstract
In this study, a real-time volcanic ash plume prediction by the PUFF system was applied to the Sakurajima volcano (which erupted at 17:24 Japan Standard Time (JST) on 8 November 2019), using the direct observation of the multi-parameter (MP) radar data installed at [...] Read more.
In this study, a real-time volcanic ash plume prediction by the PUFF system was applied to the Sakurajima volcano (which erupted at 17:24 Japan Standard Time (JST) on 8 November 2019), using the direct observation of the multi-parameter (MP) radar data installed at the Sakurajima Volcano Research Center. The MP radar showed a plume height of 5500 m a.s.l. around the volcano. The height was higher than the 4000 m by the PUFF system, but was lower than the observational report of 6500 m by the Japan Meteorological Agency in Kagoshima. In this study, ash particles by the MP radar observation were assimilated to the running PUFF system operated by the real-time emission rate and plume height, since the radar provides accurate plume height. According to the simulation results, the model prediction has been improved in the shape of the ash cloud with accurate plume top by the new MP radar observation. The plume top is corrected from 4000 m to 5500 m a.s.l., and the three-dimensional (3D) ash dispersal agrees with the observation. It was demonstrated by this study that the direct observation of MP radar obviously improved the model prediction, and enhanced the reliability of the prediction model. Full article
Show Figures

Figure 1

19 pages, 6236 KiB  
Article
An Analysis of Fog in the Mainland Portuguese International Airports
by Pedro M. P. Guerreiro, Pedro M. M. Soares, Rita M. Cardoso and Alexandre M. Ramos
Atmosphere 2020, 11(11), 1239; https://doi.org/10.3390/atmos11111239 - 18 Nov 2020
Cited by 10 | Viewed by 3370
Abstract
An analysis of 17 years of half-hourly aeronautic observations (METAR) and special observations (SPECI) in the three international airports of mainland Portugal indicates strong variations in fog properties. Fog is a rare event at Faro, a winter phenomenon in Lisbon and mainly a [...] Read more.
An analysis of 17 years of half-hourly aeronautic observations (METAR) and special observations (SPECI) in the three international airports of mainland Portugal indicates strong variations in fog properties. Fog is a rare event at Faro, a winter phenomenon in Lisbon and mainly a summer process at Porto. At both Lisbon and Porto, fog is favoured by specific synoptic circulations, here classified into a set of weather types, compatible with the strict requirements of fog formation. At the same time, however, a detailed analysis of the distribution of fog, and the classification of its onset processes, reveal a crucial dependence on local wind. This suggests that the advection of moist air from nearby sources, from the Tagus estuary at Lisbon and from the ocean at Porto, is the dominant process at both locations, despite the large differences found in the timing of those fog processes. The observational data (METAR) prior to the fog formation is used to classify the fog generation mechanism for 96.9% of the fog events at Porto, and 98.9% at Lisbon. Among the five fog types identified using a classification algorithm, cloud base lowering is the most common one at both locations, gathering half of the classified fog events, followed by advection, precipitation, and radiation. No fog event of the evaporation type was detected at both airports. The analysis of the observed horizontal visibility during the fog events revealed that cloud base lowering and radiation fog are the most intense events. The median of the minimum horizontal visibility of these two types of fog varies between 150 and 250 m, as the average ranges between 217.8 and 312.9 m. The study results have revealed a promising prefog diagnosis tool to be explored in detail in further operational context studies. Full article
(This article belongs to the Special Issue Weather and Aviation Safety)
Show Figures

Graphical abstract

28 pages, 3679 KiB  
Article
Human Health and Economic Costs of Air Pollution in Utah: An Expert Assessment
by Isabella M. Errigo, Benjamin W. Abbott, Daniel L. Mendoza, Logan Mitchell, Sayedeh Sara Sayedi, Jeffrey Glenn, Kerry E. Kelly, John D. Beard, Samuel Bratsman, Thom Carter, Robert A. Chaney, Andrew Follett, Andrew Freeman, Rebecca J. Frei, Mitchell Greenhalgh, Heather A. Holmes, Peter D. Howe, James D. Johnston, Leslie Lange, Randal Martin, Audrey Stacey, Trang Tran and Derrek Wilsonadd Show full author list remove Hide full author list
Atmosphere 2020, 11(11), 1238; https://doi.org/10.3390/atmos11111238 - 18 Nov 2020
Cited by 13 | Viewed by 18660
Abstract
Air pollution causes more damage to health and economy than previously understood, contributing to approximately one in six deaths globally. However, pollution reduction policies remain controversial even when proven effective and cost negative, partially because of misunderstanding and growing mistrust in science. We [...] Read more.
Air pollution causes more damage to health and economy than previously understood, contributing to approximately one in six deaths globally. However, pollution reduction policies remain controversial even when proven effective and cost negative, partially because of misunderstanding and growing mistrust in science. We used an expert assessment to bridge these research–policy divides in the State of Utah, USA, combining quantitative estimates from 23 local researchers and specialists on the human health and economic costs of air pollution. Experts estimated that air pollution in Utah causes 2480 to 8000 premature deaths annually (90% confidence interval) and decreases the median life expectancy by 1.1 to 3.6 years. Economic costs of air pollution in Utah totaled $0.75 to $3.3 billion annually, up to 1.7% of the state’s gross domestic product. Though these results were generally in line with available estimates from downscaled national studies, they were met with surprise in the state legislature, where there had been an almost complete absence of quantitative health and economic cost estimates. We discuss the legislative and personal responses of Utah policy makers to these results and present a framework for increasing the assimilation of data into decision making via regional expert assessment. In conclusion, combining quantitative assessments from local experts is a responsive and cost-effective tool to increase trust and information uptake during time-sensitive policy windows. Full article
Show Figures

Figure 1

25 pages, 53130 KiB  
Article
Analysis of Spatial Data from Moss Biomonitoring in Czech–Polish Border
by Aneta Svozilíková Krakovská, Vladislav Svozilík, Inga Zinicovscaia, Konstantin Vergel and Petr Jančík
Atmosphere 2020, 11(11), 1237; https://doi.org/10.3390/atmos11111237 - 17 Nov 2020
Cited by 14 | Viewed by 3565
Abstract
The purpose of the study was the analysis of spatial data gained by biomonitoring with the use of mosses. A partial goal was set to characterize the regional atmospheric deposition of pollutants in the air based on the results of the analyses and [...] Read more.
The purpose of the study was the analysis of spatial data gained by biomonitoring with the use of mosses. A partial goal was set to characterize the regional atmospheric deposition of pollutants in the air based on the results of the analyses and simultaneously verify the suitability of using mosses as an alternative for monitoring air quality in smaller industrial areas. In total, 93 samples of moss were collected and examined from the area of the Moravian–Silesian Region in the Czech Republic and the area of the Silesian Voivodship in Poland. The samples were analyzed using instrumental neutron activation analysis. Based on the analyses performed, 38 elements, which had been evaluated using principal component analysis, hierarchical clustering on principal components, factor analysis, correlation analysis, contamination factor, geoaccumulation index, enrichment factor, and pollution load index, were determined. The analyses resulted in a division of elements into a group with its concentrations close to the level of the values of the natural background and the second group of elements identified as emission likely originating from anthropogenic activity (Sm, W, U, Tb, and Th). The likely dominant source of emissions for the studied area was identified. Simultaneously, the results pointed to sources of local importance. The area of interest was divided into clusters according to the prevailing type of pollution and long-distance transmission of pollutants was confirmed. Full article
Show Figures

Figure 1

Previous Issue
Next Issue
Back to TopTop