Abstract
As cities and their population are subjected to climate change and urban heat islands, it is paramount to have the means to understand the local urban climate and propose mitigation measures, especially at neighbourhood, local and building scales. A framework is presented, where the urban climate is studied by coupling a meteorological model to a building-resolved local urban climate model, and where an urban climate model is coupled to a building energy simulation model. The urban climate model allows for studies at local scale, combining modelling of wind and buoyancy with computational fluid dynamics, radiative exchange and heat and mass transport in porous materials including evaporative cooling at street canyon and neighbourhood scale. This coupled model takes into account the hygrothermal behaviour of porous materials and vegetation subjected to variations of wetting, sun, wind, humidity and temperature. The model is driven by climate predictions from a mesoscale meteorological model including urban parametrisation. Building energy demand, such as cooling demand during heat waves, can be evaluated. This integrated approach not only allows for the design of adapted buildings, but also urban environments that can mitigate the negative effects of future climate change and increased urban heat islands. Mitigation solutions for urban heat island effect and heat waves, including vegetation, evaporative cooling pavements and neighbourhood morphology, are assessed in terms of pedestrian comfort and building (cooling) energy consumption.
1. Introduction
Climate change and the urbanization around the world ask more than ever for a detailed study of the urban climate. Heatwaves are one of the climatic extremes [1] that take place with increasing frequency in relation with climate change. Cities are subjected to urban heat islands (UHI), which affect human thermal comfort [2], building cooling energy consumption [3,4,5], health [6] and other societal aspects. Understanding the coupling mechanisms between heat waves and UHIs and documenting their threatening aspects delineate a present-day pivotal interdisciplinary research topic.
The UHI effect is reflected by higher temperatures in urban areas compared to these in surrounding rural areas, observable mainly at night [7,8]. Factors contributing to the positive thermal balance mainly comprise increasing heat storage due to the adoption of low albedo and high heat capacity construction materials, solar radiation entrapment in street canyons, lessened heat removal by reduced urban ventilation, reduced cooling due to longwave radiation to the sky, less vegetation resulting in lack of evapotranspiration, excessive emission of anthropogenic heat and more. Mitigation strategies are developed, including use of vegetation in the form of grass, green roofs and trees [9,10], adoption of roof materials with high albedo [10,11], temporary shadowing devices [12], presence of water bodies [13], use of permeable pavements introducing evaporative cooling [7,14,15,16], design of ventilation corridors in building clusters [17], deployment of high efficiency heating and cooling systems to reduce anthropogenic and waste heat [18,19], use of free cooling systems [20,21], etc.
The prediction of the local urban climate at the scale of neighbourhood or street canyon is complex as a series of physical processes need to be modelled at sufficiently high temporal and spatial resolutions, such as local wind dynamics due to different building forms [22], urban ventilation within and above complex three-dimensional street canyons [23], heat and moisture transport at porous surfaces of building façades [16], evapotranspiration by vegetation in streets [24], wind-driven rain and runoff [25], solar radiation entrapment and local shading [26], local anthropogenic heat [27], etc. A rational approach to model local urban climate is to couple mesoscale meteorological models (MMM) such as COSMO (Consortium for Small-scale Modelling) and WRF (Advanced Weather and Research Model) to building-resolved computational fluid dynamics (CFD), heat-air-moisture (HAM) transport model and building energy simulation (BES), as shown in Figure 1. Such coupling of models provides an affordable level of computational cost while preserving the necessary resolution at the respective scales: from meteorological data at mesoscale (domain size < 200 km) to heat and moisture transport at city scale (domain size < 15 km), neighbourhood scale (domain size < 2 km), local scale (domain size < 100 m) and down to material scale.
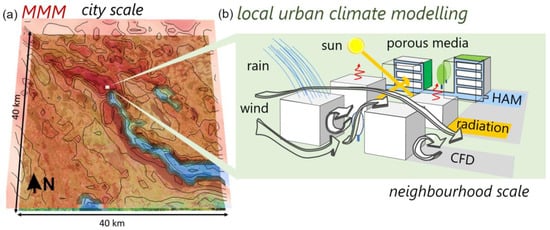
Figure 1.
Schematic representation of coupling of mesoscale meteorological model COSMO with local urban climate model including building-resolved computational fluid dynamics (CFD), heat-air-moisture (HAM) transport in urban materials, longwave and solar radiation, wind-driven rain and vegetation model (Visualization (a) is produced by VAPOR [28] and the sketch (b) is adapted from Kubilay et al. [25] with permission).
In this paper, the objective is to present two recent coupling approaches across these scales developed in our urban climate research as an example of how coupling can improve the understanding related to the mitigation measures during heat waves and the impact of local heat islands (LHIs) on building cooling energy. First, we present an overview of our recent work on a coupled CFD-BES model to analyse the effects of urban morphology on LHIs and building energy demand. Then, we present our recently developed CFD-HAM-Radiation-Vegetation model including aspects of wind flow, heat and moisture transport in urban materials, radiation and vegetation at local scale. We review our recent findings with respect to evaporative cooling using wetted pavements. This model is then applied in a new case study for a public square in the city of Zurich coupled to MMM. We believe that this combination of an overview of our previous and present new work demonstrates that both CFD-BES and CFD-HAM-Radiation-Vegetation models enable the exploration of the complex interactions of the physical processes taking place in an urban environment at the appropriate respective scale. In the following sections, we clearly differentiate our previous work from our new contribution.
The paper is organised as follows. In Section 2, we give a general overview of different approaches for modelling, describing what has been achieved at the different scales and recent efforts in coupling models. In Section 3, we present an overview of recent work using the CFD-BES model and in Section 4, we present our CFD-HAM-Radiation-Vegetation model with application to a new case study. Finally, discussion and conclusions are given in Section 5 and Section 6, respectively.
2. Overview of Modelling Approaches at Different Urban Scales
2.1. Mesoscale Meteorological Models (MMMs)
MMMs are commonly used for weather prediction including phenomena like sea breeze, rain, cloud clusters and thunderstorms [29]. These models can also be configured to represent physical phenomena at city scale. Common mesoscale models are WRF [30] and COSMO [31], which are both widely used in research and weather forecasting. Adequate initial and boundary conditions for the proper modelling of the temporal and spatial evolution of the state of the atmosphere are prescribed coming from global models like GFS (Global Forecast System) or ECMWF (European Centre for Medium-Range Weather Forecasts) or nested models derived from the global ones like MeteoSwiss COSMO-2/1. The model is initialized by external and dynamic data. Typical external data are static parameters like the height, land-use, soil type or vegetation type of each grid point in the model domain. In urban climate modelling this data also contain information about the city morphology like building height, street canyon width, physical properties of building and street materials and density of the built-up area. Dynamic input data contain mainly the state of the atmosphere like the atmospheric pressure, temperature and humidity and of the surface fields like soil temperature. The lateral boundary conditions coming from higher scale models are specified at the spatial boundaries of the domain. A relaxation zone with several grid points width is implemented to blend the forced conditions at the boundaries together with the atmospheric model in the limited area [32].
Many physical processes in the atmosphere are either too complex or too small to be modelled on the grid resolution of the MMM models. This leads to insufficient model performance or to mass and energy deficits during the simulation. Therefore, these processes are modelled by parameterisations, which model the impact from cloud microphysics, planetary boundary layer, surface layers, land surface interactions and atmospheric radiation. Since buildings are not resolved at this scale, the urban environment is also parametrised using a statistical model assuming a distribution of street canyons. The simplest urban canopy model is the single urban canyon parametrisation [33], containing only a single building layer where the building height is assumed to be constant in the urban environment. In parameterised canopy models, urban effects on momentum and temperature are determined and fed back into the MMM model.
Martilli et al. [34] present a building effect parametrisation model (BEP) based on the single urban canopy parametrisation allowing building height variation and different canyon orientations originally implemented in WRF. Wouters et al. [35] present a bulk urban canyon parametrisation TERRA-URB for COSMO. Trusilova et al. [36] create a single layer urban canyon model for COSMO, COSMO-TEB, with one generic canyon morphology for the whole city. Schubert et al. [37] propose the double-canyon effect parametrisation (DCEP) model for multi-layer urban canopy representation, taking into account the radiation exchange for two neighbouring canyons treating direct and diffuse radiation separately. Mussetti et al. [38] show that using sub-kilometre resolution (250 m resolution) enhances the model performance to capture urban effects. BEP-Tree, presented by Krayenhoff et al. [39], models street trees and their effects as possible heat mitigation method. BEP-Tree and COSMO are used by Mussetti et al. [40] to study the effect of trees and the UHI in cities. Even with such parametrisation, MMMs present limitations, mainly due to low resolution and the lack of resolved local velocity fields around buildings [41], pointing to an approach, where MMMs are coupled with building resolved CFD simulations particularly for analyses at local scale.
2.2. Urban Climate CFD Models
The modelling at local scale involves the complex interaction of the following physical phenomena: air, heat and moisture flow due to wind and buoyancy effects, rain, solar radiation and longwave radiation between different urban surfaces, heat and moisture fluxes at building surfaces, storage of heat and moisture in urban materials, removal of heat and moisture from surfaces due to convection. Moreover, vegetation like trees and grass may be present, altering wind flow and providing cooling due to evapotranspiration and shadowing, or other shadowing devices may be present. Computational Fluid Dynamics (CFD) simulations are increasingly used at neighbourhood scale and local scale, allowing detailed numerical analysis of the urban physical phenomena at play in the air domain [42]. CFD models, with high-resolution building-resolved computational grids, can solve the local wind flow and temperature fields around buildings taking into account the building geometry and local variations of material properties.
Recent CFD studies of local urban climate assess the impact of different components such as urban morphology [43,44], water bodies [13], vegetation [24] and of urban materials [14,15,16,45]. A majority of CFD studies use Reynolds-averaged Navier-Stokes (RANS) with k-ε turbulence models. Buoyancy is typically considered with the Boussinesq approximation and moisture is modelled as passive scalar transport. In general, RANS k-ε models have drawbacks such as the assumption of isotropic turbulence and the underestimation of turbulence kinetic energy in the wake of the building, which leads to the overprediction of the size of the wake and the location of reattachment [46]. More complicated turbulence models such as Large Eddy Simulation (LES) are found to be more accurate when applied correctly. However, they are not as much used [42,47], mainly due to the fact that they lead to even higher computational cost and that they require more complex boundary conditions.
Boundary conditions at the inlet of the domain, e.g., wind velocity, turbulence intensity and temperature profiles, are not always available in urban case studies. Upwind meteorological measurements are scarce and often have low spatial resolution. Therefore, CFD simulations usually rely on simplified analytical or (semi-)empirical boundary layer profiles. However, inlet conditions for urban areas are complex and strongly influenced by mesoscale meteorological phenomena. Coupling CFD models with MMMs combines the advantages of both approaches, making it possible to obtain boundary conditions from the larger scale MMM simulation, while allowing for a local-scale analysis within the region of interest.
In local urban climate studies, modelling dynamic conditions is crucial, e.g., radiation and heat storage within facades, ground and roofs. This is commonly taken into account with a conjugate heat transport approach [45,48,49]. Typically, moisture transport is either not considered and urban surfaces are considered impermeable to moisture, or moisture transport is taken into account by simplifying it with a uniform latent heat flux, e.g., for uncovered surfaces such as soil. In the research group of the authors, local urban climate models were developed including coupling with heat and moisture transport (HAM) models in porous media [14,15,16,50], allowing to resolve moisture transport in addition to the heat transport within urban materials. Here, moisture flux includes liquid and vapour transport due to the capillary pressure and the vapour pressure gradients respectively and transport due to temperature gradients. Resolving moisture transport becomes necessary especially when evaporative cooling is considered, as the rate of evaporation highly depends on hygrothermal properties of the porous media and available moisture by rain or artificial wetting. Furthermore, for the correct estimation of pedestrian-level outdoor thermal comfort, an accurate estimation of local moisture levels or relative humidity is needed in addition to surface temperatures and wind-flow field.
2.3. Coupled CFD—Building Energy Simulation (BES)
Energy consumption in buildings is responsible for approximately 40% of the total primary energy consumption in EU and USA [51]. This figure is around 50% for Switzerland according to the Swiss Federal Office of Energy [52]. To exploit the potential for energy demand reduction in buildings, it is of paramount importance to understand the energy consumption at building level, which is determined by building morphology, envelope insulation, heating, ventilation, air-conditioning and cooling, and domestic hot water systems. The morphology of a building cluster may result in LHIs in the form of hot spots in local air temperatures, which in turn have a direct impact on heat transfer through the envelope and indoor energy consumption.
A local urban climate CFD model can be coupled to a BES model to study the complex interaction of these factors. BES and CFD may be coupled by providing outside building and ground surface temperatures from the BES as boundary conditions to the CFD model. The CFD model may provide air temperatures and heat transfer coefficients as input to the BES model [5].
Generically, a BES solves the energy balance and associated heat transfer within buildings from the perspective of lumped-parameter models [53]. The balance comprises the dynamic heat transport through building envelopes, heat storage in the building, solar gains through windows, ventilation losses, radiation and convection in the indoor environment, heat convection, solar and longwave radiation exchange with outdoor environment [53]. BES comprises also the heating, ventilation and air-conditioning of rooms (HVAC) and internal heat gains using behavioural models.
3. Relation between Urban Morphology, Urban Climate/Comfort and Building Energy Demand for Cooling
In this section, we compile and integrate our previous analyses investigating the impact of urban morphology on LHIs and resultant building cooling demand, as documented in our publications [5,22,43,54,55]. In Section 3.1, the influence of different generic urban morphologies on LHIs is presented. In Section 3.2, the influence of these different generic urban morphologies on building cooling energy demand is analysed. In our study, CitySim [56] was used as the BES code and coupled to a CFD urban climate model at local scale as described in [43,54,55]. Since the focus is on the impact of local climate on building energy, no moisture effects are considered.
3.1. Influence of Different Generic Urban Morphologies on Local Heat Islands (LHI) and Heat Removal
In Allegrini et al. [43], we studied LHI intensities for six generic urban morphologies of identical building height (Figure 2a) for two wind speeds, a relatively lower wind speed of 1 m/s and a higher wind speed of 5.5 m/s. We found that a higher wind speed (HW) leads to higher LHI intensities in a medium-density building cluster compared to the cases of lower wind speeds (LW). At high wind speed, the urban flow is dominated by a shear flow over the roofs of the buildings and low speed standing-vortices in the canyons. At such high wind speed, the upward buoyant flow, which has the potential to remove heat from the street canyons, is in effect blocked by the shear flow above the building roofs. This is especially the case for the morphologies shown in Figure 2(a1,a3,a4). At low wind speed, the buoyancy driven flow can break through the shear layer leading to a higher heat removal and lower LHIs.
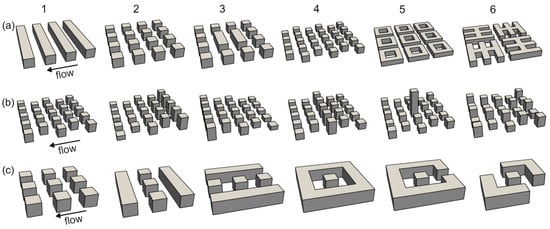
Figure 2.
Urban morphologies for the investigation of local heat islands (LHIs) and building cooling demand. LHIs for morphologies of (a) identical building height [43] and (b) non-uniform building height [22]. (c) Building cooling energy of the central cubical building in different configurations [5].
In complex urban morphologies where closed and semi-closed courtyards (Figure 2(a5,a6)) are present, we found that the difference in LHI for lower (LW) and higher wind (HW) speeds is less obvious and higher wind speeds do not necessarily lead to an increase of the LHI intensity. In these cases, the complex urban morphologies block colder air entering the courtyards, leading to higher LHI intensities between the buildings and in the courtyards.
We studied the impact of non-uniform building height on the LHI for six different urban morphologies (Figure 2b) in Allegrini and Carmeliet [22]. We showed that the LHI intensity increases with increasing wind speed in these morphologies with monotonous height change, especially for the step-down morphology (Figure 2(b2)). The main reason is the appearance of wakes beyond the first rows of buildings. Higher wind speeds enhance the strength of the wakes, leading to an increase in LHI intensity. In the morphologies with single or multiple centralised buildings (Figure 2(b5)), the temperatures around the high-rise building are found to be significantly lower compared to the temperatures around the neighbouring buildings. Cooler air is directed downwards when it hits the tower, which cools down the space between the lower buildings and in turn leads to lower LHIs.
To better understand the origin of LHIs, we studied the heat removal mechanism from different urban morphologies in more detail in Allegrini et al. [54]. For all morphologies considered, we found that an increase of wind speed adversely lowers the heat flow through the roof level due to the presence of a strong shear layer blocking heat removal, which is consistent with the earlier findings from Allegrini et al. [43]. Heat may be removed by convection and turbulence, the latter being especially dominant when strong shear layers exist. In the low wind speed case, the heat removal is found to be mainly due to convection, while in the high wind speed case, when strong shear layers are present, the main contribution to the heat removal comes from turbulence.
3.2. Influence of Different Generic Urban Morphologies on Building Energy Demand
In Allegrini and Carmeliet [5], we studied the impact of LHIs on the building cooling demand for six generic urban morphologies surrounding a central cubical building (Figure 2c). Wind-flow field, building surface temperature and local distribution of air temperature were calculated by coupling CFD and HAM approaches described in Section 2.2 [25], while the cooling demand was calculated with CitySim.
We found that the LHI intensities, quantified by the difference of local air and incoming air temperatures, show an increase up to two degrees. In particular, those cases of closed courtyard (Figure 2(c4)), street canyon normal to wind direction (Figure 2(c2)) and courtyard with the central entrance (Figure 2(c5)) show high LHI intensities close to the central building. The less dense morphologies, displaying open flow paths in wind direction, show lower LHIs.
We determined the space cooling demand in each urban morphology using four different cases using: (1) the default base case settings of CitySim based on incoming temperature and default convective heat transfer coefficients (CHTC); (2) only average local air temperatures, which showed an increase between 0.4 °C and 1.4 °C; (3) only local convective heat transfer coefficients (CHTC); (4) and the combined effect of local temperatures and CHTC. We found that the higher air temperatures and lower heat transfer coefficients due to lower local airflow speeds are found to lead to an increase in cooling demand for an office building in Zurich during a heat wave. The closed courtyard (Figure 2(c4)) showed an increase of 20%, while we still see an increase of 9% for the case of an open courtyard (Figure 2(c6)). From this study, we showed clearly that LHIs display higher air temperatures and lower wind speeds and can lead to a substantial increase in space cooling demand. We also demonstrated that by coupling CFD and BES, the impact of local urban climate on cooling demand can be determined for different case studies.
4. Local Urban Climate, Thermal Comfort and Mitigation Measures
4.1. Modelling Approach and Coupling
We first present our modelling approach used in the present study. We use COSMO with the DCEP parametrisation for the mesoscale simulations. The reason for this choice is the availability of already down-nested COSMO-1 boundary conditions by Swiss Federal Office of Meteorology, MeteoSwiss, as well as the multi-layer approach provided by DCEP. Trusilova et al. [57] compare the different urban parametrisations in Berlin and showed that TERRA_URB only provides accurate results depending on a pre-calculated anthropogenic heat flux. COSMO-TEB cannot capture the morphology differences in a heterogeneous city. In the present study, COSMO-DCEP simulations are performed with a timestep of 5 seconds and with hourly model output. Hourly output from MMM simulations at mesoscale is transferred to the smaller CFD domain with a one-way coupling, i.e., CFD simulation has no effect on the MMM results. For the CFD domain, boundaries are positioned far enough from the region of interest. Inflow and outflow boundaries change during the day depending on the wind direction. At the inflow boundaries, wind velocity profiles are obtained from COSMO-DCEP by interpolating values onto the computational grid of CFD. For temperature, a uniform value is used obtained above the canopy height from COSMO-DCEP simulations. At the outflow boundaries, zero static pressure is imposed.
In the CFD-HAM coupling at local or neighbourhood scale, the air subdomain and building subdomain for porous urban materials are coupled at the boundaries separating these subdomains, e.g., at the exterior surfaces of facades and pavements. At these interfaces, Dirichlet boundary conditions are used for temperature and moisture in the air subdomain, for which the values are taken from the corresponding boundary in the building subdomain. Neumann boundary conditions are used in the building subdomain, in order to ensure continuity of heat and moisture fluxes between the subdomains where the moisture flux comprises the convective vapour exchange and the heat flux comprises the convective heat transfer, the radiative heat transfer and the latent and sensible heat transfer due to vapour exchange.
Temporal coupling between CFD and HAM models is performed by sequentially solving the steady Reynolds-averaged Navier-Stokes (RANS) with realizable k-ε equations in the air and the unsteady coupled heat and moisture transfer in porous building materials. This approach follows the assumption of much smaller time scale of transport in the CFD subdomain than the one in the building materials, so that the solution of the CFD subdomain remains constant during the transient HAM simulation [50]. Transient HAM simulation in the porous building materials uses adaptive timesteps [58]. At each exchange timestep, information is exchanged at the coupled boundaries separating the CFD and HAM subdomains using a quasi-dynamic coupling scheme [59]. In the present study, an exchange timestep of 20 min is used. Temporal coupling between MMM and CFD is achieved by static coupling, where hourly outputs of COSMO-DCEP simulations are used in CFD simulations. The hourly values from COSMO-DCEP are linearly interpolated for the 20-min exchange timesteps of CFD. Temporal coupling between all three subdomains is summarized in Figure 3.
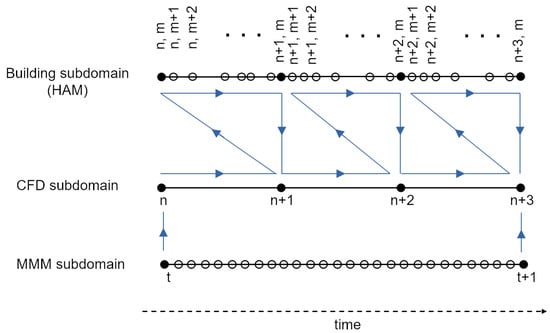
Figure 3.
Temporal coupling between subdomains. Figure adapted from Kubilay et al. [15] with permission. (n: exchange timesteps between CFD and HAM, m: adaptive timesteps for the unsteady HAM, t: output timesteps for MMM).
In the air subdomain, buoyancy is modelled by using a compressible formulation of the Navier-Stokes equations and calculating air density based on the ideal gas law. Moisture is modelled as a passive scalar, where the transported quantity is the humidity ratio, i.e., the ratio of the mass of water vapour to the mass of dry air. The long-wave (thermal) and short-wave (solar) radiative exchanges are calculated using a radiosity model where multiple diffuse reflections are taken into account. For more details on the coupled model and the implementation in OpenFOAM v6, the reader is referred to Kubilay et al. [25].
Trees are modelled as porous zones with a non-zero leaf area density (LAD) following the approach documented in Manickathan et al. [24]. The vegetation model for trees takes into account the aerodynamic effects and shadowing due to trees, as well as the long-wave radiative exchange with surroundings and the production of latent and sensible heat within the tree foliage. Transmissivity is modelled based on the Beer-Lambert law, with an extinction coefficient for solar radiation and a leaf area index (LAI). The convective mass transfer coefficient at leaf surface depends on the stomatal resistance, which is a function of solar radiative flux, vapour pressure deficit in the air and tree species. Leaf temperature is calculated with an iterative energy balance calculation [24]. Once the leaf temperatures are calculated, source/sink terms for heat, mass and momentum fluxes are imposed in the porous tree domain.
In two case studies, we investigate the impact of evaporative cooling and vegetation on the pedestrian thermal comfort. Section 4.2 summarizes our findings related to evaporative cooling using artificial wetting of permeable pavements in an isolated street canyon as documented in several of our publications [14,15,16]. This geometry is less complex than a real urban case with an easier control of boundary conditions, allowing for a careful parametric analysis. These findings are later used in Section 4.3 and the impact of cooling on thermal comfort is analysed for artificial wetting on pavements and for a group of trees in Münsterhof, a historical public square in the city of Zurich using our MMM-CFD-HAM coupling method.
4.2. Impact of Cool Pavements on Local Urban Climate in Generic Street Canyons
We performed, in different previous studies, parametric analyses of evaporative cooling in an isolated street canyon and we found that the impact of evaporative cooling due to wetting of pavements depends on the pavement material configuration [16], material moisture retention and transport properties [14,16] and the wetting strategy [14,15].
Pavement layers can be composed of materials with varying pore volume distribution, maximum pore size, liquid permeability and vapour diffusion coefficient. Ferrari et al. [16] compared pavements with different layer structure in terms of their evaporative-cooling potential. These are permeable pavements with higher porosity and liquid permeability than those of conventional dense pavement materials with very fine pore structure, like concrete, but also with sufficiently small pores so that gravity does not play a major role. We showed in Ferrari et al. [16] that evaporative cooling is highest and longest when a two-layer configuration is used with finer pores at the top and coarser pores at the bottom.
We found that a top layer with finer pores allows for a sufficiently fast storage of water during the wetting period. Due to its stronger capillarity, suction of liquid water is observed to occur back to the top surface. Bottom layer with bigger pores is found to act as a capillary break. As a result, more water is available for evaporation near the top surface. The resulting surface temperature is found to be up to 18 °C lower after a total wetting of 10 mm compared to the pavement temperature in dry conditions.
The resulting cooling impact was defined based on two parameters: reduction in surface temperature and duration of evaporative cooling. Using the same two-layer pavement configuration, we studied in Kubilay et al. [15] the optimal wetting protocol in terms of wetting amount, wetting time and wetting duration, with an aim to maximize the cooling impact while keeping the water usage minimal. During drying, the rate of evaporation is identical for different configurations as long as the material surface remains at almost 100% RH. This is called the first drying phase, during which the rate of evaporation depends only on external boundary conditions, like radiation, outside RH, air temperature and wind velocity. It is beneficial to keep the first drying phase as long as possible in order to extend the effect of evaporative cooling, because once the liquid cannot replenish the medium surface anymore and the liquid front recedes within the porous medium, the drying process enters its second phase with a much lower rate of evaporation, and thus less evaporative cooling effect. We showed that a single wetting application of 6 mm in the morning provides sufficient cooling for a day and night in the given heat wave conditions in a street canyon [15]. Further increase in wetting amount has no impact on the maximum reduction in surface temperature and mainly extends the duration of the first drying phase with only a marginal impact during daytime. Conditions that increase the rate of evaporation, e.g., higher ambient temperature, UHI intensity and higher solar radiation, enhance the cooling effect initially, but decrease the cooling duration.
Wetting duration should be kept as short as possible to minimize the interference of artificial wetting, for example, with traffic and pedestrians. At the same time, wetting duration should not be too short, as too large wetting flux would lead to runoff as the moisture content reaches capillary saturation at the surface. We showed in Kubilay et al. [15] that a total wetting of 6 mm over a duration of 10 min, i.e., wetting flux of 36 mm/h, leads to no runoff. It should be noted that this highly depends on the liquid permeability and moisture capacity of pavement material. Additionally, we found that maximal cooling is achieved with a wetting time just before the direct sunlight reaches the surface ref. An earlier wetting time would lead to an earlier switch to the second drying phase, while a later wetting time would lead to a higher initial surface temperature [15].
An alternative would be to split wetting over different events while keeping the total wetting amount the same. This is especially relevant to the cases with limited water. In such cases, keeping the additional water available for the next watering cycle might be more beneficial than the marginal increase in cooling impact by using it all at once. We showed in Kubilay et al. [14] that dividing the available water in two wetting periods leads to a lower cooling initially due to an earlier switch to the second drying phase, but increases the cooling later significantly.
4.3. Case Study: Mitigation Measures for Münsterhof
Münsterhof, a historic public square in the city of Zurich, Switzerland, is chosen as a follow-up new case study with meteorological conditions recorded during an actual heat wave period in 2019. Depending on the discipline, there are multiple ways to define a heat wave. According to Xu et al. [60], heat waves are weather conditions dominated by abnormal high temperatures. They investigate the weather conditions in Europe during June 2019 and conclude that this period is breaking records in monthly mean temperatures and in the number of extremely hot days. Thus, we retain this period for our study. Figure 4 shows the air temperatures during this heat wave period in Zurich between 24 June and 1 July 2019, showing 7 consecutive days with maximum daily temperatures over 30 °C. Based on the measurements in the city centre and at the Kloten airport, the UHI is calculated as the difference between the urban and rural values, with a maximum of 8.0 °C and an average of 3.1 °C.
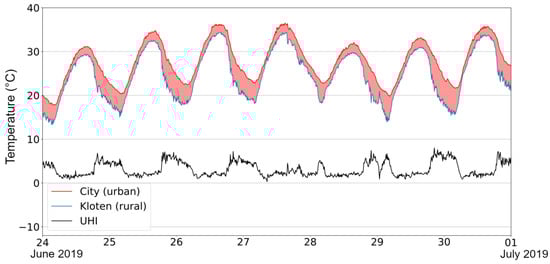
Figure 4.
Measured air temperature at 2 m height during the heat wave between 24 June and 1 July 2019 in Zurich and the associated urban heat island (UHI) intensity based on urban and rural temperatures. Datasource: MeteoSwiss (Kloten) and Swiss National Air Pollution Monitoring Network (NABEL).
The computational domain for mesoscale simulations has dimensions of approximately 60 × 47 km2 and consists of a 216 × 168 grid with a grid spacing of 0.0025° (278 m) centred on the city of Zurich. The domain has 65 levels in vertical direction with the first one being at 5 m. The model is run for almost a month from 10 June 2019 00:00 UTC until 2 July 2019 00:00 UTC. The boundary conditions are provided by MeteoSwiss COSMO-1 dataset for this period. The urban parameters are calculated based on the Swiss 3D building data described in Mussetti et al. [40]. Figure 5 shows the air temperature distribution on 25 June at 15:00 UTC at 2 m height in part of the Zurich city centre as a result of the MMM simulations. Lower temperatures are visible on the hills to the east and around the Lake Zurich, centre bottom of figure, while the temperatures in the old industrial area to the west are up to 3 °C higher.
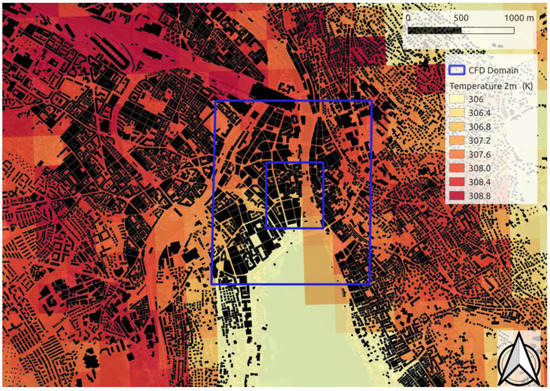
Figure 5.
Distribution of air temperature at 2 m from COSMO-DCEP simulations in Zurich City on 25 June 2019 15:00 UTC and the CFD domain size.
In Figure 5, one can also see the scaling of the computational domain for CFD inside the MMM domain. The larger blue rectangle indicates the dimensions of the computational domain and the smaller rectangle indicates the area where the buildings are explicitly modelled. The computational domain for CFD is shown in Figure 6a with the group of explicitly modelled buildings. The colour of the buildings (blue, orange and green) indicates different resolution in terms of the geometric details and computational grid. The computational grid is more refined and the building shapes are captured more accurately in the immediate surroundings of Münsterhof (blue zone). Buildings located further away are not resolved and modelled only as a surface roughness on the ground. In between the two zones, the buildings are modelled with a simplified geometry (orange and green). Part of Lake Zurich is also visible in Figure 6a to the south of the city. From the lake, the Limmat river flows towards North close to the Münsterhof.
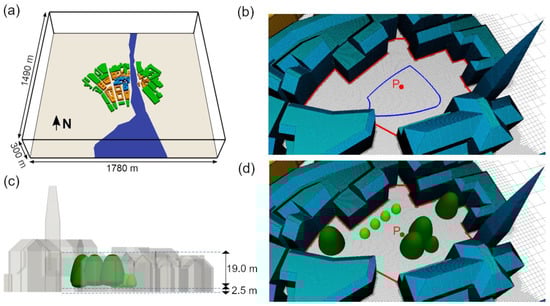
Figure 6.
(a) Computational domain. (b) Grid on the surfaces of Münsterhof, an urban square in Zurich, in reference configuration. (c,d) Configuration with trees added within Münsterhof.
Part of the computational grid for CFD simulations is shown in Figure 6b. The cell size within Münsterhof is roughly 0.6 m and the cell height on the walls is 0.1 m. The ground surface of the Münsterhof, outlined in red in Figure 6b, as well as the building facades facing the square are modelled as coupled boundaries between the CFD and HAM domains. Three-dimensional computational domains for the HAM model are generated by extruding the coupled boundaries in their normal direction. For the ground, a top layer of concrete with 30-cm thickness is considered. Beneath this layer, a soil layer is present until a total depth of 2.0 m. The facades are modelled with clay brick masonry of 9-cm thickness, while the interior boundaries are modelled with an additional thermal resistance of 2.5 m2K/W and a fixed indoor temperature of 20 °C. The temperature of the remaining surfaces in the CFD domain, such as the ground, building facades and roofs outside Münsterhof, is obtained from COSMO-DCEP simulations.
The square is highly exposed to solar radiation and currently without vegetation. This situation is considered as the reference case. For comparison, two additional mitigation cases are considered. The first case considers pavements for evaporative cooling following the example of Kubilay et al. [15] as discussed in Section 4.2. For this, the inner area outlined in blue in Figure 6b is replaced with a similar two-layer pavement configuration and wetted in the morning between 8:00 and 8:20 with a total water amount of 6 mm. This area represents around 25% of the total area of Münsterhof. For the second case, an adapted setup is designed with several trees planted in the square as shown in Figure 6c,d. Two species of trees are used that are typically found in the city of Zurich as street trees: five silver lindens (Tilia tomentosa) indicated in dark green, and four field maples (Acer campestre) indicated in light green in Figure 6d. Silver linden is a relatively taller tree less transmissive to solar radiation, while field maple is a shorter tree that is more transmissive. Uniform LAD values of 4 m2/m3 for the foliage of silver linden and 2 m2/m3 for field maple are used.
The simulations are initialized by solving the heat balance in the material domains for a duration of 3 weeks in order to have a realistic thermal storage and temperature distribution in the urban materials included in the HAM subdomain. Then, fully coupled simulations are performed for 25 June, during which a high maximum air temperature is measured with a high UHI intensity as shown in Figure 4.
Figure 7a,b present the average pavement surface temperature in Münsterhof for the total area indicated with the red line in Figure 6 and the inner area used for artificial wetting indicated with the blue line, respectively. Figure 7b shows that artificial wetting causes locally a strong decrease, i.e., of more than 20 °C, in surface temperature. The temperature of the wet pavement surface remains significantly low until the pavement enters the second drying phase at around 10:30. It is found that the first drying phase is shortened in the square compared to a street canyon case, which is more protected from solar radiation by shadowing. In the afternoon, the surface temperature remains between the reference and vegetation cases. The average surface temperature of the complete Münsterhof area in the case of artificial wetting of pavements, however, is much closer to the reference case (Figure 7a). In the case with vegetation, the presence of trees provides considerable shadowing and decreases the overall absorption of solar radiation on the ground surface, which leads to lower surface temperatures throughout the day. The largest difference of pavement surface temperature compared to the reference case is around 9 °C on average in the complete square in presence of trees.
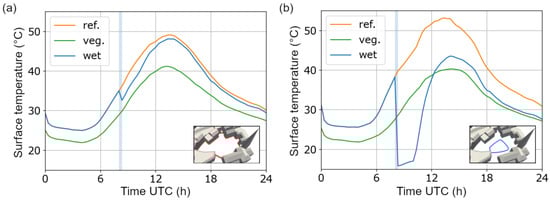
Figure 7.
Variations of temperature of the ground surface of Münsterhof averaged over (a) the complete square area and (b) the wetted pavement area (where the light blue band indicates the duration of wetting), for the reference case (ref.), the case with artificial wetting (wet) and the case with trees (veg.) on 25 June 2019.
The reduction in surface temperature in the cases with artificial wetting and vegetation results in a local decrease in the air temperature, improving thermal comfort. However, at the same time, evaporation in both cases leads to higher relative humidity locally. The presence of trees, with their porous foliage, is also found to decrease wind speed, hence reducing ventilation. Reduced wind speed and increased relative humidity have an adverse impact on thermal comfort. The resulting pedestrian thermal comfort is evaluated using the Universal Thermal Climate Index (UTCI) [61], which is an equivalent temperature perceived by a pedestrian based on local values for air temperature, relative humidity, wind speed and mean radiant temperature. Figure 8 shows the obtained UTCI values for the 1.7 m-high position indicated with P in Figure 6, showing a peak heat stress around 14:00 UTC for the reference case. After artificial wetting, the UTCI values decrease by up to 3.2 °C, i.e., thermal comfort improves, but later in the afternoon this difference decreases. In the case with trees, during daytime, there is a significant improvement in thermal comfort and UTCI values decrease by up to 6.9 °C, while the UTCI values are higher than the reference case during night time as a result of the reduced sky view factor.
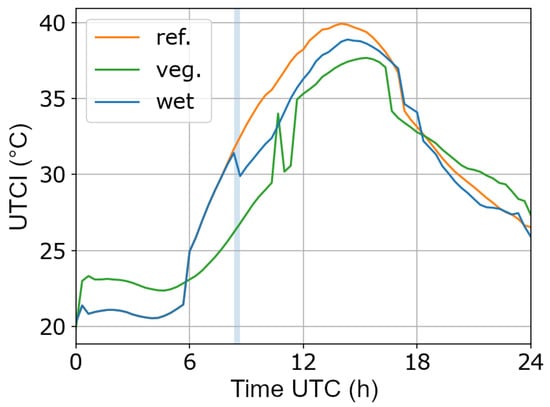
Figure 8.
Variation of thermal comfort index UTCI at point P for the reference case (ref.), the case with artificial wetting (wet, where the light blue band indicates the duration of wetting) and the case with trees (veg.) on 25 June 2019.
In Figure 9, the spatial distributions of the UTCI values are presented at 12:00 and 14:00 UTC. In the reference case, at 12:00, a large part of the square shows a UTCI above 37 °C. There are also larger values visible at the northern side close to the building facades facing the sun. At 14:00, a larger part of Münsterhof shows UTCI values higher than 39 °C, indicating very strong heat stress based on the classification given in Bröde et al. [62]. Artificial wetting applied at the central part of Münsterhof decreases the UTCI values by up to 2.5 °C at 12:00. A similar impact is observed in the street canyon case in Kubilay et al. [15]. However, this impact decreases to around 1 °C at 14:00. Figure 9 indicates a similar impact of cooling in the case of trees at 12:00, with additional cool zones directly under the trees due to shadowing. The reduced UTCI values indicate moderate heat stress or a lower range of strong heat stress. UTCI values are significantly low, especially around the larger silver linden trees. At 14:00, the cooling achieved with the trees is larger than the one with the wetted surfaces, as the pavement surface starts already to dry.
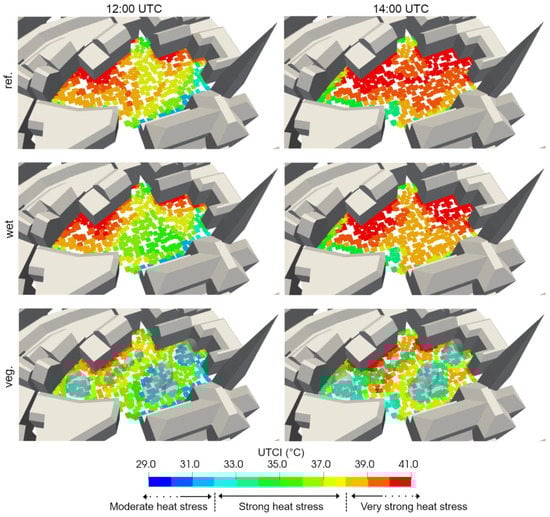
Figure 9.
Spatial variation of thermal comfort index UTCI at pedestrian height in Münsterhof for the reference case (ref.), the case with artificial wetting (wet) and the case with trees (veg.) at 12:00 and 14:00 UTC on 25 June 2019.
Thermal comfort analysis shows that the cooling achieved by trees is more efficient than artificial wetting in this case study. The main factors here are the shadowing provided by the trees and, to a lower extent, evapotranspiration. Although providing comparatively less cooling, artificial wetting can be considered in locations where vegetation is not an option. The maximum cooling provided by artificial wetting is similar to the previous observations made in the case of a street canyon, but the duration of cooling is found to be shorter. It is possible that the optimal wetting amount for open spaces is higher than what is required for a street canyon, which offers more shadowing and as such a slower drying and longer first drying period.
5. Discussion and Future Research
5.1. Coupling of CFD with Mesoscale Models and HAM Model
The MMM models provide realistic boundary conditions taking into account local topography and land-use. The local precision is however limited by the coarse resolution due to assumptions on different parametrised parts of the model and due to computational limitations. Coupling of MMM and CFD models is an on-going research field, where multiple approaches exist with different advantages. Validation of such coupling is complex and requires large datasets of carefully conducted urban measurement campaigns. An alternative for the coupling at lateral boundaries of the CFD domain is the use of a “nudging term” which corrects the mass balance based on MMM solution, typically within a blending zone near the lateral boundaries [63,64,65].
The coupled submodels included at local scale, i.e., CFD, HAM and vegetation, have been individually validated in earlier studies. However, these validation studies do not include the coupling of all submodels at once and the conditions are not the same as for Münsterhof. While measured surface temperature data are available for Münsterhof based on infrared images and satellite images are available from different time periods and show similar range of values, surface temperatures alone are not sufficient for a complete validation. Detailed measurement campaigns with a well-organized monitoring setup are planned both at full scale and wind/water tunnel scales.
The coupled approach presented here would be appropriate for a neighbourhood-scale analysis, but would not be as efficient at city scale. One way to mitigate this issue can be to introduce an intermediate scale. Recently, a new LES modelling approach PALM [66] and its urban part extension PALM-4U is developed, with the advantage of a building-resolved simulation domain using Finite Difference discretization. Further work is required, possibly incorporating machine learning methods, in order to provide a fast method for assessing heat island mitigation measures at city level.
5.2. Coupling of CFD with Building Energy Simulation Tools
The developed CFD-BES model shows its great capability in revealing the interaction between LHI intensity and space cooling demands, as well as their complex dependence on urban morphology, where effects of wind speed on heat removal and LHIs can be analysed. The insight gained through the CFD-BES modelling suggests that urban morphology has a significant influence on LHIs and should be considered in the design and mitigation of urban areas. The capability of the CFD-BES could be further improved by implementing full two-way coupling where temperatures and heat fluxes are exchanged from BES to CFD over the total built environment and not only at building surfaces. In addition, other influencing factors, such as anthropogenic heat generation, diurnal change of wind speed and direction, evapotranspiration of vegetation and presence of water bodies, could be incorporated into the CFD-BES model. Such extensions would allow to better study the impact of different factors and mitigation measures on space cooling demand. Further, CFD-BES models can be coupled to mesoscale meteorological models taking into account realistic boundary conditions, allowing to study also the impacts of climate change on cooling demand in the urban context. Finally, in BES, yearly calculations are generally performed with hourly time step, which is still computationally impossible for CFD. Therefore, new approaches using simplified CFD modelling or machine learning could help in speeding up the CFD-BES model performance.
5.3. Mitigation Measures
Sustainable counter-measures to local urban heat islands are expected to require a combination of mitigation measures such as the use of ventilation lanes, shadowing, evaporative cooling, vegetation, reflective surfaces. Analyses at local scale are required in order to assess the LHIs and assess correctly the impact of these mitigation measures. The cooling provided by permeable pavements depends on the availability of moisture near the surface layer. This study mainly focuses on the impact of an optimized pavement configuration of pedestrian thermal comfort using artificial wetting solutions, e.g., using stored water. Next steps include the design and testing of the engineering solutions of such improved pavements in terms of material choice and durability.
Similarly, cooling by evapotranspiration from trees depends on moisture availability in the soil, air humidity and local wind-flow field among others. Coupling CFD models with HAM improves the assessment of evaporative-cooling potential and more advanced modelling of vegetation including moisture transport from soil, through roots and to foliage is to come. The impact of extreme weather conditions such as drought, during which vegetation would be unable to provide sufficient cooling through transpiration, can be analysed and related wetting/irrigation strategies can be optimized. Building-resolved wind-flow field obtained from CFD improves the assessment of possible ventilation lanes and the evaluation of local thermal comfort.
The necessity of properly understanding the water cycle and its management in the urban environment is highlighted by climate change. At the core of this coupled model is a large effort to model wind-driven rain (WDR) as a moisture source in the built environment. To predict rain deposition on building façades in the urban context, an Eulerian Multiphase CFD model was developed and validated with field measurements by the authors [67,68]. Rethinking the urban water cycle could lead to use grey and rain/storm water for mitigation needs. Drinking water is too costly and often the availability is not sufficient nor is the usage of this valuable resource for cooling sustainable. Non-potable water produced from greywater is readily available in cities, where there is a high population density. Another route would be to harvest rain water over a certain catchment area, which are most of the time building roofs, and store this water locally, preferentially underground in reservoirs.
The development of proper performance assessment methodologies is needed in order to incorporate all relevant urban elements and interface properly with adequate comfort and physiological models of occupants, as well as methods for health impact assessment. These assessments have to be done under different scenarios of future climate. The notion of risks posed by UHI and climate change must be better defined and incorporated in the development of mitigation or adaptation solutions. This work will benefit from the development of a multidisciplinary approach by linking to other expertise such as mesoscale meteorology and climatology, hydrology and urban water management, building engineering and building heat ventilation and air cooling systems, human physiology, health and material science, to mention a few.
6. Conclusions
This paper proposes a framework with the goal of studying the urban climate in its complex geometry and physics. A combination of models allows for studies of the urban climate at local scale by coupling wind flow and buoyancy with radiative exchange, heat and mass transport in porous materials, the hygrothermal behaviour of porous materials and vegetation subjected to variations of wetting, sun, wind, humidity and temperature in order to evaluate their roles in urban neighbourhoods. The model is driven by climate predictions from a mesoscale meteorological model including urban parametrisation. Further, coupling the urban environment of a building to its energy demand assessment is shown to provide a new array of insights for improving building performance.
Mitigation solutions for urban heat island effect and heat waves are assessed in terms of pedestrian comfort and building (cooling) energy consumption for realistic situations. Vegetation, namely trees, evaporative cooling pavements and neighbourhood morphologies are studied, demonstrating just a few facets of potential of the proposed framework. This framework can eventually be part of design methodologies for conceiving better adapted buildings and also better urban environments that can mitigate the negative effects of future climate change and increased UHI. Future work could extend the modelling framework to take into account anthropogenic heat sources such as waste heat from HVAC equipment and traffic (cars), the soil configuration and presence of plant roots, or to post-process the outdoor conditions in terms of heat stress load and link to impact on health combining indoor and outdoor heat stresses. At present, efforts are made to accurately model all physical, and eventually biological, aspects at play. It is a hope that eventually simplification and emulation, e.g., by machine learning, could be used to provide not only guidelines for urban planners and designers but accurate and efficient design tools.
Author Contributions
Conceptualization: A.K., D.S., Y.Z., D.D. and J.C.; formal analysis: A.K., J.A. and D.S.; methodology: A.K., J.A. and D.S.; visualization: A.K., D.S. and D.D.; supervision: D.D. and J.C.; writing—original draft: A.K., D.S., Y.Z., D.D. and J.C.; writing—review and editing: J.A., D.D. and J.C. All authors have read and agreed to the published version of the manuscript.
Funding
This research project is supported by the Swiss Competence Center for Energy Research SCCER FEEB&D of the Swiss Innovation Agency lnnosuisse CTI.1155002539, the Swiss National Science Foundation (SNF)—Project No. 200021_169323 and the ETH Research Grant ETH-08 16-2.
Acknowledgments
The authors would like to thank the City of Zurich for providing the geometrical model of buildings, used for generating the computational grid, and to Andreas Rubin from the Chair of Building Physics, ETH Zurich, for providing the arrangement of trees in the vegetated case in Figure 6d.
Conflicts of Interest
The authors declare no conflict of interest.
References
- Easterling, D.R. Climate Extremes: Observations, Modeling, and Impacts. Science 2000, 289, 2068–2074. [Google Scholar] [CrossRef] [PubMed]
- WHO. World Health Organization: Heatwaves. Available online: https://www.who.int/health-topics/heatwaves (accessed on 27 October 2020).
- Lass, W.; Haas, A.; Hinkel, J.; Jaeger, C. Avoiding the avoidable: Towards a European heat waves risk governance. Int. J. Disaster Risk Sci. 2011, 2, 1–14. [Google Scholar] [CrossRef]
- Moonen, P.; Defraeye, T.; Dorer, V.; E Blocken, B.J.; Carmeliet, J. Urban Physics: Effect of the micro-climate on comfort, health and energy demand. Front. Arch. Res. 2012, 1, 197–228. [Google Scholar] [CrossRef]
- Allegrini, J.; Carmeliet, J. Studying the impact of local urban heat islands on the space cooling demand of buildings using coupled CFD and building energy simulations. In Proceedings of the IBPC2018: 7th International Building Physics Conference, Syracuse, NY, USA, 23–26 September 2018. [Google Scholar] [CrossRef]
- Heaviside, C.; MacIntyre, H.; Vardoulakis, S. The Urban Heat Island: Implications for Health in a Changing Environment. Curr. Environ. Health Rep. 2017, 4, 296–305. [Google Scholar] [CrossRef]
- Santamouris, M. Using cool pavements as a mitigation strategy to fight urban heat island—A review of the actual developments. Renew. Sustain. Energy Rev. 2013, 26, 224–240. [Google Scholar] [CrossRef]
- Wang, Q.; Hang, J.; Fan, Y.; Li, Y. Urban plume characteristics under various wind speed, heat flux, and stratification conditions. Atmos. Environ. 2020, 239, 117774. [Google Scholar] [CrossRef]
- Bowler, D.E.; Buyung-Ali, L.; Knight, T.M.; Pullin, A.S. Urban greening to cool towns and cities: A systematic review of the empirical evidence. Landsc. Urban Plan. 2010, 97, 147–155. [Google Scholar] [CrossRef]
- Akbari, H.; Pomerantz, M.; Taha, H. Cool surfaces and shade trees to reduce energy use and improve air quality in urban areas. Sol. Energy 2001, 70, 295–310. [Google Scholar] [CrossRef]
- Santamouris, M. Cooling the cities—A review of reflective and green roof mitigation technologies to fight heat island and improve comfort in urban environments. Sol. Energy 2014, 103, 682–703. [Google Scholar] [CrossRef]
- Garcia-Nevado, E.; Beckers, B.; Coch, H. Assessing the cooling effect of urban textile shading devices through time-lapse thermography. Sustain. Cities Soc. 2020, 63, 102458. [Google Scholar] [CrossRef]
- Tominaga, Y.; Sato, Y.; Sadohara, S. CFD simulations of the effect of evaporative cooling from water bodies in a micro-scale urban environment: Validation and application studies. Sustain. Cities Soc. 2015, 19, 259–270. [Google Scholar] [CrossRef]
- Kubilay, A.; Derome, D.; Carmeliet, J. Impact of evaporative cooling due to wetting of urban materials on local thermal comfort in a street canyon. Sustain. Cities Soc. 2019, 49, 101574. [Google Scholar] [CrossRef]
- Kubilay, A.; Ferrari, A.; Derome, D.; Carmeliet, J. Smart wetting of permeable pavements as an evaporative-cooling measure for improving the urban climate during heat waves. J. Build. Phys. 2020, 1744259120968586. [Google Scholar] [CrossRef]
- Ferrari, A.; Kubilay, A.; Derome, D.; Carmeliet, J. The use of permeable and reflective pavements as a potential strategy for urban heat island mitigation. Urban Clim. 2020, 31, 100534. [Google Scholar] [CrossRef]
- Ramponi, R.; Blocken, B.J.E.; De Coo, L.B.; Janssen, W.D. CFD simulation of outdoor ventilation of generic urban configurations with different urban densities and equal and unequal street widths. Build. Environ. 2015, 92, 152–166. [Google Scholar] [CrossRef]
- Yang, J.; Tham, K.W.; Lee, S.E.; Santamouris, M.; Sekhar, C.; Cheong, D.K.W. Anthropogenic heat reduction through retrofitting strategies of campus buildings. Energy Build. 2017, 152, 813–822. [Google Scholar] [CrossRef]
- Doan, V.Q.; Kusaka, H.; Nguyen, T.M. Roles of past, present, and future land use and anthropogenic heat release changes on urban heat island effects in Hanoi, Vietnam: Numerical experiments with a regional climate model. Sustain. Cities Soc. 2019, 47, 101479. [Google Scholar] [CrossRef]
- Osterman, E.; Tyagi, V.V.; Butala, V.; Rahim, N.; Stritih, U. Review of PCM based cooling technologies for buildings. Energy Build. 2012, 49, 37–49. [Google Scholar] [CrossRef]
- Artmann, N.; Manz, H.; Heiselberg, P. Climatic potential for passive cooling of buildings by night-time ventilation in Europe. Appl. Energy 2007, 84, 187–201. [Google Scholar] [CrossRef]
- Allegrini, J.; Carmeliet, J. Coupled CFD and building energy simulations for studying the impacts of building height topology and buoyancy on local urban microclimates. Urban Clim. 2017, 21, 278–305. [Google Scholar] [CrossRef]
- Zhao, Y.; Chew, L.W.; Kubilay, A.; Carmeliet, J. Isothermal and non-isothermal flow in street canyons: A review from theoretical, experimental and numerical perspectives. Build. Environ. 2020, 184, 107163. [Google Scholar] [CrossRef]
- Manickathan, L.; Defraeye, T.; Allegrini, J.; Derome, D.; Carmeliet, J. Parametric study of the influence of environmental factors and tree properties on the transpirative cooling effect of trees. Agric. For. Meteorol. 2018, 248, 259–274. [Google Scholar] [CrossRef]
- Kubilay, A.; Derome, D.; Carmeliet, J. Coupling of physical phenomena in urban microclimate: A model integrating air flow, wind-driven rain, radiation and transport in building materials. Urban Clim. 2018, 24, 398–418. [Google Scholar] [CrossRef]
- Bueno, B.; Wilson, H.R.; Sunkara, S.; Sepúlveda, A.; Kuhn, T.E. Simulation-based design of an angle-selective and switchable textile shading system. Build. Environ. 2020, 184, 107227. [Google Scholar] [CrossRef]
- Adelia, A.; Yuan, C.; Liu, L.; Shan, R. Effects of urban morphology on anthropogenic heat dispersion in tropical high-density residential areas. Energy Build. 2019, 186, 368–383. [Google Scholar] [CrossRef]
- Li, S.; Jaroszynski, S.; Pearse, S.; Orf, L.G.; Clyne, J. VAPOR: A Visualization Package Tailored to Analyze Simulation Data in Earth System Science. Atmosphere 2019, 10, 488. [Google Scholar] [CrossRef]
- Orlanski, I. A Rational Subdivision of Scales for Atmospheric Processes. Bull. Am. Meteorol. Soc. 1975, 56, 527–530. [Google Scholar]
- Skamarock, W.C.; Klemp, J.B.; Dudhia, J.; Gill, D.O.; Liu, Z.; Berner, J.; Wang, W.; Powers, J.G.; Duda, M.G.; Barker, D.M.; et al. A Description of the Advanced Research WRF Version 4; No. NCAR/TN-556+STR, NCAR Technical Note; National Center for Atmospheric Research: Boulder, CO, USA, 2019; 145p. [Google Scholar] [CrossRef]
- Doms, G.; Baldauf, M. A Description of the Nonhydrostatic Regional COSMO-Model. Part I: Dynamics and Numerics; Deutscher Wetterdienst: Offenbach, Germany, 2011. [Google Scholar]
- Davies, H.C. A lateral boundary formulation for multi-level prediction models. Q. J. R. Meteorol. Soc. 1976, 102, 405–418. [Google Scholar] [CrossRef]
- Chen, F.; Kusaka, H.; Bornstein, R.; Ching, J.; Grimmond, C.S.B.; Grossman-Clarke, S.; Loridan, T.; Manning, K.W.; Martilli, A.; Miao, S.; et al. The integrated WRF/urban modelling system: Development, evaluation, and applications to urban environmental problems. Int. J. Clim. 2011, 31, 273–288. [Google Scholar] [CrossRef]
- Martilli, A.; Clappier, A.; Rotach, M.W. An Urban Surface Exchange Parameterisation for Mesoscale Models. Bound. Layer Meteorol. 2002, 104, 261–304. [Google Scholar] [CrossRef]
- Wouters, H.; Demuzere, M.; De Ridder, K.; van Lipzig, N.P.M. The impact of impervious water-storage parametrization on urban climate modelling. Urban Clim. 2015, 11, 24–50. [Google Scholar] [CrossRef]
- Trusilova, K.; Früh, B.; Brienen, S.; Walter, A.; Masson, V.; Pigeon, G.; Becker, P. Implementation of an Urban Parameterization Scheme into the Regional Climate Model COSMO-CLM. J. Appl. Meteorol. Clim. 2013, 52, 2296–2311. [Google Scholar] [CrossRef]
- Schubert, S.; Grossman-Clarke, S.; Martilli, A. A Double-Canyon Radiation Scheme for Multi-Layer Urban Canopy Models. Bound. Layer Meteorol. 2012, 145, 439–468. [Google Scholar] [CrossRef]
- Mussetti, G.; Brunner, D.; Allegrini, J.; Wicki, A.; Schubert, S.; Carmeliet, J. Simulating urban climate at sub-kilometre scale for representing the intra-urban variability of Zurich, Switzerland. Int. J. Clim. 2019, 40, 458–476. [Google Scholar] [CrossRef]
- Krayenhoff, E.S.; Christen, A.; Martilli, A.; Oke, T.R. A Multi-layer Radiation Model for Urban Neighbourhoods with Trees. Bound. Layer Meteorol. 2014, 151, 139–178. [Google Scholar] [CrossRef]
- Mussetti, G.; Brunner, D.; Henne, S.; Allegrini, J.; Krayenhoff, E.S.; Schubert, S.; Feigenwinter, C.; Vogt, R.; Wicki, A.; Carmeliet, J. COSMO-BEP-Tree v1.0: A coupled urban climate model with explicit representation of street trees. Geosci. Model Dev. 2020, 13, 1685–1710. [Google Scholar] [CrossRef]
- Mirzaei, P.A.; Haghighat, F. Approaches to study Urban Heat Island—Abilities and limitations. Build. Environ. 2010, 45, 2192–2201. [Google Scholar] [CrossRef]
- Toparlar, Y.Y.; Blocken, B.; Maiheu, B.; Van Heijst, G.J.F. A review on the CFD analysis of urban microclimate. Renew. Sustain. Energy Rev. 2017, 80, 1613–1640. [Google Scholar] [CrossRef]
- Allegrini, J.; Dorer, V.; Carmeliet, J. Influence of morphologies on the microclimate in urban neighbourhoods. J. Wind. Eng. Ind. Aerodyn. 2015, 144, 108–117. [Google Scholar] [CrossRef]
- Botham-Myint, D.; Recktenwald, G.W.; Sailor, D.J. Thermal footprint effect of rooftop urban cooling strategies. Urban Clim. 2015, 14, 268–277. [Google Scholar] [CrossRef]
- Nazarian, N.; Kleissl, J. CFD simulation of an idealized urban environment: Thermal effects of geometrical characteristics and surface materials. Urban Clim. 2015, 12, 141–159. [Google Scholar] [CrossRef]
- Murakami, S. Comparison of various turbulence models applied to a bluff body. J. Wind. Eng. Ind. Aerodyn. 1993, 21–36. [Google Scholar] [CrossRef]
- Blocken, B. LES over RANS in building simulation for outdoor and indoor applications: A foregone conclusion? Build. Simul. 2018, 11, 821–870. [Google Scholar] [CrossRef]
- Yaghoobian, N.; Kleissl, J.; U, K.T.P. An Improved Three-Dimensional Simulation of the Diurnally Varying Street-Canyon Flow. Bound. Layer Meteorol. 2014, 153, 251–276. [Google Scholar] [CrossRef]
- Toparlar, Y.Y.; Blocken, B.B.; Vos, P.; Van Heijst, G.G.-J.; Janssen, W.W.; Van Hooff, T.T.; Montazeri, H.H.; Timmermans, H.H. CFD simulation and validation of urban microclimate: A case study for Bergpolder Zuid, Rotterdam. Build. Environ. 2015, 83, 79–90. [Google Scholar] [CrossRef]
- Saneinejad, S.; Moonen, P.; Carmeliet, J. Coupled CFD, radiation and porous media model for evaluating the micro-climate in an urban environment. J. Wind. Eng. Ind. Aerodyn. 2014, 128, 1–11. [Google Scholar] [CrossRef]
- Cao, X.; Dai, X.; Liu, J. Building energy-consumption status worldwide and the state-of-the-art technologies for zero-energy buildings during the past decade. Energy Build. 2016, 128, 198–213. [Google Scholar] [CrossRef]
- Swiss Federal Office of Energy: Energy in Buildings. Available online: https://www.bfe.admin.ch/bfe/en/home.html (accessed on 1 November 2020).
- Robinson, D.; Haldi, F.; Leroux, P.; Perez, D.; Rasheed, A.; Wilke, U. CITYSIM: Comprehensive Micro-Simulation of Resource Flows for Sustainable Urban Planning. In Proceedings of the 11th International IBPSA Conference, Glasgow, UK, 27–30 July 2009; pp. 1083–1090. [Google Scholar]
- Allegrini, J.; Dorer, V.; Carmeliet, J. Coupled CFD, radiation and building energy model for studying heat fluxes in an urban environment with generic building configurations. Sustain. Cities Soc. 2015, 19, 385–394. [Google Scholar] [CrossRef]
- Allegrini, J.; Carmeliet, J. Simulations of local heat islands in Zürich with coupled CFD and building energy models. Urban Clim. 2018, 24, 340–359. [Google Scholar] [CrossRef]
- Kämpf, J. On the Modelling and Optimization of Urban Energy Fluxes. Ph.D. Thesis, EPFL, Lausanne, Switzerland, 2009. [Google Scholar]
- Trusilova, K.; Schubert, S.; Wouters, H.; Früh, B.; Grossman-Clarke, S.; Demuzere, M.; Becker, P. The urban land use in the COSMO-CLM model: A comparison of three parameterizations for Berlin. Meteorol. Z. 2016, 25, 231–244. [Google Scholar] [CrossRef]
- Janssen, H.; Blocken, B.; Carmeliet, J. Conservative modelling of the moisture and heat transfer in building components under atmospheric excitation. Int. J. Heat Mass Transf. 2007, 50, 1128–1140. [Google Scholar] [CrossRef]
- Rodríguez-Vázquez, M.; Hernández-Pérez, I.; Xamán, J.; Chávez, Y.; Gijón-Rivera, M.; Belman-Flores, J.M. Coupling building energy simulation and computational fluid dynamics: An overview. J. Build. Phys. 2020, 44, 137–180. [Google Scholar] [CrossRef]
- Xu, P.; Wang, L.; Liu, Y.; Chen, W.; Huang, P. The record-breaking heat wave of June 2019 in Central Europe. Atmos. Sci. Lett. 2020, 21, 21. [Google Scholar] [CrossRef]
- Fiala, D.; Havenith, G.; Broede, P.; Kampmann, B.; Jendritzky, G. UTCI-Fiala multi-node model of human heat transfer and temperature regulation. Int. J. Biometeorol. 2012, 56, 429–441. [Google Scholar] [CrossRef]
- Bröde, P.; Fiala, D.; Błażejczyk, K.; Holmér, I.; Jendritzky, G.; Kampmann, B.; Tinz, B.; Havenith, G. Deriving the operational procedure for the Universal Thermal Climate Index (UTCI). Int. J. Biometeorol. 2012, 56, 481–494. [Google Scholar] [CrossRef] [PubMed]
- Schlünzen, K.H.; Grawe, D.; Bohnenstengel, S.I.; Schlüter, I.; Koppmann, R. Joint modelling of obstacle induced and mesoscale changes—Current limits and challenges. J. Wind. Eng. Ind. Aerodyn. 2011, 99, 217–225. [Google Scholar] [CrossRef]
- Yamada, T.; Koike, K. Downscaling mesoscale meteorological models for computational wind engineering applications. J. Wind. Eng. Ind. Aerodyn. 2011, 99, 199–216. [Google Scholar] [CrossRef]
- Piroozmand, P.; Mussetti, G.; Allegrini, J.; Mohammadi, M.H.; Akrami, E.; Carmeliet, J. Coupled CFD framework with mesoscale urban climate model: Application to microscale urban flows with weak synoptic forcing. J. Wind. Eng. Ind. Aerodyn. 2020, 197, 104059. [Google Scholar] [CrossRef]
- Maronga, B.; Gryschka, M.; Heinze, R.; Hoffmann, F.; Kananisuhring, F.; Keck, M.; Ketelsen, K.; Letzel, M.O.; Suhring, M.; Raasch, S. The Parallelized Large-Eddy Simulation Model (PALM) version 4.0 for atmospheric and oceanic flows: Model formulation, recent developments, and future perspectives. Geosci. Model Dev. 2015, 8, 2515–2551. [Google Scholar] [CrossRef]
- Kubilay, A.; Derome, D.; Blocken, B.B.; Carmeliet, J.J. CFD simulation and validation of wind-driven rain on a building facade with an Eulerian multiphase model. Build. Environ. 2013, 61, 69–81. [Google Scholar] [CrossRef]
- Kubilay, A.; Derome, D.; Blocken, B.B.; Carmeliet, J.J. Numerical simulations of wind-driven rain on an array of low-rise cubic buildings and validation by field measurements. Build. Environ. 2014, 81, 283–295. [Google Scholar] [CrossRef]
Publisher’s Note: MDPI stays neutral with regard to jurisdictional claims in published maps and institutional affiliations. |
© 2020 by the authors. Licensee MDPI, Basel, Switzerland. This article is an open access article distributed under the terms and conditions of the Creative Commons Attribution (CC BY) license (http://creativecommons.org/licenses/by/4.0/).