Evaluation of Sixteen Gridded Precipitation Datasets over the Caribbean Region Using Gauge Observations

 , , , , and
Abstract
:1. Introduction
2. Data and Methods
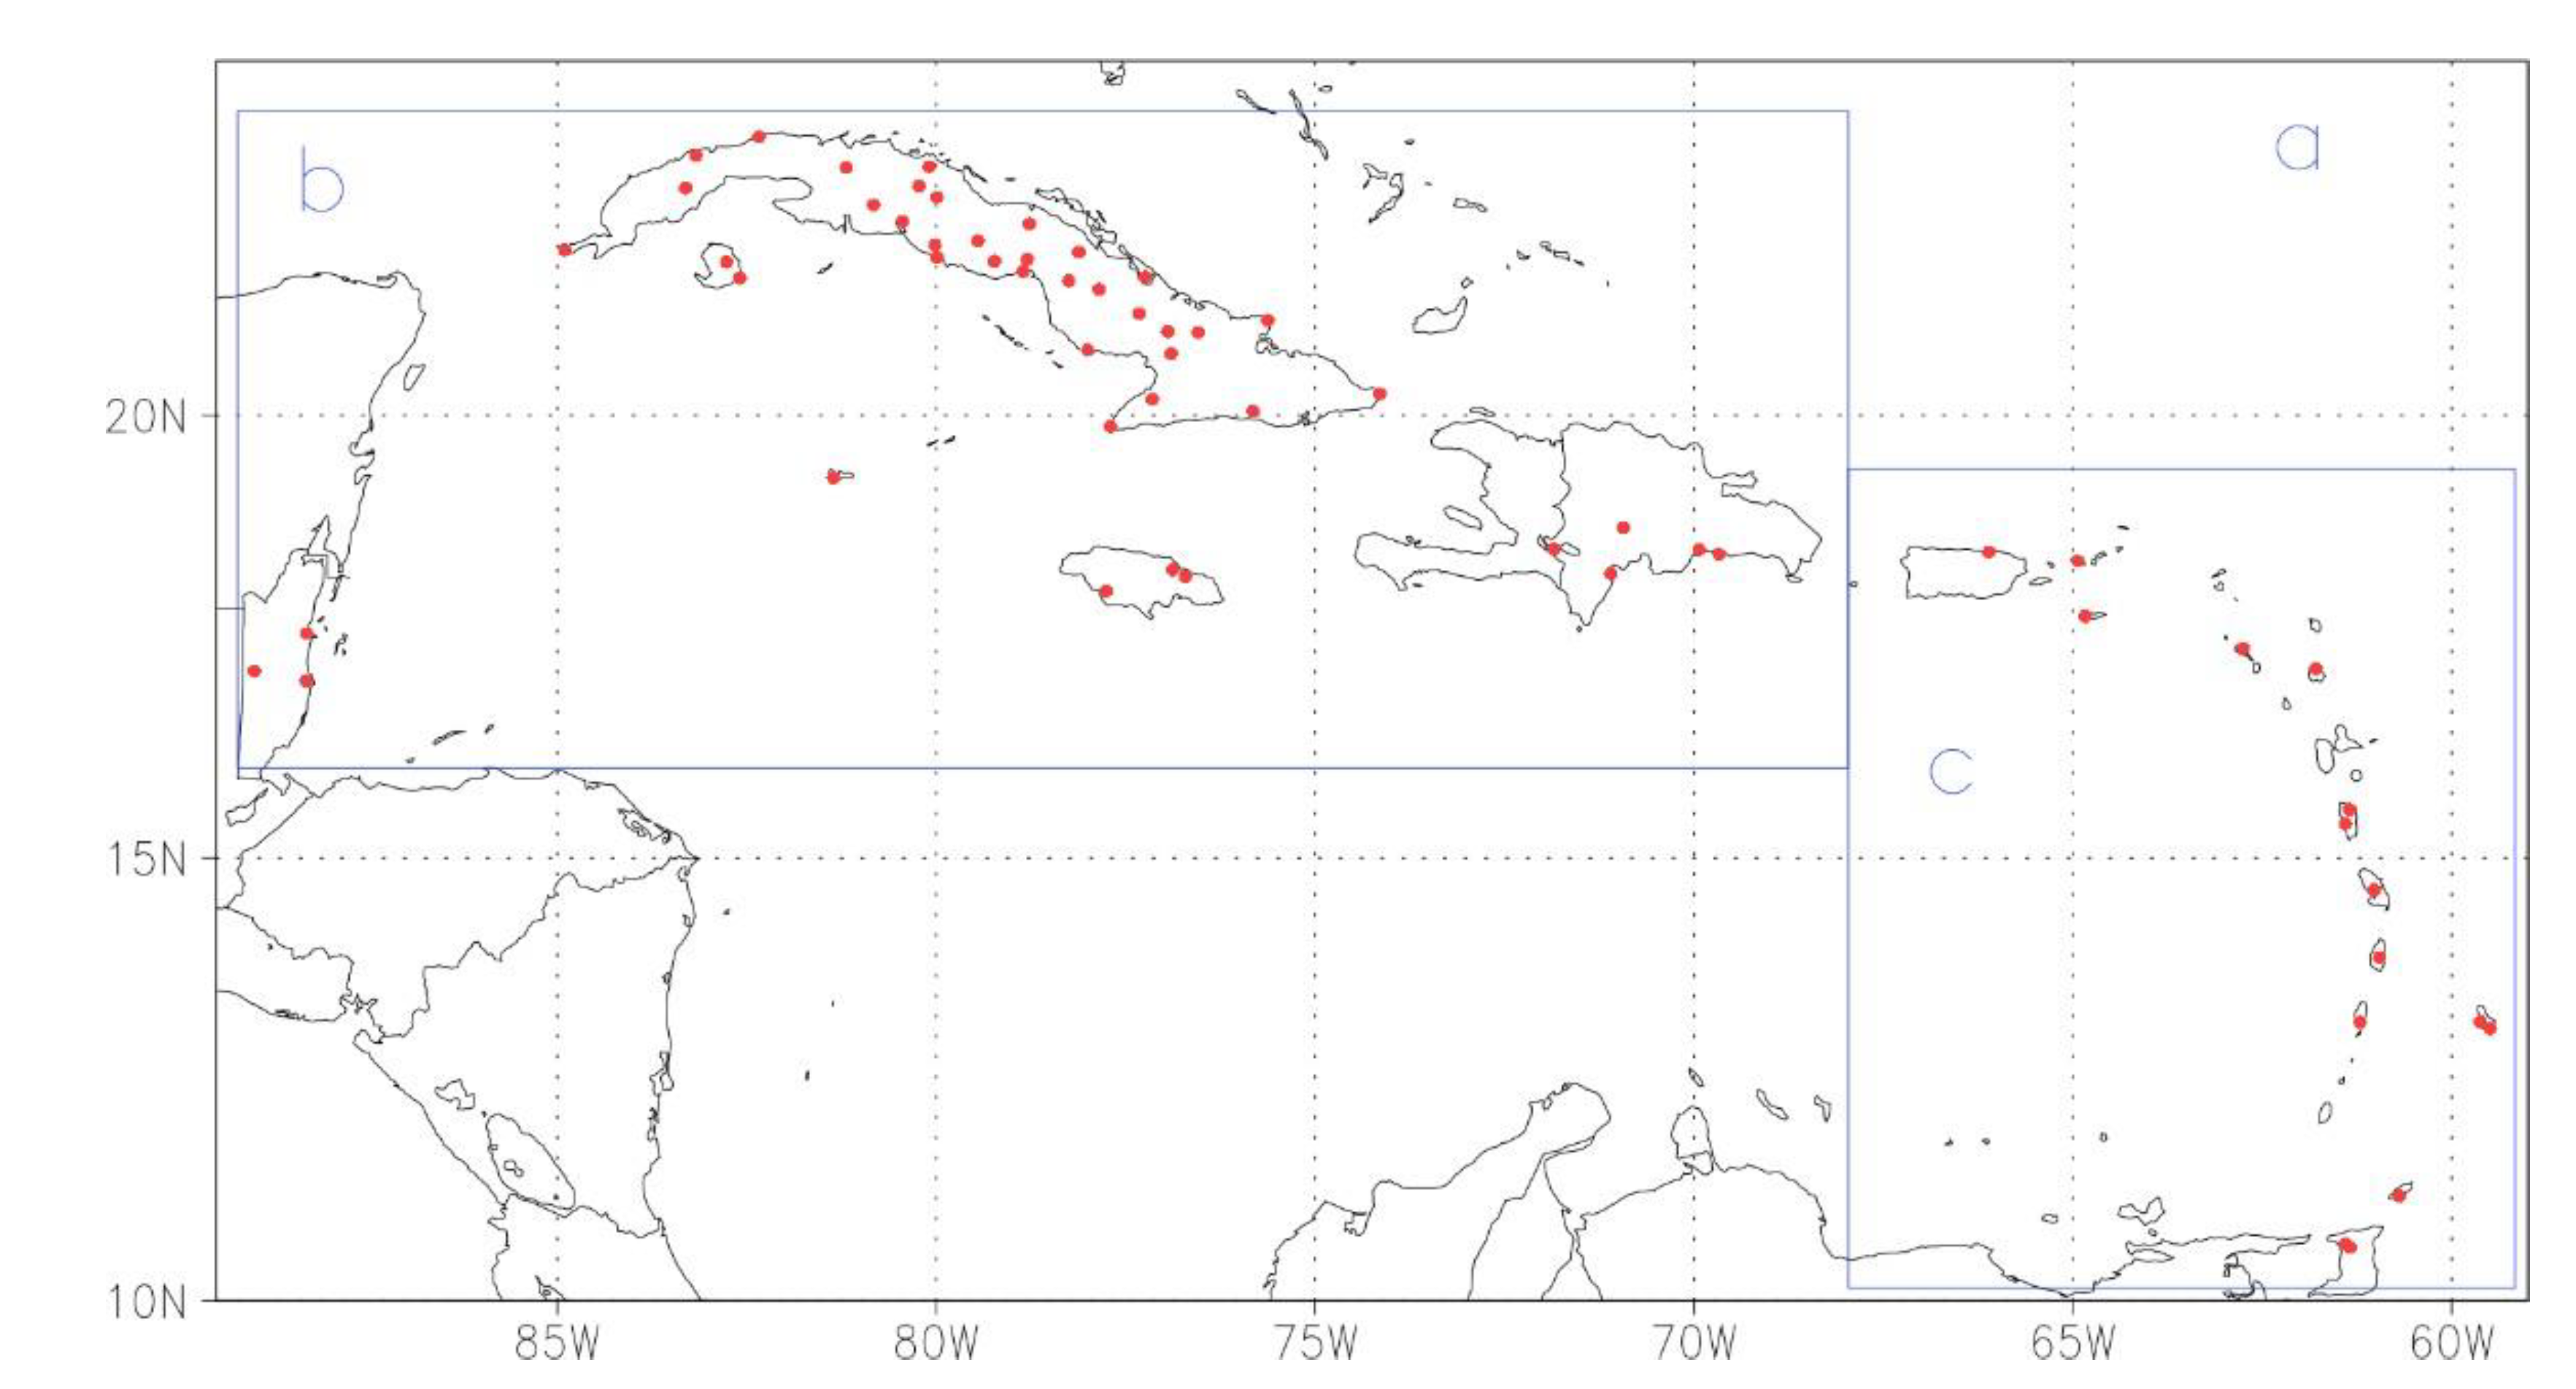
2.1. Study Area
2.2. Datasets
2.3. Methodology
3. Results and Discussion
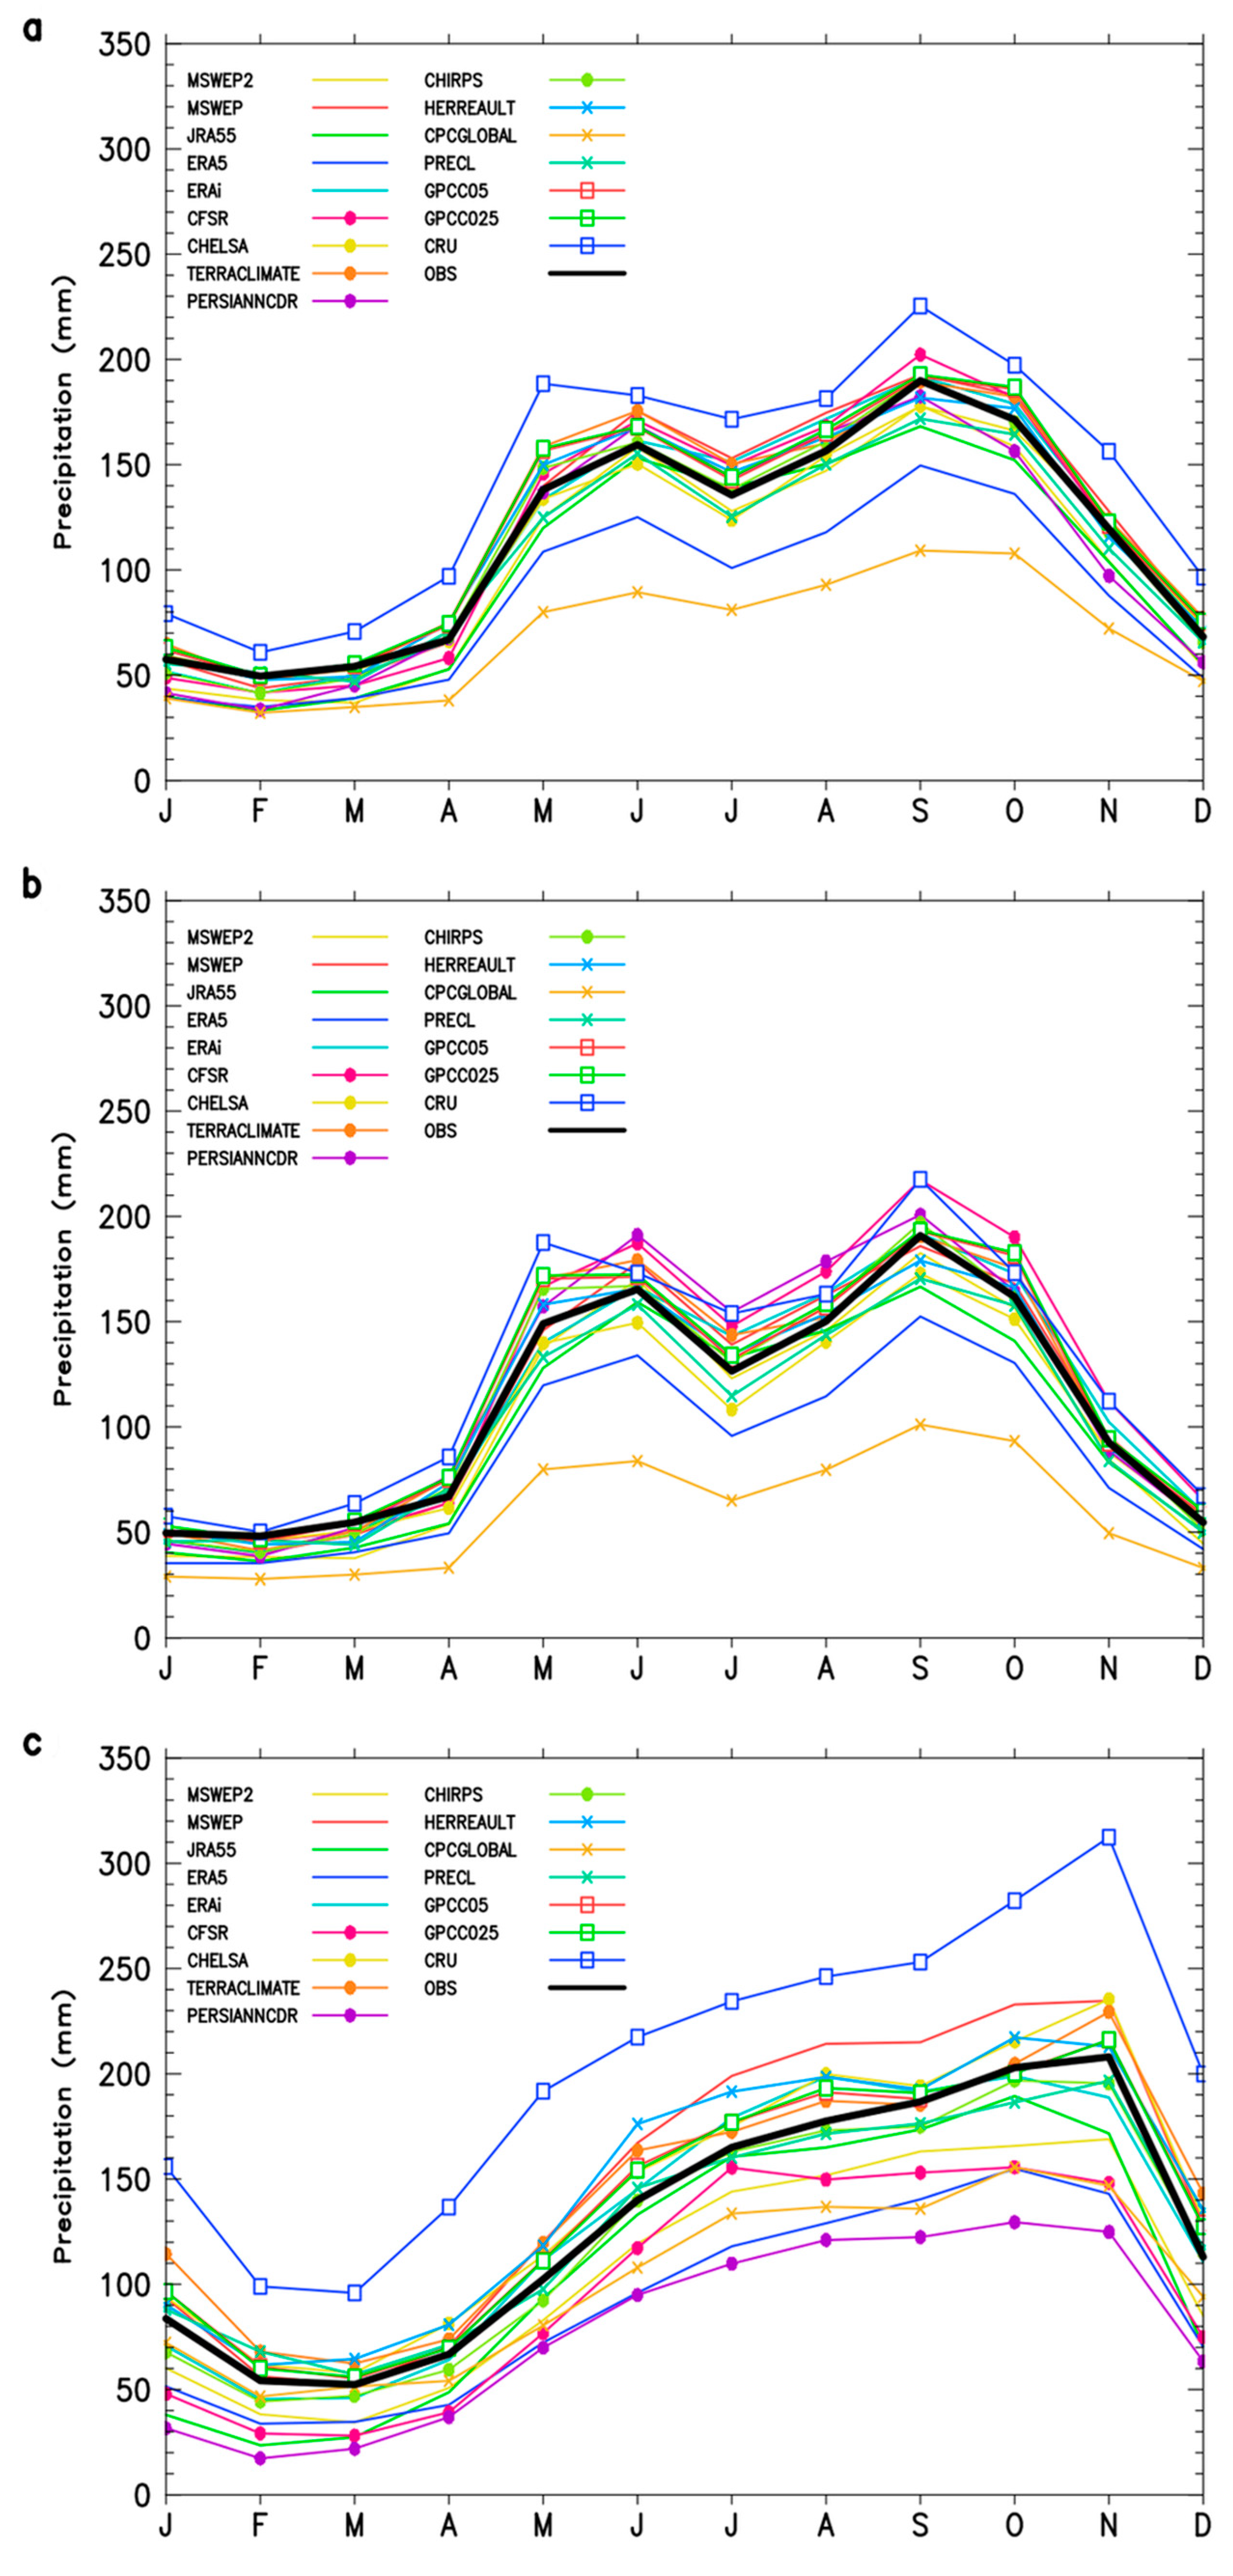
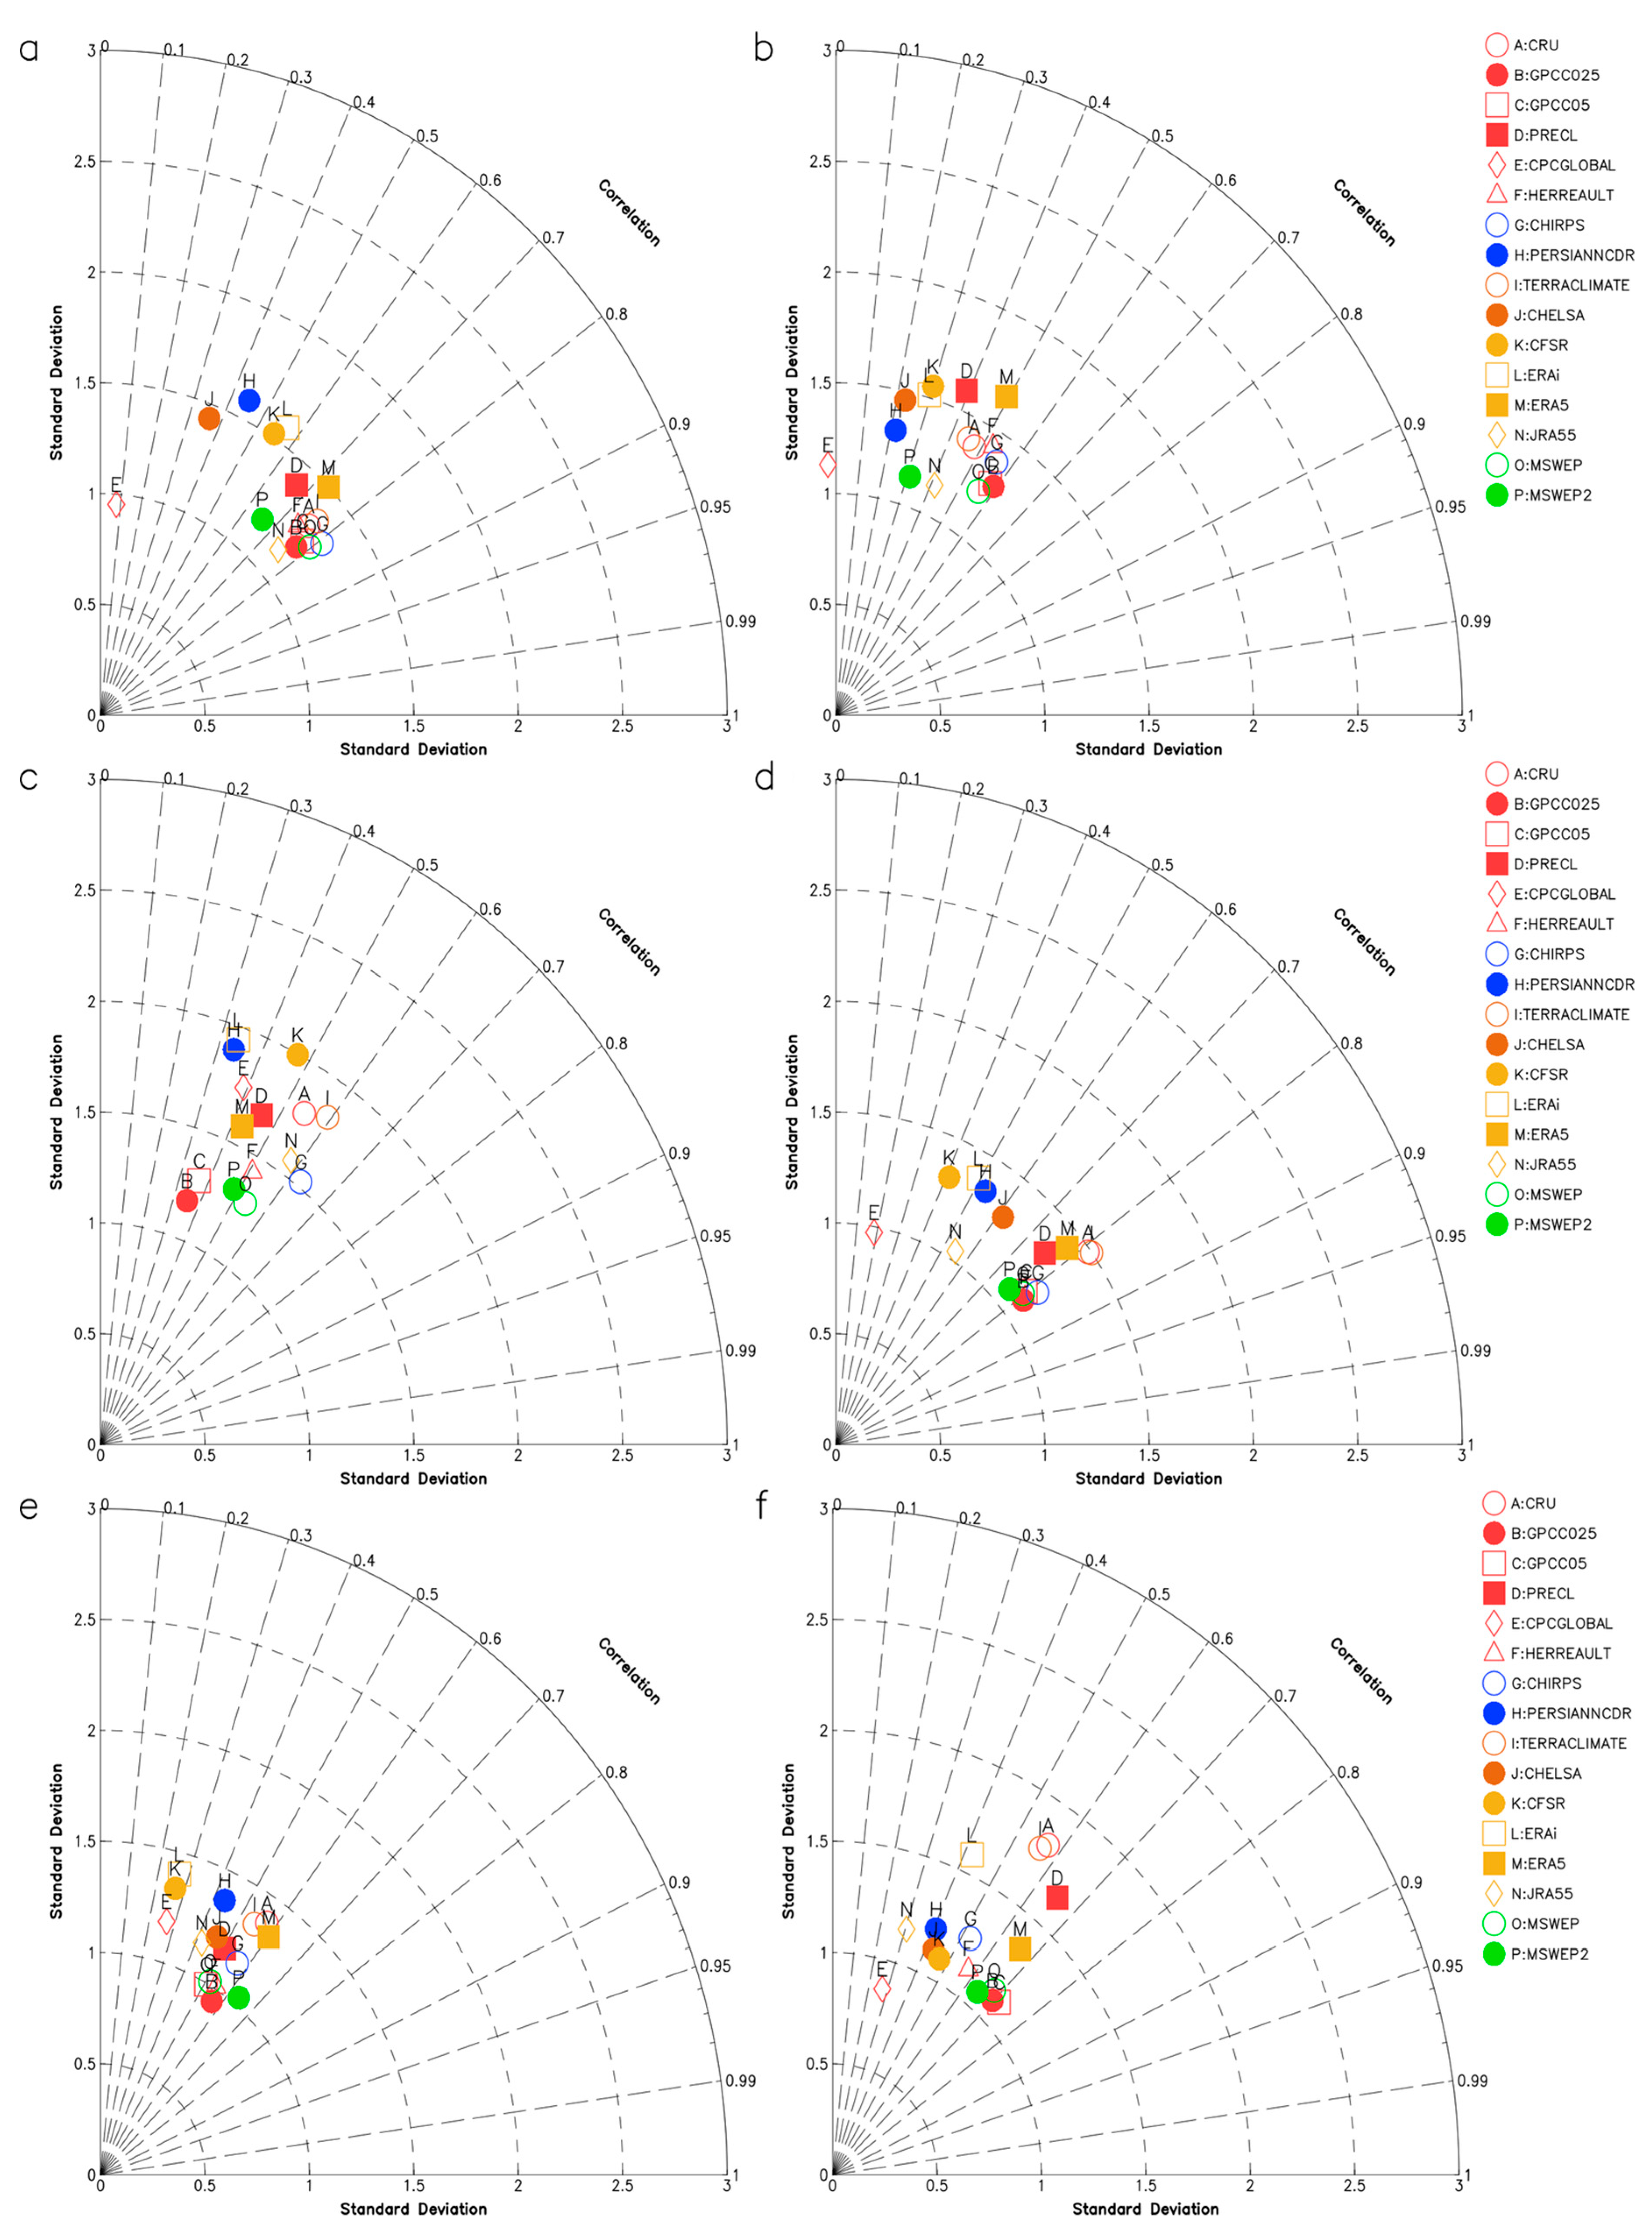
3.1. The Mean Annual Cycle of Precipitation
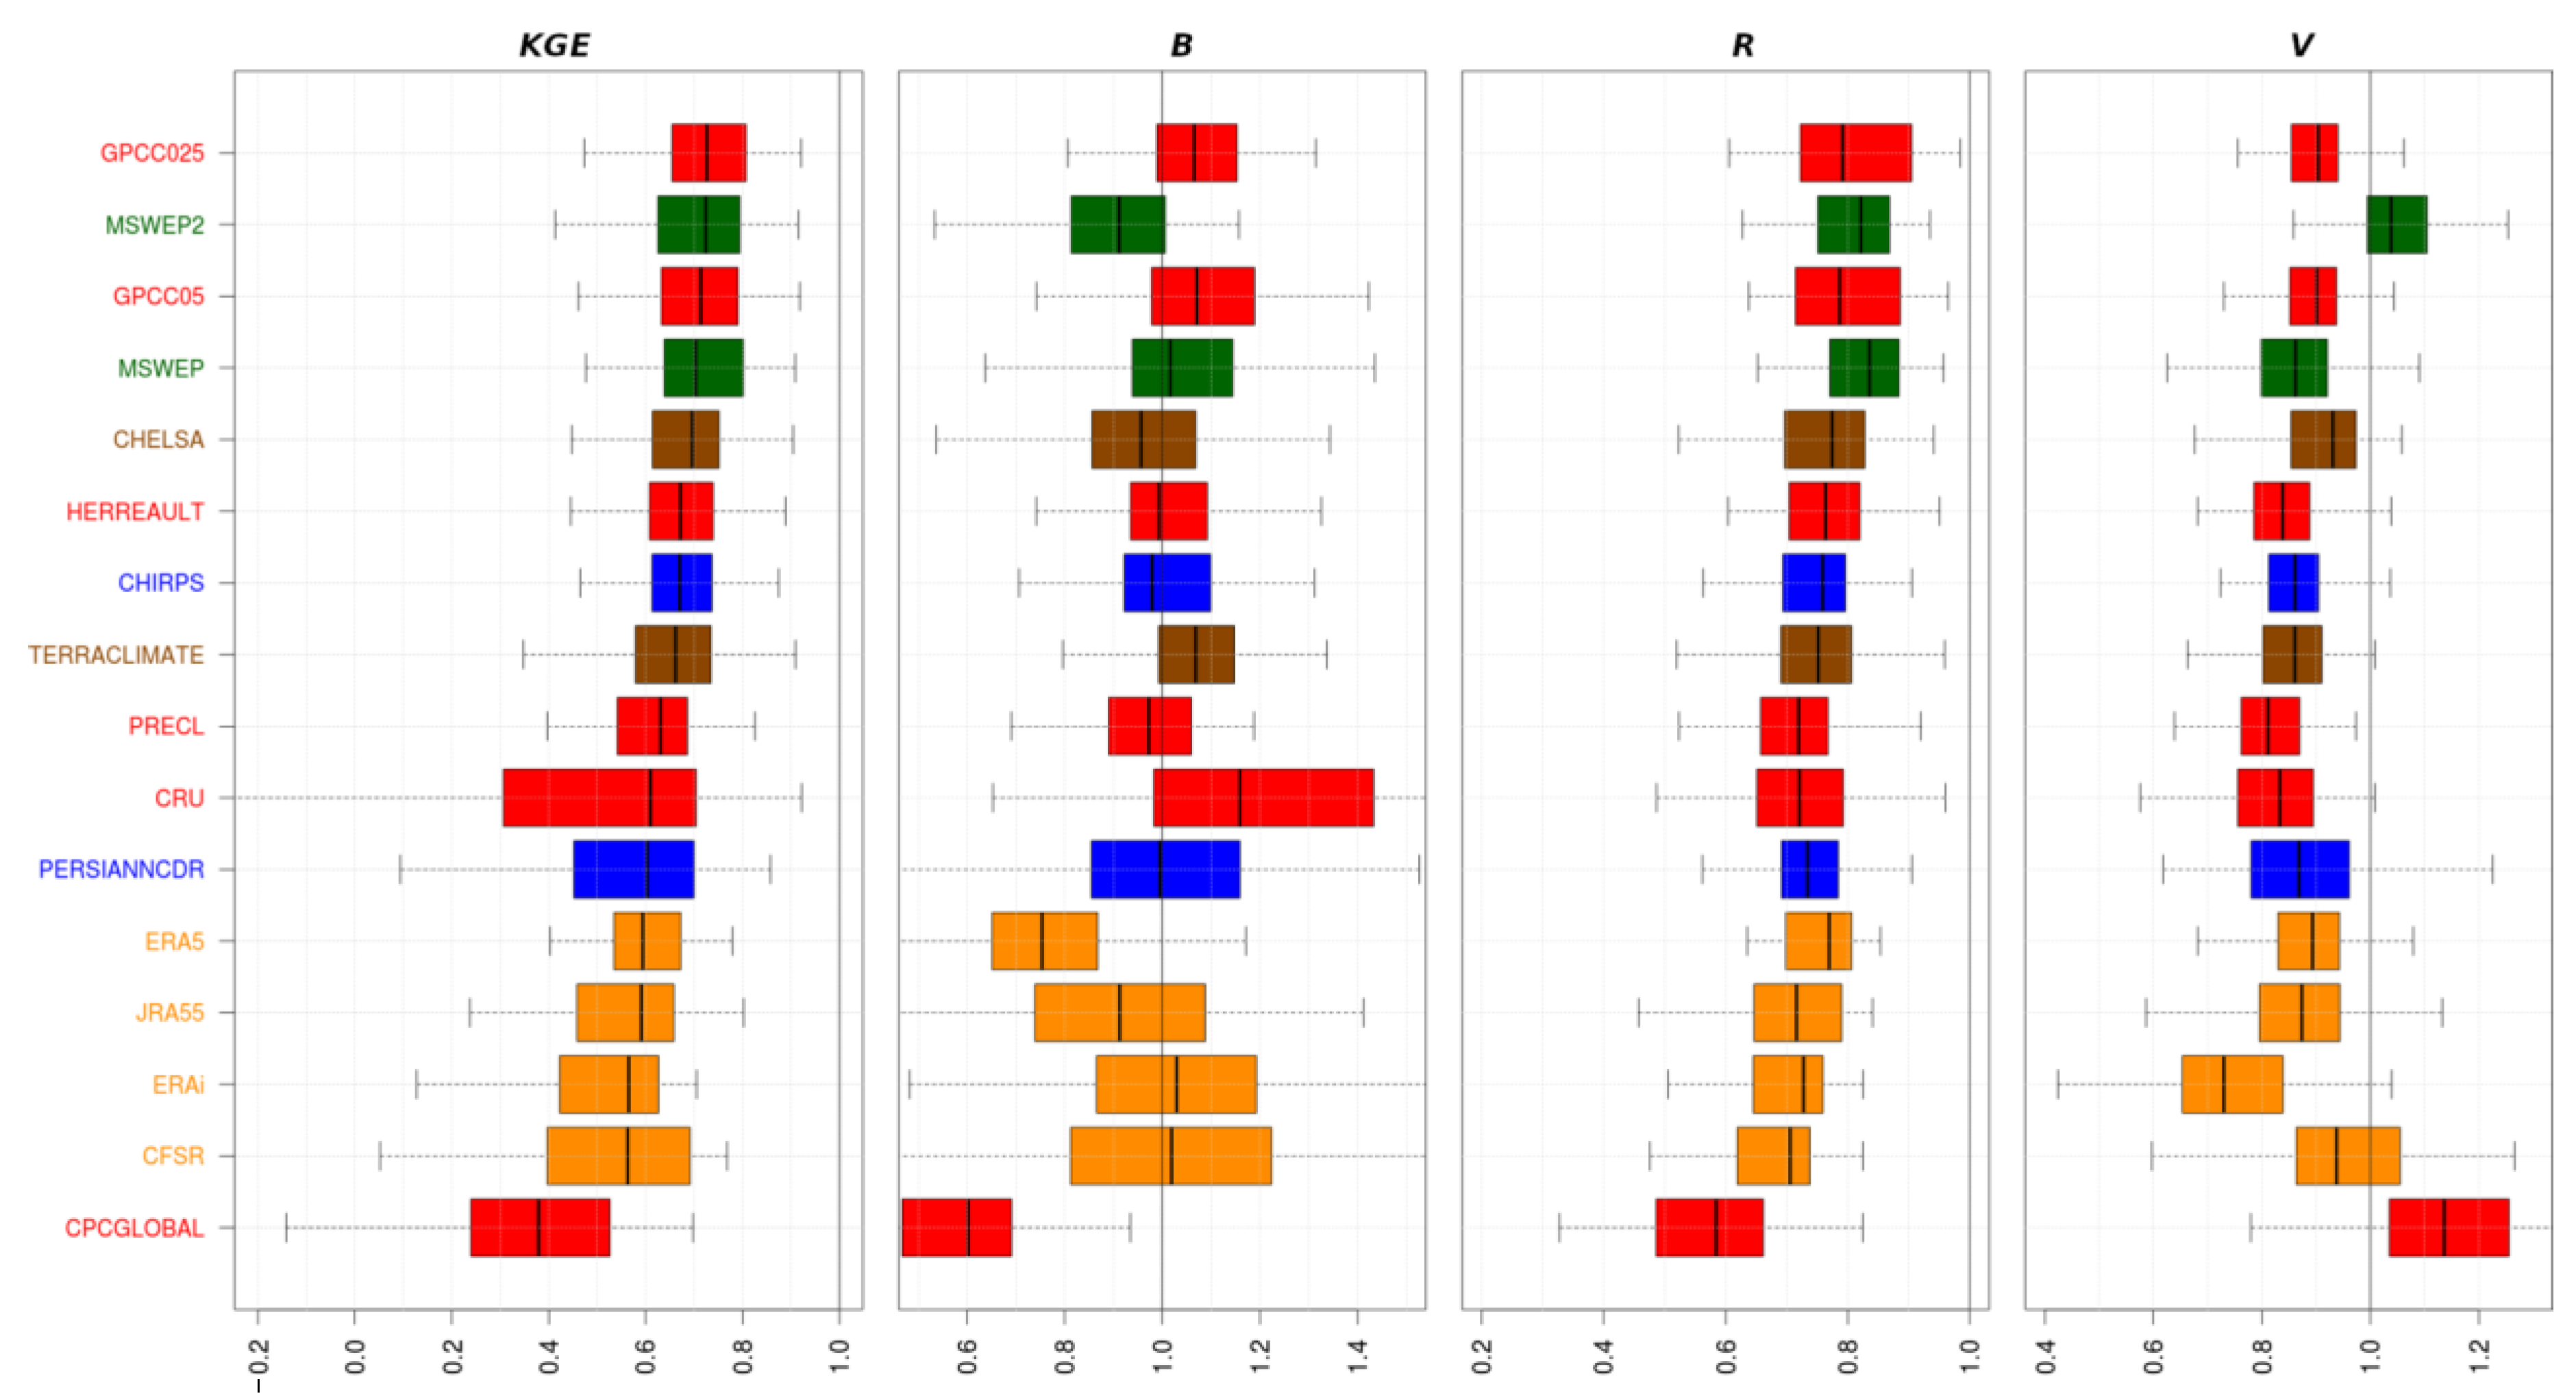
3.2. Evaluation of GPP Based on the Modified Efficiency Index of Kling-Gupta
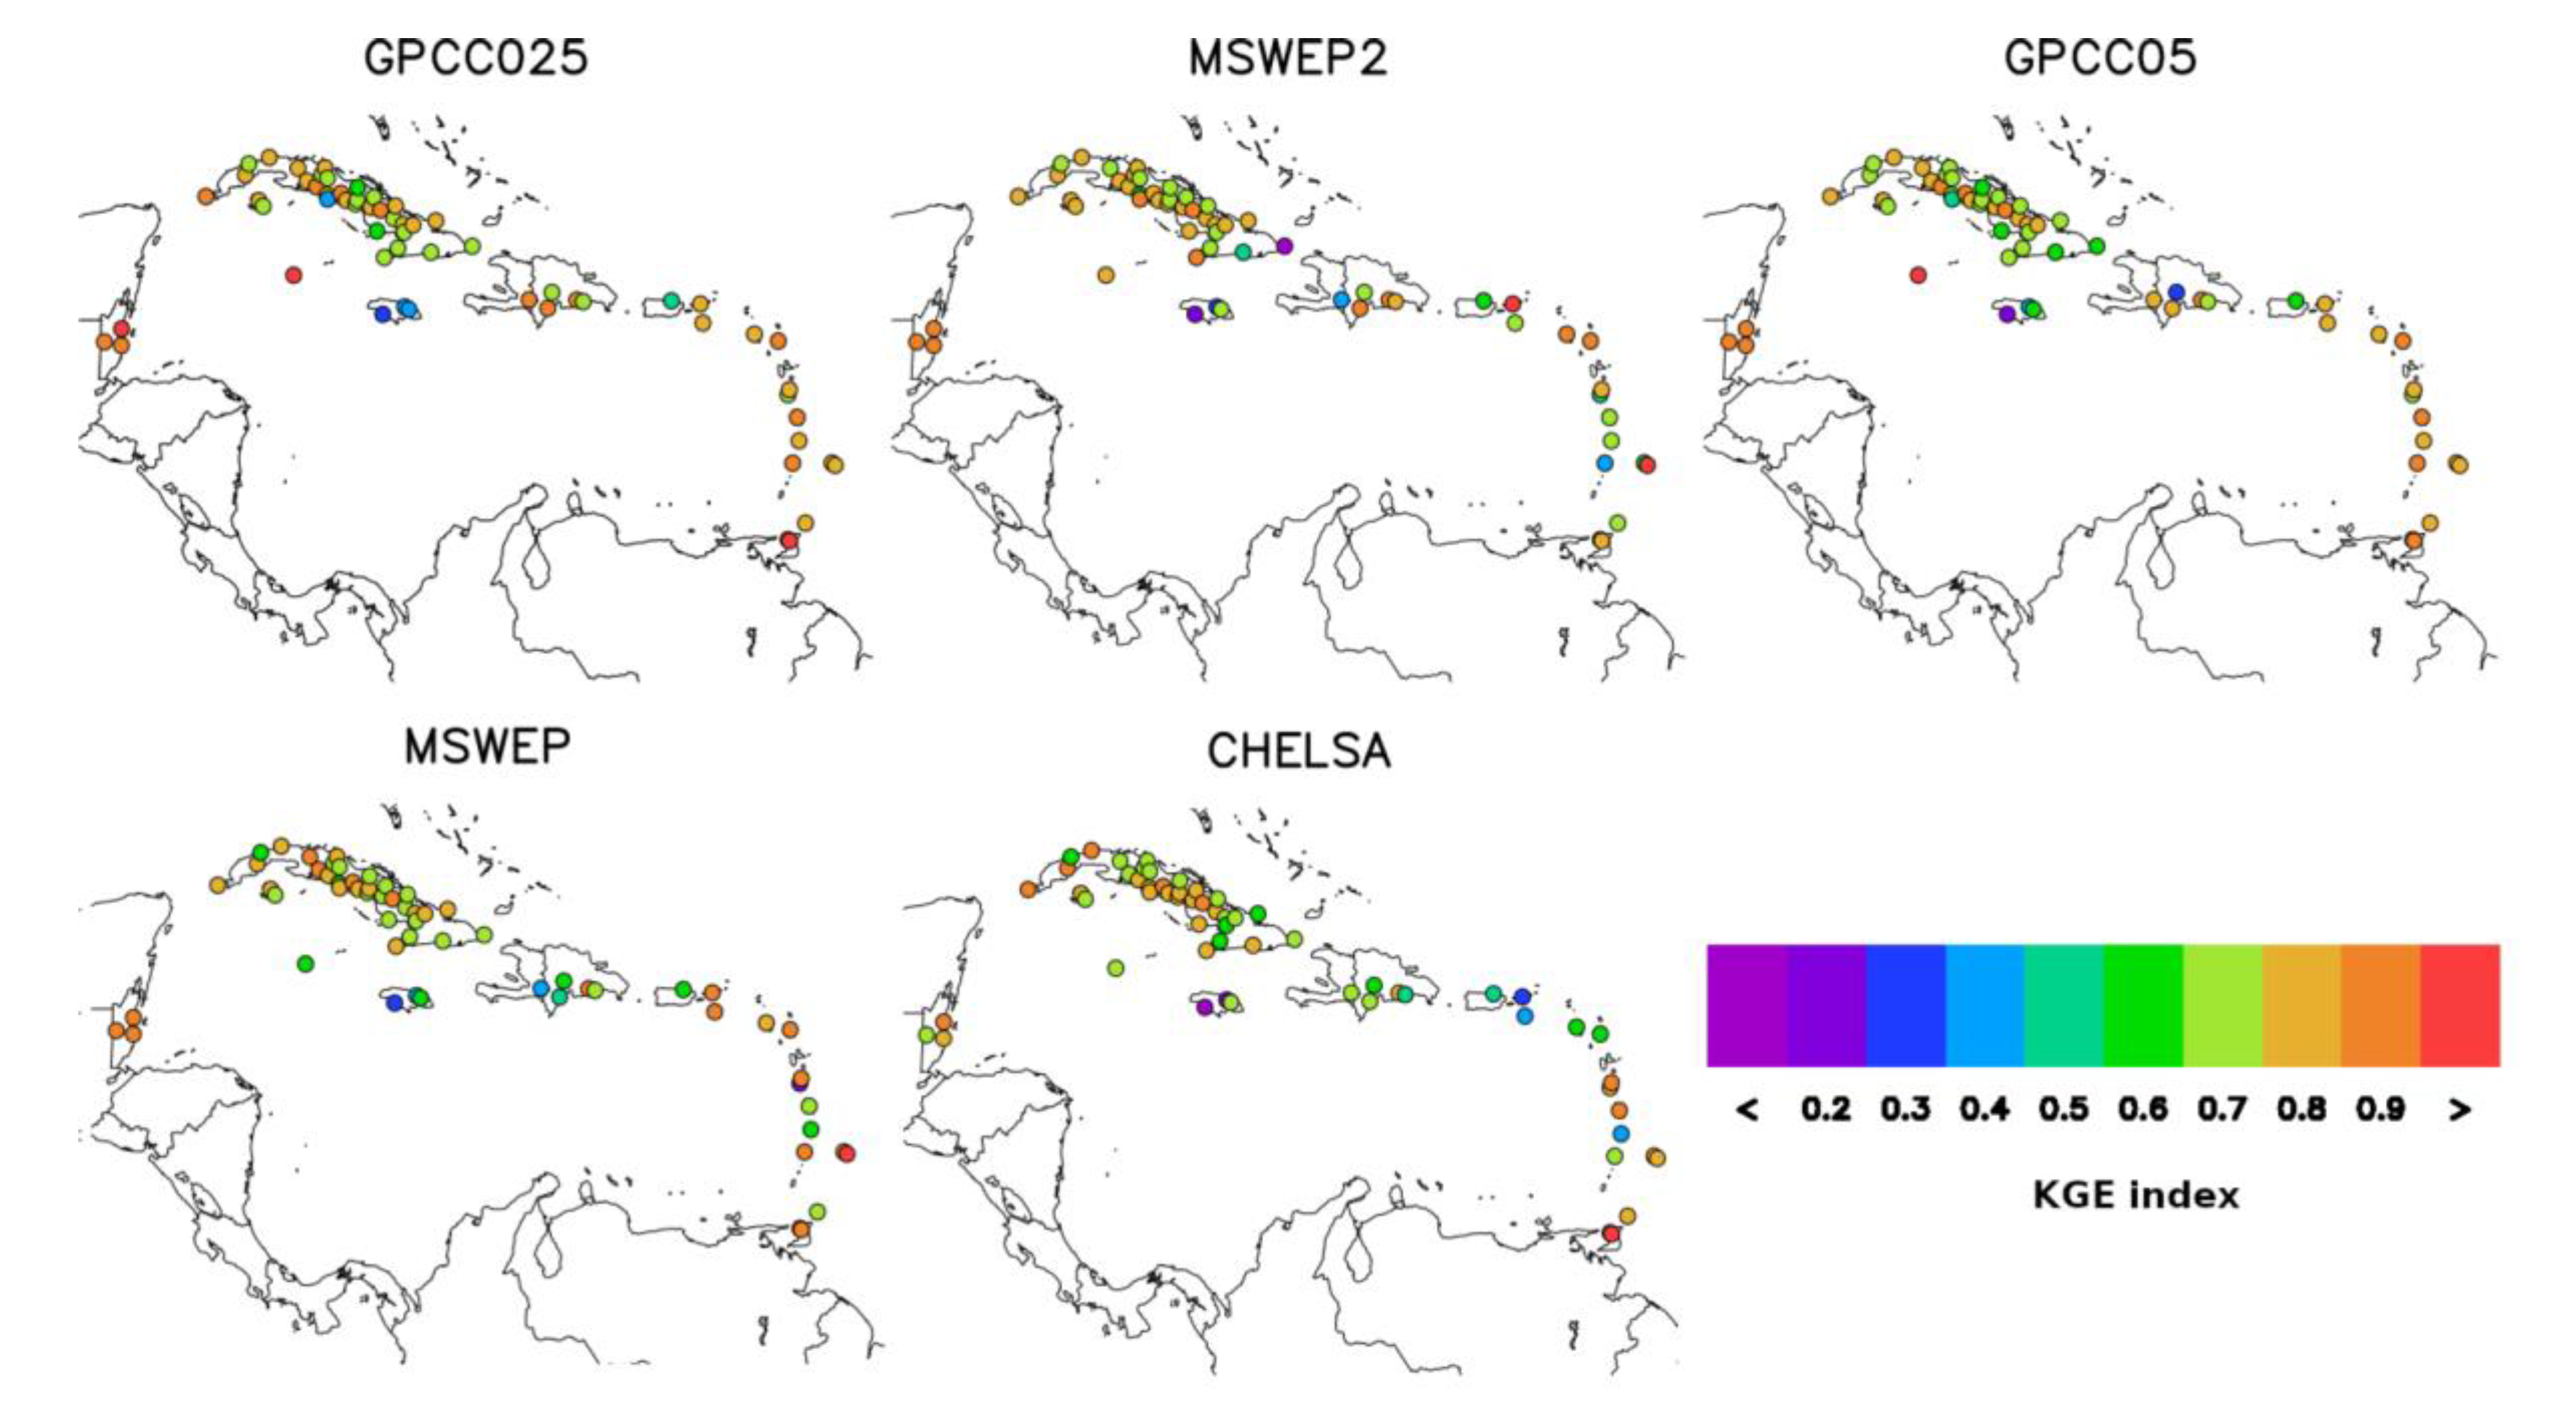
- Based on the KGE index, GPCC025 and GPCC05 (gauge only), MSWEP and MSWEP2 (gauge, satellite, and reanalysis), and CHELSA (gauge and reanalysis) display an overall good performance, including for each season and the whole year. Of the two datasets that merge rain-gauge and satellite information, we find that, at least in our study domain, PERSIANNCDR performs worse than CHIRPS. We suggest that the use of a coarse precipitation dataset (2.5°) such as GPCP [16], possibly reduces the skill of PERSIANNCDR to adequately represent precipitation features in the Caribbean.
- CRU and PRECL datasets are among the station-based products with the lowest performance in representing precipitation variability across the Caribbean. This is likely due to the lower number of surface station taken into account in their development, as compared with other station based GPP such as GPCC025, GPCC05, and HERREAULT.
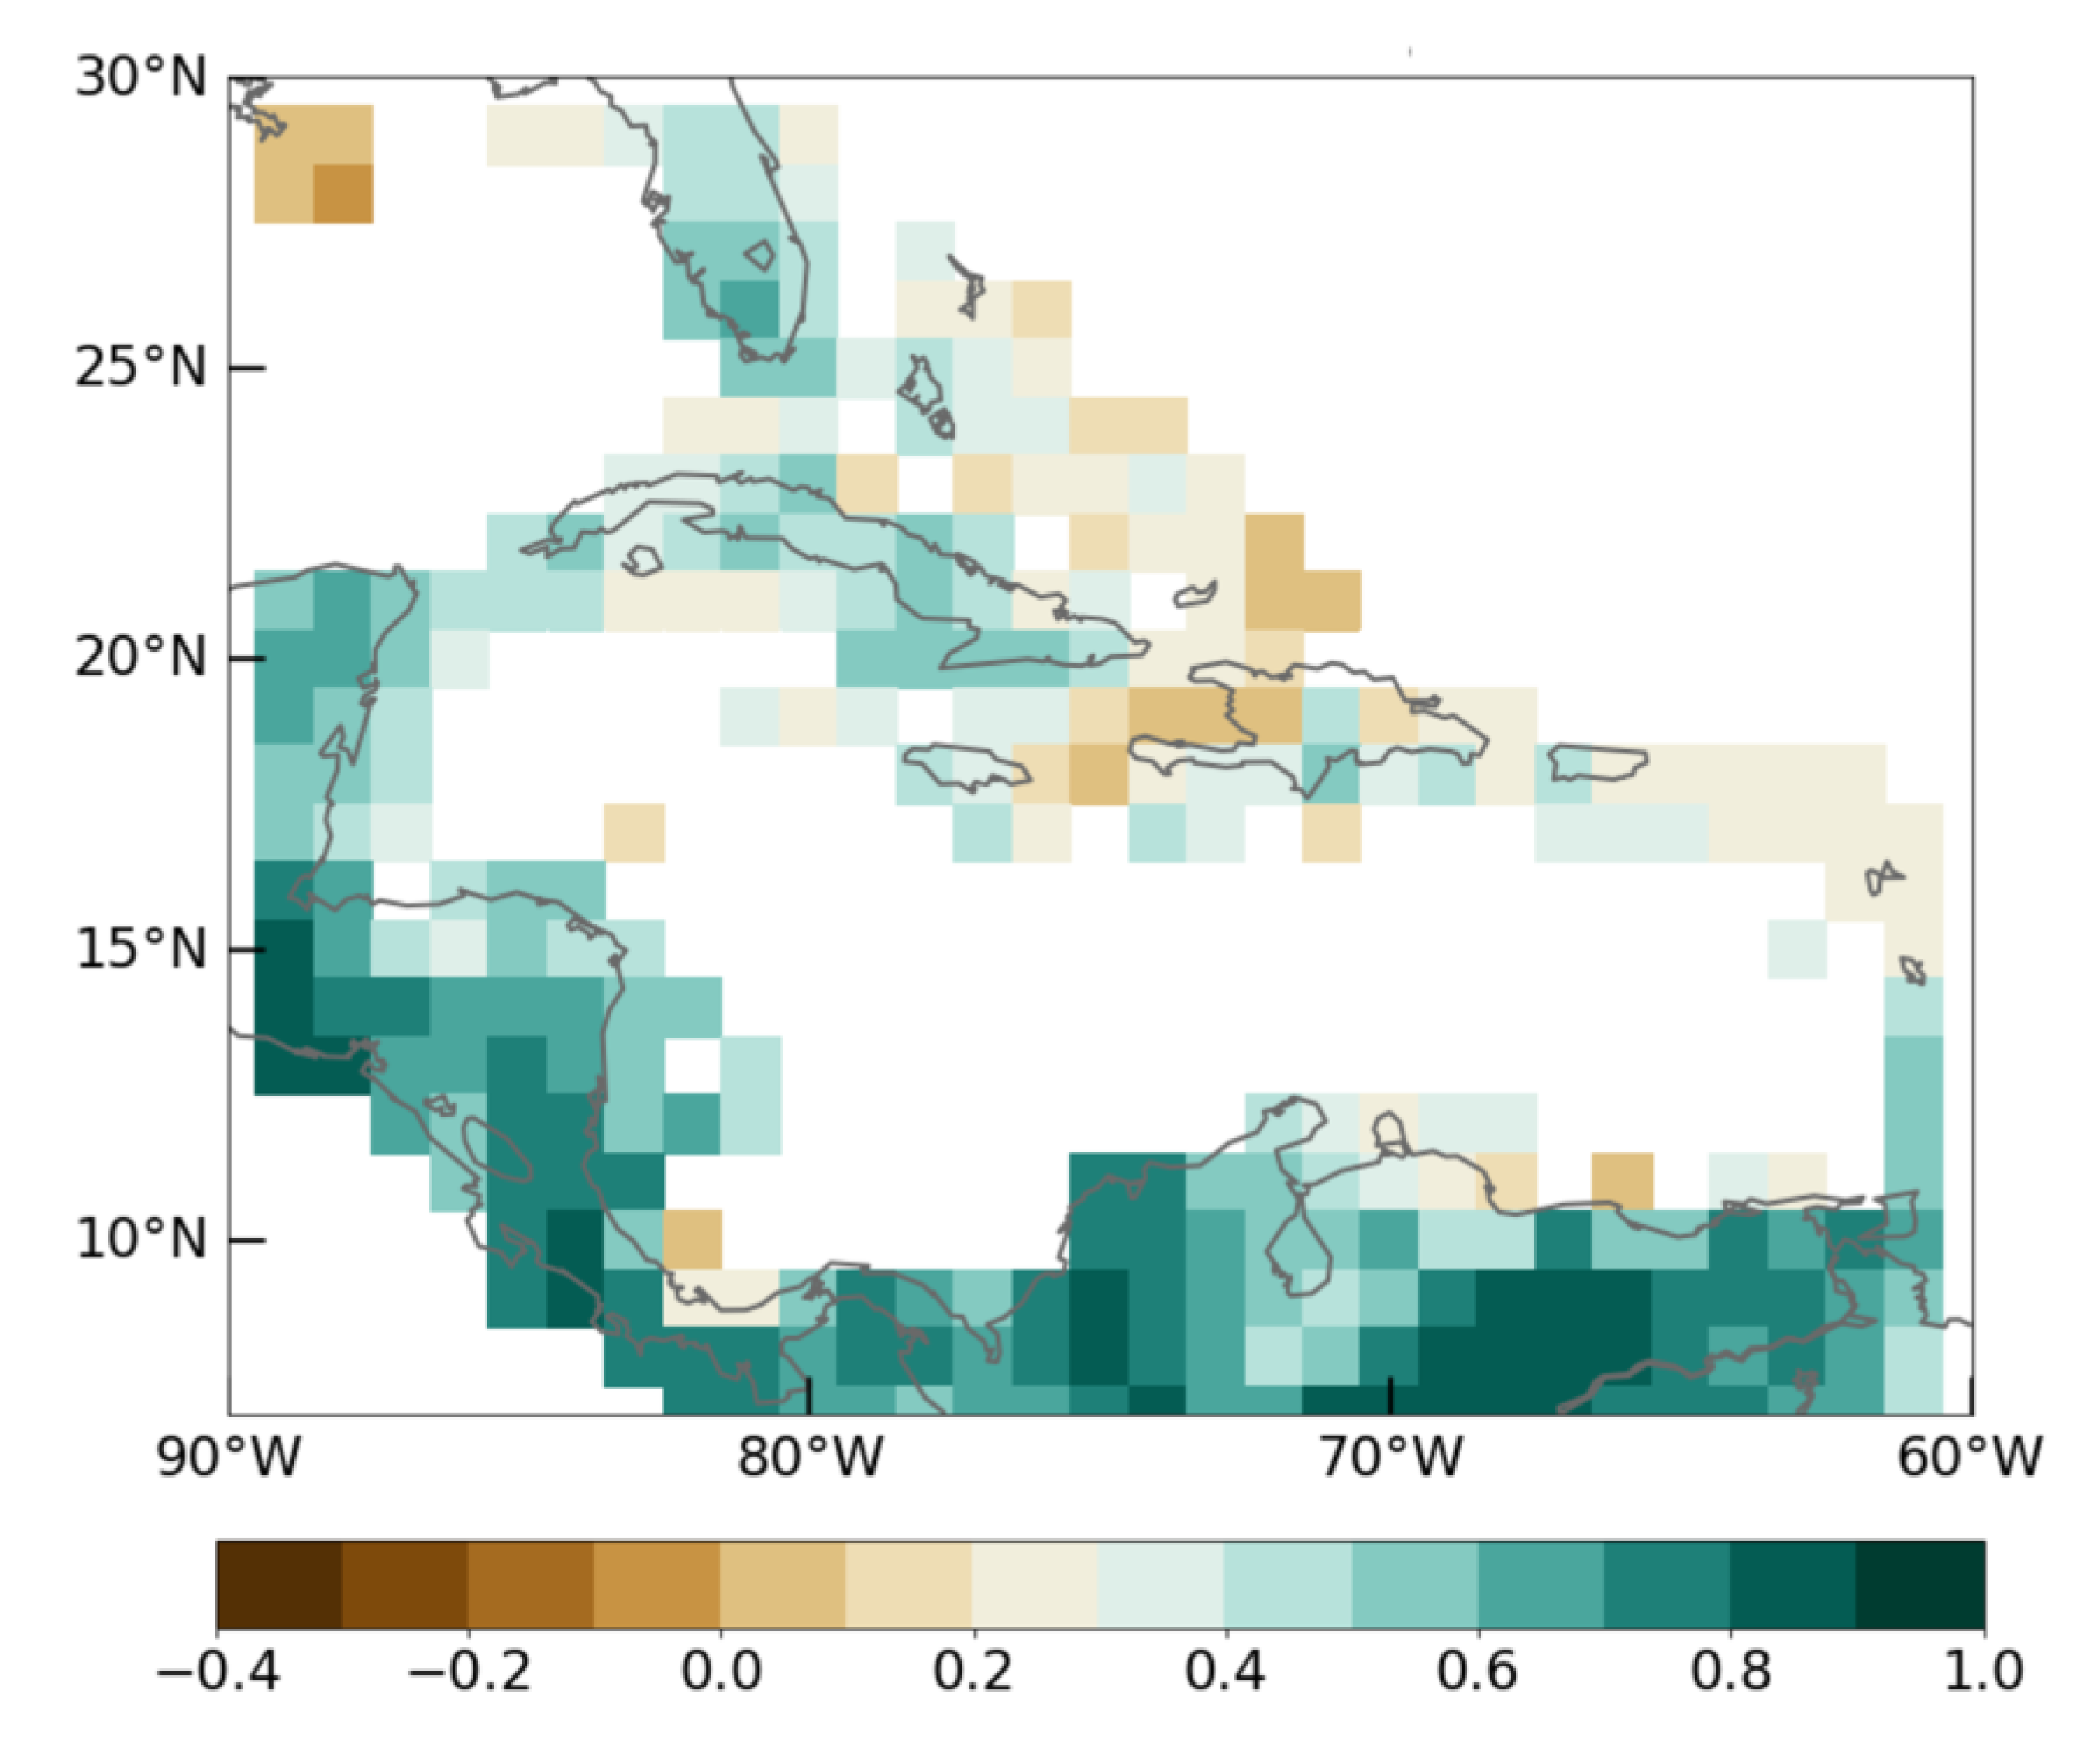
- Although we expected similar performance for HERREAULT as GPCC, considering the former was built upon a GPCC product [32], this was not observed. In this regard, we found significant differences between the GPCC version 7 (used in HERREAULT) and version 8 (evaluated here), as shown by their low correlations over our study domain (Figure 6). This could in part explain the differences in the performance between HERREAULT and the GPCC products used in this paper. Nevertheless, further investigation should be carried out due to the potential to generate a more accurate regional high-resolution product (such as HERREAULT) based on the GPCC full data version 8.
- The lowest KGE scores, suggesting a relatively poor performance, correspond to most reanalyses (except for ERA5) and consistently CPCGLOBAL. The reanalysis products are among the GPP with the lowest performance, which reflects the limitations of the current atmospheric models to represent the fine-scale precipitation processes. This might be due to limitations in representing sub-grid convection and land-surface parameterization schemes. This result also reveals a constraint related to the spatial resolution needed to adequately represent the small islands of the Lesser Antilles. A possible solution to this limitation could be the incorporation of high-resolution, non-hydrostatic, regional models [52].
- Although ERA5 significantly underestimates precipitation across the Caribbean, it is the reanalysis product with the best performance based on the KGE scores. This is seen in the better correlation and variability scores with ground stations. This suggests its potential for use in the development of new GPP products for the Caribbean especially with bias correction techniques employed—which may prove easier than trying to improve the linear correlations [27]. For example, it is hypothesized that the CHELSA product, which was developed based on ERA-Interim [44], may perform even better over the region if using ERA5 instead, which is currently the primary reanalysis model from the ECMWF.
3.3. GPP Evaluation Based on SPI
4. Conclusions
- With respect to the applied methodological approach, we conclude that:
- The combined analysis of the annual precipitation cycle and KGE and SPI metrics, provide a robust and comprehensive understanding of the performance of the considered precipitation products for the Caribbean. While the comparison of the annual precipitation cycles between GPP and observations provided useful preliminary information about the best and worst GPP, the KGE index added a global and objective picture of the GPP abilities by integrating correlation, bias, and variability. At the same time, SPIs gave insights about the GPP skill with respect to other important features of precipitation. For instance, ERA5 was the worst reanalysis product in representing the annual precipitation cycle for the Caribbean, underestimating the total monthly precipitation. However, it performed better than other GPP in the SPI analysis, mainly because of its higher correlation with observations. Similarly, GPP, such as CHELSA or TERRACLIMATE, were among the best for some individual performance indicators (e.g., DF and DE statistics) but did not show similar ability in other ones (e.g., SPIAA moderate and severe (Figure 8b,c)).
- With respect to the annual cycle analysis, we conclude that:
- The analysis of the annual precipitation cycle revealed a high correspondence between GPP and observations across the Caribbean as whole, as well as for the two sub-regions analysed. Features such as the MSD and the maximum of rainfall during November were well represented for the Western and Eastern sub-regions respectively. There was a better performance for the majority of the GPP over the Western Caribbean when compared with the eastern side. This might either be due to the low station density used in the development of these GPP, especially over the Eastern Caribbean, or the inability of the reanalysis products to properly represent the small territories and the precipitation processes that happen on these small land areas. Considering this analysis, we suggest that the best performing products for the whole Caribbean and the sub-regions were the gauge-based GPCC025 and GPCC05 and the gauge and satellite-based CHIRPS.
- With respect to the evaluation based on the KGE index we highlight the following:
- Although correlation has a strong influence in the KGE scoring, it was the worst component captured by the GPP. We suggest that for further improvement or development of GPP for use in the Caribbean, improving correlation should be a primary goal.
- Generally speaking, the reanalysis products were among the lowest-performing GPP group, although some of them performed better than PERSIANCDR (gauge and satellite) and CPCGLOBAL (gauge, satellite, and reanalysis). The lower representativeness of reanalysis suggests deficiencies of atmospheric models to reproduce the small-scale precipitation processes. In this group, ERA5 had the best performance, despite its significant precipitation underestimation. This result calls the attention of the potential users of ERA5 to develop new regional precipitation products by using bias correction or downscaling techniques.
- On the basis of the KGE analysis, GPCC025, GPCC05, MSWEP, and MSWEP2 yielded better results for both annual and seasonal time scales. We suggest that the use of higher surface station density in these GPP highly influenced this outcome, notwithstanding that their development methodologies are different.
- With respect to the evaluation based on SPI, we observe the following:
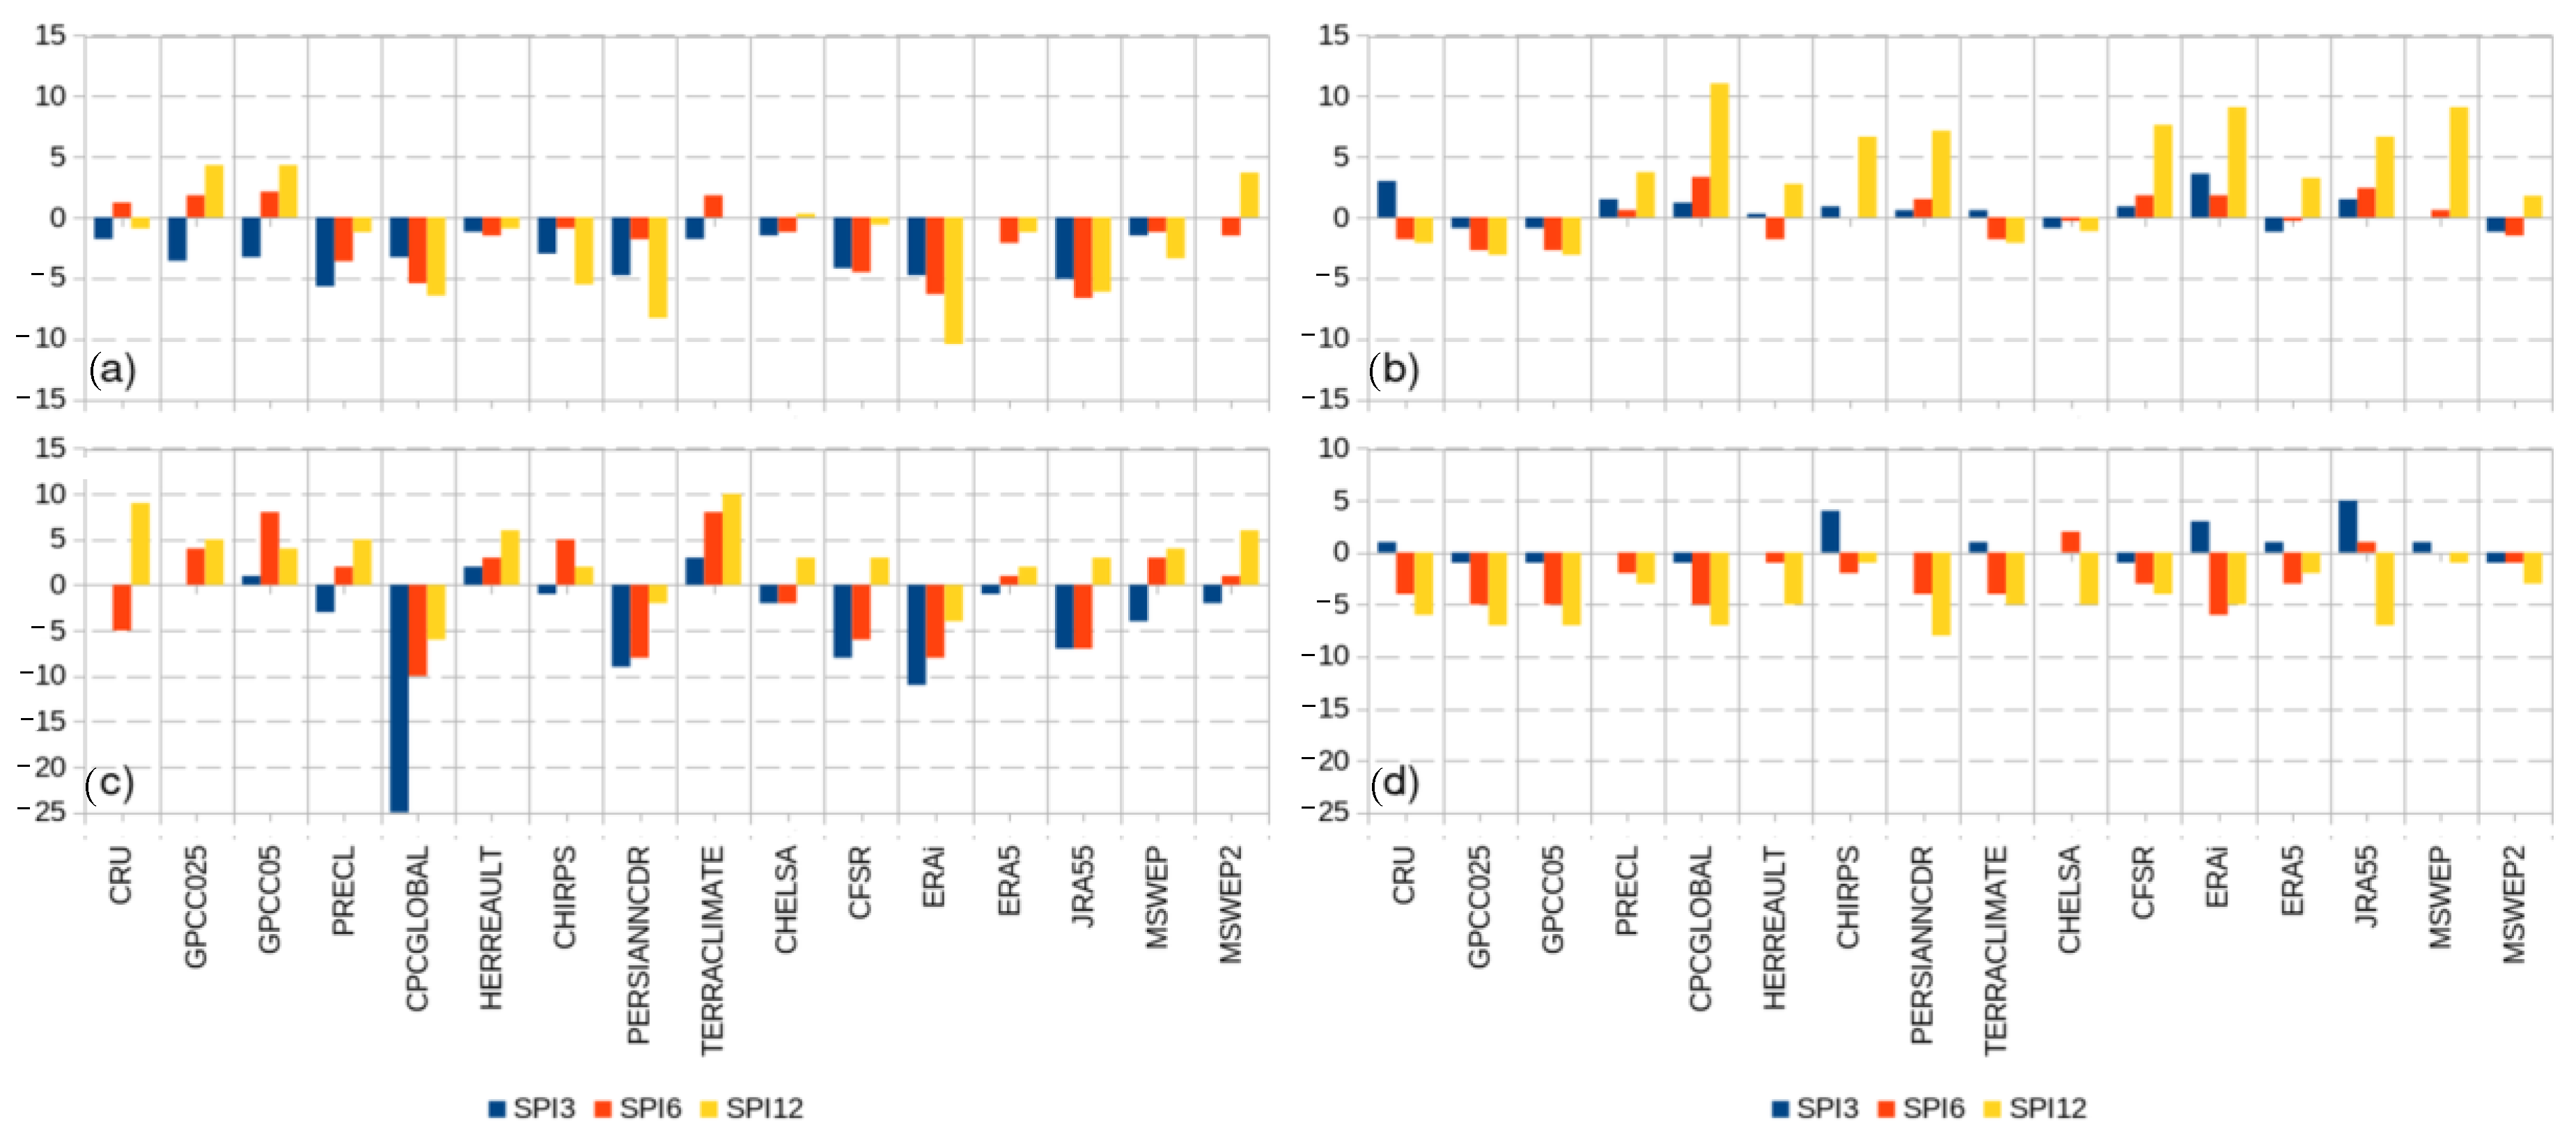
- Overall, the GPP fail in representing accurately the SPI-0.5 statistics, having different ratings for different statistics. The GPP with best performance were MSWEP, MSWEP2, ERA5, and CHELSA. For SPI-1.5, the GPP better resemble the observations with a discernible distinction between the worst and best performers, and a tendency to overestimate the maximum consecutive months with drought and the number of drought events. In general, products such as MSWEP2, ERA5, CHELSA, and MSWEP were the most accurate.
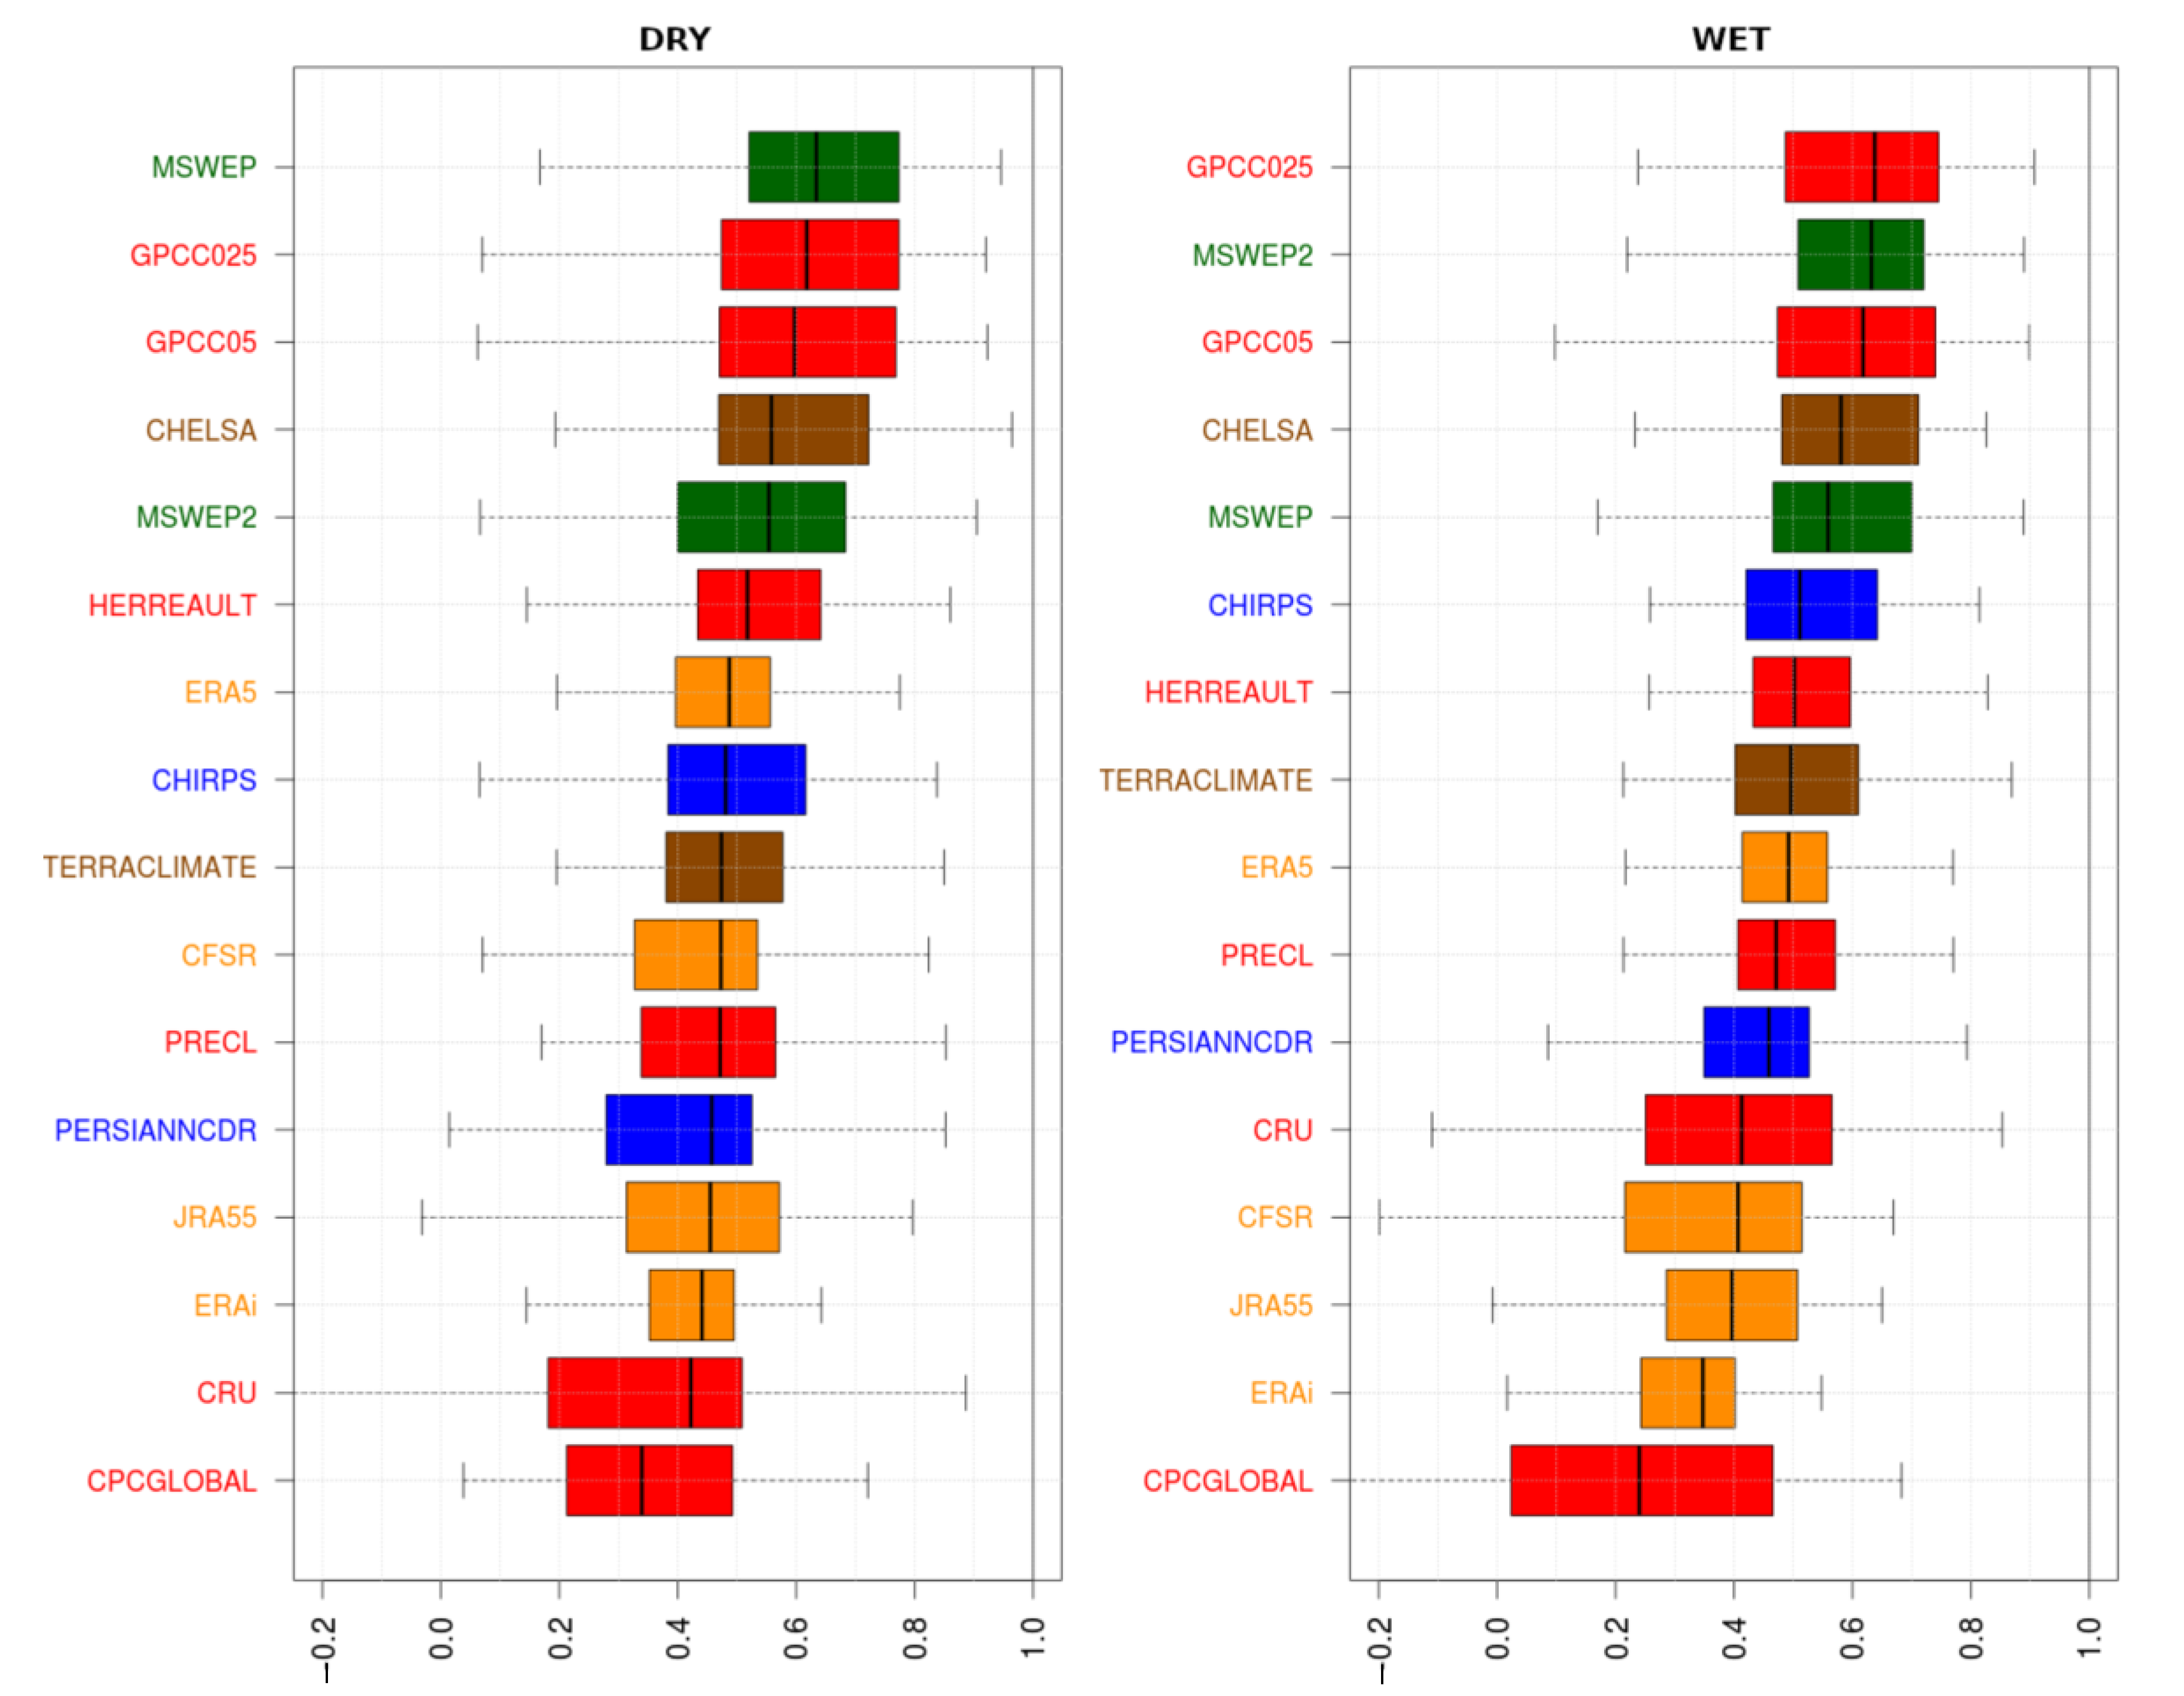
- Considering the areas affected by different SPI categories, all GPP perform better for pluvial conditions than for drought for all SPI lengths. For wet periods, the correlations were higher, and the amplitudes were greater but closer to the observations. The GPCC025, MSWEP, MSWEP2, CHIRPS, and HERREAULT products had the best performance.
- The strategy to explore GPP performance across varying SPI statistics as well as using the temporal variations of the areas affected by pluvial and drought conditions are complementary. This provides a more robust evaluation of the GPP and avoids potential bias in the interpretation of results.
Supplementary Materials
Author Contributions
Funding
Acknowledgments
Conflicts of Interest
Appendix A

| No. | Station Name | Country | Latitude | Longitude | No. | Station Name | Country | Latitude | Longitude |
|---|---|---|---|---|---|---|---|---|---|
| 1 | Central Farm (CAYO) | Belize | 17.1 | −89.0 | 31 | Nuevitas | Cuba | 21.6 | −77.2 |
| 2 | Melinda (STANN Creek) | Belize | 17.0 | −88.3 | 32 | Manzanillo | Cuba | 20.2 | −77.2 |
| 3 | Phillip Goldson International Airport | Belize | 17.5 | −88.3 | 33 | Las Tunas | Cuba | 20.9 | −76.9 |
| 4 | Cabo San Antonio | Cuba | 21.9 | −85.0 | 34 | Jucarito | Cuba | 20.7 | −76.9 |
| 5 | Paso Real de San Diego | Cuba | 22.6 | −83.3 | 35 | Orange | Jamaica | ||
| 6 | Bahía Honda | Cuba | 22.9 | −83.2 | 36 | WorthyPark2 | Jamaica | ||
| 7 | La Fe | Cuba | 21.7 | −82.8 | 37 | La Jíquima | Cuba | 20.9 | −76.5 |
| 8 | Punta del Este | Cuba | 21.6 | −82.5 | 38 | Universidad | Cuba | 20.0 | −75.8 |
| 9 | Casablanca | Cuba | 23.1 | −82.3 | 39 | Punta Lucrecia | Cuba | 21.1 | −75.6 |
| 10 | Owen Robert A. Georgetown | Cayman | 19.3 | −81.4 | 40 | Maisí | Cuba | 20.2 | −74.1 |
| 11 | Jovellanos | Cuba | 22.8 | −81.2 | 41 | Jimaní | Dominican Republic | 18.3 | −71.5 |
| 12 | Aguada de Pasajeros | Cuba | 22.4 | −80.8 | 42 | Barahona | Dominican Republic | 18.2 | −71.1 |
| 13 | Cienfuegos | Cuba | 22.2 | −80.4 | 43 | Padre Las Casas | Dominican Republic | 18.7 | −70.9 |
| 14 | Santo Domingo | Cuba | 22.6 | −80.2 | 44 | Santo Domingo | Dominican Republic | −69.5 | |
| 15 | Sagua la Grande | Cuba | 22.8 | −80.1 | 45 | Las Americas | Dominican Republic | 18.3 | −69.4 |
| 16 | Topes de Collante | Cuba | 21.9 | −80.0 | 46 | San Juan | Puerto Rico | 18.5 | −66.1 |
| 17 | Yabú | Cuba | 22.5 | −80.0 | 47 | St. Thomas | Virgin Islands | 18.3 | −65.0 |
| 18 | Trinidad | Cuba | 21.8 | −80.0 | 48 | St. Croix | Virgin Islands | 17.7 | −64.8 |
| 19 | Sancti Spíritus | Cuba | 22.0 | −79.4 | 49 | National Agricultural Station | St. Kitts | 17.3 | −62.7 |
| 20 | Jibaro | Cuba | 21.7 | −79.2 | 50 | V.C. Bird International Airport | Antigua | 17.1 | −61.5 |
| 21 | Júcaro | Cuba | 21.6 | −78.9 | 51 | St. Augustine | Trinidad & Tobago | 10.6 | −61.4 |
| 22 | Venezuela | Cuba | 21.8 | −78.8 | 52 | Canefield Airport | Dominica | 15.2 | −61.3 |
| 23 | Camilo Cienfuegos | Cuba | 22.2 | −78.8 | 53 | Melville Hall Airport | Dominica | 15.3 | −61.3 |
| 24 | Florida | Cuba | 21.5 | −78.3 | 54 | Piarco | Trinidad & Tobago | 10.6 | −61.3 |
| 25 | Esmeralda | Cuba | 21.8 | −78.1 | 55 | Arnosvale/E.T. Joshua Airport | St. Vincent | 13.1 | −61.2 |
| 26 | Santa Cruz del Sur | Cuba | 20.7 | −78.0 | 56 | Lamentin | Martinique | 14.6 | −61.0 |
| 27 | Camagüey | Cuba | 21.4 | −77.8 | 57 | Hewanorra | St. Lucia | 13.7 | −60.9 |
| 28 | Bsavannah | Jamaica | 58 | Crown Point | Trinidad & Tobago | 11.2 | −60.8 | ||
| 29 | Cabo Cruz | Cuba | 19.8 | −77.7 | 59 | Caribbean Institute for Meteorology and Hidrology | Barbados | 13.2 | −59.6 |
| 30 | Palo Seco | Cuba | 21.1 | −77.3 | 60 | Grantley Adams Airport | Barbados | 13.1 | −59.5 |
References
- Barnett, T.; Zwiers, F.; Hengerl, G.; Allen, M.; Crowly, T.; Gillett, N.; Hasselmann, K.; Jones, P.; Santer, B.; Schnur, R.; et al. Detecting and Attributing External Influences on the Climate System: A Review of Recent Advances. J. Clim. 2005, 18, 1291–1314. [Google Scholar] [CrossRef]
- Ryu, J.H.; Hayhoe, K. Understanding the sources of Caribbean precipitation biases in CMIP3 and CMIP5 simulations. Clim. Dyn. 2014, 42, 3233–3252. [Google Scholar] [CrossRef]
- Hutchinson, M.F. Stochastic space-time weather models from ground-based data. Agric. For. Meteorol. 1995, 73, 237–264. [Google Scholar] [CrossRef]
- Keller, D.E.; Fisher, A.M.; Frei, C.; Liniger, M.A.; Appenzeller, C.; Knutti, R. Stochastic modelling of spatially andtemporally consistent daily precipitationtime-series over complex topography. Hydrol. Earth Syst. Sci. Discuss. 2014, 11, 8737–8777. [Google Scholar] [CrossRef]
- Goovaerts, P. Geostatistical approaches for incorporating elevation into the spatial interpolation of rainfall. J. Hydrol. 2000, 228, 113–129. [Google Scholar] [CrossRef]
- Shen, S.S.; Dzikowski, P.; Li, G.; Griffith, D. Interpolation of 1961–97 Daily Temperature and Precipitation Data onto Alberta Polygons of Ecodistrict and Soil Landscapes of Canada. J. Appl. Meteorol. 2001, 40, 2162–2177. [Google Scholar] [CrossRef] [Green Version]
- Scholze, M.; Knorr, W.; Arnell, N.W.; Prentice, I.C. A climate-change risk analysis for world ecosystems. Proc. Natl. Acad. Sci. USA 2006, 103, 13116–13120. [Google Scholar] [CrossRef] [Green Version]
- Tapiador, F.J.; Turk, F.J.; Petersen, W.; Hou, A.Y.; García-Ortega, E.; Machado, L.A.; Angelis, C.F.; Salio, P.; Kidd, C.; Huffman, G.J.; et al. Global precipitation measurement: Methods, datasets and applications. Atmos. Res. 2012, 104–105, 70–97. [Google Scholar] [CrossRef]
- Adam, J.C.; Lettenmaier, D.P. Adjustment of global gridded precipitation for systematic bias. J. Geophys. Res. Atmos. 2003, 108. [Google Scholar] [CrossRef]
- Villarini, G.; Krajewski, W.F. Sensitivity Studies of the Models of Radar-Rainfall Uncertainties. J. Appl. Meteorol. Climatol. 2010, 49, 288–309. [Google Scholar] [CrossRef]
- Gebremichael, M.; Krajewski, W.F. Modeling distribution of temporal sampling errors in area-time-averaged rainfall estimates. Atmos. Res. 2005, 73, 243–259. [Google Scholar] [CrossRef]
- New, M.; Hulme, M.; Jones, P. Representing Twentieth-Century Space–Time Climate Variability. Part I: Development of a 1961–90 Mean Monthly Terrestrial Climatology. J. Clim. 1999, 12, 829–856. [Google Scholar] [CrossRef]
- Harris, I.C.; Jones, P.D. (2017): CRU TS4.01: Climatic Research Unit (CRU) Time-Series (TS) version 4.01 of high-resolution gridded data of month-by-month variation in climate (Jan. 1901–Dec. 2016). Cent. Environ. Data Anal. 2017. [Google Scholar] [CrossRef]
- Schneider, U.; Becker, A.; Finger, P.; Meyer-Christofferet, A.; Ziese, M.; Rudolf, B. GPCC’s new land surface precipitation climatology based on quality-controlled in situ data and its role in quantifying the global water cycle. Theor. Appl. Climatol. 2014, 115, 15–40. [Google Scholar] [CrossRef] [Green Version]
- Huffman, G.J.; Bolvin, D.T.; Nelkin, E.J.; Wolff, D.B.; Adler, R.F.; Gu, G.; Stocker, E.F. The TRMM multisatellite precipitation analysis (TMPA): Quasi-global, multiyear, combined-sensor precipitation estimates at fine scales. J. Hydrometeorol. 2007, 8, 38–55. [Google Scholar] [CrossRef]
- Ashouri, H.; Hsu, K.L.; Sorooshian, S.; Braithwaite, D.K.; Knapp, K.R.; Cecil, L.D.; Nelson, B.R.; Prat, O.P. PERSIANN-CDR: Daily Precipitation Climate Data Record from Multisatellite Observations for Hydrological and Climate Studies. Bull. Am. Meteorol. Soc. 2015, 96, 69–83. [Google Scholar] [CrossRef] [Green Version]
- Funk, C.; Peterson, P.; Landsfeld, M.; Pedreros, D.; Verdin, J.; Shukla, S.; Husak, G.; Rowland, J.; Harrison, L.; Hoell, A.; et al. The climate hazards infrared precipitation with stations—A new environmental record for monitoring extremes. Sci. Data 2015, 2. [Google Scholar] [CrossRef] [Green Version]
- Beck, H.E.; Van Dijk, A.I.; Levizzani, V.; Schellekens, J.; Gonzalez Miralles, D.; Martens, B.; De Roo, A. MSWEP: 3-hourly 0.25° global gridded precipitation (1979–2015) by merging gauge, satellite, and reanalysis data. Hydrol. Earth Syst. Sci. 2017, 21. [Google Scholar] [CrossRef] [Green Version]
- Sapiano, M.R.P.; Arkin, P.A. An Intercomparison and Validation of High-Resolution Satellite Precipitation Estimates with 3-Hourly Gauge Data. J. Hydrometeorol. 2009, 10, 149–166. [Google Scholar] [CrossRef]
- Negrón Juárez, R.I.; Li, W.; Fu, R.; Fernandes, K.; de Oliveira Cardoso, A. Comparison of precipitation data sets over the tropical South American and African continents. J. Hydrometeorol. 2009, 10, 289–299. [Google Scholar] [CrossRef]
- Cattani, E.; Merino, A.; Levizzani, V. Evaluation of Monthly Satellite-Derived Precipitation Products over East Africa. J. Hydrometeorol. 2016, 17, 2555–2573. [Google Scholar] [CrossRef]
- Kidd, C.; Bauer, P.; Turk, J.; Huffman, G.J.; Joyce, R.; Hsu, K.L.; Braithwaite, D. Intercomparison of High-Resolution Precipitation Products over Northwest Europe. J. Hydrometeorol. 2012, 13, 67–83. [Google Scholar] [CrossRef] [Green Version]
- Faiz, M.A.; Liu, D.; Fu, Q.; Sun, Q.; Li, M.; Baig, F.; Li, T.; Cui, S. How accurate are the performances of gridded precipitation data products over Northeast China? Atmos. Res. 2018, 211, 12–20. [Google Scholar] [CrossRef]
- Beck, H.E.; Wood, E.F.; Pan, M.; Fisher, C.K.; Miralles, D.G.; Van Dijk, A.I.J.M.; McVicar, T.R.; Adler, R.F. MSWep v2 Global 3-hourly 0.1° precipitation: Methodology and quantitative assessment. Bull. Am. Meteorol. Soc. 2019, 100, 473–500. [Google Scholar] [CrossRef] [Green Version]
- Vila, D.A.; De Goncalves, L.G.G.; Toll, D.L.; Rozante, J.R. Statistical Evaluation of Combined Daily Gauge Observations and Rainfall Satellite Estimates over Continental South America. J. Hydrometeorol. 2009, 10, 533–543. [Google Scholar] [CrossRef]
- Scheel, M.L.M.; Rohrer, M.; Huggel, C.; Villar, D.S.; Silvestre, E.; Huffman, G.J. Evaluation of TRMM Multi-satellite Precipitation Analysis (TMPA) performance in the Central Andes region and its dependency on spatial and temporal resolution. Hydrol. Earth Syst. Sci. 2011, 15, 2649–2663. [Google Scholar] [CrossRef] [Green Version]
- Zambrano-Bigiarini, M.; Nauditt, A.; Birkel, C.; Verbist, K.; Ribbe, L. Temporal and spatial evaluation of satellite-based rainfall estimates across the complex topographical and climatic gradients of Chile. Hydrol. Earth Syst. Sci. 2017, 21, 1295–1320. [Google Scholar] [CrossRef] [Green Version]
- Jury, M.R. An Intercomparison of Observational, Reanalysis, Satellite, and Coupled Model Data on Mean Rainfall in the Caribbean. J. Hydrometeorol. 2009, 10, 413–430. [Google Scholar] [CrossRef]
- Jones, P.D.; Harpham, C.; Harris, I.; Goodess, C.M.; Burton, A.; Centella-Artola, A.; Taylor, M.A.; Bezanilla-Morlot, A.; Campbell, J.D.; Stephenson, T.S.; et al. Long-term trends in precipitation and temperature across the Caribbean. Int. J. Climatol. 2016, 36, 3314–3333. [Google Scholar] [CrossRef] [Green Version]
- Campbell, J.D.; Taylor, M.A.; Stephenson, T.S.; Watson, R.A.; Whyte, F.S. Future climate of the Caribbean from a regional climate model. Int. J. Clim. 2011, 31, 1866–1878. [Google Scholar] [CrossRef]
- Centella-Artola, A.; Taylor, M.A.; Bezanilla-Morlot, A.; Martinez-Castro, D.; Campbell, J.D.; Stephenson, T.S.; Vichot, A. Assessing the effect of domain size over the Caribbean region using the PRECIS regional climate model. Clim. Dyn. 2015, 44, 1901–1918. [Google Scholar] [CrossRef]
- Herrera, D.; Ault, T. Insights from a new high-resolution drought Atlas for the Caribbean spanning 1950–2016. J. Clim. 2017, 30, 7801–7825. [Google Scholar] [CrossRef]
- Taylor, M.A.; Enfield, D.B.; Chen, A.A. Influence of the tropical Atlantic versus the tropical Pacific on Caribbean rainfall. J. Geophys. Res. Ocean. 2002, 107, 10–14. [Google Scholar] [CrossRef] [Green Version]
- Stennett-Brown, R.K.; Stephenson, T.S.; Taylor, M.A. Caribbean climate change vulnerability: Lessons from an aggregate index approach. PLoS ONE 2019, 14, e0219250. [Google Scholar] [CrossRef] [PubMed] [Green Version]
- Magaña, V.; Amador, J.A.; Medina, S. The Midsummer Drought over Mexico and Central America. J. Clim. 1999, 12, 1577–1588. [Google Scholar] [CrossRef]
- Izzo, M. Analisi del clima e delle dinamiche climatiche nella Repubblica Dominicana e delle relative influenze sul territorio. Ph.D. Thesis, University of Molise, Campobasso, Italy, 2011; 162p. [Google Scholar]
- Stennett-Brown, R.K.; Jones, J.J.; Stephenson, T.S.; Taylor, M.A. Future Caribbean temperature and rainfall extremes from statistical downscaling. Int. J. Clim. 2017, 37, 4828–4845. [Google Scholar] [CrossRef]
- Xie, P.; Chen, M.; Shi, W. CPC global unified gauge-based analysis of daily precipitation. In Proceedings of the 24th Conference on Hydrology, Atlanta, GA, USA, 16–21 January 2010. [Google Scholar]
- Chen, M.; Xie, P.; Janowiak, J.E.; Arkin, P.A. Global land precipitation: A 50-yr monthly analysis based on gauge observations. J. Hydrometeorol. 2002, 3, 249–266. [Google Scholar] [CrossRef]
- Schneider, U.; Becker, A.; Finger, P.; Meyer-Christoffer, A.; Ziese, M. GPCC Full Data Monthly Product Version 7.0 at 0.5°: Monthly Land-Surface Precipitation from Rain-Gauges built on GTS-based and Historic Data. Offenbach/GERMANY. Glob. Precip. Climatol. Cent. 2015. [Google Scholar] [CrossRef]
- Abatzoglou, J.T.; Dobrowski, S.Z.; Parks, S.A.; Hegewisch, K.C. TerraClimate, a high-resolution global dataset of monthly climate and climatic water balance from 1958–2015. Sci. Data 2018, 5, 170191. [Google Scholar] [CrossRef] [Green Version]
- Karger, D.N.; Conrad, O.; Böhner, J.; Kawohl, T.; Kreft, H.; Soria-Auza, R.W.; Zimmermann, N.E.; Linder, H.P.; Kessler, M. Climatologies at high resolution for the earth’s land surface areas. Sci. Data 2017, 4, 170122. [Google Scholar] [CrossRef] [Green Version]
- Saha, S.; Moorthi, S.; Wu, X.; Wang, J.; Nadiga, S.; Tripp, P.; Behringer, D.; Hou, Y.T.; Chuang, H.Y.; Iredell, M.; et al. The NCEP Climate Forecast System Version 2. J. Clim. 2014, 27, 2185–2208. [Google Scholar] [CrossRef]
- Dee, D.P.; Uppala, S.M.; Simmons, A.J.; Berrisford, P.; Poli, P.; Kobayashi, S.; Andrae, U.; Balmaseda, M.A.; Balsamo, G.; Bauer, D.P.; et al. The ERA-Interim reanalysis: Configuration and performance of the data assimilation system. Q. J. R. Meteorological. Soc. 2011, 137, 553–597. [Google Scholar] [CrossRef]
- Copernicus Climate Change Service (C3S). ERA5: Fifth Generation of ECMWF Atmospheric Reanalyses of the Global Climate. Copernicus Climate Change Service Climate Data Store (CDS). 2017. Available online: https://cds.climate.copernicus.eu/cdsapp#!/home (accessed on 4 December 2019).
- Kobayashi, S.; Ota, Y.; Harada, Y.; Ebita, A.; Moriya, M.; Onoda, H.; Onogi, K.; Kamahori, H.; Kobayashi, C.; Endo, H.; et al. The JRA-55 Reanalysis: General specifications and basic characteristics. J. Meteor. Soc. 2015, 93, 5–48. [Google Scholar] [CrossRef] [Green Version]
- Kling, H.; Fuchs, M.; Paulin, M. Runoff conditions in the upper Danube basin under an ensemble of climate change scenarios. J. Hydrol. 2012, 424–425, 264–277. [Google Scholar] [CrossRef]
- McKee, T.B.; Doesken, N.J.; Kleist, J. The relationship of drought frequency and duration to time scales. In Proceedings of the Eighth Conference on Applied Climatology. Am. Meteorol. Soc. 1993, 17, 179–184. [Google Scholar]
- Edwards, D.C.; McKee, T.B. Characteristics of 20th Century Drought in the United States at Multiple Time Scales. 1997. Available online: http://hdl.handle.net/10217/170176 (accessed on 5 June 2020).
- WMO. Stantardized Precipitation Index. User Guide. Geneva, Switzerland 2012. Available online: https://public.wmo.int/en/resources/library/standardized-precipitation-index-user-guide (accessed on 5 June 2020).
- Centella, A.; Bezanilla, A.; Vichot, A.; Silva, M. CARiDRO the Caribbean Assessment Regional Drought Tool: Case Study Report 1 of the CARIWIG Project. 2017. Available online: https://cdkn.org/wp-content/uploads/2013/01/Cariwig-case-study-final-report-caridro-drought.pdf (accessed on 9 March 2020).
- Kendon, E.J.; Roberts, N.M.; Senior, C.A.; Roberts, M.J. Realism of Rainfall in a Very High-Resolution Regional Climate Model. J. Clim. 2012, 25, 5791–5806. [Google Scholar] [CrossRef]


| No | Abbreviation | Sources | Full Name | Spatial Resolution | Temporal Coverage | References |
|---|---|---|---|---|---|---|
| 1 | CRU | G | Climatic Research Unit (CRU) Time-Series (CRUTS4.01) | 0.5° (land) | 1901–2016 | [13] |
| 2 | CPCGlobal | G | Climate Prediction Center (CPC) Unified | 0.5° (land) | 1979–present | [38] |
| 3 | PRECL | G | PRECipitation REConstruction over Land (PREC/L) | 0.5° (land) | 1948–present | [39] |
| 4 | GPCC05 | G | Global Precipitation Climatology Centre (GPCC) Full Data Reanalysis | 0.5° (land) | 1891–2016 | [40] |
| 5 | GPCC025 | G | Global Precipitation Climatology Centre (GPCC) Full Data Reanalysis | 0.25° (land) | 1891–2016 | [40] |
| 6 | HERREAULT | G | High resolution Regional statistical downscaled GPCC v7 for the Caribbean | 0.033° (land) | 1950–2017 | [32] |
| 7 | CHIRPS | G,S | Climate Hazards group Infrared Precipitation with Stations (CHIRPS) | 0.05° (land) | 1981–present | [17] |
| 8 | PERSIANNCDR | G,S | Precipitation Estimation from Remotely Sensed Information using Artificial Neural Networks (PERSIANN) Climate Data Record (CDR) PERSIANN-CDR | 0.25° | 1983–present | [16] |
| 9 | TERRACLIMATE | G,R | High-resolution global dataset of monthly climate and climatic water balance from 1958–2015 | 0.0416° (land) | 1958–2015 | [41] |
| 10 | CHELSA | G,R | Climatologies at high resolution for the earth’s land surface areas | 0.0083° (land) | 1979–2013 | [42] |
| 11 | CFSR | R | National Centers for Environmental Prediction (NCEP) Climate Forecast System Reanalysis (CFSR) | 0.3125° | 1979–2010 | [43] |
| 12 | ERAi | R | European Center for Medium-range Forecast Reanalysis Interim (ERA-Interim) | 0.25° | 1979–2017 | [44] |
| 13 | ERA5 | R | European Center for Medium-range Forecast Reanalysis | 0.25° | 1979–present | [45] |
| 14 | JRA55 | R | Japanese 55-year Reanalysis (JRA-55) | 0.56° | 1959–present | [46] |
| 15 | MSWEP | G,S,R | Multi-Source Weighted-Ensemble Precipitation (MSWEP) version 1 | 0.25° (land) | 1979–2015 | [18] |
| 16 | MSWEP2 | G,S,R | Multi-Source Weighted-Ensemble Precipitation (MSWEP) version 2 | 0.1° (land) | 1979–2015 | [24] |
| Annual | Dry | Wet | |
|---|---|---|---|
| Bias | 0.083 | 0.109 | 0.096 |
| Correlation | 0.254 | 0.350 | 0.358 |
| Variability | 0.131 | 0.168 | 0.227 |
Publisher’s Note: MDPI stays neutral with regard to jurisdictional claims in published maps and institutional affiliations. |
© 2020 by the authors. Licensee MDPI, Basel, Switzerland. This article is an open access article distributed under the terms and conditions of the Creative Commons Attribution (CC BY) license (http://creativecommons.org/licenses/by/4.0/).
Share and Cite
Centella-Artola, A.; Bezanilla-Morlot, A.; Taylor, M.A.; Herrera, D.A.; Martinez-Castro, D.; Gouirand, I.; Sierra-Lorenzo, M.; Vichot-Llano, A.; Stephenson, T.; Fonseca, C.; et al. Evaluation of Sixteen Gridded Precipitation Datasets over the Caribbean Region Using Gauge Observations. Atmosphere 2020, 11, 1334. https://doi.org/10.3390/atmos11121334
Centella-Artola A, Bezanilla-Morlot A, Taylor MA, Herrera DA, Martinez-Castro D, Gouirand I, Sierra-Lorenzo M, Vichot-Llano A, Stephenson T, Fonseca C, et al. Evaluation of Sixteen Gridded Precipitation Datasets over the Caribbean Region Using Gauge Observations. Atmosphere. 2020; 11(12):1334. https://doi.org/10.3390/atmos11121334
Chicago/Turabian StyleCentella-Artola, Abel, Arnoldo Bezanilla-Morlot, Michael A. Taylor, Dimitris A. Herrera, Daniel Martinez-Castro, Isabelle Gouirand, Maibys Sierra-Lorenzo, Alejandro Vichot-Llano, Tannecia Stephenson, Cecilia Fonseca, and et al. 2020. "Evaluation of Sixteen Gridded Precipitation Datasets over the Caribbean Region Using Gauge Observations" Atmosphere 11, no. 12: 1334. https://doi.org/10.3390/atmos11121334
APA StyleCentella-Artola, A., Bezanilla-Morlot, A., Taylor, M. A., Herrera, D. A., Martinez-Castro, D., Gouirand, I., Sierra-Lorenzo, M., Vichot-Llano, A., Stephenson, T., Fonseca, C., Campbell, J., & Alpizar, M. (2020). Evaluation of Sixteen Gridded Precipitation Datasets over the Caribbean Region Using Gauge Observations. Atmosphere, 11(12), 1334. https://doi.org/10.3390/atmos11121334