Article

Aircraft Emission Inventory and Characteristics of the Airport Cluster in the Guangdong–Hong Kong–Macao Greater Bay Area, China

1
National Key Laboratory of Air Traffic Management, College of Civil Aviation, Nanjing University of Aeronautics and Astronautics, Nanjing 211106, China
2
State Key Laboratory of Water Environment Simulation, School of Environment, Beijing Normal University, Beijing 100875, China
3
Nanhang Jincheng College, Nanjing 211156, China
*
Authors to whom correspondence should be addressed.
Atmosphere 2020, 11(4), 323; https://doi.org/10.3390/atmos11040323
Submission received: 10 February 2020 / Revised: 24 March 2020 / Accepted: 24 March 2020 / Published: 27 March 2020
(This article belongs to the Section Air Quality)

Abstract

:
In this study, a compound method using modified Boeing Fuel Flow Method 2 (BFFM2) and an updated First Order Approximation V3.0 (FOA3.0) method deploying the ICAO Time-in-Mode (TIM) was used to produce a more reliable aircraft emission inventory for the Guangdong–Hong Kong–Macao Greater Bay Area (GBA). The results show that compared with the International Standard Atmosphere (ISA) conditions, the total emission of nitrogen oxides(NOx) decreased by 17.7%, while carbon monoxide(CO) and hydrocarbons(HC) emissions increased by 11.2%. We confirmed that taxiing is the phase in which an aircraft emits the most pollutants. These pollutant emissions will decrease by 0.3% to 3.9% if the taxiing time is reduced by 1 minute. Furthermore, the impact of reducing taxi-out time on emissions is more significant than that of reducing the taxi-in time. Taking the total aircraft emission factors as the main performance indicators, Hong Kong International Airport (VHHH) contributes the most to the total emissions of the GBA, while the Zhuhai airport(ZGSD) contributes the least. The contribution of an individual airport to the total emissions of the GBA is mainly determined by the proportion of Boeing B77L, B77W, and B744.

Graphical Abstract

1. Introduction

Aircraft emissions produce air contaminants, such as carbon dioxide (CO2), nitrogen oxides (NOx), carbon monoxide (CO), hydrocarbons (HC), sulfur oxides (SOx), other gaseous pollutants, and particulate matter (PM) [1]. These emissions entail broad ecological issues related to ground level ozone (O3), acid rain, and climate change, and present potential risks related to the regional ecological environment and public health [2,3,4,5]. Aircraft air pollutant emissions can be generally divided into two parts: emissions during the landing and take-off (LTO) cycle and those during the non-LTO flight cycle (i.e., at a cruising altitude above 915 m) [1]. Due to the more prominent impact of the LTO cycle emissions [6,7,8], as well as the rapid growth of air transport volumes and the expansion of airports to meet future capacity needs, aircraft emissions during the LTO have received increasing attention in recent years [9,10,11]. Furthermore, the establishment of an airport aircraft emission inventory is urgently needed to assess the impact of air traffic on the environment and is the basis for the development of relevant standards and pollution control strategies [12,13,14].
Researchers have established aircraft emission inventories for different airports in different regions, such as the Atlanta airport in the USA, the Ataturk airport and the Kayseri airport in Turkey, 20 airports in the UK, the Incheon airport in South Korea, the Copenhagen airport in Denmark, the Brisbane airport in Australia, the Beirut airport in Lebanon, and the Venice Marco Polo airport in Italy [8,15,16,17,18,19,20,21], as well as national, EU, and global emission inventories [22,23,24,25,26,27,28,29,30]. Chinese scientists have also conducted similar studies and established emission inventories for the whole country, the Pearl River Delta region, the Yangtze River Delta region, and the Beijing, Shanghai, and Guangzhou airports for specific emission pollutants [10,11,31,32,33,34,35,36,37,38,39,40,41]. These studies not only quantified aircraft emissions using different methods but also characterized the aircraft LTO and non-LTO phase emissions and determined the air quality impact of aviation, which provides important infrastructure for improving the total emission inventories on urban and regional scales.
However, due to the data availability, most of these studies assume ideal conditions, such as using the International Civil Aviation Organization (ICAO) reference values as the real time lengths for the approach, taxiing, take-off, and climb-out phases, obtaining the LTO cycle information from the flight plan, or acquiring the real-time information from only a few airlines [1,22,32,34]. Some studies adopted the published aircraft emission factor reference data from the Ministry of Environmental Protection of the People’s Republic of China (MEP), which are the same for different aircraft or engine types, or from the older aircraft Engine Emission Database (EEDB), which are calculated from the reference emission indices (EIs) and fuel flows under sea-level static conditions [10,11,42]. Only a few studies have investigated the impact of atmospheric conditions on aircraft emissions [22,32,43], and most of them have assumed standard and stable conditions only.
So far, all information in previous airport studies has been different from the actual situations, and no aircraft emission research has been conducted for the airport cluster in the Guangdong–Hong Kong–Macao Greater Bay Area (GBA). To obtain a more accurate estimation of this area, our research collected historical information of the real flight operations and meteorological conditions of the GBA airport cluster in 2017 to establish a more reliable aircraft emission inventory. In addition, this study analyzed the emission characteristics of the GBA airport cluster and the quantitative effects of the aircraft operating phases and engine types. Our study not only improves understanding of the meteorological responses to aircraft emissions but also presents an emission reduction plan and constructs an infrastructure for the airport cluster’s sustainable development.

2. Materials and Methods
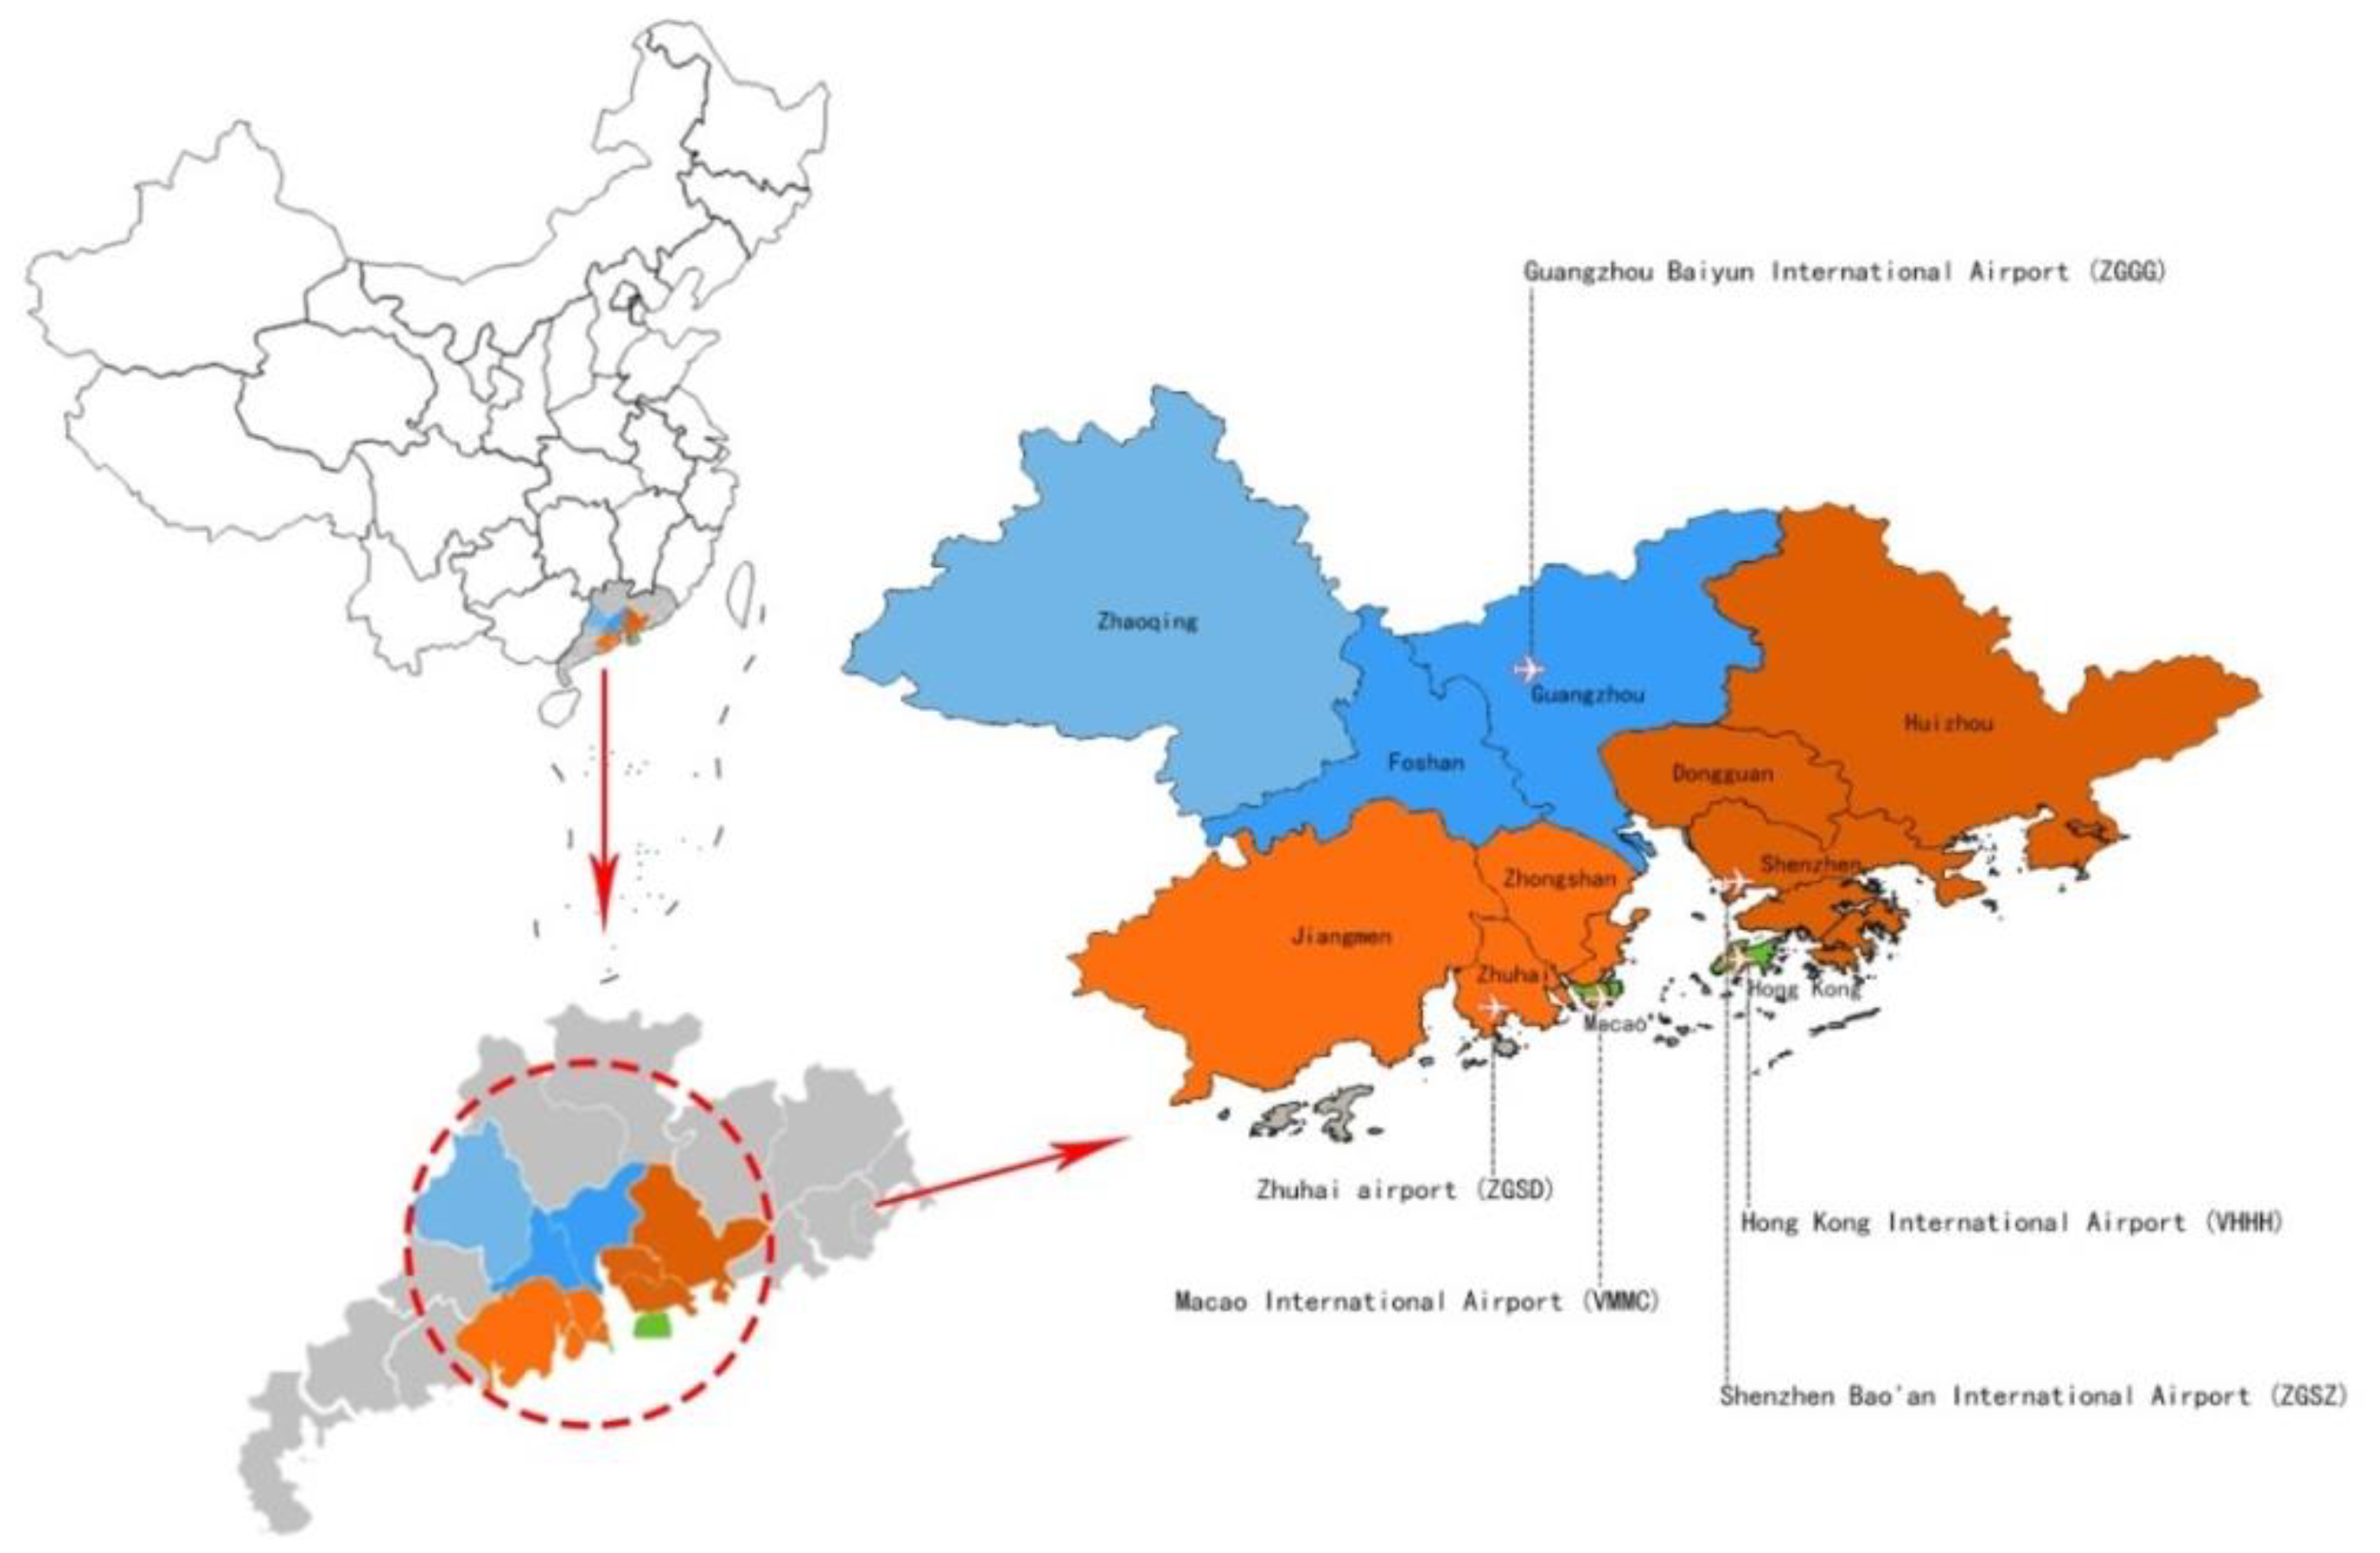
2.1. Study Area

The Guangdong–Hong Kong–Macao Greater Bay Area is a city cluster consisting of two special administrative regions of Hong Kong and Macao and nine cities in Guangdong province: Guangzhou, Shenzhen, Zhuhai, Foshan, Zhongshan, Dongguan, Huizhou, Jiangmen, and Zhaoqing (Figure 1). It is the 4th largest bay area in the world after the New York Bay Area, San Francisco Bay Area, and Tokyo Bay Area. In 2017, the population of the Greater Bay Area was about 70 million, and its GDP reached 10 trillion yuan (about $1.5 trillion), accounting for 12.2% of the Chinese national GDP [44]. Its GDP ranked 11th among the different economic units in the world. Moreover, the GBA ranks first among these four largest bay areas in terms of its population, land area, ports, and airport throughput, while its GDP ranks second.
Five individual airports have the most advanced facilities in the GBA: Guangzhou Baiyun International Airport (ZGGG), Hong Kong International Airport (VHHH), Shenzhen Bao’an International Airport (ZGSZ), Zhuhai airport (ZGSD), and Macao International Airport (VMMC), which comprise most of the area’s aviation forces. By the end of 2017, the total passenger throughput of this airport cluster exceeded 200 million, its cargo and postal throughput approached 8 million tons, and its flight volume reached 1.359 million [45].

2.2. Data Collection

2.2.1. Meteorological Data

The meteorological data of five airports in the GBA were obtained from the Meteorological Terminal Aviation Routine Weather Report (METAR). This hourly aviation weather report includes information such as temperature, dew point, pressure, wind direction/wind speed, ceiling, visibility, weather phenomena, and other meteorological elements at certain observation times. The relative humidity is calculated using the August–Roche–Magnus approximation with information about the temperature and dew point temperature [46]. The temperature and atmospheric pressure change rates from the station level to the atmospheric mixing height (the ICAO default value of 915 m or 3000 ft) were calculated using the International Standard Atmosphere (ISA) method.
The METAR data summary shows that the 2017 annual average temperature was 23.9 ˚C, and the annual average relative humidity was 75.9% in the GBA. The hottest month of the year was July, with an average monthly temperature and average relative humidity of 29.0 ˚C and 82.0%, respectively. The coldest month was January, with an average monthly temperature and relative humidity of 18.0 ˚C and 75.1%, respectively. The detailed 2017 meteorological characteristics of the individual airports in the GBA are shown in Table 1.

2.2.2. Flight Information and Aircraft Data

Actual flight information was provided by the Civil Aviation Administration of China (CAAC). This information included airlines, aircraft type, origin and destination, block time, actual departure time, actual arrival time, and other related information. The Eurocontrol Base of Aircraft Data (BADA v3.11), an aircraft performance model developed and maintained by EUROCONTROL, was used to match aircraft types with engine models [47]. If the aircraft type was missing in the actual flight information, it was fixed by the flight schedule. If there was more than one aircraft type in the schedule, the most popular one among them was used.
In 2017, there were about 1.36 million flights that took place in the GBA airport cluster, including more than 100 aircraft types. Among these flights, A320, B738, A321, and A333 were the most popular aircraft types, accounting for about 71.9% of the fleet, while the rarest 1% of aircraft types accounted for 7.4% (Table 2).

2.2.3. Engine Emission Indices

The engine emission indices were collected from the ICAO Engine Exhaust Emissions Data Bank (EEDB V26b) [48], which was revised from its previous versions according to the ICAO Annex 16, Vol 2, Part III, Appendix 3 [49]. This EEDB database included the specifications of more than 350 aircraft engine models. Emission parameters reported in the EEDB included fuel flow rates, NOx, CO, HC, and smoke number for four different engine power settings that corresponded to different phases in the LTO cycle.

2.3. Aircraft Emission Inventory Calculation

Only LTO cycle emissions were calculated in this study. An LTO cycle consists of four phases of aircraft operations: approach, taxiing, take-off, and climb-out. Aircraft LTO emissions are closely related to the aircraft engine numbers, LTO cycle numbers, operation time in different phases, fuel flow rate, and emission index (EI) of each specific pollutant. Finally, the NOx, CO, HC, SO2, and PM emissions can be calculated using the ICAO time-in-mode (TIM).
The number of LTO cycles was obtained from the actual landing records at the airport [1]. The taxiing time was extracted from the actual flight data, and the time lengths of the other phases were established by the ICAO certification TIM. The average times of the other phases were 4 min for approach, 0.7 min for take-off, and 2.2 min for climb [1]. The fuel flow rates and the EIs of NOx, CO, and HC were collected from the EEDB database. The EI of SO2 used in this study is 0.8 g/kg [22,50]. The EIs of the PM are estimated through the updated First Order Approximation V3.0 (FOA3.0) method, which was developed by the Committee of Aviation Environment Protection (CAEP) [51]. Thus, the total emissions of NOx, CO, HC, SO2, and PM in the LTO cycle can be calculated by Equation (1):
E i j = ( T I M j k · 60 · C C k · F F j k · E I i j k · N e j )
where Eij stands for the emission amount of pollutant i (NOx, CO, HC, SO2, and PM) from aircraft type j (g); TIMjk stands for the time (min) in mode k (e.g., approach, taxiing, take-off, and climb-out) for aircraft type j (min); and CCk is the correction coefficients (CC) of the fuel flow in mode k. For the approach, taxiing, take-off, and climb-out phase, the CCk values are 1.020, 1.100, 1.010, 1.013, respectively [22,32]; FFjk is the fuel flow during operation mode k for each engine used on aircraft type j (kg/s); EIijk is the EI for pollutant i (e.g., NOx, CO, HC, SO2, or PM), in mode k for each engine used on aircraft type j (g/kg); and Nej is the number of engines used on aircraft type j.
As the emission indices of NOx, CO, and HC given in the EEDB are reference values under ISA condition at sea level, we must correct the emission indices with actual meteorological conditions (such as temperature, pressure, relative humidity, etc.) [32]. To account for the effects of the meteorological conditions on emissions, the BFFM2 method was deployed to correct the EIs of NOx, CO, and HC. This method reduces the uncertainty of the direct use of the EIs in the EEDB to estimate the aircraft emissions more accurately [22]. It should be noted that there is a mistake within the published BFFM2 specific humidity calculation. A slightly modified version of the BFFM2 method was, therefore, implemented [43]. The equations used for the correction of the EIs for NOx, CO, and HC are as follows:
E I i = C C E I i · R E I i
C C E I N O x = exp ( 19.0 · ( S H 0.0063 ) ) · ( ( P a m b / 1013.25 ) 1.02 / ( ( T a m b + 273.15 ) / 288.15 ) 3.3 ) 0.5
C C E I C O = C C E I H C = θ a m b 3.3 / δ a m b 1.02 = ( ( T a m b + 273.15 ) / 288.15 ) 3.3 / ( P a m b / 1013.25 ) 1.02
where EIi stands for the corrected EI of pollutant i (e.g., NOx, CO, and HC) (g/kg); CCEIi stands for the correction coefficient of the emission index (CCEI) for pollutant i; REIi is the referenced EI at ISA from EEDB for pollutant i (g/kg); SH is the specific humidity (%), which can be calculated from relative humidity [43]; Pamb is the ambient pressure (hPa); and Tamb is the ambient temperature (°C).

3. Results

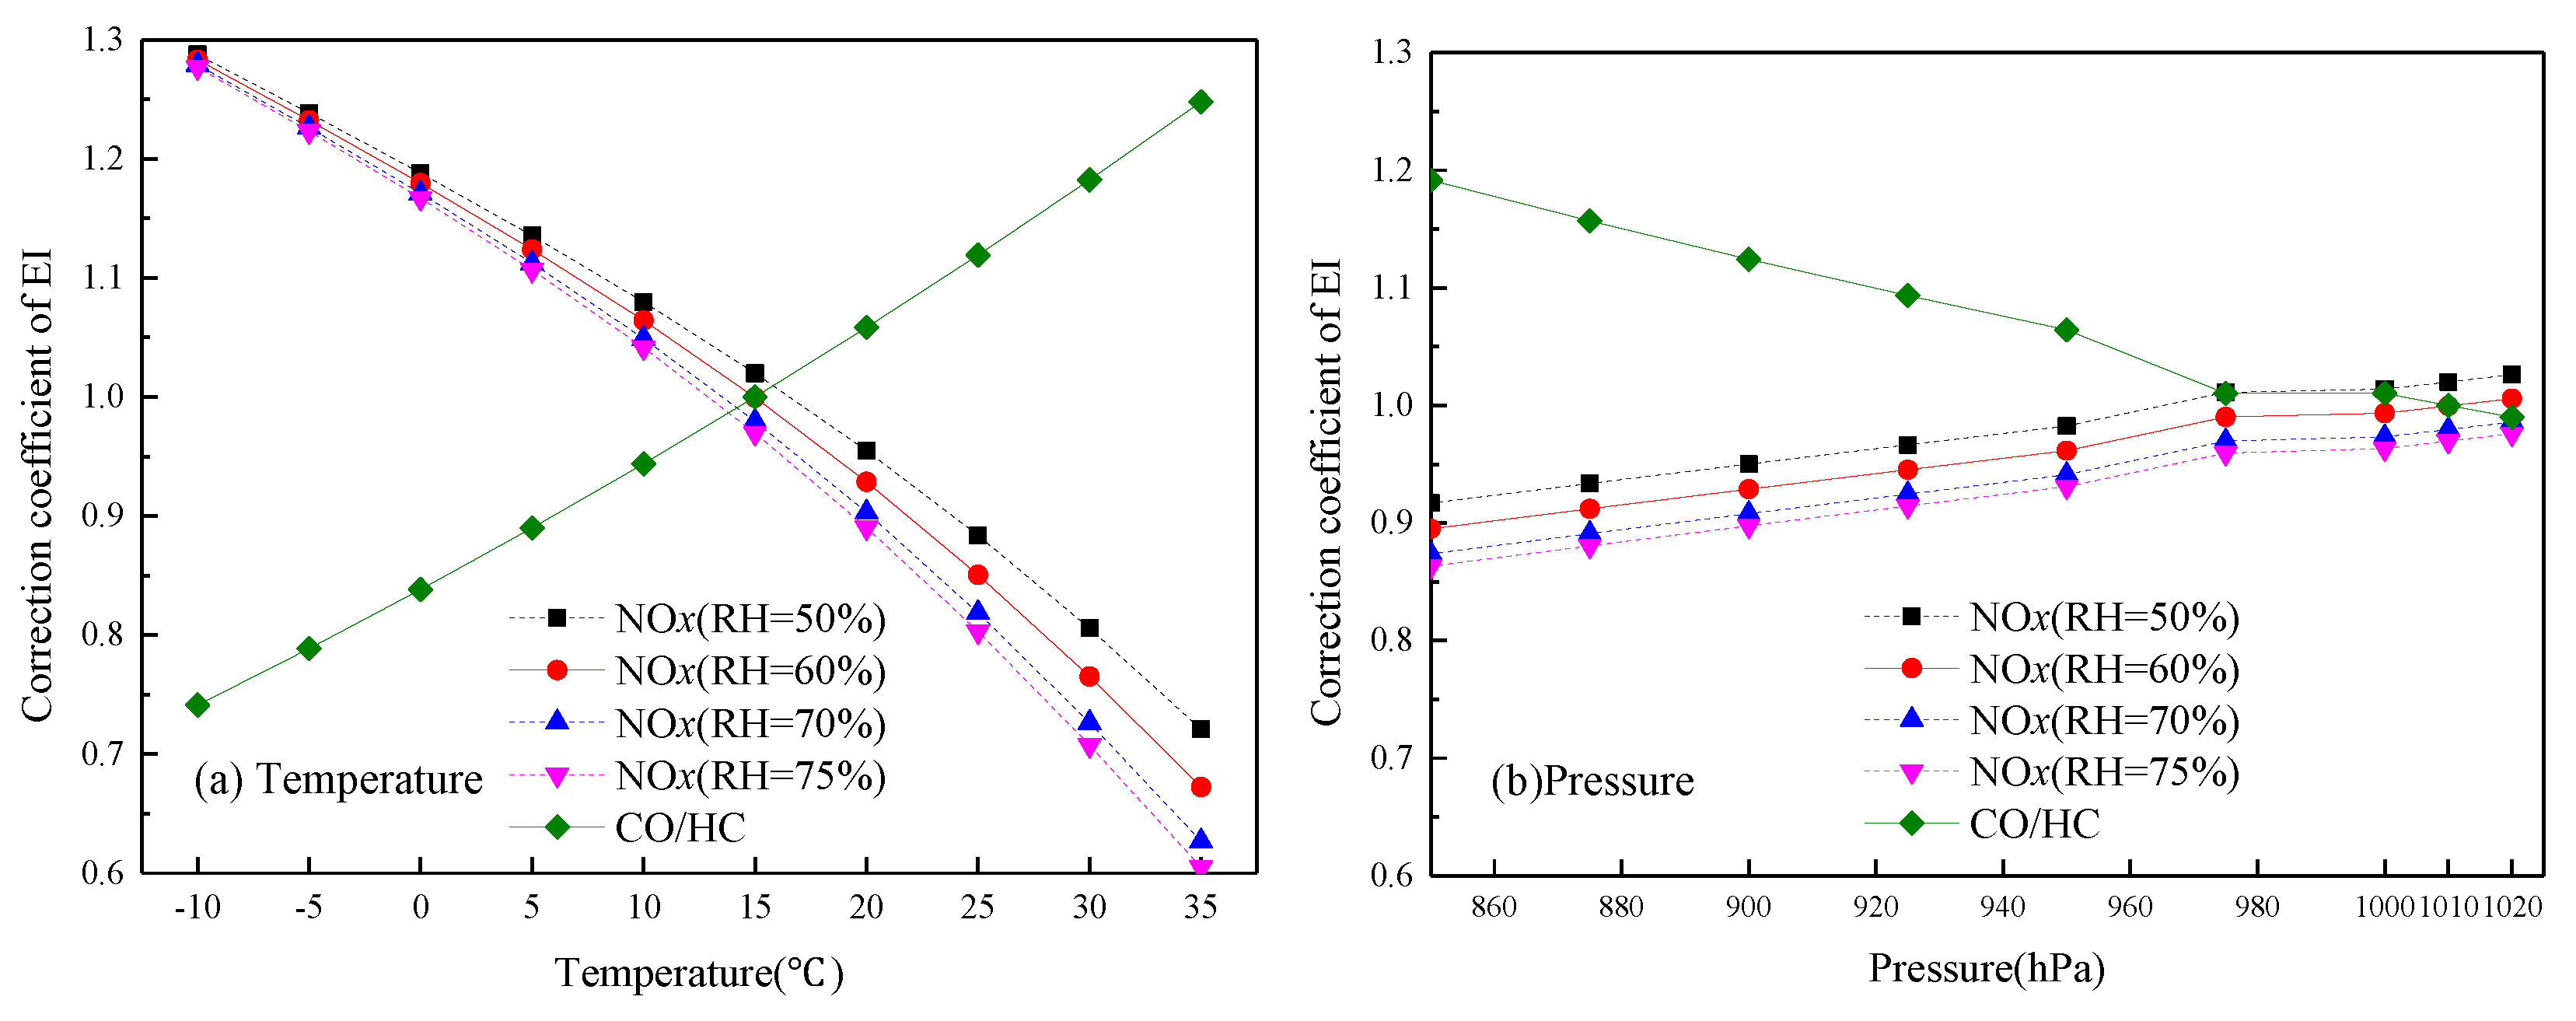
3.1. Calculated Emission Inventory and the Meteorological Impact

The latest EEDB was used to obtain the EIs. These EIs are the engine test data under a static sea level and rated thrust settings of 7%, 30%, 85%, and 100% and are corrected with real-time meteorological parameters. This compound method fully considers the impact of weather conditions on the EI of NOx, CO, and HC. Based on the method mentioned in Section 2.3, the LTO cycle emissions at each airport in the GBA were estimated without the actual weather conditions (using ISA conditions); with actual weather conditions, the calculated aircraft emission estimations should be more accurate. The resulting emission inventories are shown in Table 3.
The comparisons show that the total NOx emissions calculated by the ISA are higher than those calculated by the actual weather conditions, and the total emissions of CO and HC are lower than those calculated by the actual weather conditions. The total NOx emissions of the five airports were 17.7% less than those under ISA, but the total CO and HC emissions were higher by 11.2%.
The difference between those two methods was mainly in the NOx, CO, and HC. While there was a small difference between the percentage of NOx, CO, and HC in the total emissions calculated by the two methods, the NOx fluctuates less than −7.3%, and the CO and HC fluctuate less than 7.1% and 0.7%, respectively.
Under the assumption that the air pressure is constant (the pressure is 1013 hPa), the changes in the CCEIs with the temperature are shown in Figure 2a. These changes show that, as the temperature increases, the CCEIs of NOx decrease at different relative humidity levels; however, the CCEIs of CO and HC increase. The decreases in the CCEI of NOx were −1.3 to −1.5% for each degree increase in temperature (°C), and the increases in the CCEIs of CO and HC were about 1.1% for each degree increase in temperature (°C). When setting the ISA calculation results as the reference, assuming that the temperature range was ISA-25~ISA+20 °C (−10~35 °C), the CCEI of NOx fluctuated less than ±28%, and the CCEIs of CO and HC fluctuated less than ±27%. According to Equations (2) and (3), the calculation results for the CCEI of NOx decreased while the relative humidity increased, holding the temperature constant.
The relationship between the air pressure and the CCEI when the temperature is constant is shown in Figure 2b. This relationship shows that when the air temperature is held constant for 15 °C, the CCEIs of NOx increase, while the pressure increases at different relative humidity levels. However, the CCEIs of CO and HC decrease as the pressure increases. For each hectopascal (hPa) increase in pressure, the CCEIs for NOx increased by about −6.0 to −7.0‰, and the decrease in the CCEIs of CO and HC was about 1.2‰. Using the calculation results under the ISA condition as the reference, the CCEI of NOx ranged from −1.05% to 13.7%, and the CCEIs of the CO and HC change rate were less than 19% if the atmospheric pressure varied from 850 to 1020 hPa.
The CCEIs of NOx decrease as the relative humidity increases, but the CCEIs of CO and HC do not change much. Taking the calculation results under the ISA condition as the reference, the CCEIs of NOx fluctuated no more than ±3%, and the CCEIs of CO and HC changed no more than 0.1‰ when the relative humidity varies from 50% to 75%.
Frank et al. [43] examined the sensitivity of the BFFM2 method to the deviations of atmospheric data from the ISA conditions at the EUROCONTROL Experimental Centre based on the Advanced Emission Model (AEMIII) Version 1.5. There are many discussions about temperature and humidity, but no analysis of air pressure. Their findings observed a decrease in the EI of NOx (of ~0.7%) for each degree increase in temperature (°C) and an increase in the EIs of HC and CO (of ~1.4 %). Additionally, their data show an increase of as much as 4% NOx for cold days and an increase of CO and HC of as much as 10% for warm days. In our current study, the GBA was located on the subtropical coast with a marine subtropical monsoon climate. Due to the high temperature and humid climatic conditions of this area, the sensitivity to weather conditions was more obvious than their calculations suggest.

3.2. Air pollutant Species and Individual Airport Emissions

In the GBA airport cluster in 2017, the total aircraft LTO cycle emissions of NOx, CO, HC, SO2, and PM were 12,464.3, 10,632.0, 1153.4, 759.9, and 95.6 tons, accounting for 49.6%, 42.3%, 4.6%, 3.0%, and 0.4% of the total amounts at the five airports, respectively (Table 3).
Although the percentages of NOx and CO changed little, NOx and CO were the main emissions and accounted for 91.3% of the total. Many studies have similarly found that NOx is the main type of airport emission [9,10,14,32], while CO is another pollutant to be concerned about. The emissions of HC, SO2, and PM were relatively low and accounted for only 8.0% of the total pollutants.
Among the five airports in the GBA airport cluster, Guangzhou Baiyun International Airport (ZGGG) had the most LTO cycles (232,648) in 2017. Its total emissions were about 7240.8 tons and accounted for 28.8% of the total emissions of the GBA airports. The airport cluster in the GBA ranks second in total emissions. The LTO cycles of the Hong Kong International Airport (210500) rank second in the GBA; however, their total emissions are 11,962.1 tons, the highest among the five airports, accounting for 47.6% of total GBA airport emissions.
In order to compare the emissions among individual airports in different regions, the total aircraft emissions were converted into aircraft emission factors to remove the impact of LTO numbers on the total aircraft emissions. The results of this process are listed in Table 4. The aircraft emission factors in this study were based on real flight data and the latest aviation emission data, taking the meteorological impact into account. Thus, the calculated aircraft emission estimations should be more accurate than the others. Table 4 shows that the aircraft emission factors of NOx and CO in the GBA in 2017 were 18.3 kg/LTO and 15.6 kg/LTO. This result was roughly consistent with the results from airports in other regions. The NOx emission factor was about 7.8–25.6 kg/LTO, and the CO emission factor was about 7.7–12.9 kg/LTO, indicating that the aircraft emissions factors in this study were at similar levels to those of airports in other regions, although the aircraft emissions at different airports were estimated with different methods [19] and different data sources. In addition, we found that the CO emission factors in this study were larger than those in others, and the emissions of CO may be underestimated.
The emission factors of NOx and CO in this study were slightly different from the other results; the percentages of NOx and CO in the total emissions were lower (−5.7% to −11.8%) or higher (6.9% to 11.4%) than the others. However, the percentage of NOx and CO in the total emissions showed no clear difference compared to the others (less than 0.3%–5.8%).
Among the five major airports in the GBA, the aircraft emission factors of all investigated pollutants at the Hong Kong International Airport (VHHH) were the highest, and the total aircraft emission factor of all calculated pollutants was as high as 56.8 kg/LTO. The Zhuhai Airport (ZGSD) had the lowest aircraft emission factor, with a total emission factor of 18.8 kg/LTO. Taking the total emission factor as the environmental performance indicator, VHHH contributed the most to the total emissions of the GBA, while ZGSD contributed the least.
The calculated NOx and CO emission factors and the total emission factors in the GBA were higher than those nationwide. Because the calculated NOx and CO emission factors and the total emission factors in the GBA were higher than the MEP-published total emission factors, if the MEP emission factors are directly applied to calculate the aircraft emission inventory, the real emissions from the GBA airport cluster may be underestimated. In particular, the calculated total emissions and the emissions of NOx and CO in the GBA will be seriously underestimated.
Although the emission factors of NOx, SO2, and PM in the GBA were lower than the average emission factors of NOx in the Yangtze River Delta region, the emission factors of CO, HC, and the total emission factors are higher than those in the Yangtze River Delta region. At the same time, the airport aircraft emission factors of NOx and CO in the GBA were also higher than those of some foreign airports. The LTO cycle numbers at airports VHHH, ZGGG, and RKSI were similar, but the total emission factors at VHHH and ZGGG were higher than those at RKSI. As the busiest airport in the world, Atlanta airport (KATL) has much higher LTO cycle numbers than the airports in the GBA, and its emission factors are much lower than those of many airports (e.g., ZGGG and VHHH) in the GBA. The results show that there is still room for improvement in the airport aircraft emissions in the GBA.

3.3. Contribution to Emissions from Different LTO Phases

Aircraft pollutant emissions are different during each phase of the LTO cycles in the GBA (Table 5). As analyzed in Section 2.2, NOx and CO have higher emission factors among all investigated pollutants. The emissions of NOx take place mainly during the climb-out and take-off phases (6138.9 and 3195.9 tons, respectively, accounting for 49.3% and 25.6% of the total emissions of NOx from the LTO cycle (12,464.3 tons)). NOx has the highest emissions in all phases, except taxiing. The emissions of NOx in the approach, take-off, and climb-out accounted for 63.0%, 94.8%, and 92.6% of the total emissions. The emissions of CO take place mainly in the taxiing and approach phase. The emissions of CO in the taxiing phase are 9825.8 tons, accounting for 92.4% of the total CO emissions.
Among all the phases in the LTO cycle, taxiing is the phase in which the aircraft emits most of its pollutants. The total emissions of the taxiing phase were 12,871.4 tons, accounting for more than half of the total LTO cycle emissions (51.3%). The total emissions in the climb-out, take-off, and approach phases were relatively small at 6573.9 (26.2%), 3349.0 (13.3%), and 2310.9 tons (9.2%), respectively. CO and NOx were the main pollutants in the taxiing phase, with 9825.8 and 1654.4 tons, respectively, accounting for 76.3% and 13.3% of the total emissions during the taxiing phase. Other related research results [14,36,37,38] also show that the taxiing phase is the main emission phase of CO, but the proportions are slightly different at different airports. In the taxiing phase, the aircraft engine works with the lowest thrust setting, and the fuel is not fully burned, so more CO and HC are emitted. When the engine thrust is set higher during other phases, the fuel is burned more cleanly and the emissions can be significantly reduced. For example, during the take-off and climb-out phases, the emissions of CO were 39.6 and 148.1 tons, accounting for only 1.2% and 2.3% of the total phase emissions, respectively. Taxiing is also the phase that produces the most SO2 and PM pollutants. The emissions of CO, HC, SO2, and PM in the taxiing phase were 9825.8, 1032.5, 324.9, and 33.9 tons, accounting for 92.4%, 89.5%, 42.8%, and 35.4% of the total pollutant emissions, respectively.
As analyzed in Section 2.2, VHHH contributed the most to the total emissions of the GBA. The taxiing time was calculated from real data, and the time lengths of the approach and take-off phases were extracted from the ICAO’s recommended values. However, these values do not reflect the actual situation and may lead to deviations. The emissions during taxiing are the most accurate. Taking these emissions as an example, airport scene management can be optimized to improve the efficiency of the taxiing phase while keeping the number of the total LTO cycles and the aircraft types unchanged.
Assuming the same conditions as 2017, the emission change rates were calculated when the average taxi-in and taxi-out times during each LTO cycle were reduced by 1, 2, or 3 minutes, respectively (Figure 3a and Figure 3b). The results show that reducing the taxi-out time has a more significant impact on emissions than reducing the taxiing-in time. The reduction of emissions by reducing taxi-in time was 0.3–3.0% per minute, while that by reducing taxi-out time was 0.4%–3.9% per minute. The decreases of CO and HC are the most significant when reducing the taxiing time, reaching 2.9%–3.9%, and the decrease of NOx is the least significant at 0.3%–0.4%. The total emission reduction by reducing the taxi-in time or taxi-out time was 1.6% per minute or 2.1% per minute, respectively. Therefore, reducing the aircraft taxiing time leads to environmental benefits and greater cost-effectiveness [54]. Deploying the Arrival Manager (AMAN) and Departure Manager (DMAN) systems, especially AMAN, might help achieve this goal.

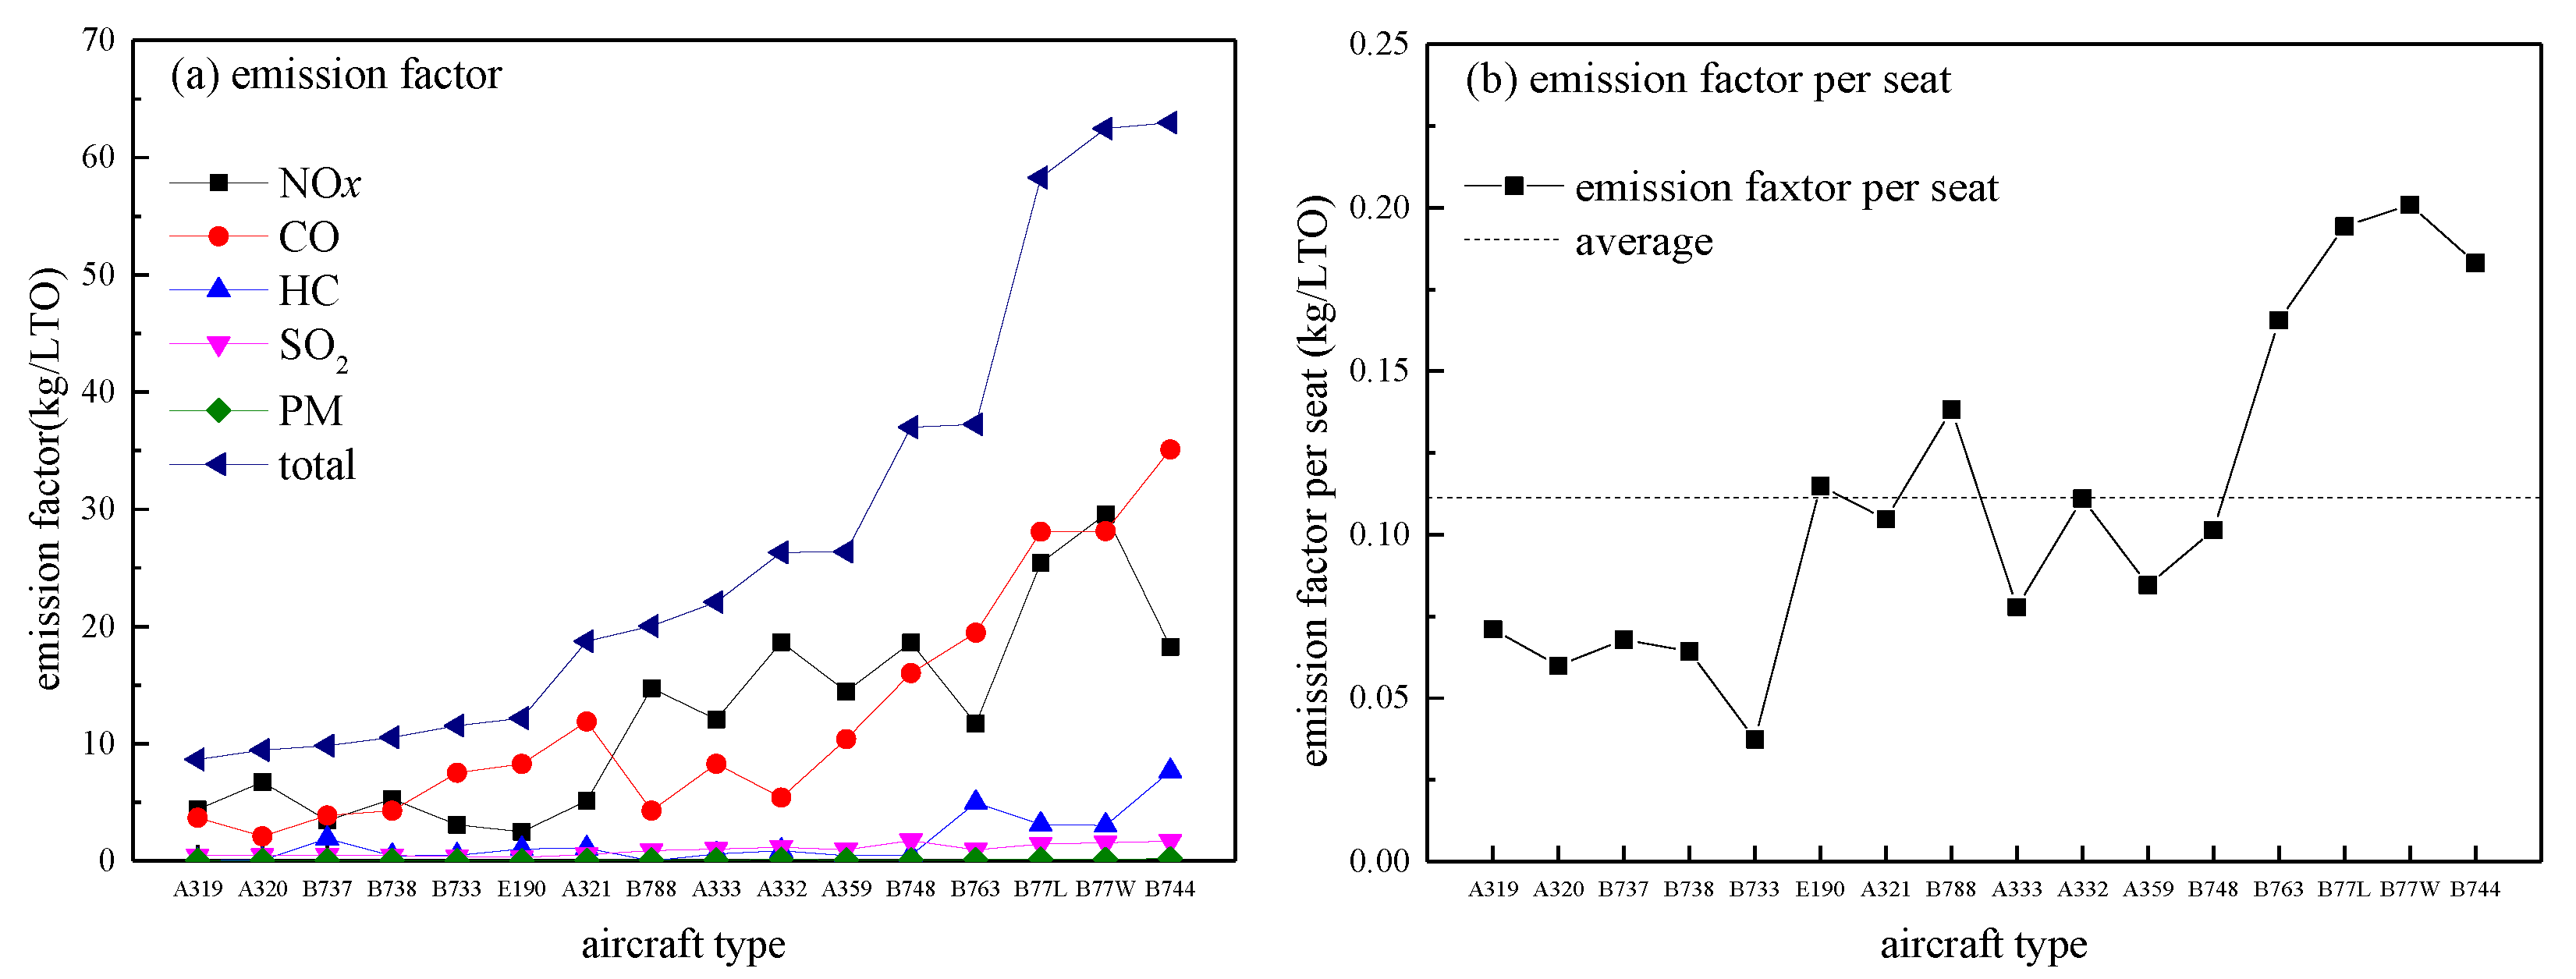
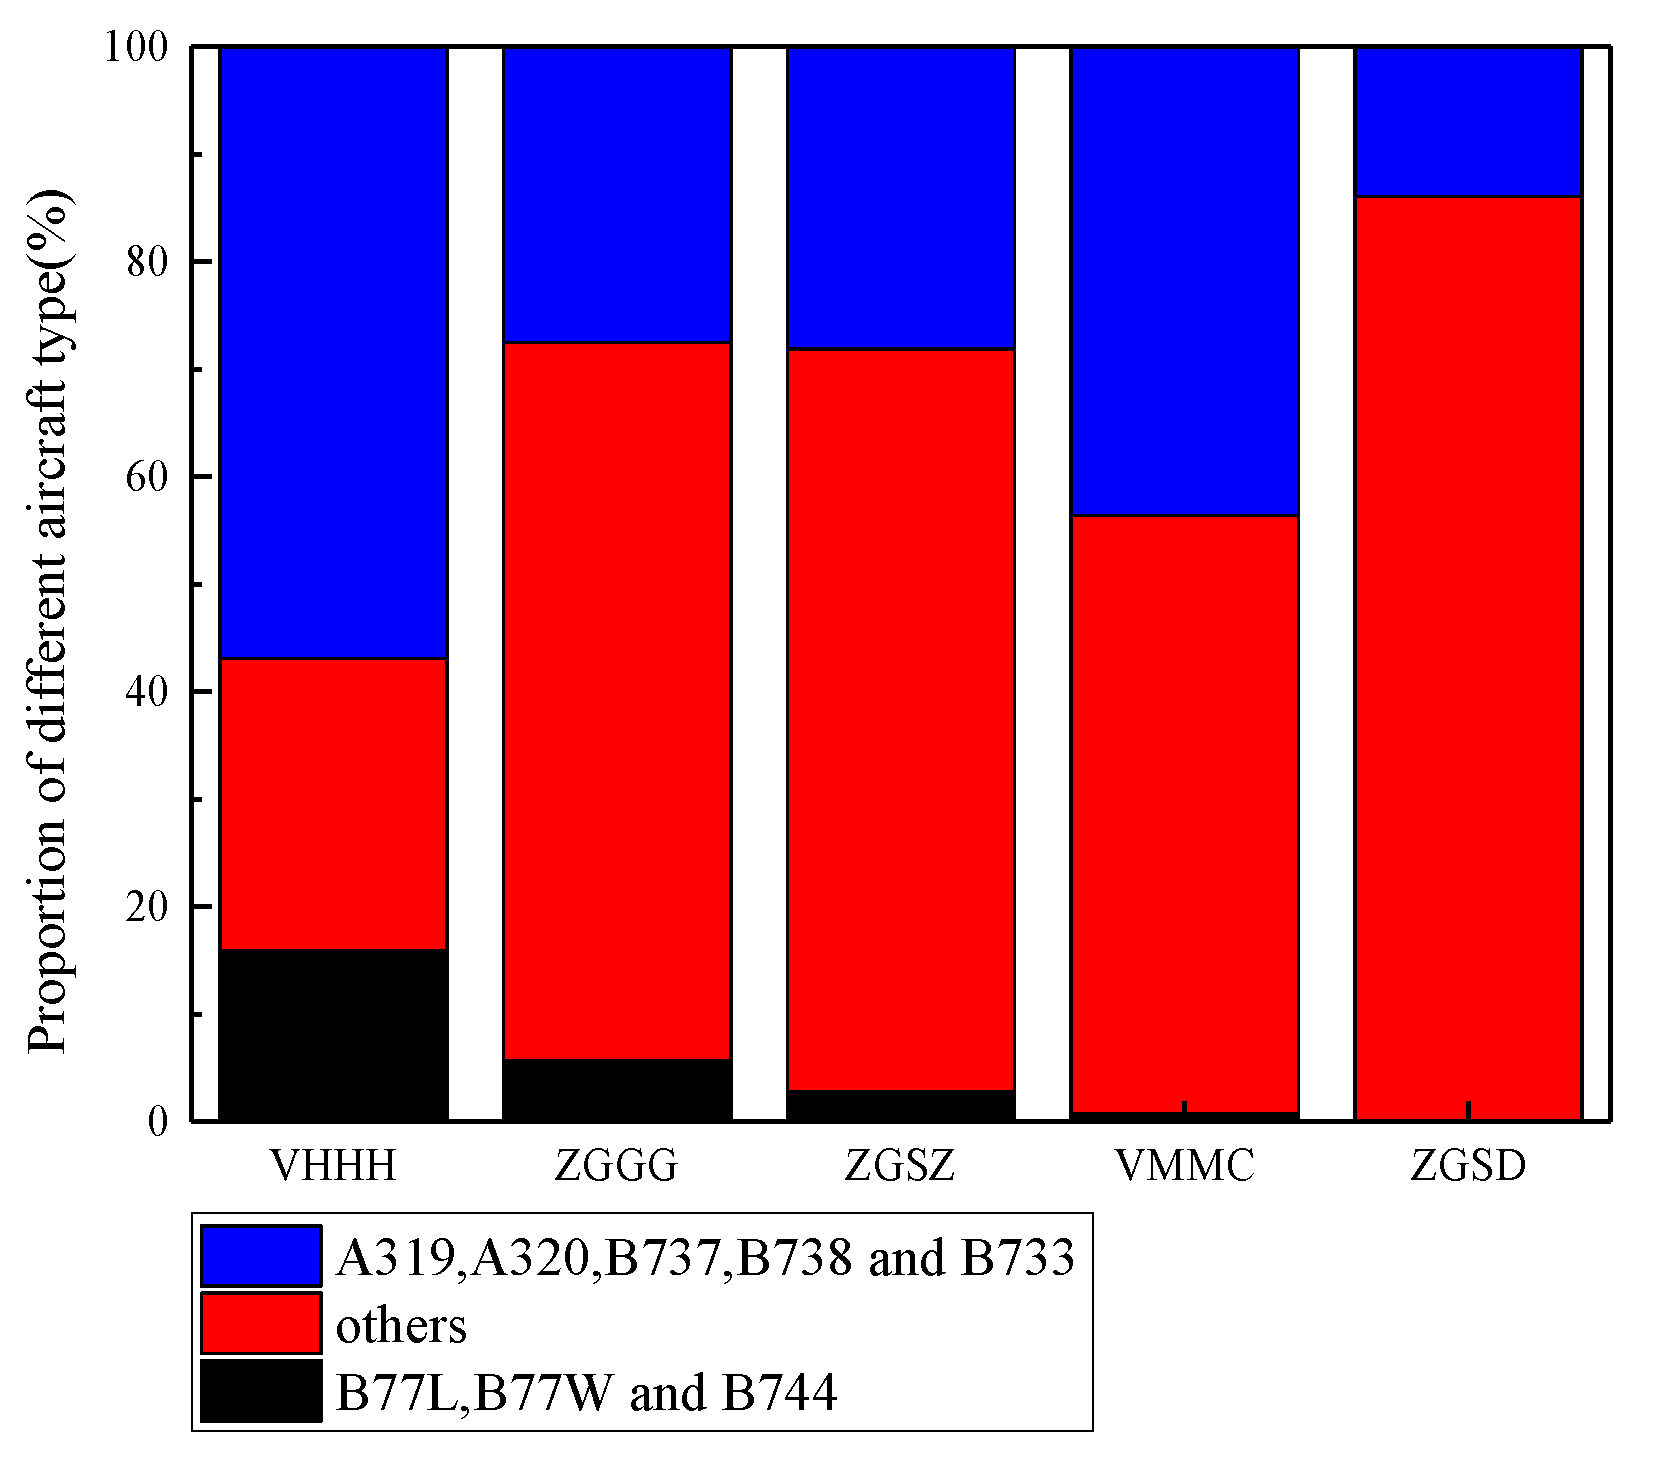
3.4. Contribution to Emissions from Different Aircraft Types

The calculated NOx, CO, HC, SO2, PM, and total emission factors for A320 aircraft were 4.4, 3.7, 0.4, 0.0, 0.0, and 8.6 kg/LTO, respectively. The calculated NOx, CO, HC, SO2, PM, and total emission factors for B77W aircraft were 29.6, 28.1, 3.0, 1.3, 0.2, and 62.2 kg/LTO, respectively. The emission factors of B77W were much higher than the emission factors of A320.
According to the BADA database, the fuel flow rates of B77L, B77W, and B744 are significantly higher than those of the A320. The B744 has four engines, while other aircraft have two engines. Although B77L, B77W, and B744 have more seats than A320, the emission factors per seat of B77L, B77W, and B744 are still significantly higher than those of the other aircraft. Comparisons of A320, B77L, B77W, and B744 are shown in Table 1. We took A320 and B77W as an example to compare and analyze their fuel flow rates, emission indexes, seat numbers, and emission factors per seat. The fuel flow rate of an A320 in each phase is lower than that of the B77W, but its EIs of NOx, CO, and HC are not consistently lower. Comparisons of A320 and B77W are shown in Table 6.
Taking the total emission factors of certain aircraft types as the performance indicators, the A319, A320, B737, B738, and B733 had relatively smaller contributions to the airport emissions of the GBA, while the B77W, B744, and B77L had greater contributions. These characteristics were similar to those of the Beijing Capital International Airport [14].
Since the seats in different aircraft models are different (for example, the B77W has 311 seats, while an A320 has 158 [55]), the aircraft emission factors were converted into emission factors per seat. The results show that the emission factors per seat for the B77L, B77W, and B744 were significantly higher than those of other aircraft (Figure 4).
The proportion of aircraft types in each airport in the GBA is shown in Figure 5. As analyzed in Section 3.2, VHHH had the highest aircraft emission factors for all pollutant species among all airports in the GBA. This may be because the proportion of B77L, B77W, and B744 at VHHH was significantly higher than those of any other airport. Therefore, reducing the LTO cycles of aircraft types with larger emission factors is another valid method for reducing airport emissions.

3.5. Study Limitations

There are three major sources of uncertainty related to our emission inventory calculations: flight schedules, LTO cycle time, and EIs.
The flight operation information was collected from the Civil Aviation Administration in this research. The information on the departure airport, destination airport, aircraft type, block time, departure time, landing time, and other related information is highly reliable. VHHH has a missing data rate of 25%, while the missing data rates of the other four airports are not more than 6%.
Secondly, the taxiing time is calculated from the actual flight operation data, and the time lengths of the approach, take-off, and climb phases are extracted from the ICAO’s recommended values. The average times were 4 min for approach, 0.7 min for take-off, and 2.2 min for climb. These are not the actual situations and may lead to deviations.
Thirdly, although the latest ICAO EEDB (version 26b of September 20, 2019) was used to obtain the EIs, and these EIs were corrected in this study with meteorological parameters. These EIs were the engine test data under static sea level conditions and a rated thrust setting of 7%, 30%, 85%, and 100%, which may be different from real situations.

4. Conclusions

In this study, a compound method (considering the meteorological impacts on aircraft emissions) was used to estimate a more reliable aircraft emission inventory at the GBA airport cluster. The methodology and results in this study can be used as a reference for the aviation emission inventory related calculations in this area. The resulting aircraft NOx, CO, HC, SO2, and PM emissions at the GBA airports in 2017 were 12,464.3, 10,632.0, 1153.4, 759.9, and 95.6 tons, respectively, accounting for 49.6%, 42.3%, 4.6%, 3.0%, and 0.4% of various pollutants. Compared with the traditional calculation methods without any consideration of actual weather conditions, the total amount of NOx emissions decreased by 17.7%, while the CO and HC emissions increased by 11.2%.
Among all four phases in the LTO cycle, taxiing is the phase during which an aircraft emits the most pollutants. The emission of pollutants can be reduced by 0.3% to 3.9% if the average LTO taxiing time is reduced by 1 minute. The impact of reducing the taxi-out time on emissions is more significant than that of reducing the taxi-in time. The reduction of emissions by reducing the taxi-in time is 0.3%–3.0% per minute, and that by reducing the taxi-out time is 0.4%–3.9% per minute. Taking the total emission factor of an airport as the performance indicator, VHHH contributed the most to the total emissions of the GBA, while ZGSD contributed the least. The airports’ contributions to the total emissions of the GBA were mainly determined by the proportion of the LTO cycles of B77L, B77W, and B744. These findings will not only improve our understanding of actual weather conditions’ responses to aircraft emissions but also determine the focus of emission reductions.

Author Contributions

Conceptualization, J.L., and X.L.; methodology, J.L., H.Y., and N.Y.; software, J.L.; resources, H.Y., Y.T., X.Z., P.Z., and K.W.; data curation, J.L., H.Y., P.Z., and K.W.; writing-original draft, J.L. and N.Y.; writing-review and editing, J.L., N.Y., X.L.,Y.T., and X.Z.; project administration, N.Y.; funding acquisition, N.Y. supervision, N.Y. All authors have read and agreed to the published version of the manuscript.

Funding

This work was funded by the National Natural Science Foundation of China (Nos. 91544232, U1933119). Besides, we greatly appreciated the fund support from Nanjing University of Aeronautics and Astronautics New Faculty Startup Funding (Nos. 90YAH19018).

Acknowledgments

We sincerely appreciate the three anonymous reviewers’ constructive comments and the editor’s efforts in improving this manuscript.

Conflicts of Interest

The authors declare no conflict of interest.

References

  1. International Civil Aviation Organization (ICAO). Doc 9889, Airport Air Quality Manual; ICAO: Montreal, QC, Canada, 2011. [Google Scholar]
  2. Harrison, R.M.; Masiol, M.; Vardoulakis, S. Civil aviation, air pollution and human health. Environ. Res. Lett. 2015, 10, 041001. [Google Scholar] [CrossRef] [Green Version]
  3. Yim, S.H.L.; Lee, G.L.; Lee, I.H.; Allroggen, F.; Ashok, A.; Caiazzo, F.; Eastham, S.D.; Malina, R.; Barrett, S.R.H. Global, regional and local health impacts of civil aviation emissions. Environ. Res. Lett. 2015, 10, 034001. [Google Scholar] [CrossRef] [Green Version]
  4. Eastham, S.D.; Barrett, S.R.H. Aviation-attributable ozone as a driver for changes in mortality related to air quality and skin cancer. Atmos. Environ. 2016, 144, 17–23. [Google Scholar] [CrossRef]
  5. Hudda, N.; Simon, M.C.; Zamore, W.; Durant, J.L. Aviation-related impacts on ultrafine particle number concentrations outside and inside residences near an airport. Environ. Sci. Technol. 2018, 52, 1765–1772. [Google Scholar] [CrossRef] [PubMed] [Green Version]
  6. Woody, M.; Baek, B.H.; Adelman, Z.; Omary, M.; Lam, Y.F.; West, J.J.; Arunachalam, S. An assessment of Aviation’s contribution to current and future fine particulate matter in the United States. Atmos. Environ. 2011, 45, 3424–3433. [Google Scholar] [CrossRef]
  7. Mazaheri, M.; Johnson, G.R.; Morawska, L. An inventory of particle and gaseous emissions from large aircraft thrust engine operations at an airport. Atmos. Environ. 2011, 45, 3500–3507. [Google Scholar] [CrossRef]
  8. Turgut, E.T.; Cavcar, M.; Usanmaz, O.; Yay, O.D.; Dogeroglu, T.; Armutlu, K. Investigating actual landing and takeoff operations for time-in-mode, fuel and emissions parameters on domestic routes in Turkey. Transp. Res. Part D Transp. Environ. 2017, 53, 249–262. [Google Scholar] [CrossRef]
  9. Yang, X.W.; Cheng, S.Y.; Lang, J.L.; Xu, R.; Lv, Z. Characterization of aircraft emissions and air quality impacts of an international airport. J. Environ. Sci. 2018, 72, 198–207. [Google Scholar] [CrossRef]
  10. Bo, X.; Xue, X.; Xu, J.; Du, X.; Zhou, B.; Tang, L. Aviation’s emissions and contribution to the air quality in China. Atmos. Environ. 2019, 201, 121–131. [Google Scholar] [CrossRef]
  11. Zhou, Y.; Jiao, Y.F.; Lang, J.L.; Chen, D.S.; Huang, C.; Wei, P.; Li, S.Y.; Cheng, S.Y. Improved estimation of air pollutant emissions from landing and takeoff cycles of civil aircraft in China. Environ. Pollut. 2019, 249, 463–471. [Google Scholar] [CrossRef]
  12. Yim, S.H.L; Stettler, M.E.J; Barrett, S.R.H. Air quality and public health impacts of UK airports. Part II: Impacts and policy assessment. Atmos. Environ. 2013, 67, 184–192. [Google Scholar] [CrossRef]
  13. Vennam, L.P; Vizuete, W.; Arunachalam, S. Evaluation of model predicted hazardous air pollutants (HAPs) near a mid-sized U.S. airport. Atmos. Environ. 2015, 119, 107–117. [Google Scholar] [CrossRef]
  14. Li, J.; Zhao, Z.Q.; Liu, X.G.; Zhou, X.N.; Wang, K.; Zhang, P. Study and analysis of aircraft emission inventory for Beijing Capital International Airport. China Environ. Sci. 2018, 38, 4469–4475. (In Chinese) [Google Scholar]
  15. Unal, A.; Hu, Y.T.; Chang, M.E.; Odman, M.T.; Russell, A.G. Airport related emissions and impacts on air quality: Application to the Atlanta International Airport. Atmos. Environ. 2005, 39, 5787–5798. [Google Scholar] [CrossRef]
  16. Kesgin, U. Aircraft emissions at Turkish airports. Energy 2006, 31, 372–384. [Google Scholar] [CrossRef]
  17. Stettler, M.E.J.; Eastham, S.; Barrett, S.R.H. Air quality and public health impacts of UK airports. Part I: Emissions. Atmos. Environ. 2011, 45, 5415–5424. [Google Scholar] [CrossRef]
  18. Song, S.K.; Shon, Z.H. Emissions of greenhouse gases and air pollutants from commercial aircraft at international airports in Korea. Atmos. Environ. 2012, 61, 148–158. [Google Scholar] [CrossRef]
  19. Winther, M; Kousgaard, U; Ellermann, T.; Massling, A.; Nøjgaard, J.K.; Ketzel, M. Emissions of NOx, particle mass and particle numbers from aircraft main engines, APU’s and handling equipment at Copenhagen Airport. Atmos. Environ. 2015, 100, 218–229. [Google Scholar] [CrossRef]
  20. Mokalled, T.; Le Calve, S.; Badaro-Saliba, N.; Abboud, M.; Zaarour, R.; Farah, W.; Adjizian-Gerard, J. Identifying the impact of Beirut Airport’s activities on local air quality—Part I: Emissions inventory of NO_2 and VOCs. Atmos. Environ. 2018, 187, 435–444. [Google Scholar] [CrossRef]
  21. Innocente, E.; Pecorari, E.; Zannoni, D.; Rampazzo, G. Methodology choice could affect air quality interpretation? A case study for an international airport, Marco Polo, Venice. Sci. Total Environ. 2020, 707, 135236. [Google Scholar] [CrossRef]
  22. Baughcum, S.L.; Tritz, T.G.; Henderson, S.C.; Pickett, D.C. Scheduled Civil Aircraft Emission Inventories for 1992: Database Development and Analysis; National Aeronautics and Space Administration Contractor Report-4700; Langley Research Centre: Hampton, VA, USA, 1996.
  23. Sutkus, D.J., Jr.; Baughcum, S.L.; DuBois, D.P. Commercial Aircraft Emission Scenario for 2020: Database Development and Analysis; NASA/CR-2003-212331; National Aeronautics and Space Administration, Glenn Research Centre: Hanover, MD, USA, 2003.
  24. Fameli, K.M.; Assimakopoulos, V.D. The new open Flexible Emission Inventory for Greece and the Greater Athens Area (FEI-GREGAA): Account of pollutant sources and their importance from 2006 to 2012. Atmos. Environ. 2016, 137, 17–37. [Google Scholar] [CrossRef]
  25. Russoa, M.A.; Relvasa, H.; Gama, C.; Lopes, M.; Borrego, C.; Rodrigues, V.; Robaina, M.; Madaleno, M. Carneiro, M.J.; Eusébio, C.; et al. Estimating emissions from tourism activities. Atmos. Environ. 2020, 220, 117048. [Google Scholar] [CrossRef]
  26. European Aviation Environmental Report 2019. Available online: https://www.easa.europa.eu/eaer/ (accessed on 2 March 2020).
  27. Eyers, C.J.; Norman, P.; Middel, J.; Plohr, M.; Michot, S.; Atkinson, K. AERO2k Global Aviation Emissions Inventories for 2002 and 2025; European Commission, QinetiQ Ltd.: Hampshire, UK, 2004. [Google Scholar]
  28. Federal Aviation Administration Office of Environment and Energy. Global Aviation Emissions Inventories for 2000 through 2004; FAA-EE-2005–02; Federal Aviation Administration Office of Environment and Energy: Washington, DC, USA, 2005.
  29. Kim, B.Y.; Fleming, G.G.; Lee, J.J.; Waitz, I.A.; Clarke, J.P.; Balasubramanian, S.; Malwitz, A.; Klima, K.; Locke, M.; Holslaw, C.A.; et al. System for assessing Aviation’s Global Emissions (SAGE), Part 1: Model description and inventory results. Transp. Res. Part D Transp. Environ. 2007, 12, 325–346. [Google Scholar] [CrossRef]
  30. Wasiuk, D.K.; Khan, M.A.H.; Shallcross, D.E.; Lowenberg, M.H. A Commercial Aircraft Fuel Burn and Emissions Inventory for 2005–2011. Atmosphere 2016, 7, 78. [Google Scholar] [CrossRef] [Green Version]
  31. Xia, Q.; Zuo, H.F.; Yang, J.L. Evaluation of LTO cycle emissions from aircraft in China’ civil aviation airport. Acta Sci. Circumstantiae 2008, 28, 1469–1474. (In Chinese) [Google Scholar]
  32. Fan, W.; Sun, Y.; Zhu, T.; Wen, Y. Emissions of HC, CO, NOx, CO2, and SO2 from civil aviation in China in 2010. Atmos. Environ. 2012, 56, 52–57. [Google Scholar] [CrossRef]
  33. Liu, H.J.; Tian, H.Z.; Hao, Y.; Liu, S.H.; Liu, X.Y.; Zhu, C.Y.; Wu, Y.M.; Liu, W.; Bai, X.X.; Wu, B.B. Atmospheric emission inventory of multiple pollutants from civil aviation in China: Temporal trend, spatial distribution characteristics and emission features analysis. Sci. Total Environ. 2019, 648, 871–879. [Google Scholar] [CrossRef]
  34. Zhang, L.J.; Zheng, J.Y.; Yin, S.S.; Peng, K.; Zhong, L.J. Development of non-road mobile source emission inventory for the pearl river delta region. Environ. Sci. 2010, 31, 886–891. (In Chinese) [Google Scholar]
  35. Wang, R.N.; Huang, C.; Ren, H.J.; Yan, S.S.; Hong, Z.; Xu, C.; Hu, Q.Y. Air pollutant emission inventory from LTO cycles of aircraft in civil aviation airports in the Yangtze River Delta Region. China Acta Sci. Circumstantiae 2018, 38, 4472–4479. (In Chinese) [Google Scholar]
  36. Xu, R.; Lang, J.L.; Yang, X.W. Establishment of aircraft emission inventory for Beijing capital international airport. China Environ. Sci. 2016, 36, 2554–2560. (In Chinese) [Google Scholar]
  37. Bo, X.; Duan, G.; Li, C.Y.; Cai, B.F.; Han, R.R.; Zhou, X.; Lu, L.; Zhao, X.H. Air pollution simulation study of Beijing capital international airport. Environ. Eng. 2017, 35, 97–100. [Google Scholar]
  38. Chu, Y.P. The influence of the aircraft exhausts emissions on air quality near Shanghai Pudong international Airport. Environ. Monit. Forewarn. 2013, 5, 50–52. (In Chinese) [Google Scholar]
  39. Huang, Q.F.; Cheng, G.N.; Hu, D.X.; Hong, C. Analysis of the airplane emission of atmospheric pollutants in Guangzhou Baiyun international airport. Adm. Technol. Environ. Monit. 2014, 26, 57–59. (In Chinese) [Google Scholar]
  40. Ma, J.; Zhou, X. Development of a three-dimensional inventory of aircraft NOx emissions over China. Atmos. Environ. 2000, 34, 389–396. [Google Scholar] [CrossRef]
  41. Han, B.; Liu, Y.T.; Chen, X.; Ren, Q.; Wei, Z.Q. Fine particles emission characterization of civil aviation aircraft during takeoff. Zhongguo Huanjing Kexue/China Environ. Sci. 2017, 37, 1620–1627. (In Chinese) [Google Scholar]
  42. Ministry of Environment Protection of the People’s Republic of China (MEP). Technical Guide for Compilation of Emission Inventory for Primary Inhalable Particulate Matter; MEP: Beijing, China, 2011. [Google Scholar]
  43. Frank, J.; Sandrine, C.; James, S. The Advanced Emission Model (AEM3)-Validation Report. Available online: http://www.eurocontrol.be/eec/gallery/content/public/document/eec/report/2004/036_AEM3_Validation_Exercise.pdf (accessed on 3 January 2020).
  44. Office of the Guangdong-Hong Kong-Macao Greater Bay Area Development Promotion Leader Team (OGBADPLT). 2019. Available online: http://www.cnbayarea.org.cn (accessed on 3 January 2020).
  45. Civil Aviation Airport Production Statistics Bulletin for 2017. Available online: http://www.caac.gov.cn/XXGK/XXGK/TJSJ/201803/t20180307_55600.html (accessed on 3 January 2020).
  46. Alduchov, O.A.; Eskridge, R.E. Improved Magnus’ form approximation of saturation vapor pressure. J. Appl. Meteor. 1996, 35, 601–609. [Google Scholar] [CrossRef]
  47. Eurocontrol Experimental Center (EEC). User Manual for the Base of Aircraft Data (BADA); Revision 3.11, EEC Technical/Scientific Report No. 13/04/16-01; EEC: Les Bordes, France, 2013. [Google Scholar]
  48. ICAO Aircraft Engine Emissions Databank. Available online: https://www.easa.europa.eu/easa-and-you/environment/icao-aircraft-engine-emissions-databank (accessed on 3 January 2020).
  49. International Civil Aviation Organization (ICAO). Annex 16—Environmental Protection Volume 2—Aircraft Engine Emissions, 4th ed.; ICAO: Montreal, QC, Canada, 2017. [Google Scholar]
  50. U.S. Environment Protection Agency (EPA). Control of Air Pollution from Aircraft and Aircraft Engines; Proposed Emission Standards and Test Procedures; Proposed Rule: Rosement, IL, USA, 2011. [Google Scholar]
  51. Wayson, R.L.; Fleming, G.G.; Iovinelli, R. Methodology to estimate particulate matter emissions from certified commercial aircraft engines. J. Air Waste Manag. Assoc. 2009, 59, 91–100. [Google Scholar] [CrossRef] [Green Version]
  52. Chen, L. Measurement and forecast of the emissions from Chinese air transportation LTO and cruise phases. J. Beijing Jiaotong Univ. (Soc. Sci. Ed.) 2013, 12, 27–33. (In Chinese) [Google Scholar]
  53. Fan., S.B.; Xia, L.; Li, X.F. Calculating airport emission with EDMS model. J. Saf. Environ. 2010, 10, 93–96. (In Chinese) [Google Scholar]
  54. Single European Sky ATM Research (SESAR). Available online: http://data.europa.eu/euodp/data/dataset/sesar-solutions-dman-baseline-for-integrated-aman-dman (accessed on 3 January 2020).
  55. Air China. Available online: http://www.airchina.com.cn (accessed on 3 January 2020).
Figure 1. Study area and the locations of the five airports.
Atmosphere 11 00323 g001
Figure 2. Correction coefficient of ЕІ (CCEI) vs. (a) ambient temperature (b) and pressure.
Atmosphere 11 00323 g002
Figure 3. The relationships between the emission changes, (a) reductions in taxi-in time, and (b) reductions in taxi-out time.
Atmosphere 11 00323 g003
Figure 4. The aircraft (a) emission factors and (b) total emission factors per seat for different aircraft types.
Atmosphere 11 00323 g004
Figure 5. The proportion of aircraft types at different airports in the GBA in 2017.
Atmosphere 11 00323 g005
Table 1. The meteorological characteristics of the airports in the Guangdong–Hong Kong–Macao Greater Bay Area (GBA) in 2017.
AirportTemperature (°C)Pressure (hPa)Relative Humidity (%)
RangeAverageRangeAverageRangeAverage
ZGGG4.4–38.923.4992.9–1031.21013.111.9–10070.9
VHHH8.9–37.224.8984.1–1030.11012.613.4–10070.6
ZGSZ7.2–37.823.9989.8–1030.11013.016.5–10074.3
ZGSD7.8–37.223.6972.9–1030.11012.529.5–10081.4
VMMC7.8–37.223.6972.9–1030.11012.529.5–10081.4
Summary4.4–38.923.9972.9–1031.21012.711.0–10075.9
Table 2. Aircraft types in the GBA airport cluster in 2017.
IDAircraft TypeEngine ModelEngine NumberFlightsPercentages (%)
1A320V2500-A12334,92024.6
2B738CFM56-7B262334,20224.6
3A321CFM56-5B22162,17711.9
4A333CF6-80E1A22126,3909.3
5B77WGE90-115B259,7484.4
6A319V2522-A5245,6033.4
7A332Trent 772237,1802.7
8B744CF6-80C2B1F428,0292.1
9B737JT8D-17A225,9811.9
10E190CF34-10E6217,6801.3
11B77LGE90-110B1217,4881.3
12B788Trent 1000-A215,5571.1
13B763PW4060213,9391.0
14B733CFM56-3-B1213,8771.0
15A359Trent XWB-84213,6371.0
16B748GEnx-2B67B413,3591.0
17others--100,1077.4
Total 1,359,875100.0
Table 3. Aircraft landing and take-off (LTO) emissions of the five major airports in the GBA in 2017 (in tons).
AirportsLTO
Number
NOxCOHCSO2PMTotal
ISAActualISAActualISAActual--ISAActual
ZGGG232,6484301.23605.72745.43040.6305.7338.5227.228.87608.37240.8
VHHH210,5007235.35927.94568.15092.1505.1562.8336.942.412,687.811,962.1
ZGSZ170,1932716.52214.61682.51874.9174.3194.0146.818.24738.34448.5
ZGSD37,347469.0375.0243.2270.324.927.725.43.3765.8701.6
VMMC29,250425.5341.1319.3354.127.430.423.63.0798.8752.2
Total679,93815147.512,464.39558.510,632.01037.41153.4759.995.626,599.025,105.2
Table 4. Calculated aircraft emissions factors at the five major airports in GBA in 2017 compared with other airports (kg/LTO).
AirportYearLTO CycleNOx 2COHCSO2 2PM 2TotalReference
China2011-16.39.12.71.4-29.5[42]
China20112,989,83215.19.41.01.1-26.6[52]
YRD*2017834,13419.79.90.91.40.232.1[35]
GBA2017679,93718.315.61.71.10.136.9This study
ZGGG2012186,65714.6–15.77.9–9.00.9–1.01.0–1.10.1-[39,52]
ZGGG2017232,64815.513.11.51.00.131.1This study
VHHH2017210,50028.224.22.71.60.256.8This study
ZGSZ2017170,19313.011.01.10.90.126.1This study
ZGSD201737,34710.07.20.70.70.118.8This study
VMMC201729,25011.712.11.00.80.125.7This study
ZBAA 12015295,10014.7–25.69.1–12.81.0–1.21.1–1.60.1–0.5-[9,14,36,52,53]
LTBA 12001160,9017.812.92.30.4--[16]
KATL 12000423,42311.612.32.11.10.227.3[15]
RKSI 12010214,83517.08.1-1.30.126.5[18]
Notes:1 The abbreviations of the region and its airports are as follows: Yangtze River Delta (YRD), Beijing (ZBAA), Ataturk (LTBA), Atlanta (KATL), Incheon (RKSI); 2 NOx, SOx, and PM may be reported as NO2, SO2, and PM2.5 in some papers, respectively.
Table 5. Aircraft emissions in the GBA airports in 2017 during different LTO operation phases (tons).
PhaseNOxCOHCSO2PMTotal
Approach1475.2618.682.1121.214.02310.9
Taxiing1654.49825.81032.5324.933.912,871.4
Take-off3195.939.610.688.214.93349.0
Climb-out6138.9148.128.3225.732.96573.9
Total emission12,464.310,632.01153.4759.995.625,105.2
Table 6. Comparison of the fuel flow rates and the EIs of NOx, CO, and HC for A320, B77L, B77W, and B744.
PhaseWff (kg/s)NOx (g/kg)CO (g/kg)HC (g/kg)
A320B77LB77WB744A320B77LB77WB744A320B77LB77WB744A320B77LB77WB744
Approach0.3341.081.1130.63213.4515.7816.508.970.772.291.982.190.150.060.060.2
Taxiing0.1240.370.3800.2055.9105.115.193.747.7640.5939.1143.710.224.554.249.68
Take-off1.1134.324.6902.35337.1344.4450.3428.060.550.070.080.520.10.030.040.08
Climb-out0.9243.473.6701.91330.8233.8535.9821.340.550.070.070.520.110.030.030.09

