Article

Advanced Ultraviolet Radiation and Ozone Retrieval for Applications—Surface Ultraviolet Radiation Products

1
Finnish Meteorological Institute, Atmospheric Research Centre of Eastern Finland, 70211 Kuopio, Finland
2
Istituto di Fisica Applicata Nello Carrara del Consiglio Nazionale delle Ricerche (IFAC-CNR), I-50019 Sesto Fiorentino, Italy
3
Department of Atmospheric Composition, Royal Belgian Institute for Space Aeronomy (BIRA-IASB), 1180 Brussels, Belgium
4
Flyby, S.r.l., I-57128 Livorno, Italy
*
Author to whom correspondence should be addressed.
Atmosphere 2020, 11(4), 324; https://doi.org/10.3390/atmos11040324
Submission received: 7 February 2020 / Revised: 18 March 2020 / Accepted: 25 March 2020 / Published: 27 March 2020
(This article belongs to the Special Issue Stratospheric Ozone: In Situ and Remote Sensing Observation)

Abstract

:
AURORA (Advanced Ultraviolet Radiation and Ozone Retrieval for Applications) is a three-year project supported by the European Union in the frame of its H2020 Call (EO-2-2015) for “Stimulating wider research use of Copernicus Sentinel Data”. The project addresses key scientific issues relevant for synergistic exploitation of data acquired in different spectral ranges by different instruments on board the atmospheric Sentinels. A novel approach, based on the assimilation of geosynchronous equatorial orbit (GEO) and low Earth orbit (LEO) fused products by application of an innovative algorithm to Sentinel-4 (S-4) and Sentinel-5 (S-5) synthetic data, is adopted to assess the quality of the unique ozone vertical profile obtained in a context simulating the operational environment. The first priority is then attributed to the lower atmosphere with calculation of tropospheric columns and ultraviolet (UV) surface radiation from the resulting ozone vertical distribution. Here we provide details on the surface UV algorithm of AURORA. Both UV index (UVI) and UV-A irradiance are provided from synthetic satellite measurements, which in turn are based on atmospheric scenarios from MERRA-2 (Modern-Era Retrospective analysis for Research and Applications, Version 2) re-analysis. The UV algorithm is implemented in a software tool integrated in the technological infrastructure developed in the context of AURORA for the management of the synthetic data and for supporting the data processing. This was closely linked to the application-oriented activities of the project, aimed to improve the performance and functionality of a downstream application for personal UV dosimetry based on satellite data. The use of synthetic measurements from MERRA-2 gives us also a “ground truth”, against which to evaluate the performance of our UV model with varying inputs. In this study we both describe the UV algorithm itself and assess the influence that changes in ozone profiles, due to the fusion and assimilation, can cause in surface UV levels.

1. Introduction

The major leap forward in quality and quantity of atmospheric composition data expected from the geosynchronous equatorial orbit (GEO) Sentinel-4 (S-4) and the low Earth orbit (LEO) Sentinel-5(p) (S-5) missions of the Copernicus Programme is going to enhance remarkably our capability for profiling key minor constituents of the Earth’s atmosphere. In the context of the AURORA (Advanced Ultraviolet Radiation and Ozone Retrieval for Applications) Horizon 2020 project, the novel potential of S-4 and S-5(p) was thoroughly investigated for extension to further enhance quality products derived from space-borne data synergy based on sequential application of innovative data-fusion techniques and state-of-the art data assimilation systems [1].
The focus of the project, primarily oriented to explore the feasibility of assimilating fused data from simulated observations acquired in different spectral regions and from different viewing geometries, was the vertical profile of atmospheric ozone. Specific relevance was assigned to evaluate the impact of the novel strategy for synergistic data processing on the capability to retrieve information on the lower layers of the troposphere and, in particular, on the partial column(s) of tropospheric ozone and on ultraviolet radiation at the surface.
The present paper describes the results of the study devoted to the investigation of AURORA Ultraviolet radiation products, covering the full span explored by the project from the scientific aspects, through the development of technological tools, to the implementation of new applications and services.
The approach to estimate surface ultraviolet (UV) radiation from satellite measurements, suggested by [2], is a pioneering work in the field of satellite-based UV algorithms. Their method was applied with the Total Ozone Mapping Spectrometer (TOMS) measurements. Thereafter, several other algorithms have been developed, e.g., the algorithm for the Ozone Monitoring Instrument (OMI) measurements with a heritage of the TOMS algorithm [3]. The most recent operational satellite-based UV algorithm is the one developed for TROPOMI measurements [4]. The main focus with the satellite-UV algorithm developed in AURORA was to carefully assess the impact of data assimilation and fusion of ozone profiles in the output of surface UV.
In Section 2, the AURORA surface UV radiation model is described. Section 3 contains the verification of the surface UV radiation model and an evaluation of the surface UV for data fusion and assimilation products is shown in Section 4. Section 5 reviews the AURORA technological infrastructure and applications of surface UV data. Finally, in Section 6 discussion and conclusions are given.

2. Ultraviolet (UV) Radiation Model

To compute the UV radiation at the surface, the radiative transfer of the solar radiation through the atmosphere has to be simulated. The AURORA UV radiation model is based on a radiative transfer simulation. In this simulation, a system of differential equations is solved and the UV radiation at different points of the atmosphere is solved. In the simulations, for example, the concentration of ozone, atmospheric aerosols, and the interaction between the solar radiation and clouds are taken into account. We use an atmospheric radiative transfer software, libRadtran [5,6], to simulate the radiative transfer. The simulations are carried out to compute the UV radiation on a single surface point at a single moment and, therefore, the spatial and temporal resolution of the UV radiation model is only limited by the resolutions of the required input variables such as the concentration of ozone. As the full atmospheric radiative transfer computations are computationally very expensive and would not allow data processing at large scale, we use the so-called look-up table (LUT) approach to implement our UV radiation model. In the look-up table approach, a precomputed table of surface UV radiation values corresponding to certain input parameters is used and the model evaluations are carried out as an interpolation of the table. This makes the UV radiation model computationally very efficient and allows for large-scale data processing fulfilling the needs of the AURORA project. For a schematic figure of the UV radiation processor based on the AURORA UV radiation model, see Figure 1.

2.1. Model Inputs

The surface UV radiation depends on various variables. The AURORA UV radiation model uses the US Standard Atmosphere 1976 [7] as a model for the atmosphere. The seven input variables given to the radiation model to compute the quantities related to the surface UV radiation are the total column ozone, surface elevation, surface albedo, aerosol optical depth, single scattering albedo of aerosols, solar zenith angle, and cloud optical thickness. More detailed description of the input variables can be found below. The AURORA UV radiation model inputs are also listed in Table 1.
The ozone in the atmosphere significantly affects the surface UV radiation. In the AURORA UV radiation model, the total column ozone is used as one of the input variables and this information typically is taken from another AURORA data product. The total column ozone is a parameter that describes the total number of ozone molecules in the path of solar radiation transfer through the atmosphere. The total column ozone for the AURORA UV radiation model is given in Dobson units (DU).
The elevation of the surface is one of the AURORA UV radiation model inputs. In our model, the surface elevation information corresponding to a certain location is taken from a digital elevation model (DEM). The unit of the surface elevation used in the AURORA UV radiation model is meters. In the UV radiation model, we use the United States National Oceanic and Atmospheric Administration (NOAA) ETOPO2v2g DEM. The ETOPO2v2g DEM covers the whole globe and the spatial resolution of the DEM is 1/30 by 1/30 degrees (roughly 3 km at the equator). Over oceans, the surface elevation is set to 0 m. The ETOPO2v2g digital elevation model is shown in Figure A1 in the Appendix A.
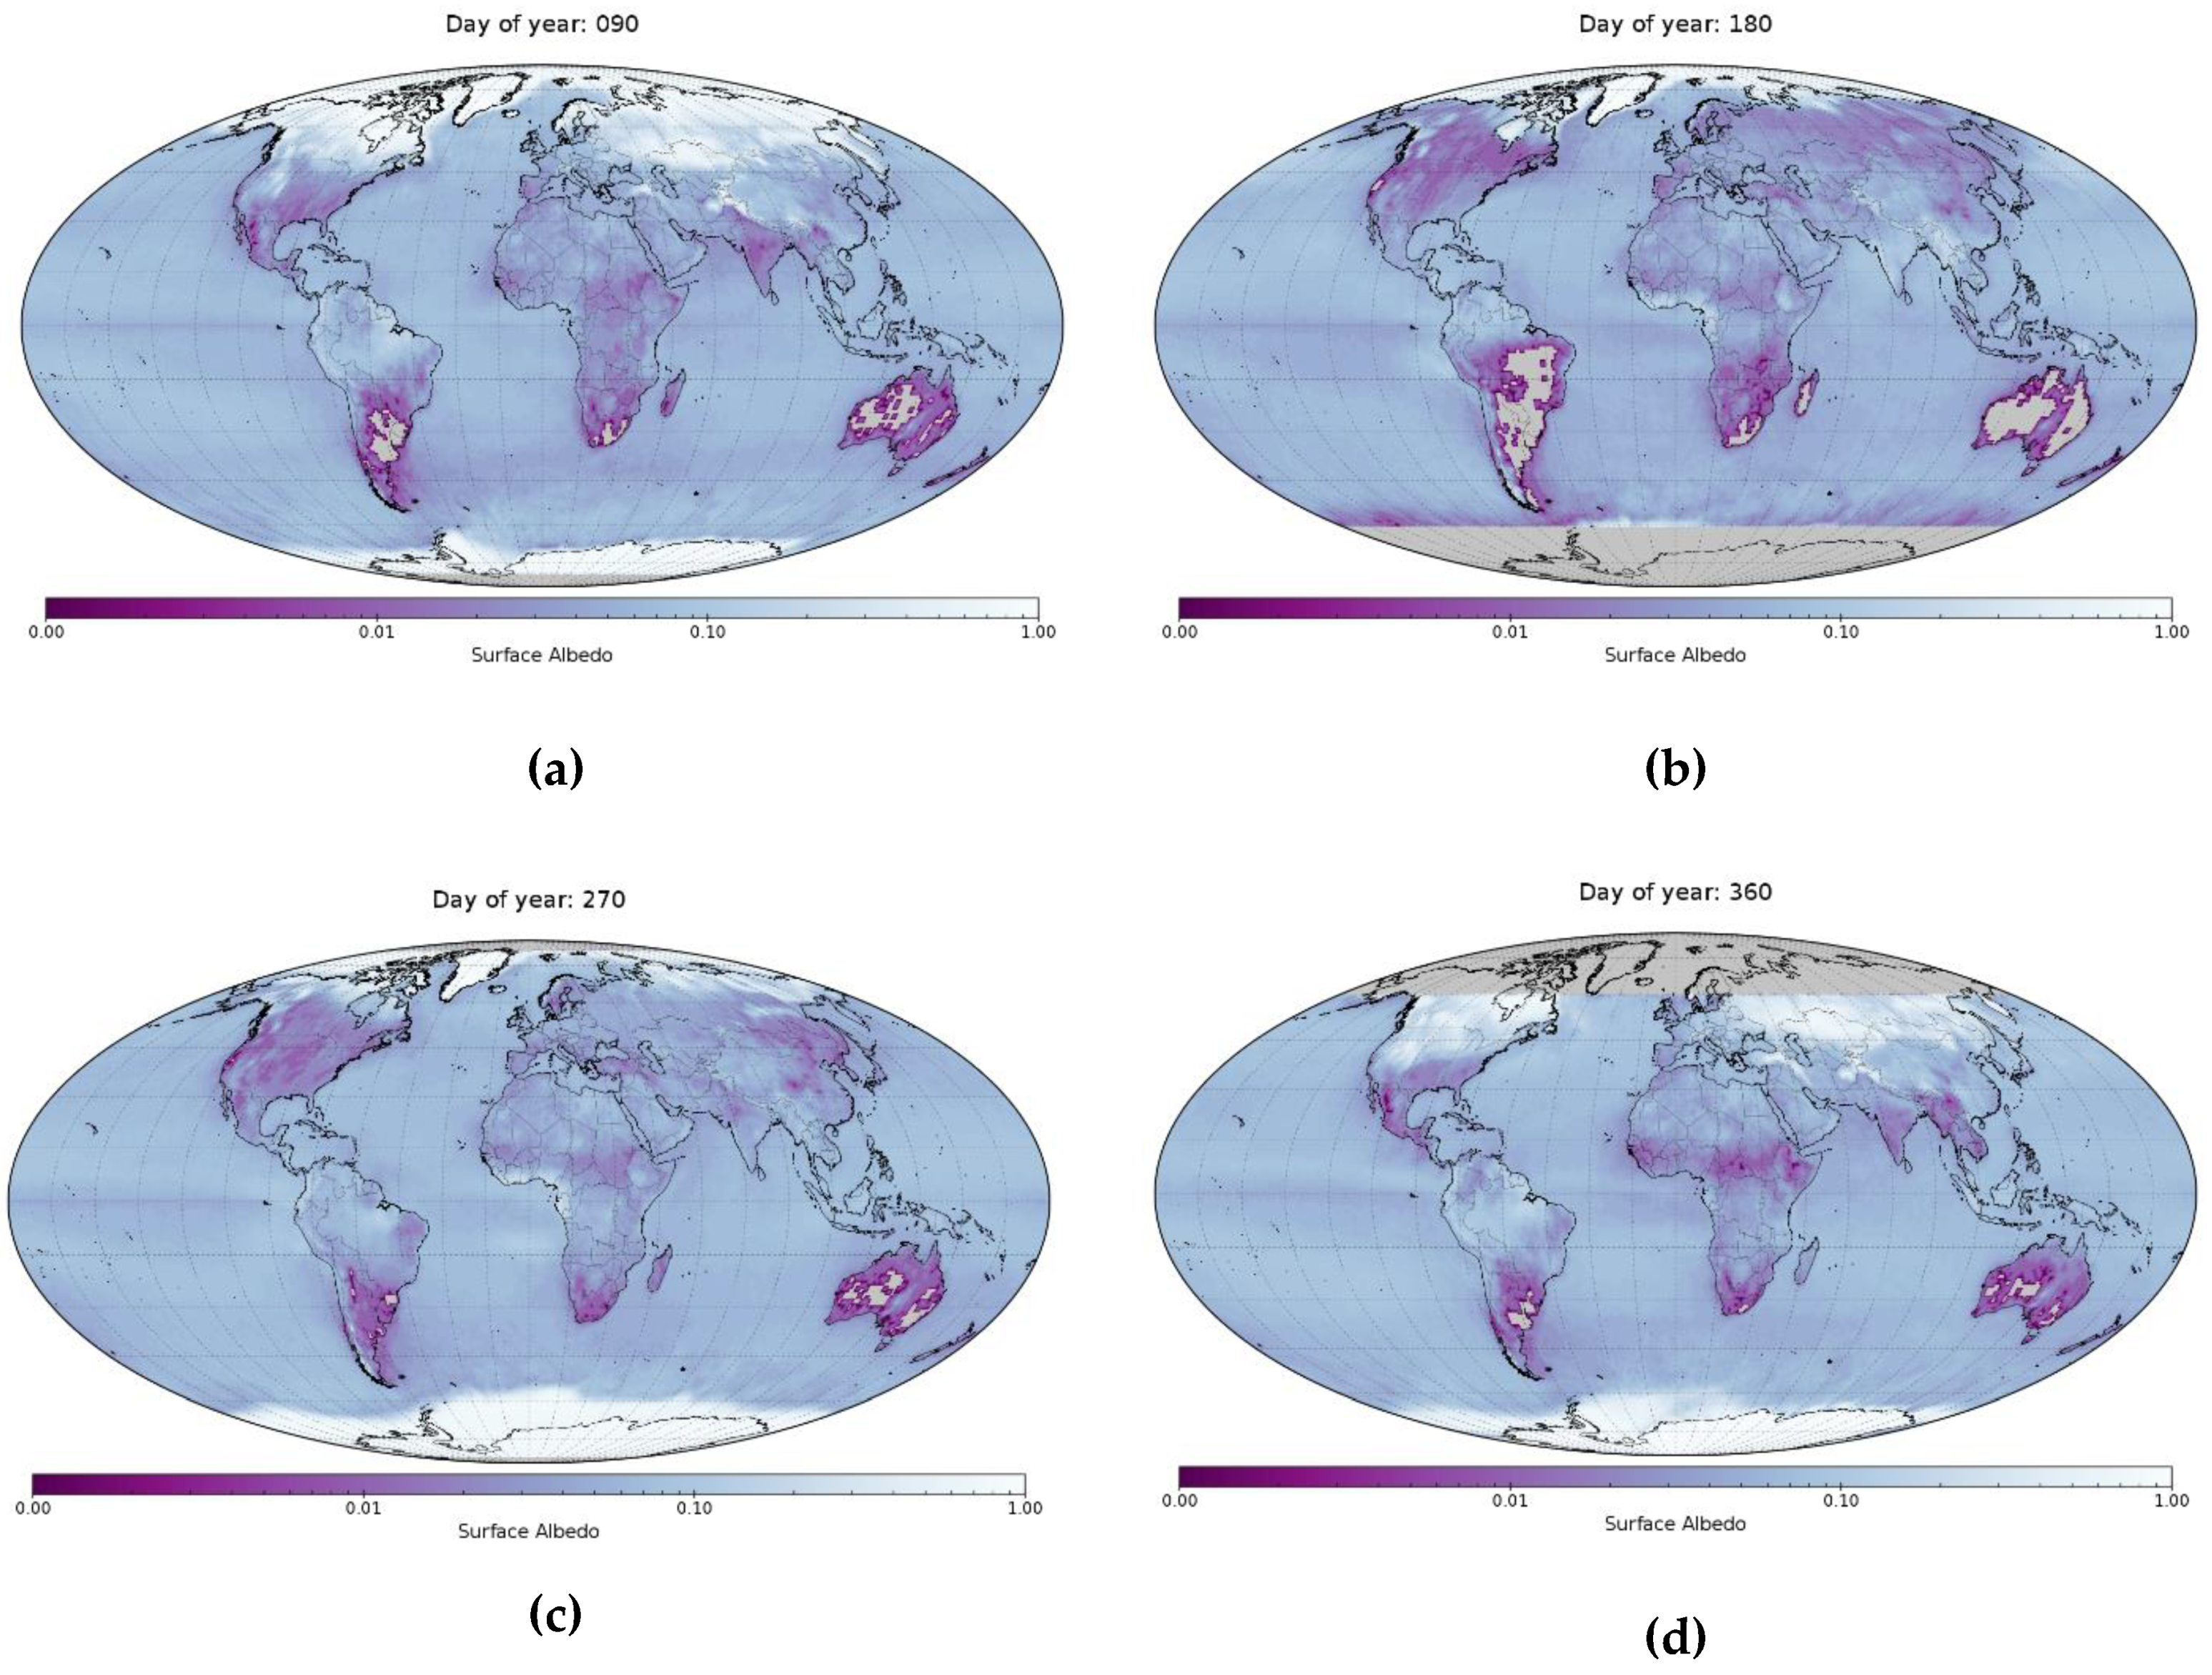
The surface albedo is the ratio of the upwelling to downwelling solar irradiance at the surface. The albedo is a dimensionless number which strongly depends on the wavelength. In the AURORA UV radiation model, by assuming a constant value over the UV wavelengths, we use the surface albedo at 360 nm for representing the UV albedo. The albedo values are taken from the Lambertian Surface Albedo Climatology at 360 nm from Total Ozone Mapping Spectrometer (TOMS) data using the moving time-window technique [8,9]. The climatology has a temporal resolution of one day and spatial resolution of 1 by 1 degrees (approximately 100 km at the equator). The climatology is based on satellite data and constructed using data from the years 1979–1992. The surface albedo for four different days is shown in Figure A2.
Aerosol particles are small solid or liquid particles suspended in the air. Aerosols interact with solar radiation and, therefore, also affect the UV radiation at the surface. The aerosol optical depth (AOD) is a measure of extinction (absorption and scattering) of the solar radiation by the aerosols. The AOD is a dimensionless parameter. In the AURORA UV radiation model, we use a climatology of AOD based on Max Planck Institute aerosol climatology version 2 (MAC-v2) [10]. The MAC-v2 has a temporal resolution of one month and spatial resolution of 1 by 1 degrees (approximately 100 km at the equator). AOD is also spectral parameter and in the AURORA UV radiation model the AOD at 310 nm and 350 nm are used for UVI and UV-A computations, respectively. In Figure A3, the climatological values of AOD at 310 nm are shown corresponding to March, June, September, and December.
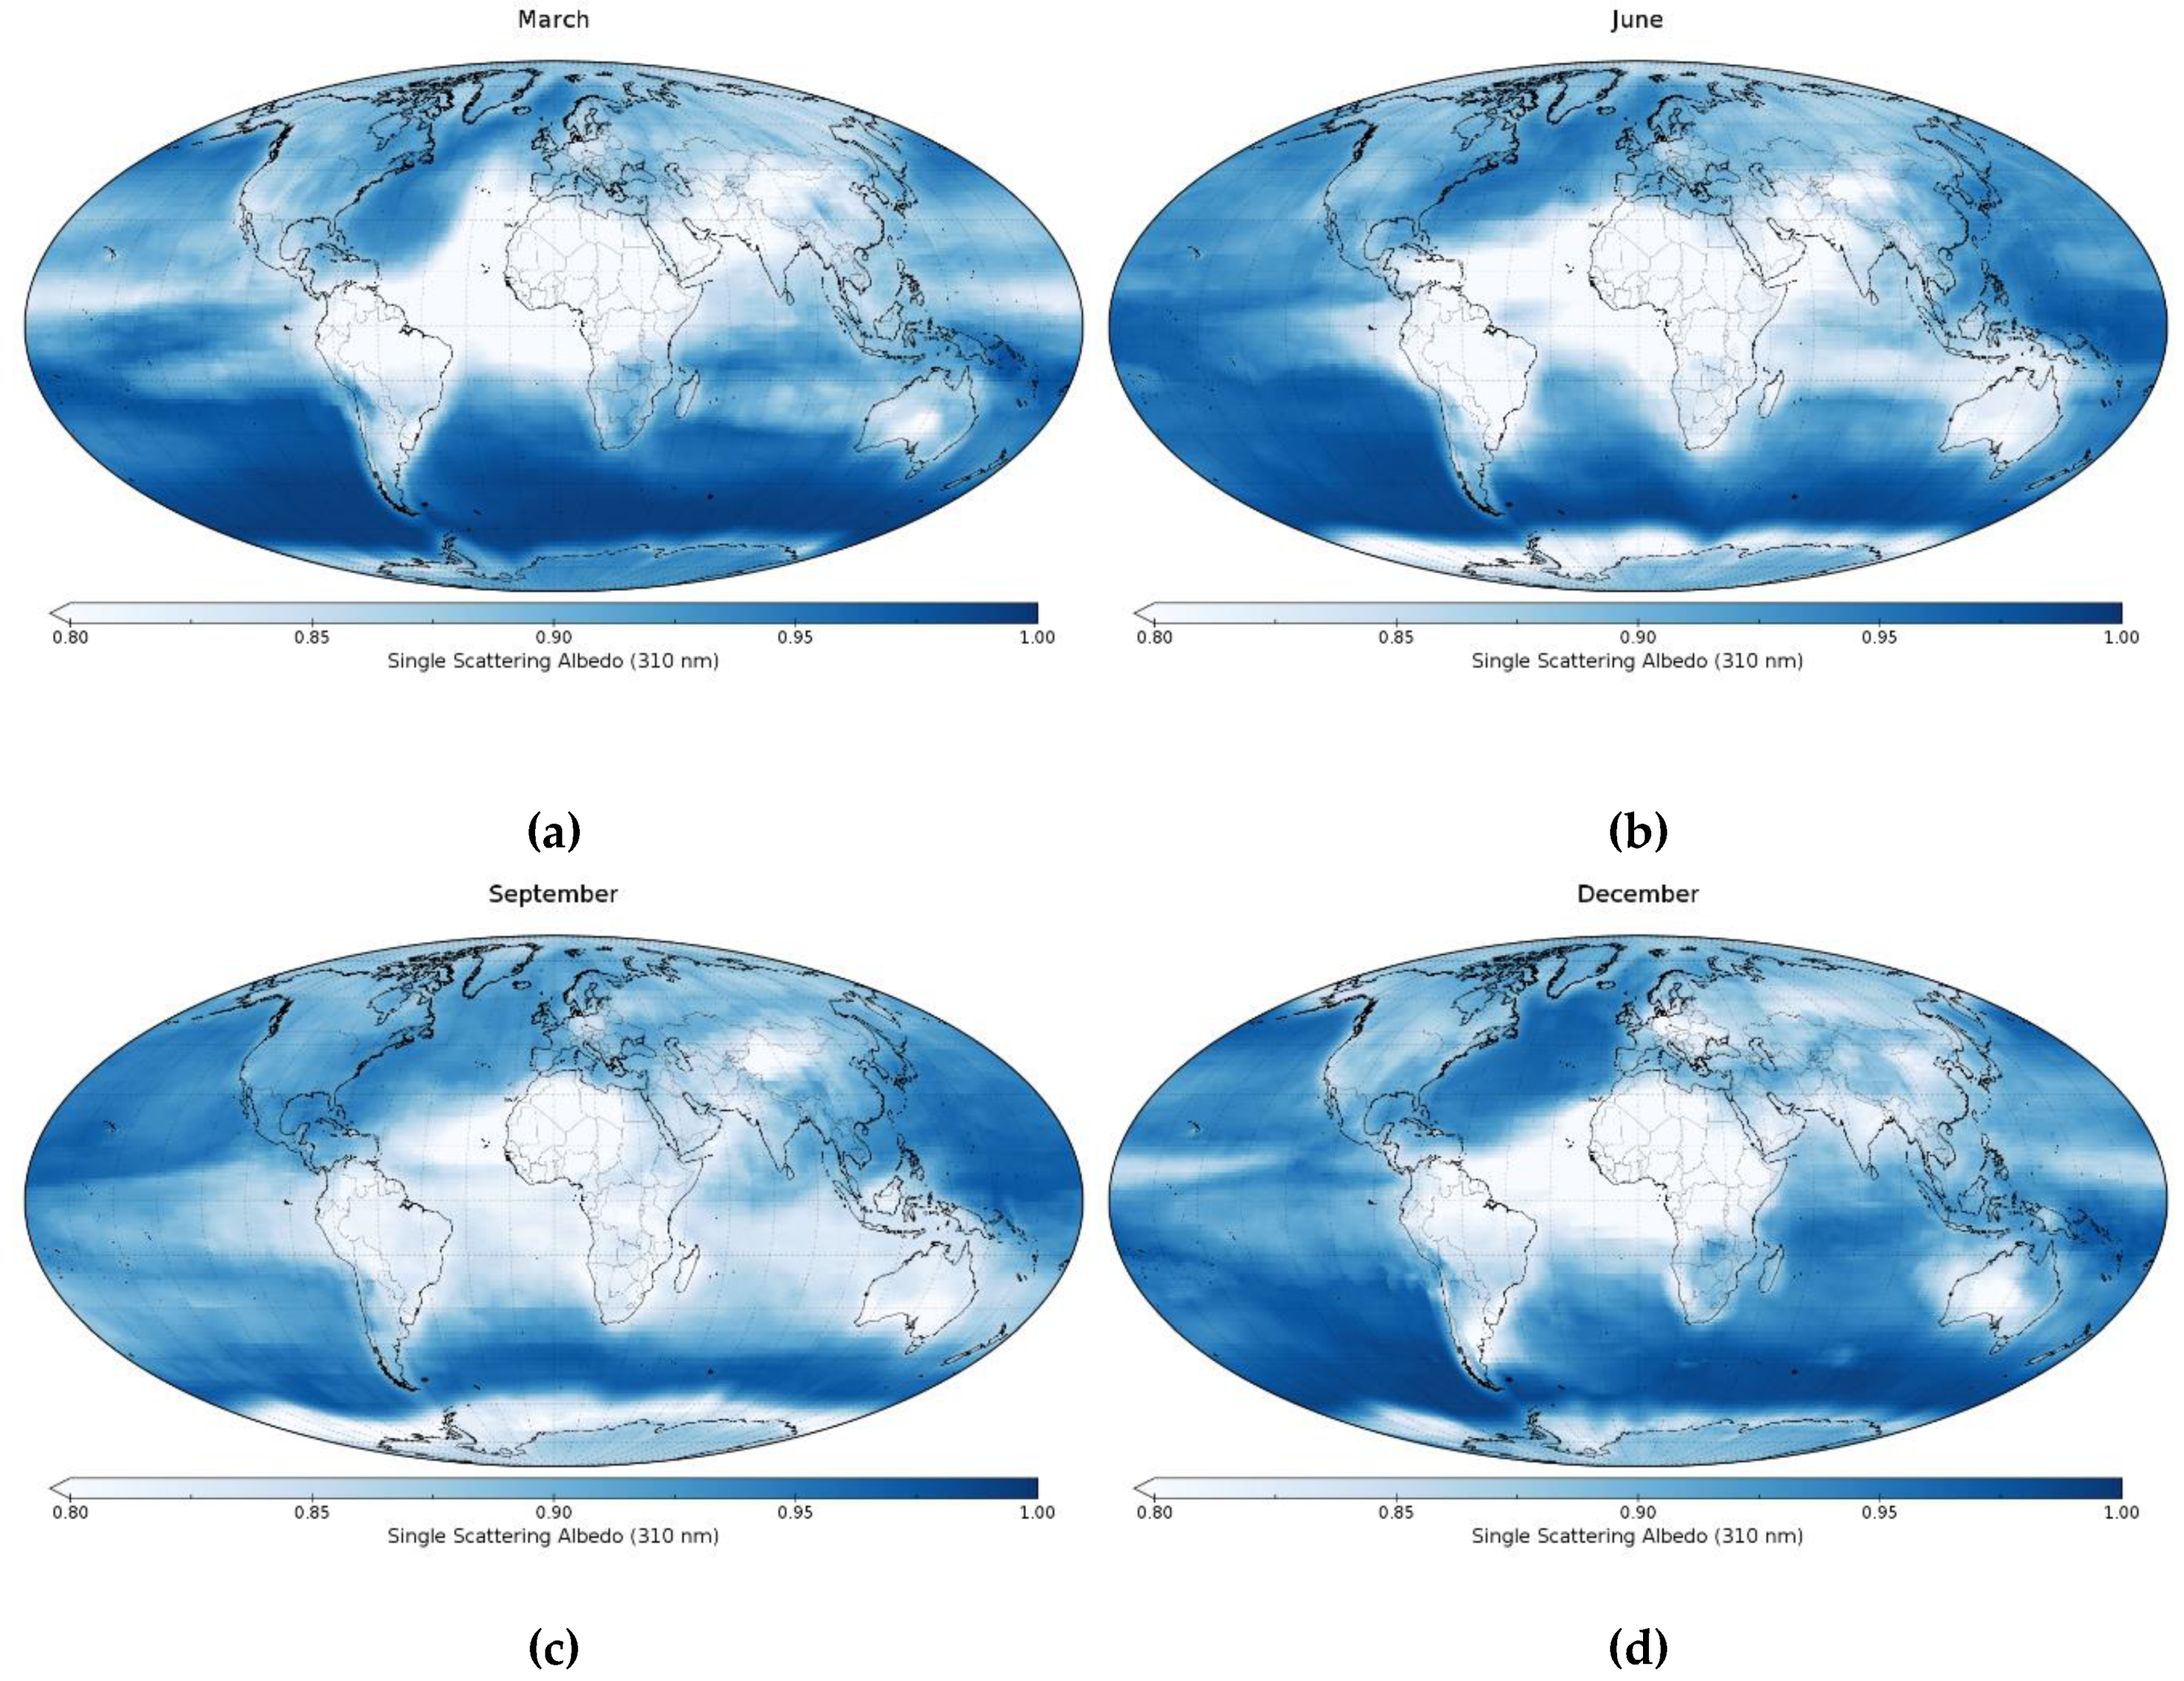
Aerosol particles may scatter or absorb solar radiation. Single scattering albedo (SSA) is a parameter that describes the scattering part of the aerosol extinction. SSA value of 1 means there is no absorption of solar radiation by the aerosol particles, and the value of 0 means that the solar radiation is fully absorbed by the aerosol particles. Values between 0 and 1 mean that the aerosol particles are both scattering and absorbing solar radiation. In AURORA UV radiation model, the MAC-v2 aerosol climatology is also used for the SSA values. The MAC-v2 has a temporal resolution of one month and spatial resolution of 1 by 1 degrees (roughly 100 km at the equator). SSA is also a spectral parameter. Similar to the AOD, the UV radiation model uses the SSA at 310 nm and 350 nm for the UVI and UV-A computations, respectively. Figure A4 shows the climatological values of SSA at 310 nm for four months: March, June, September, and December.
Solar zenith angle (SZA) describes the position of the sun. It is defined as the angle between the zenith and the centre of the sun’s disc. When the sun is shining from the zenith (directly above the observer) SZA is 0. The unit of the SZA used in the AURORA UV radiation model is degrees. SZA is computed based on time, date and location. Typically in clear-sky conditions, the UV radiation at the surface reaches the daily maximum when the SZA is at daily minimum.
The clouds interact with solar radiation and, therefore, also affect the surface UV radiation. In the presence of clouds, the UV radiation at the surface is typically smaller than in clear-sky conditions. The AURORA UV radiation model has a support to take into account the clouds. Generally, the clouds are accounted for by the cloud optical thickness (COT). If the cloud information is available, the radiation model takes the COT into account in the computation of UV radiation. The spatial and temporal resolution of the AURORA UV radiation model only depend on the resolutions of the cloud information. If cloud information is not available it is possible to compute UV radiation quantities corresponding to clear-sky conditions. This is carried out by setting the COT input as 0. The UV radiation quantities computed with zero COT are referred to as the clear-sky UV index or clear-sky UV-A.

2.2. Model Outputs

UV radiation covers the spectrum between 100–400 nm. From the UV spectral irradiance at surface, several quantities can be derived. The AURORA UV radiation provides two well-known UV products: UV index and UV-A irradiance.

2.2.1. Ultraviolet (UV) Index

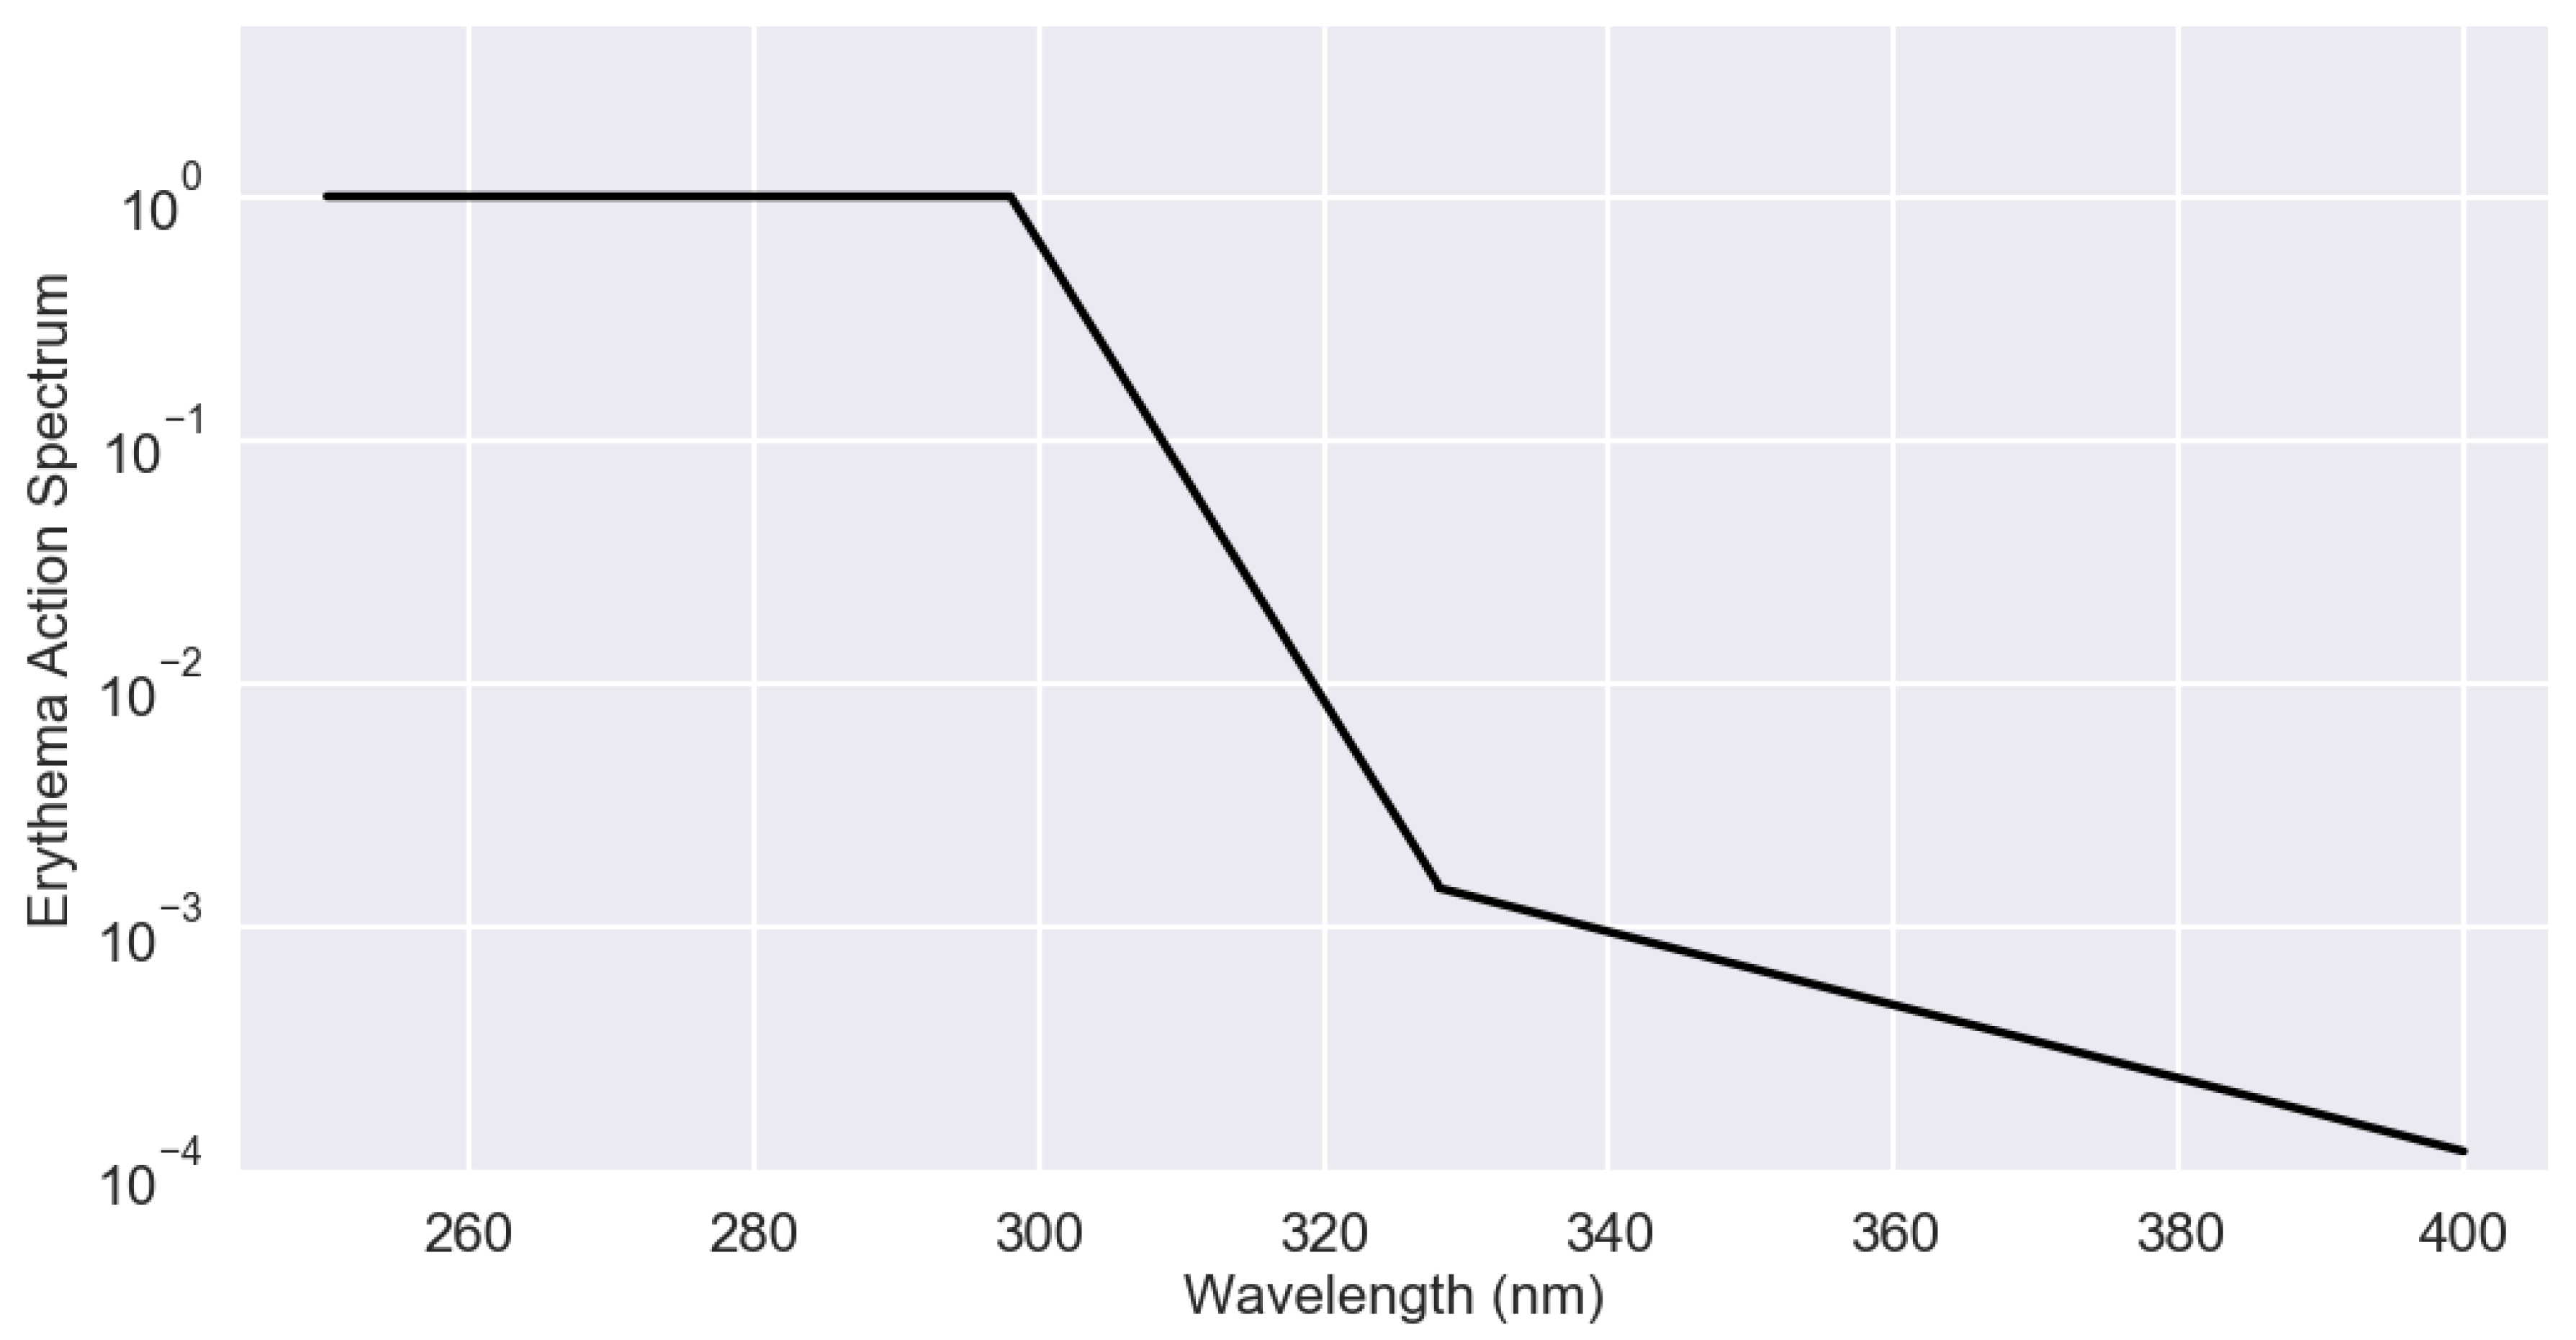
UV index (UVI) is a measure for solar UV radiation. It is a very popular quantity to inform the public about UV levels. The values of the UVI range from zero upward—the higher the UVI, the greater the potential for damage to the skin and eye, and the shorter time it takes for the harm to occur [11]. For instance, when UV index reaches level 3 it is recommended to protect the human skin against UV radiation. In Northern Europe, the typical daily maximum UVI reached in summer-time is about 5–6 and over the Mediterranean region, UVI is about 8–10. Near the Equator or in highly elevated locations the UV radiation can be very high and the UVI may reach the value of 11 or even greater. UVI is one of the outputs of the AURORA UV radiation model. In the computation of the UV index from UV solar spectral radiation, the erythema action spectrum defined in [12] is used and the UVI is computed using the formula as follows:
UVI = k e r × 250 nm 400 nm E λ ( λ ) S e r ( λ ) d λ = k e r × E e r ,
where E λ is the spectral UV irradiance from the Sun and sky that is received on a horizontal surface, E e r is the erythemally weighted irradiance, k e r = 40   m 2 W 1 , and s e r denotes the erythema action spectrum. Figure 2 shows the erythema action spectrum s e r .

2.2.2. UV-A Irradiance

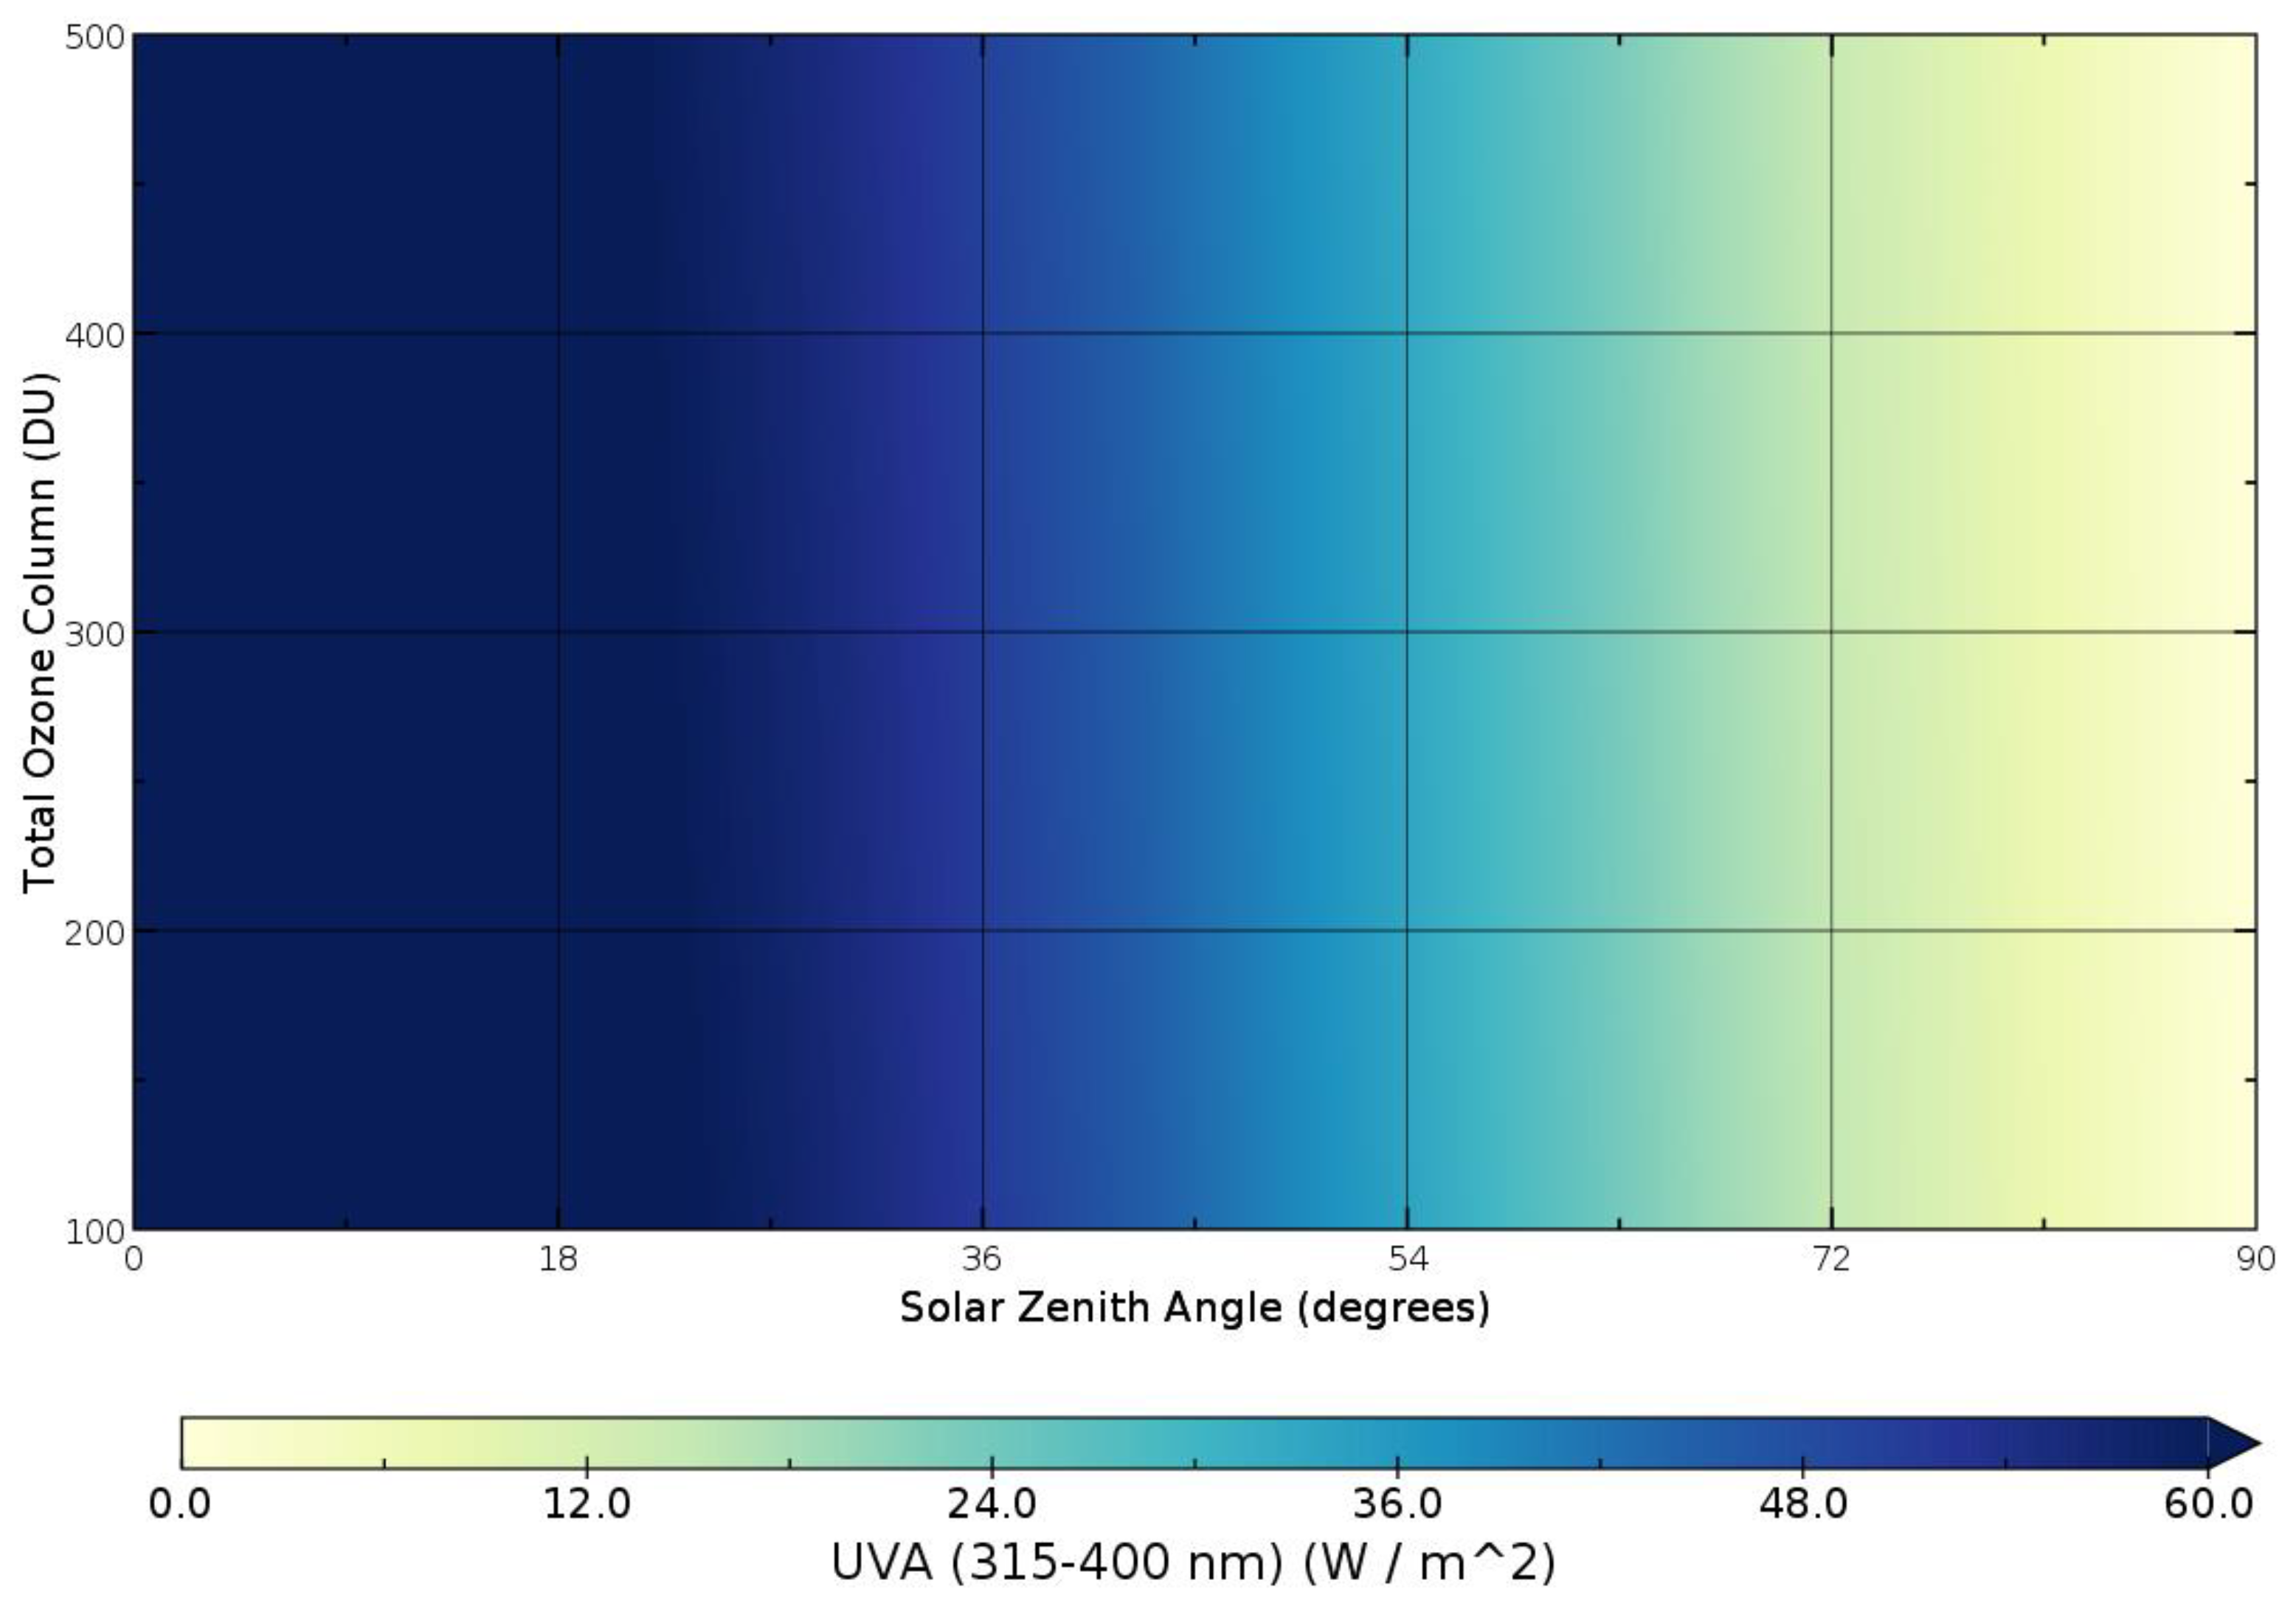
UV-A irradiance is a quantity that is defined by the UV radiation between 315–400 nm. The UV-A radiation plays an important part in skin aging and wrinkling, and UV-A also contributes to the development of skin cancers [13,14]. The unit of the UV-A irradiance is W/m2. In the AURORA UV radiation model computations, all wavelengths at the UV-A interval are weighted equally. In the AURORA UV radiation model, the UV-A is computed using the formula:
UVA = 315 nm 400 nm E λ ( λ ) d λ .

2.3. Look-up Table (LUT)

To reach high computational efficiency, the AURORA UV radiation model is based on the look-up table (LUT) approach. In the LUT approach, a precomputed table consisting of radiative transfer output values corresponding to certain pre-defined combinations of input parameter values are used. The LUT model is evaluated by linearly interpolating the output values from the LUT using some input parameter values.
In our LUT approach, first the minimum and maximum values for the input parameters were defined. Furthermore, a sensitivity analysis of the full radiative transfer model was carried out. In the sensitivity analysis, the full radiative transfer model was used and the average sensitivity of the output to the change of the input parameter was computed for the full input parameter range. Furthermore, the LUT points for the input parameters were selected so that the points are at the locations of the highest sensitivities. This resulted into more input points close to the highest sensitivities and thus minimizes the errors and uncertainties of the LUT model. Finally, the full radiative transfer simulations were run for each input parameter value combination and the LUTs were saved for later use. Separate tables were computed for UVI and UV-A outputs using the same input values. LUT inputs and their value intervals used to construct the LUTs are shown in Table 1. In the radiative transfer computations the aerosol asymmetry parameter was set to a fixed value of 0.7. In the evaluation of the AURORA UV radiation model LUT, the input parameters are not extrapolated but set to the closest possible value found in the LUT.
The LUT was computed for the relative Sun–Earth distance of 1, and in the evaluation of the LUT outputs are weighted based on Sun–Earth distance of the specific day.
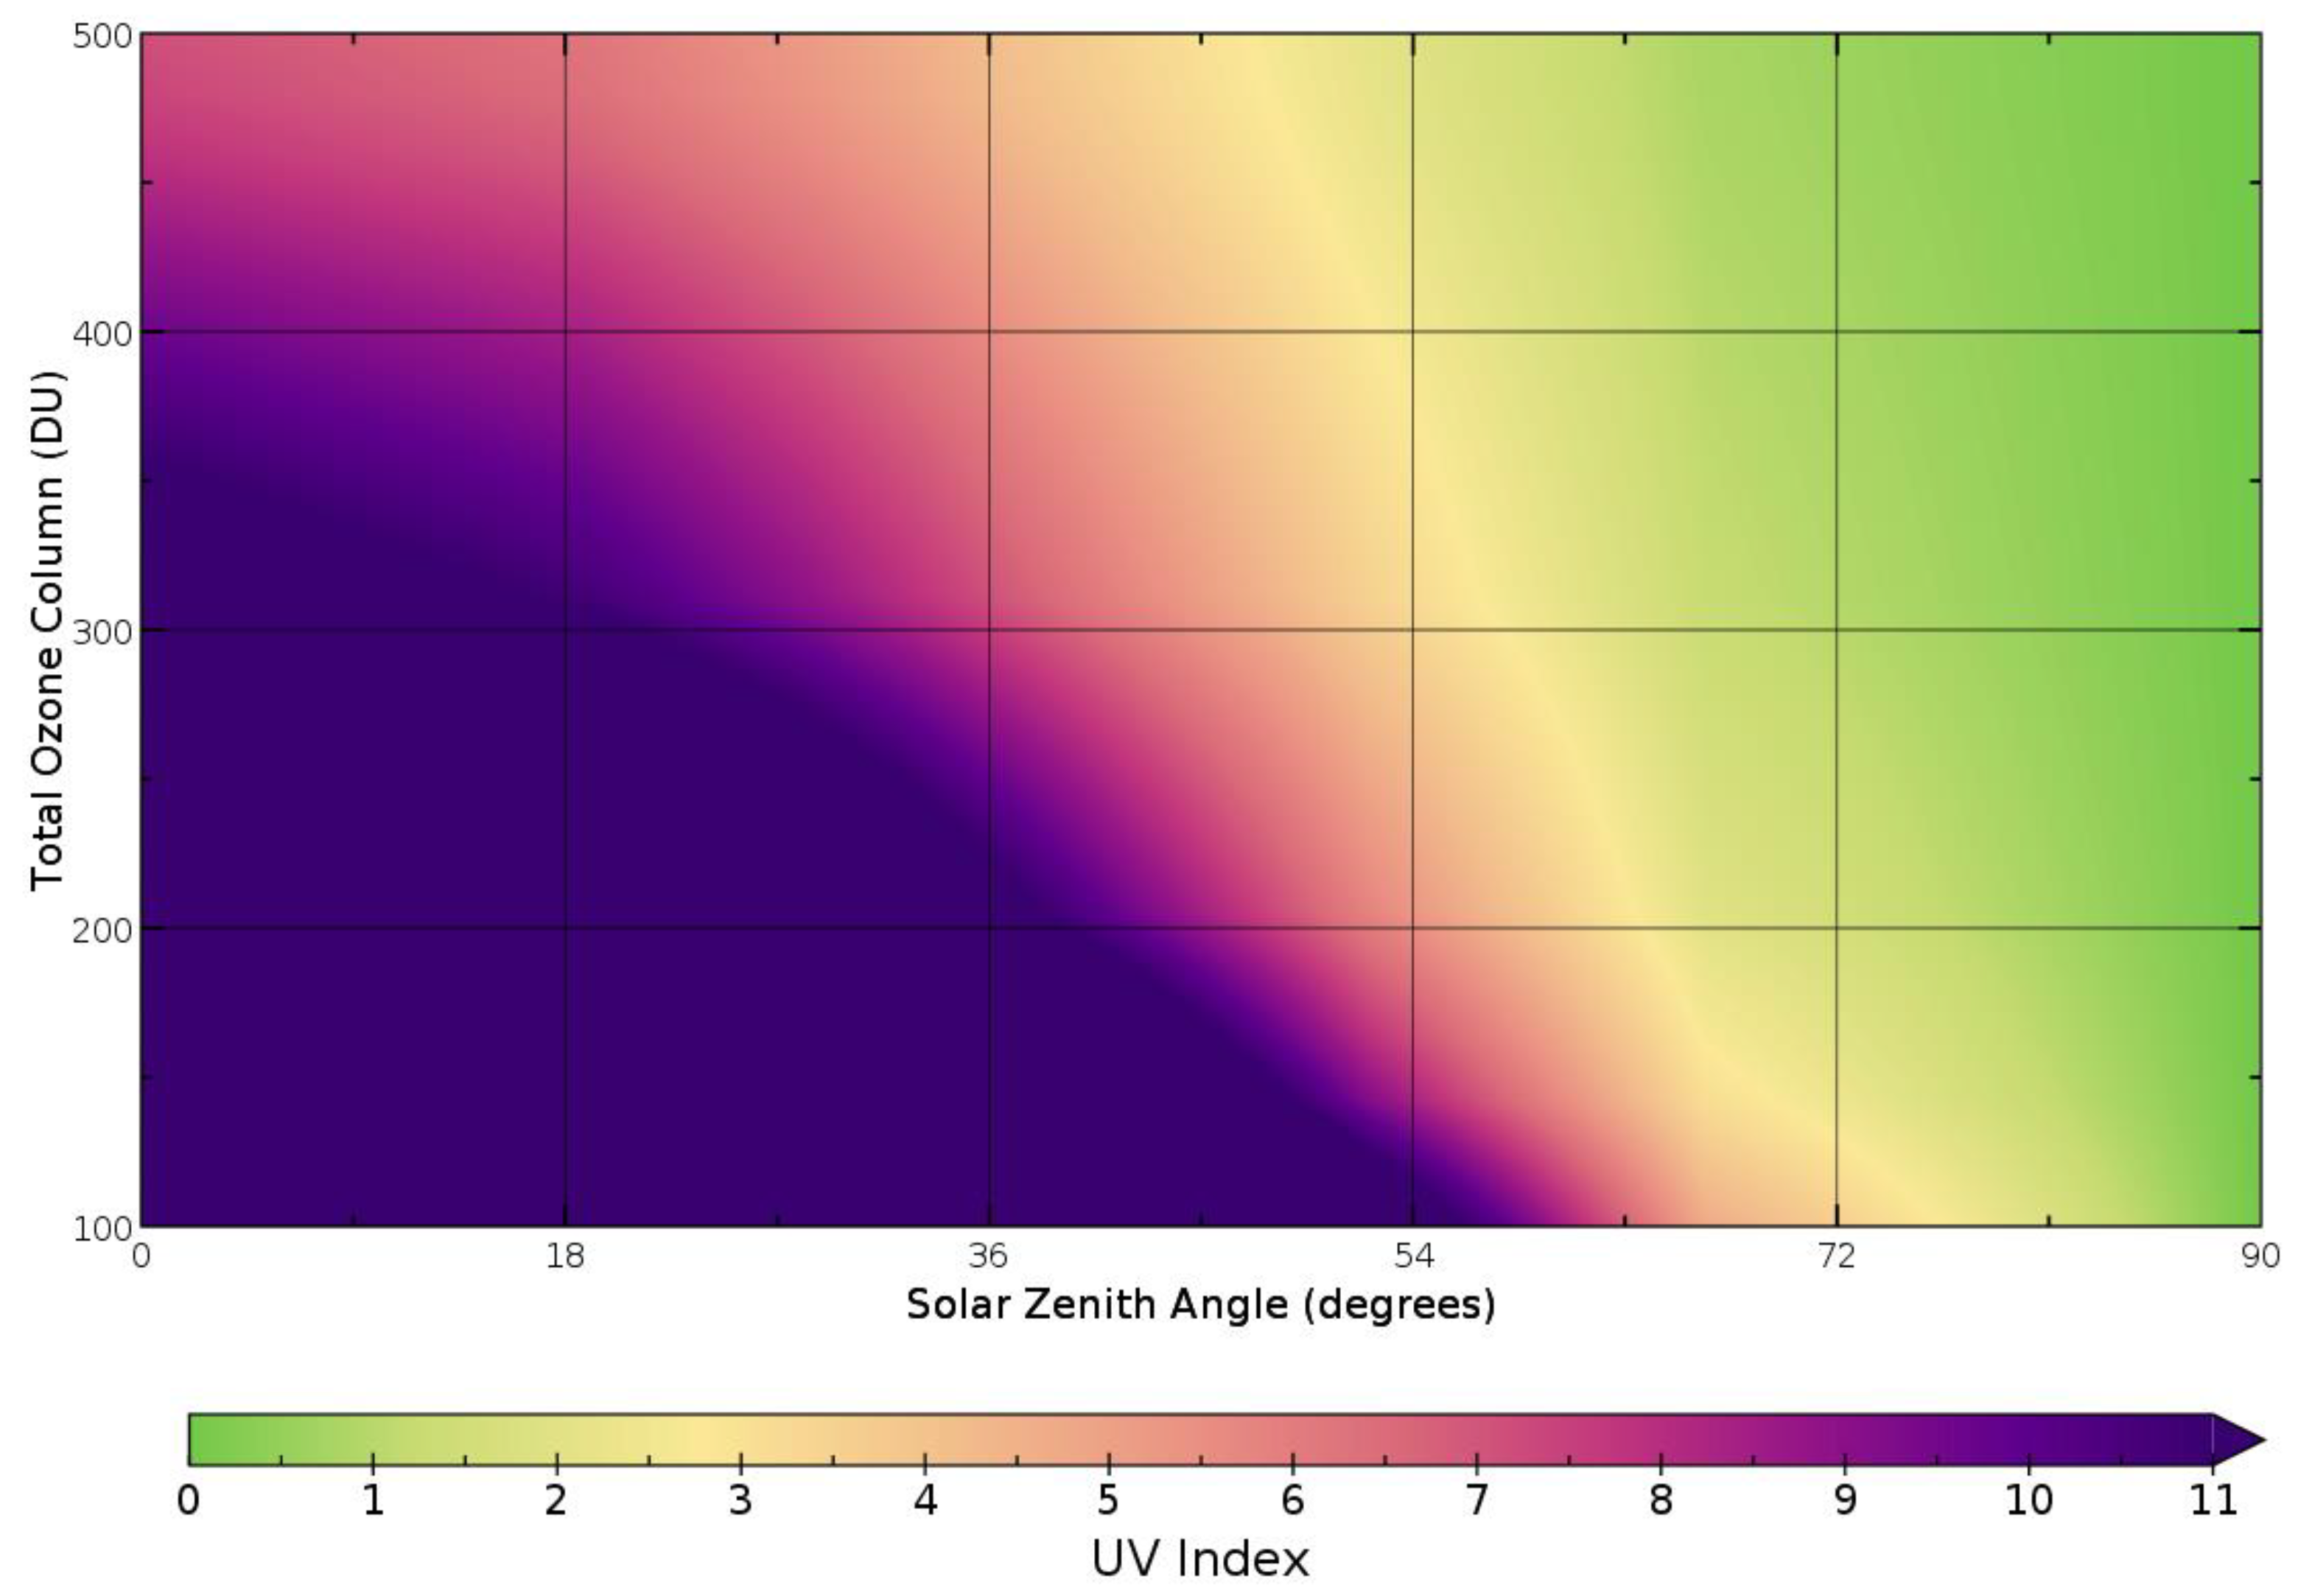
Figure 3 and Figure 4 show example UVI and UV-A estimates, respectively, computed using the LUT corresponding to a range of SZA and total ozone column values, and fixed values of surface albedo (0.2), AOD (0.1), aerosol SSA (0.95), COT (0.0), and surface elevation (0 m).

3. Verification of Surface UV Model

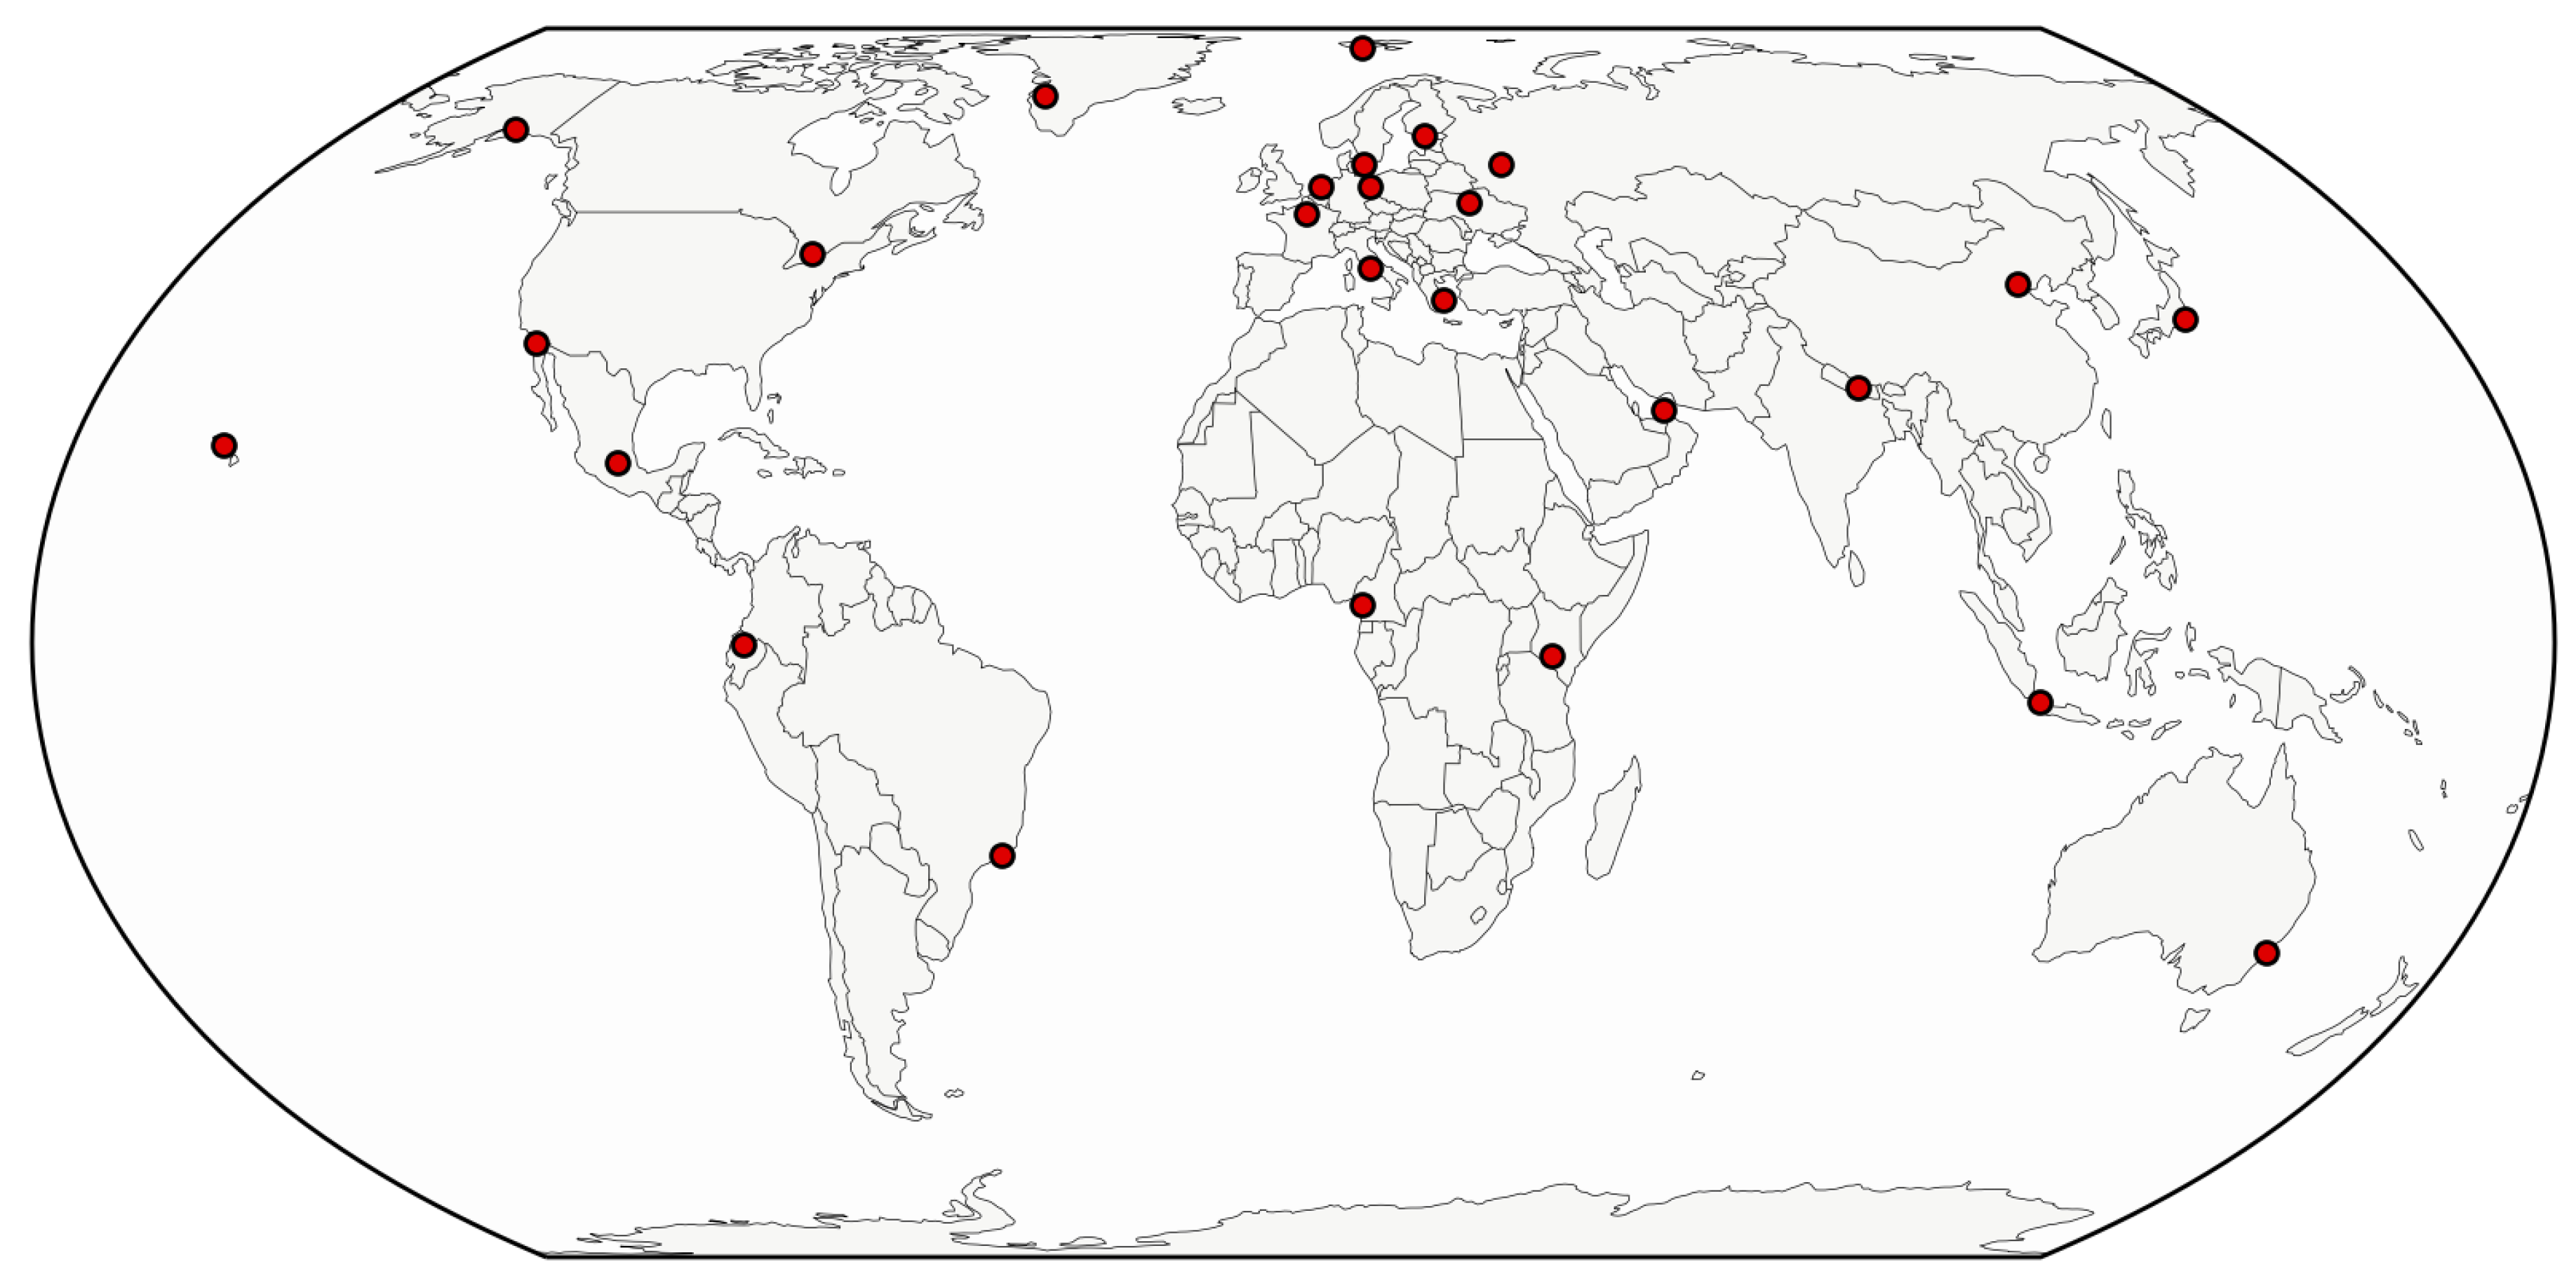
AURORA data are based on atmospheric scenarios from MERRA-2 re-analysis [15]. These scenarios are used for generating synthetic measurements that are further used to study the fusion of ozone profile retrievals and ingestion of the retrieved ozone profiles into assimilation systems. For more details on the data fusion techniques used in AURORA models see, for example, [16,17,18,19]. The use of synthetic measurements from MERRA-2 gives us also a ground truth, against which to evaluate the performance of our UV model. For the evaluation of the surface UV model we use the same time range from 1 April 2012 to 31 July 2012 and 6 h time step (00, 06, 12, and 18 UTC) that are used in the AURORA model analysis. To assess the accuracy of the surface UV model, we select 26 locations that we use as virtual stations and compare the surface UV products to full radiative transfer simulations corresponding to the atmospheric scenario. The comparison is carried out using clear-sky surface UV radiation by setting the cloud optical thickness as 0. The list and map of the virtual stations used in the study are shown in Table 2 and Figure 5, respectively. For UV index and UV-A irradiance corresponding to atmospheric scenario at 1 April 2012 12:00Z and 1 July 2012 12:00Z, see Figure 6 and Figure 7, respectively.
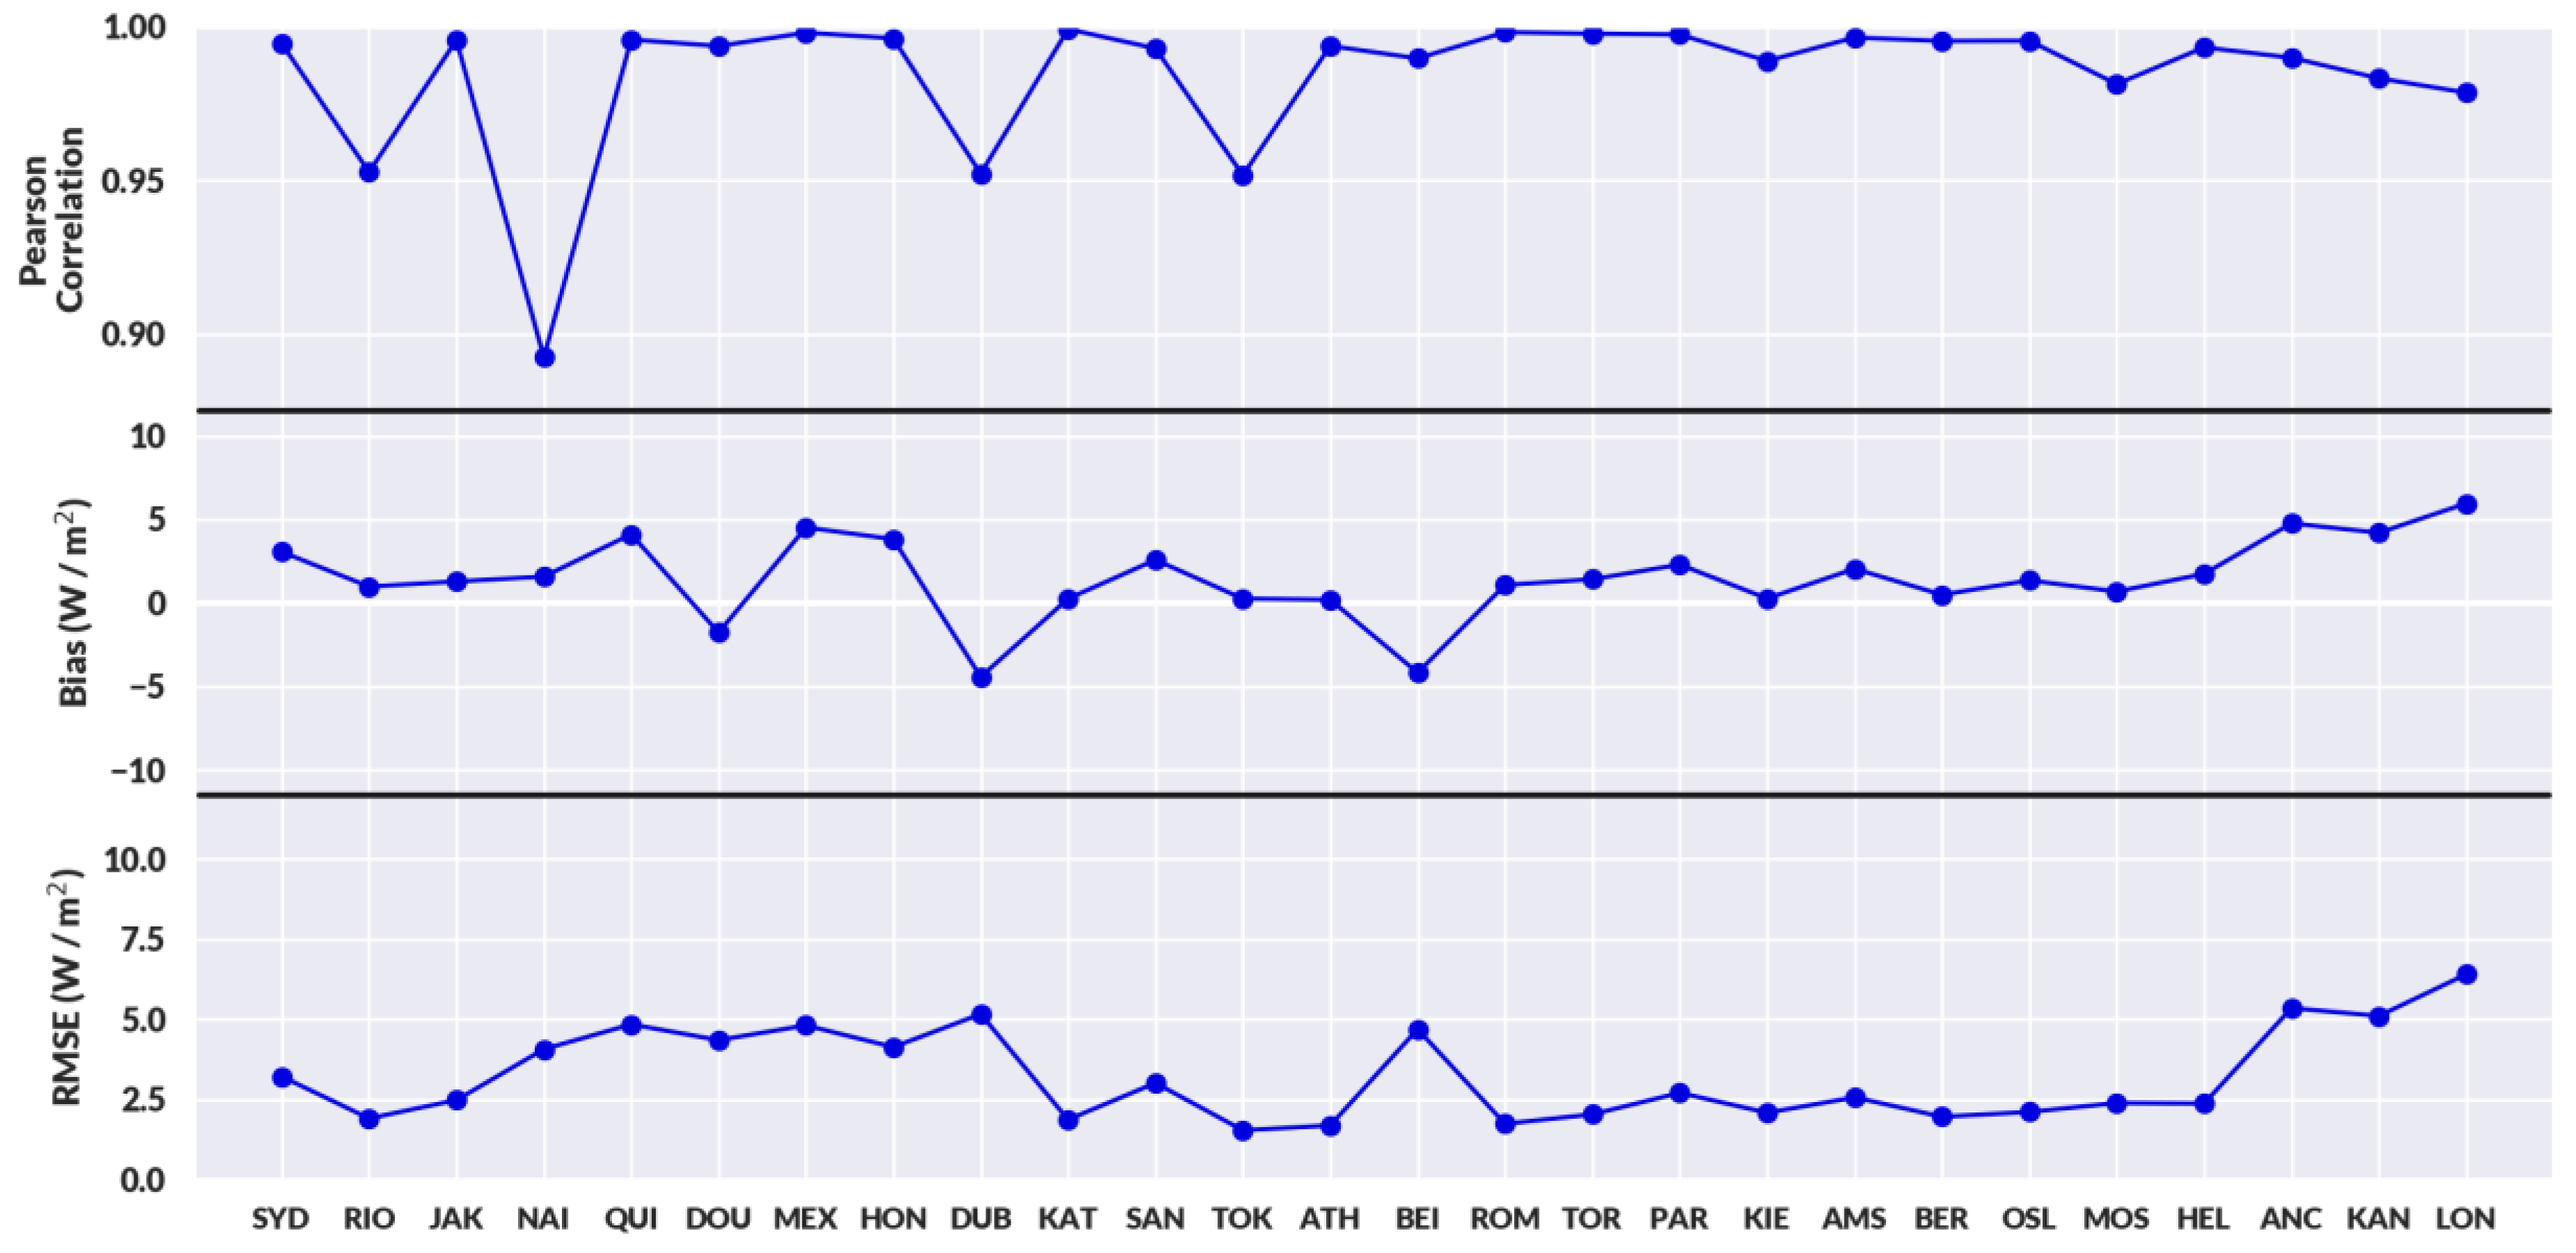
To compare the clear-sky UVI and UV-A irradiance of the surface UV model and the atmospheric scenario, we compute the Pearson correlation coefficient, mean bias and root mean squared error (RMSE) for each station and for each observation with solar zenith angle smaller than 90 degrees. In this evaluation, the difference in the results is only due to the interpolation error in the LUT model and different ozone profiles. With this test it is possible to evaluate the accuracy of the surface UV model in cases in which the state of the atmosphere is accurately known. The statistical indicators for the clear-sky UVI and UV-A irradiance differences between surface UV model and the atmospheric scenario are shown in Figure 8 and Figure 9, respectively.
For both the clear-sky UVI and UV-A irradiance, there is a strong correlation between the model output and the surface UV radiation corresponding to atmospheric scenario. The median Pearson correlation coefficients for both the UVI and UV-A irradiance is 0.99. The only station that clearly has slightly weaker correlation is Nairobi (UVI correlation 0.94, UV-A correlation 0.89). The median UVI bias is 0.3 and the median RMSE 0.5. In UVI results, two stations, Quito and Mexico City, have larger bias and RMSE than the other stations. These two stations are located at high altitudes (Quito almost 3000 m and Mexico City about 2000 m above the sea level) and the high altitude explains the bias. As both of these stations are located at high altitudes and quite close to the equator, the typical surface UV radiation is high thus resulting in comparably low relative bias and RMSE. For UV-A irradiance the median bias and median RMSE are 1.4 W/m2 and 2.6 W/m2, respectively. For UV-A irradiance, there is a latitude dependency in both bias and RMSE that increases when going farther North. At these high Northern latitude locations the surface UV radiation is relatively low even during the Northern hemisphere summer and this dependency is most likely due to the high solar zenith angles. In practice, for end-user applications this is not a big problem as the average UV radiation is relatively low. In UVI, the latitude dependency is not clearly visible.

4. Evaluation of Surface UV for Data Fusion and Assimilation Products

In this evaluation, we study the effect of data fusion and assimilation of ozone profiles into the model on surface UV products. We use TM5 [20] model analysis experiments run with different data assimilation and fusion configurations. The model runs correspond to the period from 1 April 2012 to 31 July 2012 and the outputs are given every 6 h (00, 06, 12, 18 Coordinated Universal Time, UTC). To evaluate the change in the surface UV products when data fusion and assimilation related to ozone profiles are carried out, we first compute the surface UV products corresponding to a base run that is a model analysis that does not fuse or assimilate ozone profile-related information. Next, we run experiments with different combinations of ozone profile-related data fusion and assimilation configurations. The data fusion here may combine satellite data from both low Earth orbiting (LEO) and geostationary (GEO) satellites and the fused ozone profiles are further assimilated into the model. A list and descriptions of model experiments carried out in this study are shown in Table 3.
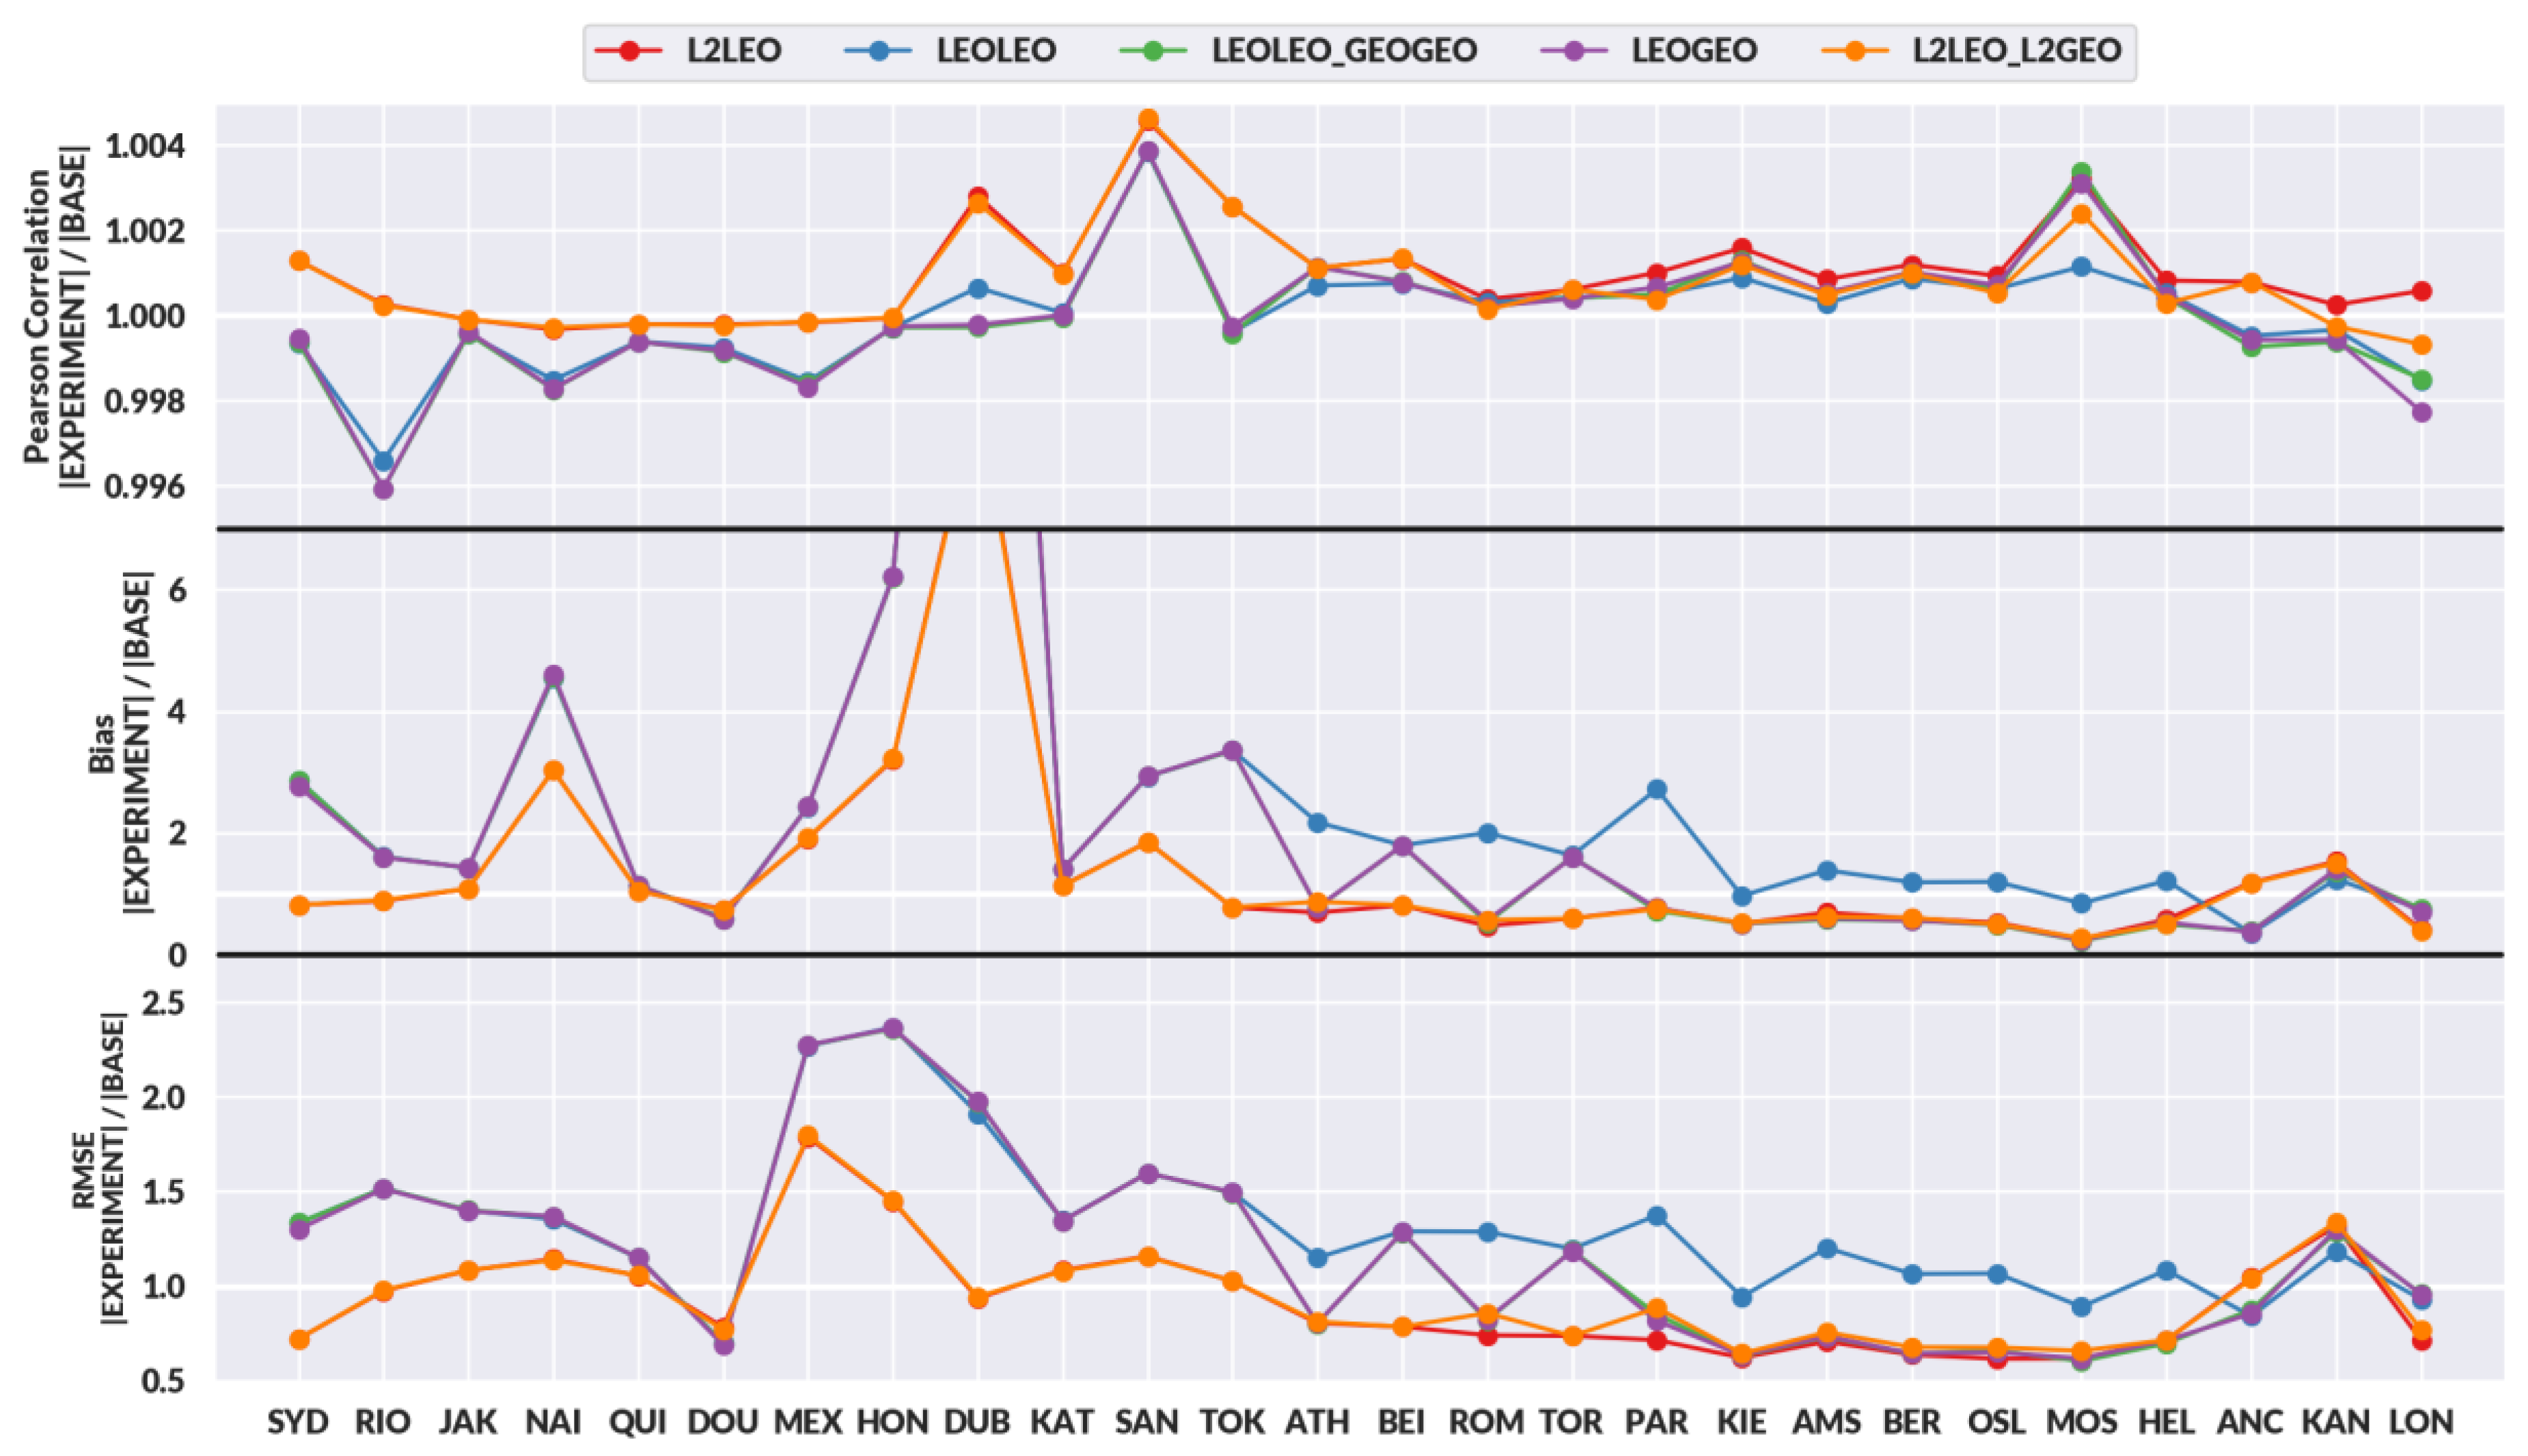
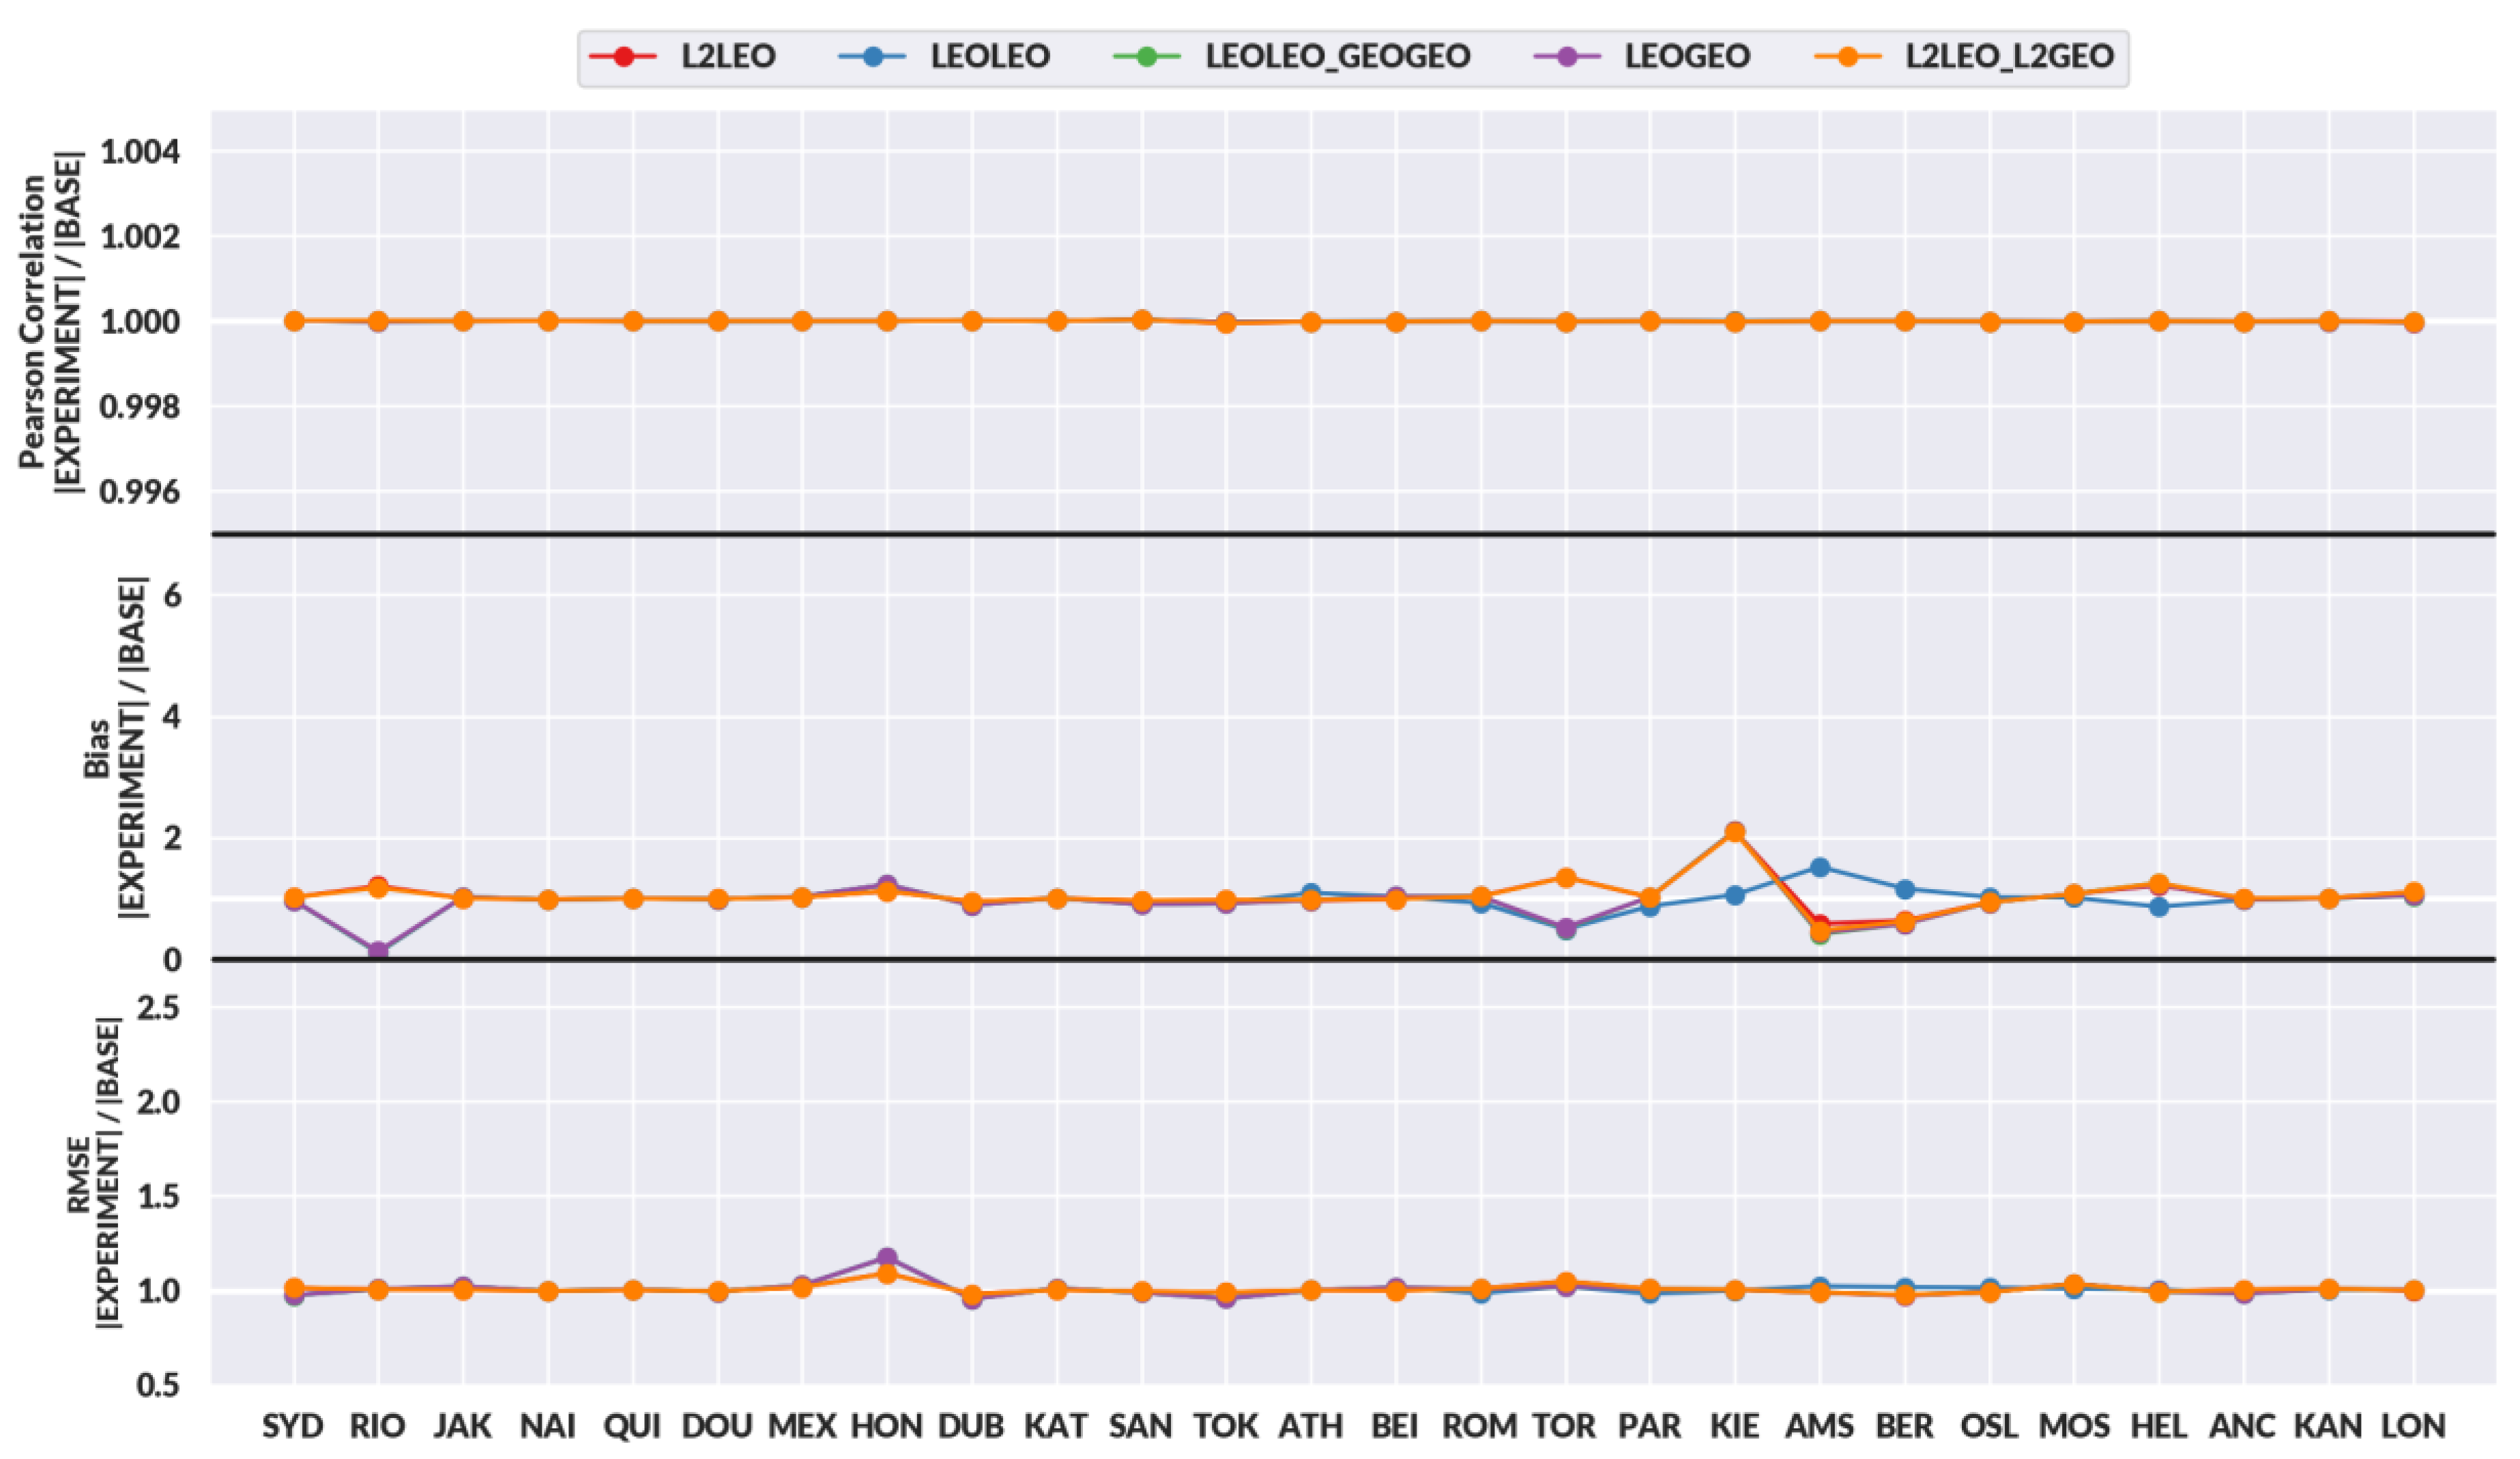
As the aim is to see how data fusion and assimilation in different experiments affect the surface UV products, we first compute the statistics of each experiment by comparing the surface UV products of the experiments to those of the atmospheric scenario. These statistics are then compared to the statistics of the base run. The same virtual station locations as for the surface UV model evaluation are used for the comparison. Figure 10 and Figure 11 show the statistics of the experiments for UVI and UV-A irradiance, respectively, relative to the base run.
The results for UV-A irradiance show that there is no significant difference between the experiments. This result is expected as the UV-A irradiance does not strongly depend on the total ozone column and thus improving the ozone profile information does not have an impact on surface UV-A irradiance.
The results for the UV index, however, show differences between the experiments. For the correlation coefficient there are no significant differences between the experiments. The median bias for all experiments except LEOLEO is smaller than the bias of the base run. L2LEO_L2GEO has the smallest median bias, 68% of the base run. For RMSE, the L2LEO and L2LEO_L2GEO median RMSEs are smaller than those of the base run. L2LEO has the median RMSE of about 80% and L2LEO_L2GEO about 87% of the bias of the base run.

5. AURORA (Advanced Ultraviolet Radiation and Ozone Retrieval for Applications) Technological Infrastructure and Applications of Surface UV Data

The technological infrastructure of AURORA and its main component, the spatial database, have been developed with the aim of support all phases of the project: simulation; processing; presentation. In particular the infrastructure answers the following needs: data acquisition/simulation, data processing, data presentation, data archiving.
The overall AURORA technological infrastructure is formally composed by three main components:
  • The database with geo-referenced data (spatial database);
  • A first web-service aimed to insert/get data into/from the spatial database;
  • A second web-service aimed to the presentation/provision of data to users with specific interfaces (e.g., Web Map Services).
The spatial database architecture is modular and extensible (new future components can be easily integrated). The solution provided is reliable and scalable (formally there are no limits to the amount of data to be stored and managed). The availability of full OGC (Open Gis Catalog) CSW (Catalog Web Service) metadata services enable the user to search for specific information in a huge amount of data stored in the database itself. The interoperability with other spatial data (third parties’ solutions) is allowed thanks to the use of OGC standards and of the OPeNDAP framework (to allow a simple way to access data from scientists and researchers familiar with Python and MATLAB coding).
Within AURORA, the “processing tools” run outside the spatial database, and are triggered from a dedicated service, the data processing chain (DPC): a solution that allows for the execution of any kind of processing exploiting the AURORA data.
The AURORA DPC implements a distributed approach for data processing: every “processing tool” runs remotely and is considered as black box by the DPC. The DPC triggers elaboration when it is needed, then the processed data will be uploaded at the end of the processing.
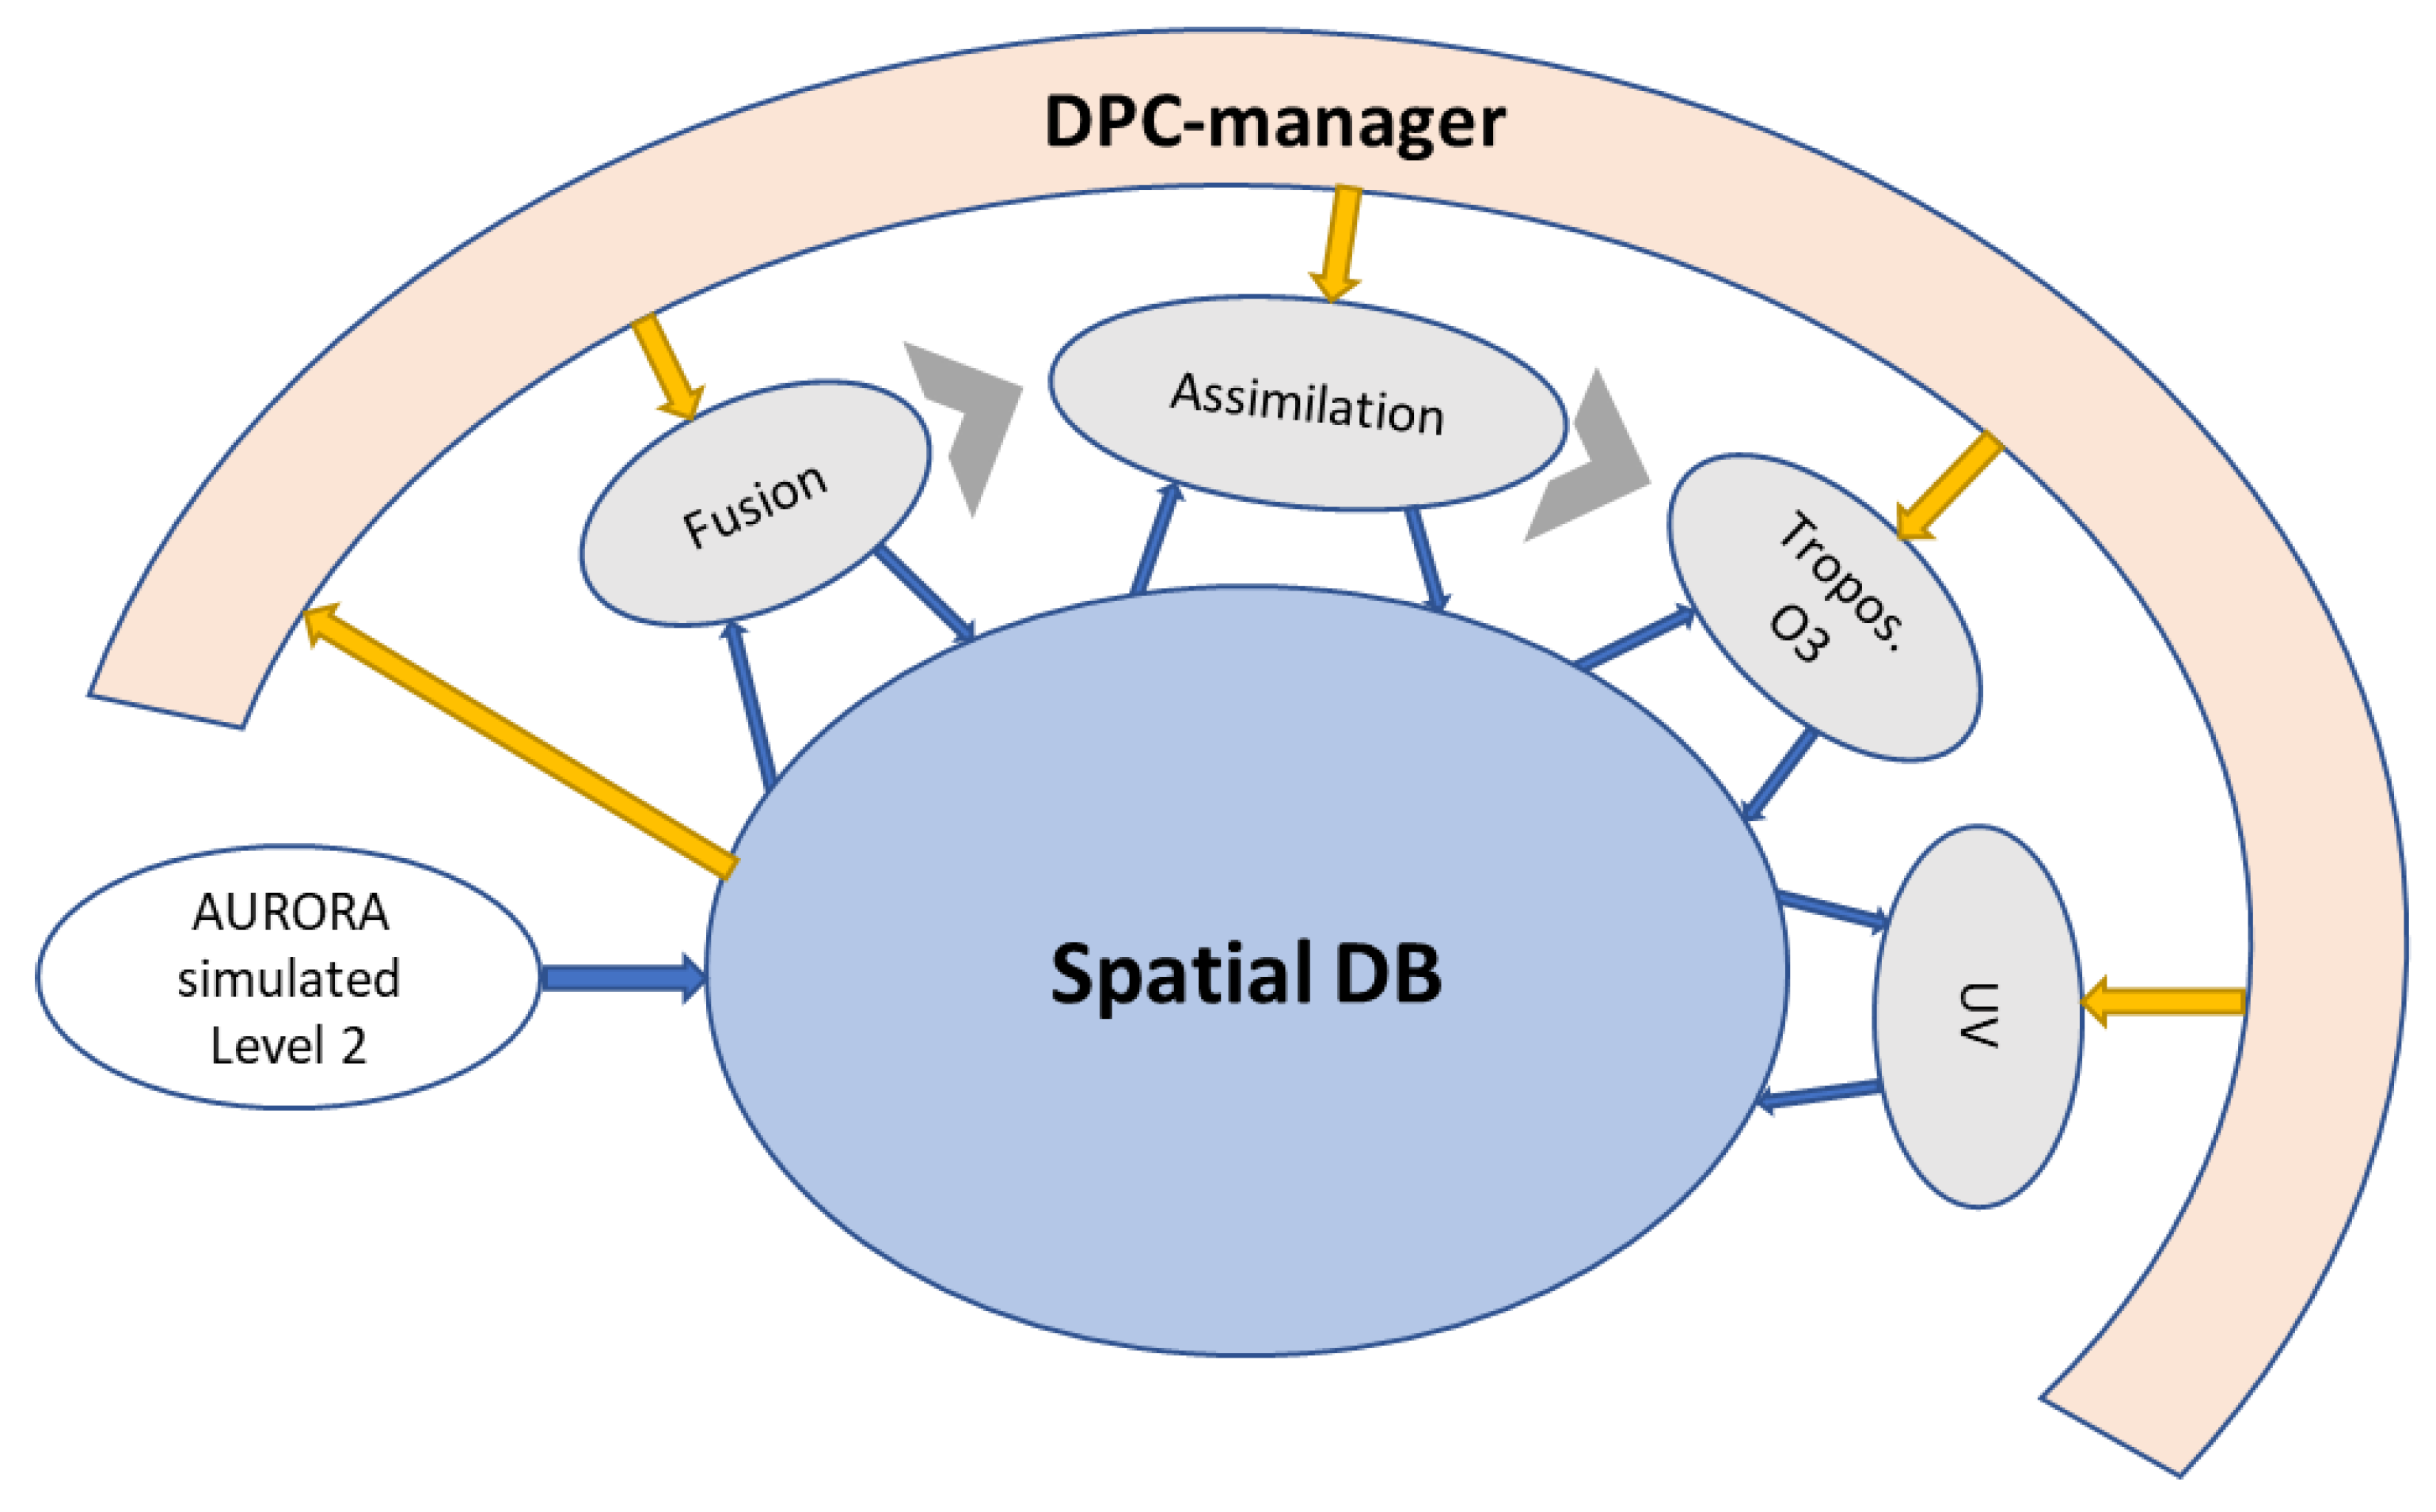
A key feature of AURORA DPC infrastructure is to allow different processing tools to be hooked inside the DPC with minimum effort and with no modification to the infrastructure. The entire elaboration is managed by a central DPC manager that controls the overall processing chain, see Figure 12 for a schematic figure. The DPC manager can coordinate all phases by managing every AURORA tool (or agent) when a new elaboration is needed. The DPC manager was developed exploiting Celery, a distributed task queue software (open source solution). The AURORA UV radiation model is implemented in a processing tool integrated in the DPC. The tool uses as input the product of the assimilation model and generates in output the geo-referenced UV index. The products of the UV-tool are in net-CDF format.
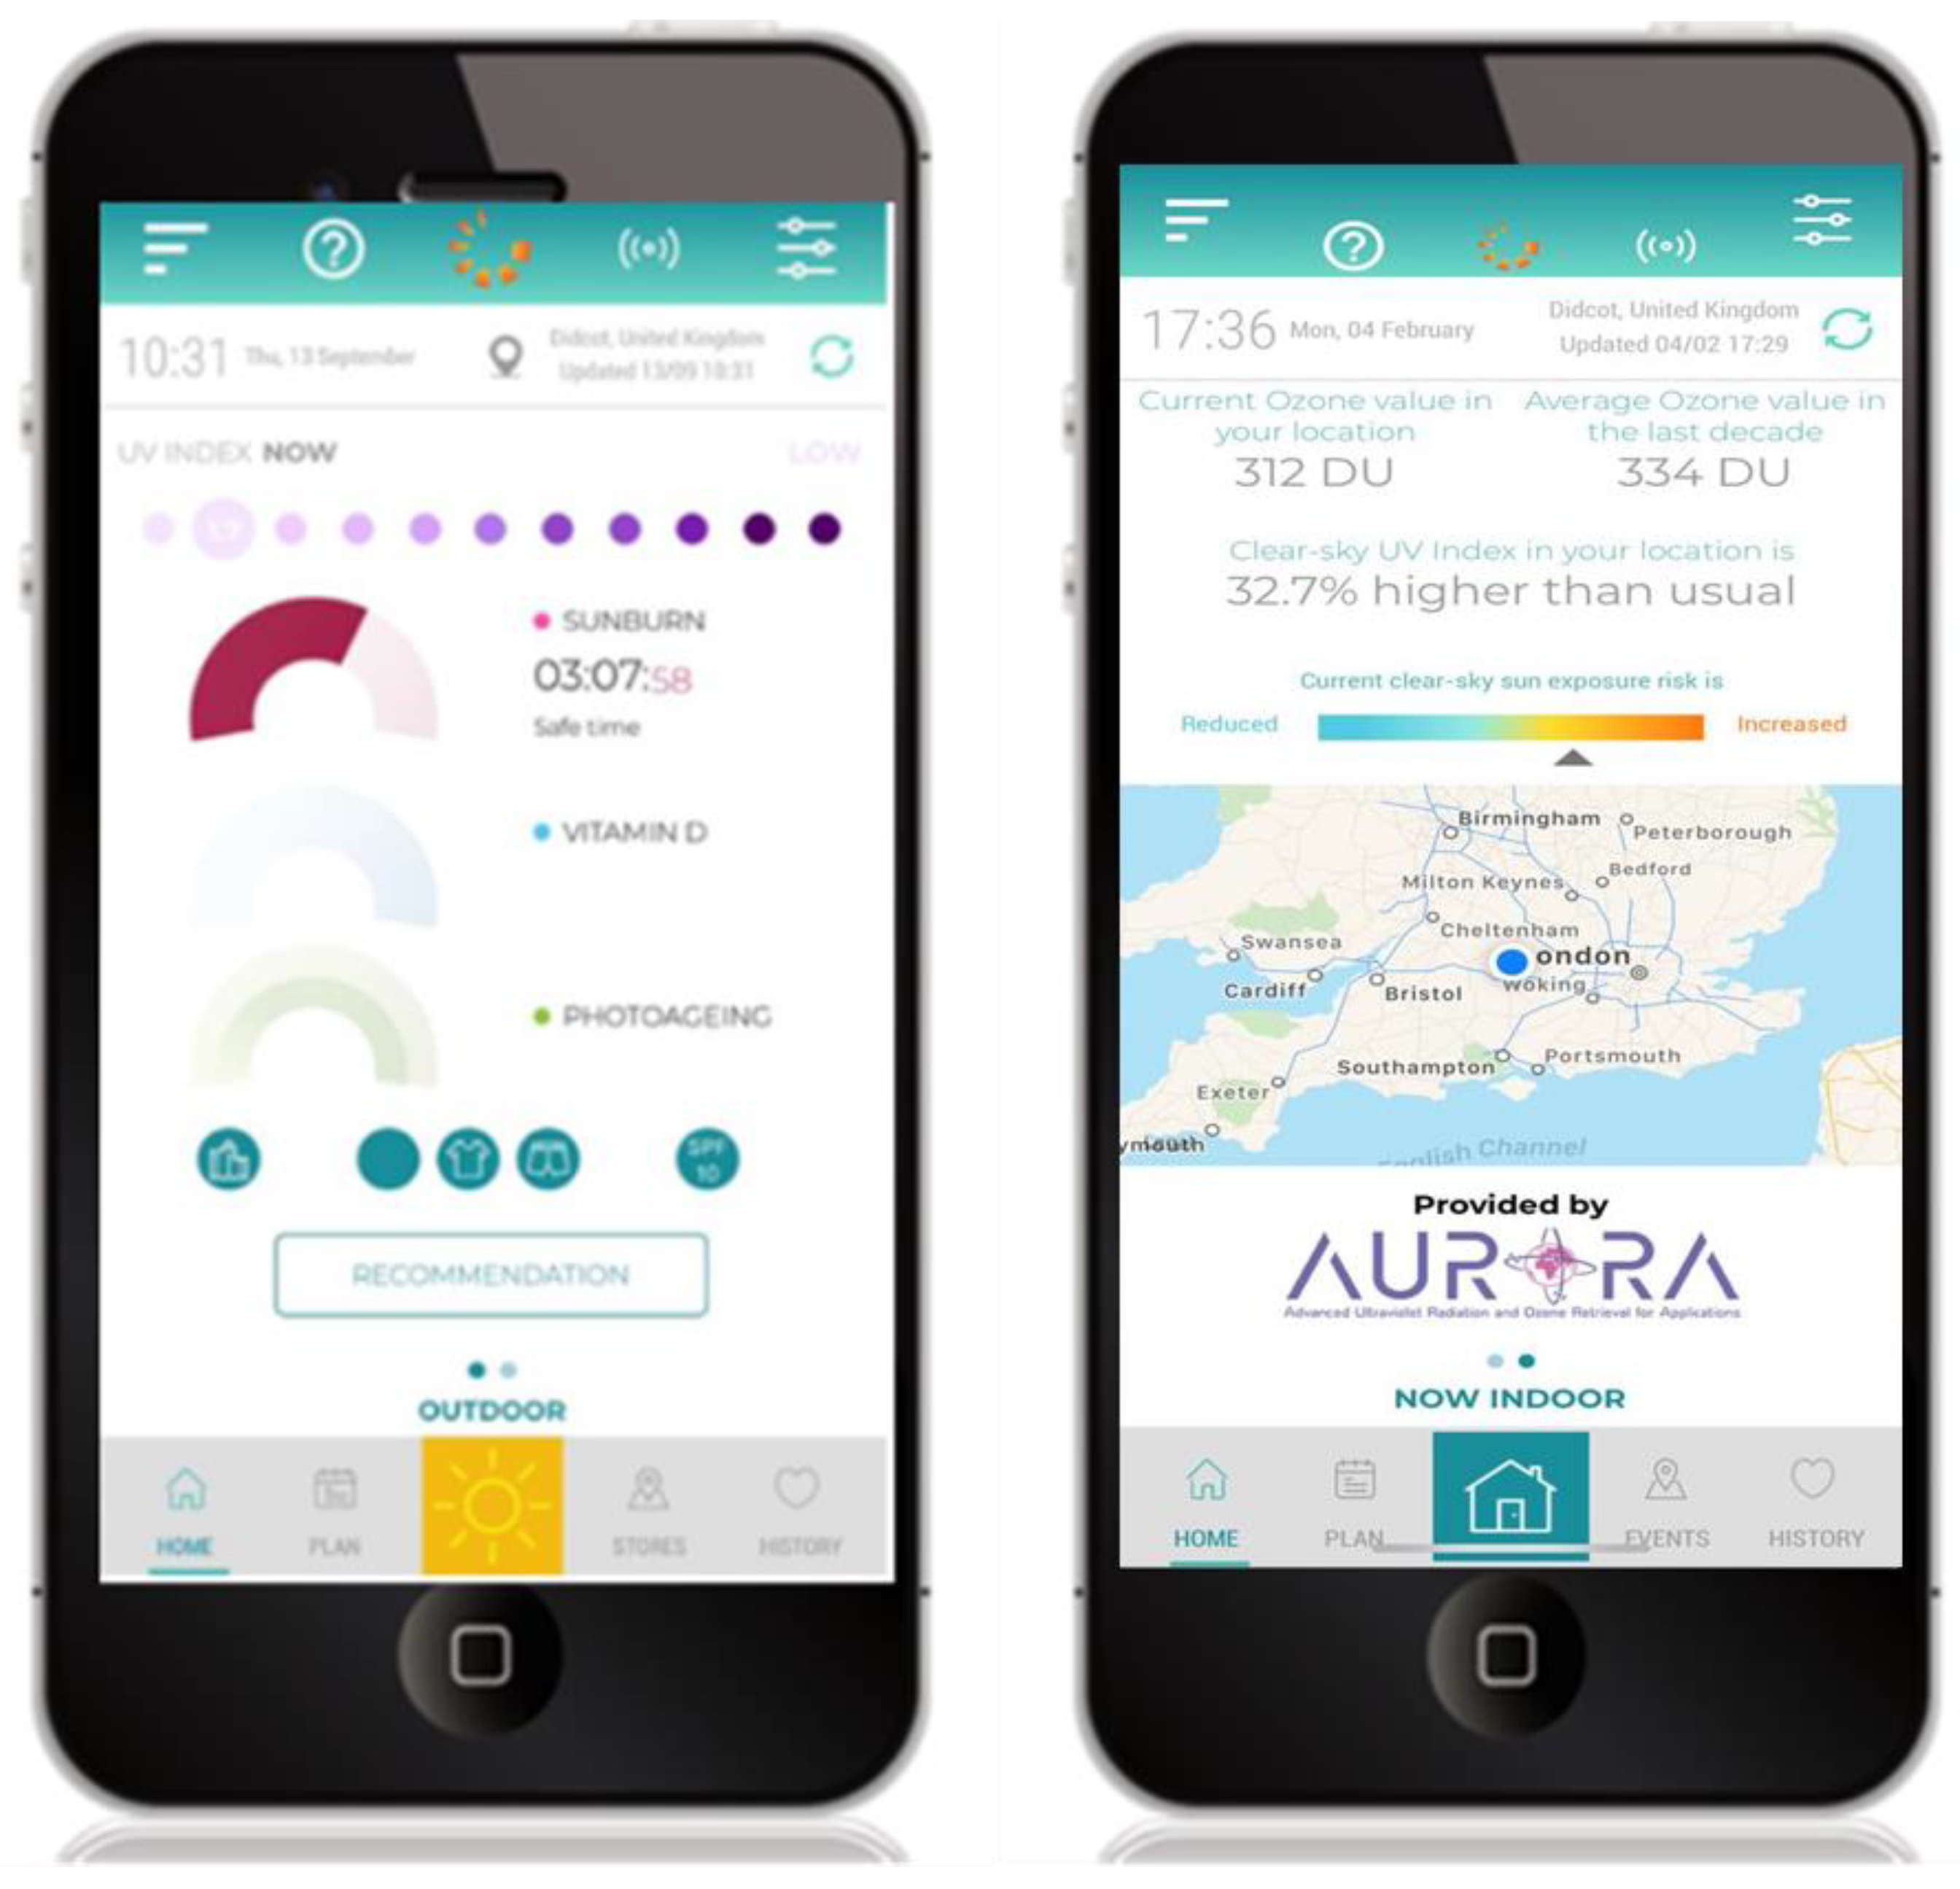
A first application service is HappySun: an innovative app for mobile devices dedicated to personal solar photoprotection (see Figure 13) with an integrated system that constantly calculates the UV radiation dose received by the user (dosimeter) by exploiting real-time AURORA DPC.
For the end user it works as a “personal consultant” for sun exposure, allowing safe and enjoyable sunbathing avoiding sunburn, managing the sun protection factor (SPF) value of the sunscreens, account for maximum benefits like vitamin D synthesis and assessing photoaging with respect to the reference life style conditions.
HappySUN is the very first satellite-based app UV personal dosimeter enabling public sun photoprotection in a reliable and user-friendly way. There exist other solutions dedicated to supporting personal sun exposure and sun safety. All these exploit either UV sensors/patches or UV radiation forecasts/models. Their performances appear quite limited compared to HappySun.
Accuracy of forecasts/models is not comparable with respect to real-time satellite-based information (e.g., usually clear-sky conditions only are considered, so often providing estimates of UV radiation that are too conservative).
In the case of devices, the performances are strongly affected by the position on the user’s body of the UV sensor, limiting the reliability of the information. In the case of patches (both chemical and electronics ones), they suffer for an additional problem: no interactivity with smartphone devices of the user in order to alert that the safe UV dose has been reached.
Moreover, all the existing sensor-based systems suffer of the same common key problem: the sensor must be positioned toward the sun to provide reliable measurements, being uncomfortable for users.
Finally, the costs of discriminating specific devices for different photobiological effects in different UV spectral regions are prohibitive and not comparable with respect to those of an app based on satellite low-resolution imagery IT service like the AURORA DPC.

6. Discussion and Conclusions

Ultraviolet (UV) solar radiation has a broad range of effects concerning life on Earth. It influences not only human beings, but also plants and animals. Furthermore, it causes degradation of materials and functions as a driver of atmospheric chemistry. In order to study these many UV-related effects and their implications thoroughly, information is needed on UV radiation intensities over the globe. The accuracy of these data is an essential requirement for all of these studies. Since the network of ground-based UV measurements will inevitably remain sparse, satellite-based UV methods are needed to better document the geographical distribution of the surface UV irradiance.
In the AURORA project, a satellite-based UV algorithm was developed. In the project context both UV index (UVI) and UV-A were provided from synthetic satellite measurements, which in turn are based on atmospheric scenarios from MERRA-2 re-analysis. The UV algorithm is implemented in a software tool integrated in the technological infrastructure developed in the context of AURORA for the management of the synthetic data and for supporting the data processing. In this paper, all these elements are described. In addition, verification of the algorithm performance was carried out. Since synthetic measurements from MERRA-2 were used, they also gave a ground truth, against which to evaluate the performance of our UV model. A robust and good performance of the algorithm was demonstrated in this verification exercise. The UV algorithm developed in the project is flexible to be adapted to the corresponding input from any satellite measurements and could offer valuable global UV information to the health applications, for instance.

Author Contributions

Methodology, A.L. and A.A; writing—original draft preparation, A.L., S.C., U.C., M.G., A.K., A.M., E.S., C.T., A.A. All authors have read and agree to the published version of the manuscript.

Funding

The AURORA project is supported by the Horizon 2020 research and innovation program of the European Union (Call: H2020-EO-2015; Topic: EO-2-2015) under Grant Agreement No. 687428.

Conflicts of Interest

The authors declare no conflict of interest.

Appendix A

Figure A1. ETOPO2v2g digital elevation model.
Atmosphere 11 00324 g0a1
Figure A2. Surface albedo at 360 nm climatology corresponding to day of year 90 (a), 180 (b), 270 (c), and 360 (d).
Atmosphere 11 00324 g0a2
Figure A3. Aerosol optical depth (AOD) climatology at 310 nm for March (a), June (b), September (c), and December (d).
Atmosphere 11 00324 g0a3
Figure A4. Aerosol single scattering albedo (SSA) climatology at 310 nm for March (a), June (b), September (c), and December (d).
Atmosphere 11 00324 g0a4
Table A1. Surface UV model UV index (UVI) and UV-A statistics number of comparisons (N), correlation coefficient (R), bias, and root mean squared error (RMSE) for each virtual station corresponding to different data assimilation and fusion experiments. Corresponds to data shown in Figure 9.
Station ID UVIUV-A
NRBiasRMSERBias (W/m2)RMSE (W/m2)
AMS3661.000.340.421.002.052.56
ANC3320.990.620.710.994.765.35
ATH2441.000.230.370.990.201.69
BEI2440.99−0.420.570.99−4.174.70
BER3521.000.140.281.000.491.96
DOU2440.99−0.381.020.99−1.774.35
DUB2440.98−0.570.750.95−4.425.17
HEL3400.990.290.360.991.742.37
HON2441.000.820.961.003.814.13
JAK2441.000.400.601.001.282.48
KAN4150.980.460.550.984.205.11
KAT3521.000.230.351.000.251.87
KIE2740.990.140.300.990.262.09
LON4690.980.540.600.985.956.41
MEX2441.001.511.851.004.514.81
MOS2700.980.180.330.980.682.39
NAI2440.940.630.980.891.584.07
OSL3551.000.240.321.001.352.11
PAR3661.000.380.471.002.292.71
QUI2441.001.431.861.004.114.84
RIO2440.980.280.350.950.981.91
ROM3351.000.230.341.001.071.74
SAN2441.000.660.760.992.583.02
SYD2440.990.430.470.993.053.22
TOK2440.980.250.350.950.251.54
TOR3481.000.290.391.001.422.04
Table A2. Surface UV model UV index statistics relative to model base run for each virtual station corresponding to different data assimilation and fusion experiments. Descriptions of the experiments are found in Table 3. Corresponds to data shown in Figure 9.
Station ID L2LEOLEOLEOLEOLEO_GEOGEOLEO_GEOL2LEO_L2GEO
NRel. RRel. BiasRel. RMSERel. RRel. BiasRel. RMSERel. RRel. BiasRel. RMSERel. RRel. BiasRel. RMSERel. RRel. BiasRel. RMSE
AMS3661.0010.690.711.0001.391.201.0000.580.731.0010.600.741.0000.630.76
ANC3321.0011.181.041.0000.350.840.9990.390.880.9990.370.851.0011.171.04
ATH2441.0010.690.811.0012.171.151.0010.770.801.0010.780.801.0010.870.81
BEI2441.0010.810.791.0011.801.291.0011.791.281.0011.791.291.0010.810.79
BER3521.0010.600.641.0011.191.071.0010.560.641.0010.560.651.0010.610.68
DOU2441.0000.740.780.9990.600.700.9990.590.700.9990.580.691.0000.730.77
DUB2441.0039.220.941.00121.411.911.00021.651.971.00021.741.981.0039.150.94
HEL3401.0010.580.721.0011.221.081.0000.500.701.0000.530.711.0000.500.72
HON2441.0003.201.451.0006.222.371.0006.192.361.0006.212.361.0003.221.45
JAK2441.0001.091.081.0001.431.401.0001.431.401.0001.431.401.0001.091.08
KAN4151.0001.531.321.0001.241.180.9991.381.290.9991.411.301.0001.511.34
KAT3521.0011.141.081.0001.411.351.0001.401.341.0001.401.351.0011.131.08
KIE2741.0020.510.621.0010.970.941.0010.510.631.0010.510.641.0010.520.64
LON4691.0010.410.720.9980.740.930.9990.750.960.9980.700.960.9990.390.77
MEX2441.0001.911.790.9982.432.270.9982.432.270.9982.432.271.0001.921.80
MOS2701.0030.260.621.0010.840.891.0030.230.601.0030.240.621.0020.270.66
NAI2441.0003.031.140.9984.551.350.9984.571.370.9984.611.371.0003.031.14
OSL3551.0010.530.621.0011.201.071.0010.490.661.0010.500.651.0010.500.68
PAR3661.0010.770.721.0002.721.371.0000.720.851.0010.770.821.0000.750.89
QUI2441.0001.051.060.9991.141.150.9991.141.150.9991.141.151.0001.051.06
RIO2441.0000.880.980.9971.611.520.9961.601.520.9961.601.511.0000.900.98
ROM3351.0000.480.741.0002.001.291.0000.530.821.0000.560.831.0000.570.86
SAN2441.0051.851.161.0042.931.601.0042.931.601.0042.931.601.0051.851.15
SYD2441.0010.820.720.9992.871.330.9992.861.330.9992.761.301.0010.820.72
TOK2441.0030.781.031.0003.361.491.0003.351.491.0003.361.501.0030.781.03
TOR3481.0010.600.741.0001.631.201.0001.611.191.0001.591.181.0010.600.74
Table A3. Surface UV model UV-A statistics relative to model base run for each virtual station corresponding to different data assimilation and fusion experiments. Corresponds to data shown in Figure 10.
Station ID L2LEOLEOLEOLEOLEO_GEOGEOLEO_GEOL2LEO_L2GEO
NRel. RRel. BiasRel. RMSERel. RRel. BiasRel. RMSERel. RRel. BiasRel. RMSERel. RRel. BiasRel. RMSERel. RRel. BiasRel. RMSE
AMS3661.0000.590.991.0001.521.021.0000.420.991.0000.440.991.0000.470.99
ANC3321.0001.001.001.0000.980.981.0000.980.991.0000.980.981.0001.001.00
ATH2441.0000.971.001.0001.091.001.0000.971.001.0000.971.001.0000.981.00
BEI2441.0000.991.001.0001.031.021.0001.031.011.0001.031.021.0000.991.00
BER3521.0000.640.971.0001.171.021.0000.590.981.0000.590.981.0000.630.98
DOU2441.0001.001.001.0000.990.991.0000.990.991.0000.990.991.0001.001.00
DUB2441.0000.950.981.0000.890.961.0000.890.961.0000.890.961.0000.950.98
HEL3401.0001.221.001.0000.871.001.0001.250.991.0001.231.001.0001.250.99
HON2441.0001.121.091.0001.231.181.0001.231.171.0001.231.171.0001.121.09
JAK2441.0001.001.001.0001.031.021.0001.031.021.0001.031.021.0001.001.00
KAN4151.0001.011.011.0001.001.001.0001.011.011.0001.011.011.0001.011.01
KAT3521.0001.001.001.0001.011.011.0001.011.011.0001.011.011.0001.001.00
KIE2741.0002.111.001.0001.061.001.0002.121.001.0002.111.011.0002.091.00
LON4691.0001.111.001.0001.051.001.0001.051.001.0001.061.001.0001.111.00
MEX2441.0001.021.021.0001.031.031.0001.031.031.0001.031.031.0001.021.02
MOS2701.0001.081.031.0001.021.011.0001.081.041.0001.081.041.0001.081.03
NAI2441.0000.991.001.0000.981.001.0000.981.001.0000.981.001.0000.991.00
OSL3551.0000.940.991.0001.021.011.0000.940.991.0000.940.991.0000.940.99
PAR3661.0001.021.011.0000.870.981.0001.031.011.0001.021.011.0001.021.01
QUI2441.0001.001.001.0001.001.001.0001.001.001.0001.001.001.0001.001.00
RIO2441.0001.211.011.0000.111.011.0000.121.011.0000.131.011.0001.181.01
ROM3351.0001.041.011.0000.930.991.0001.041.011.0001.041.011.0001.041.01
SAN2441.0000.970.991.0000.910.991.0000.910.991.0000.910.991.0000.970.99
SYD2441.0001.021.011.0000.970.981.0000.970.981.0000.970.981.0001.021.01
TOK2441.0000.980.991.0000.920.961.0000.920.961.0000.920.961.0000.980.99
TOR3481.0001.351.051.0000.501.021.0000.511.021.0000.531.021.0001.351.05

References

  1. Cortesi, U.; Ceccherini, S.; del Bianco, S.; Gai, M.; Tirelli, C.; Zoppetti, N.; Barbara, F.; Bonazountas, M.; Argyridis, A.; Bós, A.; et al. Advanced Ultraviolet Radiation and Ozone Retrieval for Applications (AURORA): A Project Overview. Atmosphere 2018, 9, 454. [Google Scholar] [CrossRef] [Green Version]
  2. Eck, T.F.; Bhartia, P.K.; Kerr, J.B. Satellite estimation of spectral UVB irradiance using TOMS derived total ozone and UV reflectivity. Geophys. Res. Lett. 1995, 611–614. [Google Scholar] [CrossRef]
  3. Tanskanen, A.; Krotkov, N.A.; Herman, J.R.; Arola, A. Surface Ultraviolet Irradiance from OMI. IEEE Trans. Geosci. Remote Sens. 2006, 44, 1267–1271. [Google Scholar] [CrossRef]
  4. Lindfors, A.V.; Kujanpää, J.; Kalakoski, N.; Heikkilä, A.; Lakkala, K.; Mielonen, T.; Sneep, M.; Krotkov, N.A.; Arola, A.; Tamminnen, J. The Tropomi surface UV algorithm. Atmos. Meas. Tech. 2018, 11, 997–1008. [Google Scholar] [CrossRef] [Green Version]
  5. Emde, C.; Buras-Schnell, R.; Kylling, A.; Mayer, B.; Gasteiger, J.; Hamann, U.; Kylling, J.; Richter, B.; Pause, C.; Dowling, T.; et al. The libRadtran software package for radiative transfer calculations (version 2.0.1). Geosci. Model Dev. 2016, 9, 1647–1672. [Google Scholar] [CrossRef] [Green Version]
  6. Stamnes, K.; Tsay, S.C.; Wiscombe, W.; Jayaweera, K. Numerically stable algorithm for discrete-ordinate-method radiative transfer in multiple scattering and emitting layered media. Appl Opt. 1988, 27, 2502–2509. [Google Scholar] [CrossRef] [PubMed]
  7. United States Committee on Extension to the Standard Atmosphere. National Oceanic and Atmospheric Administration, Washington, DC (NOAA-S/T 76-1562): Supt. of Docs., US Gov Print Office (Stock No. 003-017-00323-0); United States Committee on Extension to the Standard Atmosphere: Washington, DC, USA, 1976.
  8. Tanskanen, A.; Arola, A.; Kujanpää, J. Use of the moving time-window technique to determine surface albedo from the TOMS reflectivity data. Proc. SPIE 2003, 4896, 239–250. [Google Scholar]
  9. Tanskanen, A. Lambertian Surface Albedo Climatology at 360 nm from TOMS Data Using Moving Time-Window Technique. In Proceedings of the XX Quadrennial Ozone Symposium, Kos, Greece, 1–8 June 2004. [Google Scholar]
  10. Kinne, S.; O’Donnel, D.; Stier, P.; Kloster, S.; Zhang, K.; Schmidt, H.; Rast, S.; Giorgetta, M.; Eck, T.F.; Stevens, B. MAC-v1: A new global aerosol climatology for climate studies. J. Adv. Model. Earth Syst. 2013, 5, 704–740. [Google Scholar] [CrossRef]
  11. World Health Organization; World Meteorological Organization. Global Solar UV Index: A Practical Guide; WHO: Geneva, Switzerland, 2002; p. 28. [Google Scholar]
  12. McKinlay, A.F.; Diffey, B.L. A reference action spectrum for ultraviolet induced erythema in human skin, in: Commission International de l’Éclairage (CIE). Res. Note 1987, 6, 17–22. [Google Scholar]
  13. Amaro-Ortiz, A.; Yan, B.; D’Orazio, J.A. Ultraviolet radiation, aging and the skin: Prevention of damage by topical cAMP manipulation. Molecules 2014, 19, 6202–6219. [Google Scholar] [CrossRef] [PubMed]
  14. Venditti, E.; Brugè, F.; Astolfi, P.; Kochevar, I.; Damiani, E. Nitroxides and a nitroxide-based UV filter have the potential to photoprotect UVA-irradiated human skin fibroblasts against oxidative damage. J. Dermatol. Sci. 2011, 63, 55–61. [Google Scholar] [CrossRef] [PubMed]
  15. Gelaro, R.; Mccarty, W.; Suárez, M.J.; Todling, R.; Molod, A.; Takacs, L.; Randles, C.; Darmenov, A.; Bosilovich, M.G.; Reichle, R.H.; et al. The Modern-Era Retrospective Analysis for Research and Applications, Version 2 (MERRA-2). J. Clim. 2017, 30, 5419–5454. [Google Scholar] [CrossRef] [PubMed]
  16. Ceccherini, S.; Carli, B.; Tirelli, C.; Zoppetti, N.; Del Bianco, S.; Cortesi, U.; Kujanpää, J.; Dragani, R. Importance of interpolation and coincidence errors in data fusion. Atmos. Meas. Tech. 2018, 11, 1009–1017. [Google Scholar] [CrossRef] [Green Version]
  17. Zoppetti, N.; Ceccherini, S.; Carli, B.; Del Bianco, S.; Gai, M.; Tirelli, C.; Barbara, F.; Dragani, R.; Arola, A.; Kujanpää, J.; et al. The Complete Data Fusion for a Full Exploitation of Copernicus Atmospheric Sentinel Level 2 Products. Atmos. Meas. Tech. Discuss. 2019, 1–13. [Google Scholar] [CrossRef] [Green Version]
  18. Ceccherini, S.; Carli, B.; Raspollini, P. Equivalence of data fusion and simultaneous retrieval. Opt. Express 2015, 23, 8476–8488. [Google Scholar] [CrossRef] [PubMed]
  19. Tirelli, C.; Ceccherini, S.; Zoppetti, N.; Del Bianco, S.; Gai, M.; Barbara, F.; Cortesi, U.; Kujanpää, J.; Huan, Y.; Dragani, R. Data fusion analysis of Sentinel-4 and Sentinel-5 simulated ozone data. J. Atmos. Ocean. Technol. 2020. [Google Scholar] [CrossRef]
  20. Huijnen, V.; Williams, J.; Van Weele, M.; Van Noije, T.; Król, M.; Dentener, F.; Segers, A.; Houweling, S.; Peters, W.; De Laat, J.; et al. The global chemistry transport model TM5: Description and evaluation of the tropospheric chemistry version 3.0. Geosci. Model Dev. 2010, 3, 445–473. [Google Scholar] [CrossRef] [Green Version]
Figure 1. Schematic figure of the surface ultraviolet (UV) processor.
Atmosphere 11 00324 g001
Figure 2. The erythema action spectrum s e r .
Atmosphere 11 00324 g002
Figure 3. UV index as a function of total ozone column and solar zenith angle with surface albedo of 0.2, aerosol optical depth of 0.1, aerosol single scattering albedo of 0.95, cloud optical thickness of 0.0, and surface elevation of 0 m.
Atmosphere 11 00324 g003
Figure 4. UV-A irradiance as a function of total ozone column and solar zenith angle with surface albedo of 0.2, aerosol optical depth of 0.1, aerosol single scattering albedo of 0.95, cloud optical thickness of 0.0, and surface elevation of 0 m.
Atmosphere 11 00324 g004
Figure 5. Location of virtual stations used for verification of the surface UV products.
Atmosphere 11 00324 g005
Figure 6. Clear-sky UV index corresponding to atmospheric scenario. (Left) 1 April 2012 12:00 UTC. (Right) 1 July 2012 12:00 UTC.
Atmosphere 11 00324 g006
Figure 7. Clear-sky UV-A irradiance corresponding to atmospheric scenario. (Left) 1 April 2012 12:00 UTC. (Right) 1 July 2012 12:00 UTC.
Atmosphere 11 00324 g007
Figure 8. Surface UV model UV index statistics for each virtual station. The stations are sorted such that the southernmost station is located on the left and the northernmost station on the right.
Atmosphere 11 00324 g008
Figure 9. Surface UV model UV-A irradiance statistics for each virtual station. The stations are sorted such that the southernmost station is located on the left and the northernmost station on the right.
Atmosphere 11 00324 g009
Figure 10. Surface UV model UV index statistics relative to model base run for each virtual station corresponding to different data assimilation and fusion experiments. The stations are sorted such that the southernmost station is located on the left and the northernmost station on the right.
Atmosphere 11 00324 g010
Figure 11. Surface UV model UV-A irradiance statistics relative to model base run for each virtual station corresponding to different data assimilation and fusion experiments. The stations are sorted such that the southernmost station is located on the left and the northernmost station on the right.
Atmosphere 11 00324 g011
Figure 12. AURORA (Advanced Ultraviolet Radiation and Ozone Retrieval for Applications) data-processing chain manager.
Atmosphere 11 00324 g012
Figure 13. HappySUN App screenshots.
Atmosphere 11 00324 g013
Table 1. The input parameters, their ranges and for the look-up table used for UV index and UV-A computations.
Input ParameterLook-up Table Points
Total Column Ozone (DU)50, 97, 146, 206, 311, 471, 700
Surface Albedo0.00, 0.48, 0.70, 0.85, 1.00
Aerosol Optical Depth0.00, 0.16, 0.36, 0.65, 1.05, 1.59, 2.00
Aerosol Single Scattering Albedo0.50, 0.76, 0.89, 1.00
Cloud Optical Thickness0.0, 6.9, 14.7, 25.3, 39.5, 57.8, 84.6, 140.0
Solar Zenith Angle (degrees)0.00, 18.4, 30.3, 41.3, 52.7, 66.1, 90.0
Surface Elevation (m)0, 2780, 5230, 6810, 8000
Table 2. List of virtual station locations used for surface UV product verification.
Station IDLocationLatitude (degrees)Longitude (degrees)
AMSAmsterdam, Netherlands52.4° N4.9° E
ANCAnchorage, USA61.2° N149.1° W
ATHAthens, Greece38° N23.7° E
BEIBeijing, China39.9° N116.4° E
BERBerlin, Germany52.5° N13.4° E
DOUDouala, Cameroon4.1° N9.7° E
DUBDubai, United Arab Emirates25.2° N55.3° E
HELHelsinki, Finland60.2° N24.9° E
HONHonolulu, Hawaii21.3° N157.8° W
JAKJakarta, Indonesia6.2° S106.8° E
KANKangerlussuaq, Greenland67° N50.7° W
KATKathmandu, Nepal27.7° N85.3° E
KIEKiev, Ukraine50.4° N30.5° E
LONLongyearbyen, Svalbard78.2° N15.6° E
MEXMexico City, Mexico19.4° N99.1° W
MOSMoscow, Russia55.8° N37.6° E
NAINairobi, Kenya1.3° S36.8° E
OSLOslo, Norway55.7° N12.6° E
PARParis, France48.9° N2.3° E
QUIQuito, Ecuador0.2° S78.5° W
RIORio de Janeiro, Brasil22.9° S43.2° W
ROMRome, Italy41.9° N12.5° E
SANSan Diego, USA32.8° N117.1° W
SYDSydney, Australia33.9° S151.2° E
TOKTokyo, Japan35.7° N139.8° E
TORToronto, Canada43.7° N79.4° W
Table 3. Model experiments used in the study.
Experiment NameAim of the Experiment
L2LEOTo study the impact of assimilation of Sentinel-5 LEO L2 products.
LEOLEOTo study the impact of assimilation of Sentinel-5 LEO L2 products after their fusion, versus direct assimilation (L2LEO).
LEOLEO_GEOGEOTo study the impact of assimilation of Sentinel-4 GEO and Sentinel-5 LEO fused products, versus LEO only (LEOLEO).
LEOGEOTo study the impact of assimilation of a single LEO-GEO (i.e., cross-platform) fused product, versus direct assimilation (L2LEO_L2GEO) or partial fusion (LEOLEO_GEOGEO).
L2LEO_L2GEOTo study the impact of direct assimilation of L2 LEO and L2 GEO products without fusion.