Article

Direct Measurement of Adhesion Force of Individual Aerosol Particles by Atomic Force Microscopy

1
Graduate School of Natural Science and Technology, Kanazawa University, Kakuma, Kanazawa, Ishikawa 920-1192, Japan
2
College of Science and Engineering, Kanazawa University, Kakuma, Kanazawa, Ishikawa 920-1192, Japan
3
Nano Life Science Institute, Kanazawa University, Kakuma, Kanazawa, Ishikawa 920-1192, Japan
4
Faculty of Science and Technology, Keio University, 3-14-1, Hiyoshi Kohoku-ku, Yokohama, Kanagawa 223-8522, Japan
5
Institute of Nature and Environmental Technology, Kanazawa University, Kakuma, Kanazawa, Ishikawa 920-1192, Japan
*
Author to whom correspondence should be addressed.
Atmosphere 2020, 11(5), 489; https://doi.org/10.3390/atmos11050489
Submission received: 21 April 2020 / Revised: 7 May 2020 / Accepted: 8 May 2020 / Published: 10 May 2020

Abstract

:
A new method, namely, force–distance curve mapping, was developed to directly measure the adhesion force of individual aerosol particles by atomic force microscopy. The proposed method collects adhesion force from multiple points on a single particle. It also takes into account the spatial distribution of the adhesion force affected by topography (e.g., the variation in the tip angle relative to the surface, as well as the force imposed upon contact), thereby enabling the direct and quantitative measurement of the adhesion force representing each particle. The topographic effect was first evaluated by measuring Polystyrene latex (PSL) standard particles, and the optimized method was then applied on atmospherically relevant model dust particles (quartz, ATD, and CJ-1) and inorganic particles (ammonium sulfate and artificial sea salt) to inter-compare the adhesion forces among different aerosol types. The method was further applied on the actual ambient aerosol particles collected on the western coast of Japan, when the region was under the influence of Asian dust plume. The ambient particles were classified into sea salt (SS), silicate dust, and Ca-rich dust particles based on individual particle analysis (micro-Raman or Scanning Electron Microscope/Energy Dispersive X-ray Spectroscopy (SEM-EDX)). Comparable adhesion forces were obtained from the model and ambient particles for both SS and silicate dust. Although dust particles tended to show smaller adhesion forces, the adhesion force of Ca-rich dust particles was larger than the majority of silicate dust particles and was comparable with the inorganic salt particles. These results highlight that the original chemical composition, as well as the aging process in the atmosphere, can create significant variation in the adhesion force among individual particles. This study demonstrates that force–distance curve mapping can be used as a new tool to quantitatively characterize the physical properties of aerosol particles on an individual basis.

1. Introduction

Aerosol particles interact with the deposition surface through their “adhesion force”, which consists of van der Waals, electrostatic, and capillary forces [1]. It is a force by which particles continue to remain in contact with the deposition surface. The adhesion force of particles strongly influences the behavior and fate of atmospheric aerosols. For example, it is closely related to the collection efficiency of particles on an impaction substrate, which is commonly used as the sampling method for offline chemical analysis. This collection method depends largely on the particle adhesion force [1]. While sticky particles with larger adhesion force remain on the impaction plate, less sticky particles with smaller adhesion force tend to bounce off, which leads to a reduced collection efficiency and a source of size classification bias [2]. On the other hand, whether a once deposited particle detaches and re-disperses into the atmosphere (i.e., the resuspension process) depends largely on the adhesion force. The resuspension process is important in assessing the environmental impacts of secondary diffusion of harmful particles, such as heavy metals, biological agents, and Asian dust contaminated by radioactive cesium (137Cs) following deposition on outdoor surfaces [3,4]. In the field of renewable energy, it is known that dust deposition on photovoltaic (PV) panels reduces the energy yield in solar power plants [5]. Therefore, the adhesion force of particles is considered (for example in the simulation of the electrodynamic dust shield) to remove the dust adhered on the PV surface [6]. Therefore, investigation and quantitative knowledge of the adhesion force of aerosol particles are essential for understanding the impact of particles on the environment and the energy industry. Despite the relevance of the adhesion force to the atmospheric environment, studies in the past have mainly dealt with the physical properties of particles while they are still airborne. How the adhesion force may control the emission and deposition of particles on surfaces may not have attracted as much attention.
The lack of extensive studies on the adhesion force of atmospheric aerosols is partly related to the technical difficulty associated with its direct and quantitative evaluation. Several methods have been employed for the measurement of adhesion force of aerosol particles, such as the centrifugal method [7], abruption method [8], and vibration method [9]. However, these methods can only provide estimates based on indirect observation and the results represent an average of the bulk aerosol. Therefore, these methods are more suited to characterizing single component aerosols with small particle-to-particle variation.
Ambient aerosol particles are very often in a complex mixture, where various types of chemicals having different physical properties (shape and phase) are found mixed in different proportions within individual particles. Conventional methods cannot take into account such particle to particle variability and are not directly applicable to the characterization of the adhesion force of ambient aerosols. For example, Asian dust (the wind-blown dust from arid or semi-arid regions, such as the Loess Plateau and Gobi desert in China and Mongolia) includes quartz, clay mineral, and carbonates [10,11,12]. In addition, it reacts with trace gases in the atmosphere, such as sulfur oxides (SOx) and nitrogen oxides (NOx) during long-range transport, and the chemical composition of its particles become more complex than at the point of their emission [13,14,15,16]. In addition, not all dust particles undergo this aging process equally. For example, it is known that Ca-rich mineral dust is particularly reactive and prone to aging. Although dust particles are commonly regarded as representative irregular particles, the heavily processed Ca-rich dust particles are often found to be spherical after they interact with pollution and water vapor in the maritime air [17,18]. Therefore, a new method is needed that can accurately assess the adhesion force of ambient aerosols on an individual particle basis.
Here, atomic force microscopy (AFM) was applied to directly measure the adhesion force of individual aerosol particles. AFM normally scans the sample with a nanoscale tip extending from a free end of a flexible cantilever. Most AFMs have the capability (i.e., a force spectroscopy mode) to maneuver the tip to directly poke a given point on the sample surface by approaching and retracting the tip to and from the sample along the vertical (Z) axis of the piezo stage scanner. Throughout the poking process, the physical deflection of the cantilever can be recorded as numeric data, and a force–distance curve can be obtained by plotting the cantilever deflection as a function of the physical distance between the tip and the sample. The force–distance curve reflects the forces acting between the AFM tip and the sample surface, which can be used to directly and quantitatively derive various types of physical forces including the adhesion force [19]. Several studies in the material and biological sciences have utilized the capability of AFM to characterize physical properties, including the adhesion force acting between the tip and sample within a microscopic space [20]. An additional advantage of using AFM is that it can be operated under atmospheric conditions, which helps to maintain the physical (and biological) property and phase of the sample intact.
Despite the potential and compatibility of AFM for aerosol research, studies characterizing the physical properties of individual aerosol particles using AFM are still limited. For example, De-Falco et al. (2015) performed a measurement of flame-formed carbon nanoparticles and evaluated the adhesion force between the tip and the particle [21]. Tan et al. [22] and Moutinho et al. [23] fixed a dust particle onto an AFM cantilever tip and measured the adhesion force between the dust particle and the substrates. However, adhesion force values collected using these methods may only reflect the result from a certain point on a particle rather than the entire particle, because the measurements were conducted on a few limited points. This is particularly important when applying the method to ambient particles with large particle-to-particle variability and greater surface heterogeneity than single component, laboratory generated model particles.
In theory, the piezo stage of an AFM system allows the tip to be in direct physical contact with the sample in nanometer steps. By scanning the sample horizontally in the X and Y directions and repeat the poking cycles in gridded points, the spatial distribution of a certain physical property can also be collected by the AFM. In this study, we utilize the high spatial resolving power of the AFM to perform not only a point measurement, but also “force–distance curve mapping” for a more comprehensive measurement of adhesion force of individual aerosol particles. The aim of this study was to develop a direct and quantitative measurement method of the adhesion force of individual aerosol particles, by taking into account the spatial variation and topographic effects within the surface of a single particle. The proposed method was tested on various types of atmospherically relevant model particles. Furthermore, the adhesion forces of Asian dust particles after long-range transport were also evaluated to demonstrate the applicability of this method on ambient aerosol particles with complex composition and mixing states and shapes.

2. Sampling and Analysis

2.1. Sample Preparation

In this study, six standard samples, including PSL, three type of standard dust (quartz, Arizona test dust [ATD], and CJ-1 standard Asian dust [24]), and two standard inorganic salts (ammonium sulfate and artificial sea salt: S9883, Sigma-Aldrich, Missouri, USA [25]), were prepared. PSL suspension and standard inorganic salt solution were aerosolized by an atomizer (ATM226, Topas, Germany) and dried using silica gel-filled diffusion driers. Powders of standard dust samples were sealed in a plastic bag together with a magnetic stirrer, and aerosolized by flashing the bag with filtered air and agitating it with a stirrer. The above aerosolized samples were collected on Si wafer substrates using a low volume impactor with a 50% cut-off diameter of 1.1 μm at a flow rate of approximately 1.0 LPM.
The ambient aerosol particles were collected at the Kanazawa University campus (36.54° N, 136.70° E), along the western coast of central Japan, on 7–17 April 2018. The Japan Meteorological Agency announced that the region was under the influence of the Asian dust plume on those days. The collected coarse particle fraction can be considered to represent aged dust particles following long-range transport. The basic meteorological conditions, such as temperature, relative humidity, and pressure, were recorded using a mobile meteorological sensor (TR-72Ui, T&D Corporation, Nagano, Japan). They were 10.1 °C, 53%, and 990.4 hPa for the samples gathered on the 7th, respectively, and 15.9 °C, 48%, and 1004.4 hPa for the samples taken on the 17th, respectively. The ambient aerosol particles were also collected by the same impactor used for the preparation of model aerosols in the laboratory.

2.2. Collecting Atomic Force Microscopy Images of Aerosol Particles

A combined system of an AFM head and a confocal Micro-Raman spectroscopy (Nanofinder®HE, Tokyo Instruments, Tokyo, Japan) was used to characterize individual particles in this study. To prevent the effect of relative humidity (RH) on particle shape and phase (and hence adhesion force), we constantly supplied filtered and dried air around the AFM head to maintain RH at approximately 20%. Controlling RH is important for comparing the properties among particles in equal condition. In doing so, the resulting adhesion force can be considered as being mostly controlled by van der Waals force, and the variation caused by the capillary force can be minimized [23]. The electrostatic force can also contribute to the adhesion force, which is normally observed as a force acting on longer ranges (30 nm to 1 µm [22,26]). Such attraction force was not observed in this study, which further supports the view that the force curve observed in this study mostly reflects the shorter-range van der Waals force [23]. For collecting the morphology and dimension of the particles, basic AFM images such as height, mag (feedback error signal), and phase were collected in the AC (semi-contact) mode using a silicon AFM tip (OMCL-AC240TS, OLYMPUS, Tokyo, Japan) with a resonance frequency in the range of 50 to 90 kHz and a typical tip radius with a curvature of 7 nm. Imaging scan rates of the AFM images were typically 0.2–1.0 Hz and the resolution was 10 nm.

2.3. Protocol of Force–Distance Curve Mapping for Individual Aerosol Particles

The measurement of adhesion force was performed in contact mode using silicon AFM tips (ATEC-CONT, NANOSENSORSTM, Neuchatel, Switzerland) with a typical tip radius with a curvature of 10 nm. The AFM head is removed in order to replace the tip for the semi-contact mode to that of contact mode. During the process, we kept track on the previously scanned particles through the optical microscope images (×100) on the same field of view, to ensure that the force–distance curves are collected from exactly the same particles. The tip scan velocity was limited to 1 μm/s to minimize thermal drift or the dynamic effect [19,26]. The force–distance curve contains the vertical distance in which a pulled cantilever would travel as it springs back to its original (unloaded) position. This is recorded at the moment the adhesion force holding the tip (in direct contact with the sample) exceeds the spring constant and is pulled off as the sample stage is retracted away from the tip. The correct spring constant is therefore needed to convert this distance to the adhesion force. The nominal spring constant was indicated to have a wide range (0.02 to 0.75 N/m); therefore, the actual value for each cantilever was quantified using GetRealTM software with Cypher AFM (Oxford Instruments, Tokyo, Japan). It was shown to be in the range 0.32 to 0.38 N/m. A conceptual illustration and a more detailed description of a force–distance curve can be found in the Supplementary Information (Figure S1).
Force–distance curve mapping was performed on the individual aerosol particles with a horizontal resolution of 50 nm. Where micrometer-sized coarse particles are concerned (as in this study), the steep gradient of the particle topography relative to the substrate often causes problems, as the scan velocity of the piezo scanner of most AFM cannot catch up with the rapidly changing topography. During force–distance curve mapping, the initial vertical position of the tip relative to the substrate was set above the particle height by lifting it from position I to position II, as shown in Figure 1. This prevents the tip from physically hitting the particle and sweeping the particle off the substrate. Force–distance curves were acquired by approaching and retracting the tip within the predefined vertical range, indicated by III in Figure 1. The drawback in this configuration is that the adhesion force cannot be detected if a certain part of a particle is too flat and low, such that the tip cannot poke strongly enough or even touch the particle surface at the lowest point. Anyhow, such oversight can be prevented by carefully adjusting the initial position (II) by referring to the particle height in the AFM images previously collected in semi-contact mode. Specifically, (i) we first obtain the particle height in semi-contact mode. (ii) After replacing the tips, a force–distance curve measurement is performed on the adjacent substrate to obtain the contact point (Z-position) at which probe tip touches the substrate. (iii) The initial position of the tip is lifted to ensure that the distance between the initial position and contact point is longer than the maximum particle height.
As many as 102–103 force–distance curves were collected from each particle by mapping and were processed using statistical computing software, R. With the current configuration, depending on the height of the landing point, some force–distance curves resulted from cases in which the tip barely touched the particle surface, or even failed to touch any surface at all. Such curves do not reflect the true adhesion force and have to be excluded from data analysis. Such invalid data points were rejected by setting a threshold: only those having detectable deflection at the event of tip pull-off during the retraction phase were extracted. Invalid force–distance curves, shown as black lines in Figure 2d,e, were instead treated as base lines to distinguish the contact point or correct loading force of the valid curves (red lines, Figure 2d,e).

2.4. Chemical Composition Analysis of Individual Aerosol Particles

Following physical characterization by the AFM, the chemical composition of the individual ambient aerosol particles was also analyzed by Micro-Raman spectroscopy and SEM-EDX analysis. The Raman spectra of individual particles were obtained using a Nanofinder HE (Tokyo Instruments, Tokyo, Japan) with a 532 nm excitation laser with the intensity of 4.906–16.35 mW to minimize sample damage. This laser wavelength was mainly chosen to detect the C–H vibration and O-H vibration peaks [27]. Assignments for other Raman shift peaks obtained in this study are summarized in Table 1. The laser spot size was approximately 1 μm in diameter using a 100 × objective lens. For each 0.75–1 μm step, a Raman spectrum was acquired with an exposure time of one second and 10 accumulations. The X-ray spectrum of individual particles were collected by SEM-EDX (SEM, S3000N, Hitachi, Tokyo, Japan; EDX, EMAX-500, Horiba, Kyoto, Japan). The X-ray spectra were collected with an acceleration voltage of 20 kV and a working distance of 15 mm. Carbon was used for coating the samples to prevent electron charge-up.

3. Results and Discussion

3.1. Force–Distance Curve Mapping on PSL

The force–distance curve mapping method was first applied on PSL (dp = 1 μm) as a representative spherical, single component particle. As the adhesion force on a PSL is expected to be uniform across the surface, it is useful for evaluating the topographic effects. For example, if the sample surface has an excessively steep slope relative to the approaching tip, the contact angle will be affected and the adhesion force will not be the same as in an ideal case where the tip approaches perpendicularly to the surface. Figure 2c shows a typical adhesion force mapping image of a PSL. Two force–distance curves in Figure 2d,e, extracted from the mapping data, show that contact distance and loading forces are different due to differences in particle height at the respective points. These contact distances (equivalent to particle height) were used to derive the slope at each point on the particle surface. A comparison of the mapping images of the slope and adhesion force (Figure 2b,c,f) suggests that the slope of the measurement point indeed influences the adhesion force. To account for the effect of surface slopes on adhesion force, the approximate slope of the sample surface was obtained by the least-square of the heights in the data point and the adjacent four points. In this study, the adhesion force values whose slopes of particle surface were less than 15 degrees relative to the perpendicular plane were extracted, and the median values were defined as the typical adhesion force representing individual particles. The average adhesion value of PSL was obtained by scanning 12 particles, and calculated to be 1 ± 44 nN.

3.2. Force–Distance Curve Mapping on Standard Dust Particles

An AFM mag image of the standard dust particles show their typical irregular shapes (Figure 3). Some particles also showed flat surfaces that resembled a crystal plane typically associated with clay minerals prone to cleavage. Indeed, Raman spectra of CJ-1 and ATD particles indicate that most of them include clay mineral or quartz because of their characteristic florescence spectra (Figure 3b), or a peak similar to quartz (Figure 3a) [34]. Adhesion force values of the three types of dust particles were derived by force–distance curve mapping. Representative values of each particle were found to fall in a similar range. Average representative values for ten quartz, nine CJ-1, and seven ATD particles were 19 ± 10 nN, 19 ± 10 nN, and 18 ± 9 nN, respectively.
The adhesion force mapping images are patchier and vary from one point to the next. This becomes more obvious when they are compared with the smoother, uniform mapping image on PSL (Figure 3). This is another illustration of how an adhesion force from a single force–distance curve may vary depending on the measurement point. The mapping image clearly shows that the adhesion force on a single particle can have large spatial variability. This justifies the collection of force curves from multiple points to obtain a more statistically representative value.
It is worth noting that we found many of the standard dust particles to be only weakly attached to the Si wafer, and many particles were swept away by the tip as we tried to obtain AFM images. We were able to conduct force–distance curve mapping only on dust particles that stayed attached to the wafer. It is therefore possible that the adhesion forces of the more adhesive particles may have been selectively measured. These values must therefore be considered as the upper limits of the adhesion force of quartz, CJ-1, and ATD particles.

3.3. Force–Distance Curve Mapping on Inorganic Aerosol Particles

Atomic Force Microscopy mag images of ammonium sulfate (AS) show that these particles are closer to a spherical shape and have a smoother surface compared with dust particles. Meanwhile, artificial sea salt (ASS) particles showed two types of morphology, namely, non-crystalline and crystalline shapes. Some of them were found to have both features (Figure 4). In total, 11 AS and 10 ASS particles were subject to adhesion force measurement by force–distance curve mapping. The representative values for AS and ASS were 28 ± 6 nN and 26 ± 9 nN, respectively, which are consistently higher than that of standard dust particles.

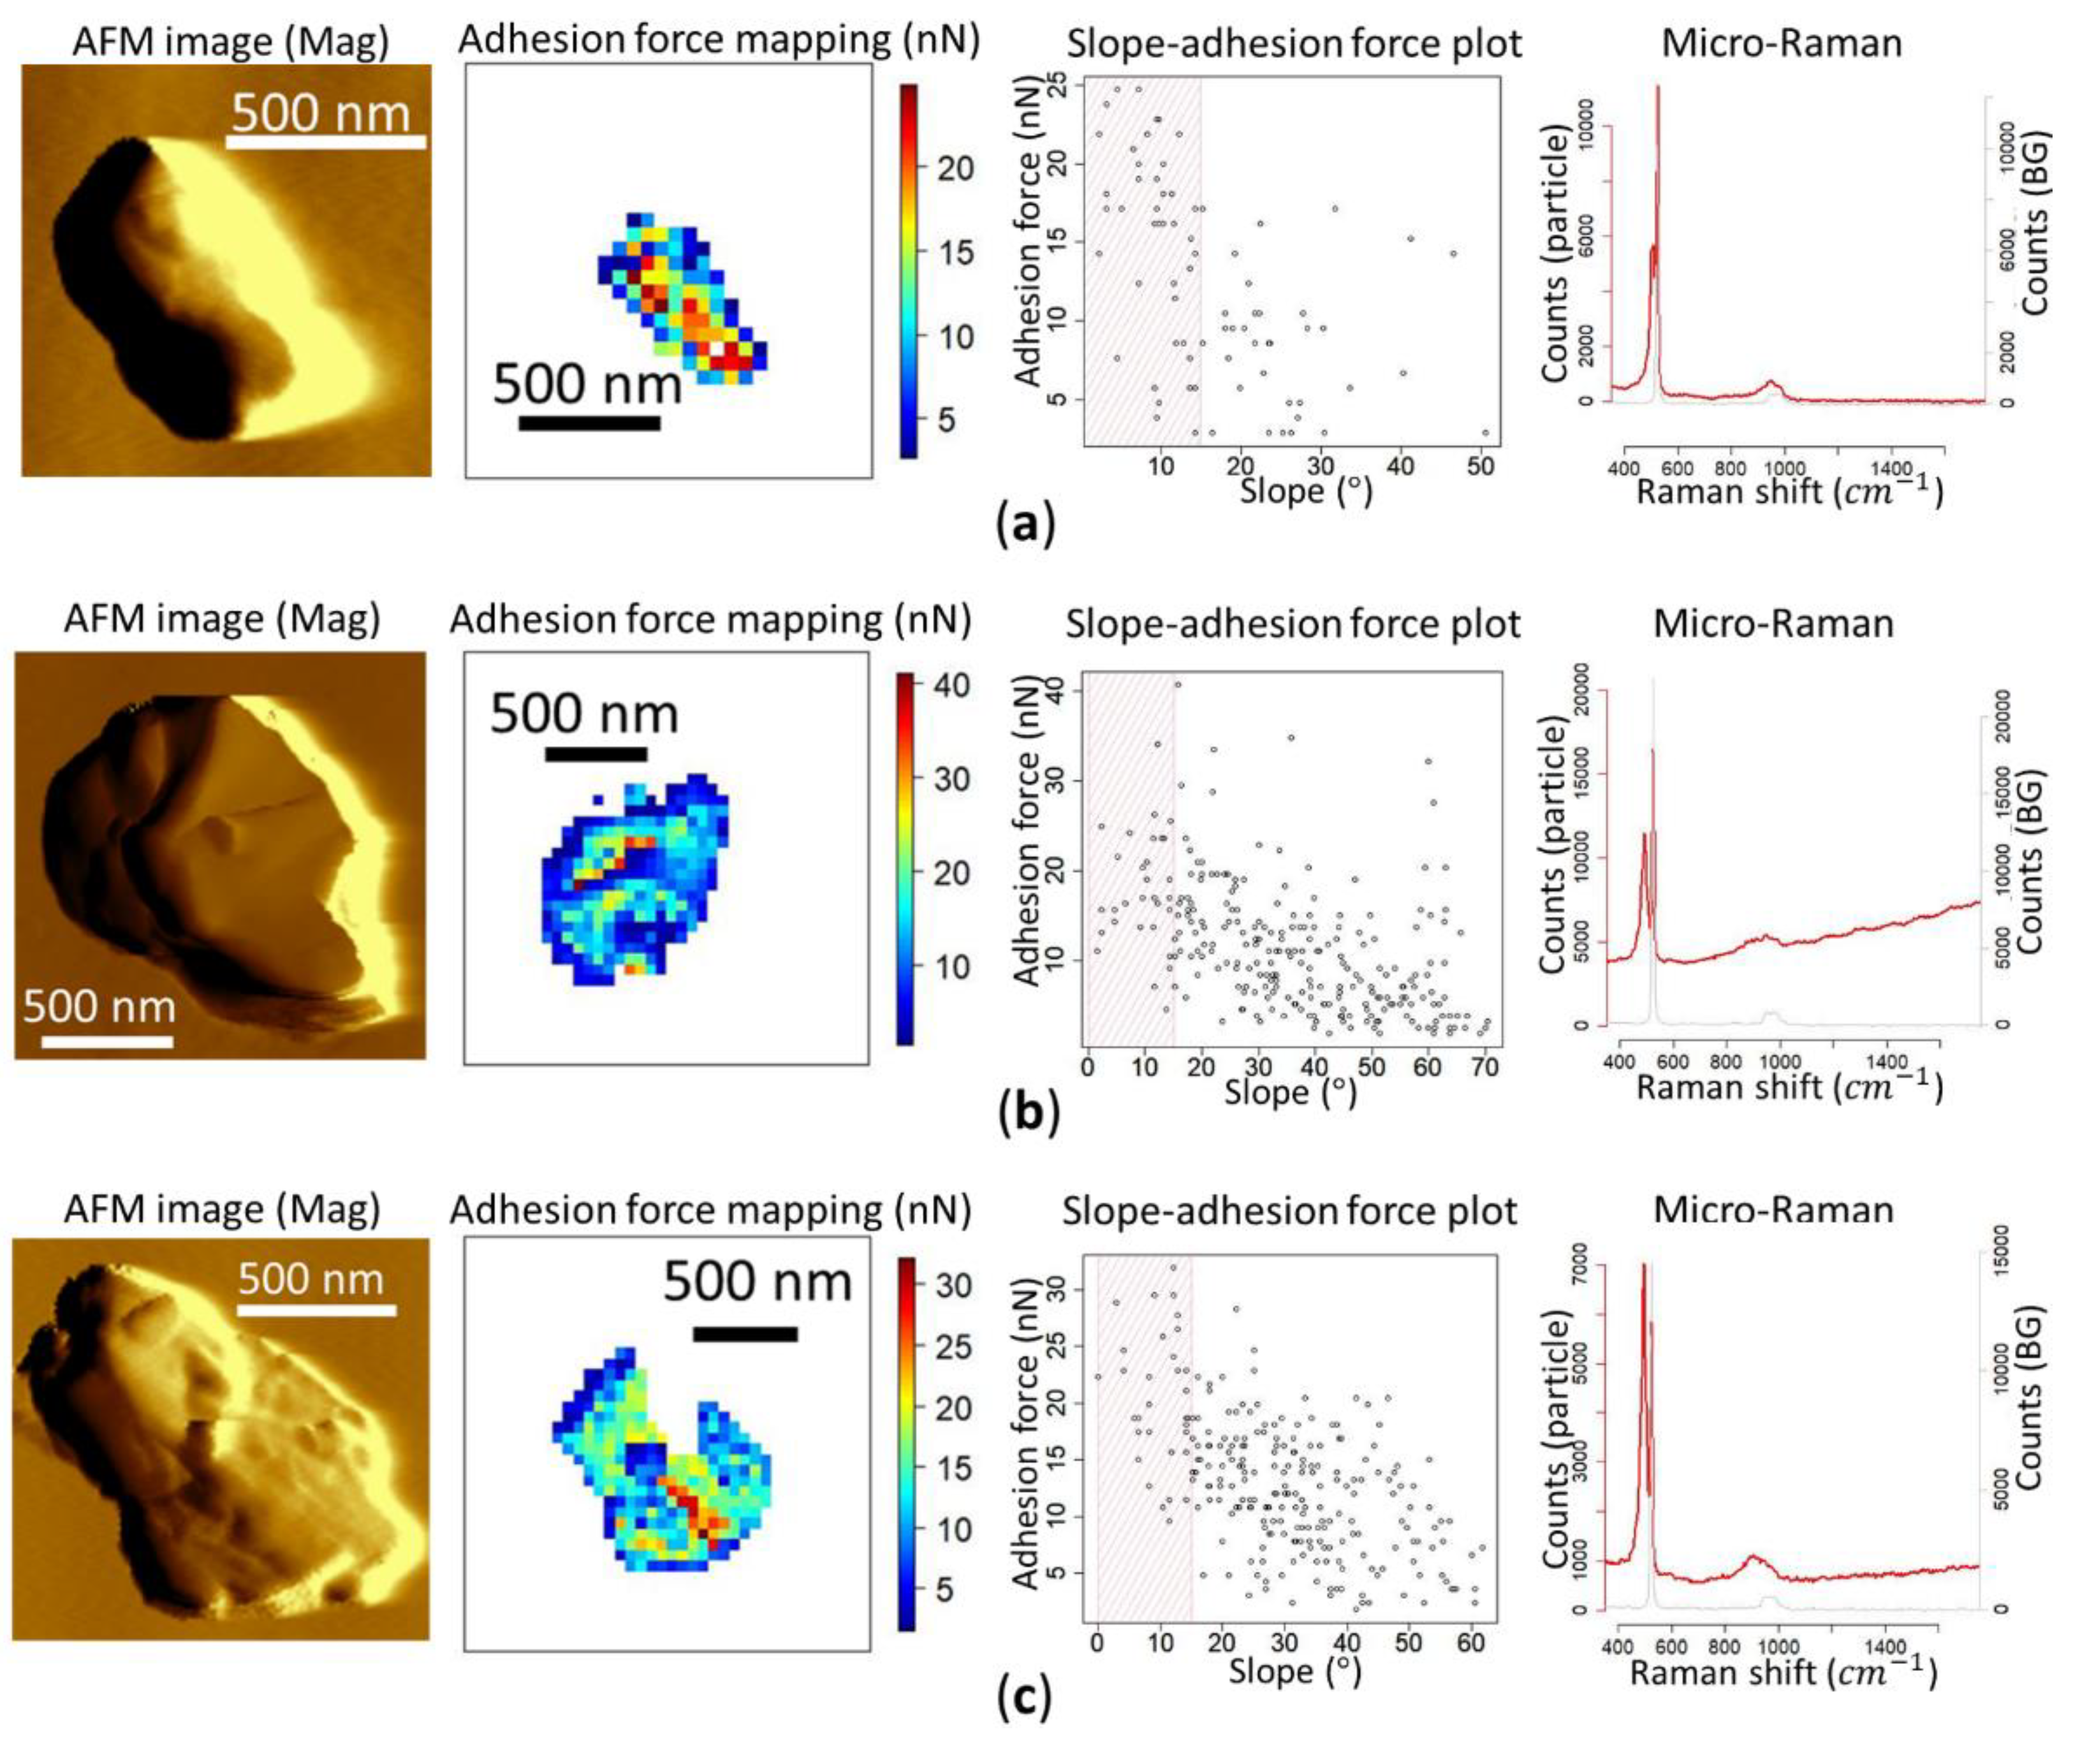
3.4. Chemical Analysis and Force–Distance Curve Mapping of Ambient Aerosol Particles

For ambient aerosol particles, chemical analysis revealed that the coarse particles were mainly dominated by groups of particles identified as sea salt (SS), silicate dust, and Ca-rich dust. The adhesion force values of ambient aerosol particles were also measured by force–distance curve mapping prior to the chemical identification of the aerosol type. SS particles were characterized by the detection of Na, Mg, and Cl peaks in the EDX spectra. Moreover, the chemical analyses indicate that SS aged in the atmosphere, since these particles showed excess S in the EDX spectra and/or were detected with NaNO3 peaks by Raman [35]. Their morphology in the AFM images closely resembles that of ASS (Figure 5a).
Silicate dust particles were identified by the characteristic morphology in the AFM mag images, and confirmed by the detection of Al and Fe peaks in the EDX spectra and/or quartz peaks in the Raman spectra. (Si cannot be used as the reference in the EDX spectra since a Si wafer was used as the substrate.) These silicate particles were also found with excess S, which is most likely associated with the formation of sulfate during long-range transport [13,14,17]. However, such aging of silicate particles did not significantly alter the morphology of the silicate particles, and their irregular shapes closely resembled the model dust particles (Figure 5b).
Ca-rich dust was also identified based on the AFM images and confirmed by the detection of Ca peaks in the EDX spectra, and Raman peaks corresponding to CaCO3 or Ca(NO3)2 (Figure 6c). Unlike silicate particles, AFM images of these particles do not show typically irregular dust particle shapes. Instead, these particles are often found to have a spherical outline and a dome-like shape. Detection of S and Ca(NO3)2 strongly supports that these dust particles were originally calcite dust, and were heavily processed by sulfate or nitrate due to atmospheric aging. It is reported that Ca(NO3)2 is highly deliquescent and remains in an amorphous phase even in conditions with very low relative humidity [17,18,36,37]. Average adhesion force values of 23 sea salt, 16 silicate dust, and 11 Ca-rich dust particles were determined to be 25 ± 8 nN, 19 ± 7 nN, and 27 ± 11 nN, respectively (Figure 6).

3.5. Comparison of Adhesion Forces among Different Particle Types

The mean and standard deviation of adhesion force values collected from individual particles in the previous sections are shown for each particle type in Figure 6. It must be pointed out that, the adhesion forces presented here basically represent forces acting between the tip and the surface of the particle. It is expected to be influenced not only by the slope, but also factors including the tip radius; material; coating; as well as particle composition, curvature, or surface roughness. Therefore, care must be taken when comparing the adhesion forces among different particles types, especially when the measurements were conducted under different experimental setups. The adhesion force collected by De Falco [21] on flame-formed carbon nanoparticles by a similar method is shown in Figure 6 for comparison. The intention here was not to directly compare the absolute adhesion forces with various micrometer-sized particles measured in this study. Instead, it provides the expected range of variation even among the laboratory generated, single component aerosol particles. This partly explains the rather wide spread of the values even among the same particle group measured in this study, and helps to illustrate the degree of surface heterogeneity.
A comparison of the two standard particle classes—standard dust and inorganic particles—shows that the adhesion force of inorganic particles is consistently larger than that of dust particles. The results of the ambient aerosol particles can also be compared with those of standard particles with similar compositions. The adhesion force of SS, representing inorganic salt particles from the ambient atmosphere, was found to be as large as the laboratory prepared, standard inorganic salt particles (ASS and AS). This indicates that the aging of sea salt particles (Cl-loss mechanism [35,38]) does not significantly influence the adhesion force of the original particles.
The adhesion forces of the model dust particles (quartz, ATD, and CJ-1) were all similar in range, and tended to be lower than that of the inorganic particles. The aged silicate dust particles collected from the ambient atmosphere were found to contain sulfate on their surface, due most likely to heterogeneous reactions taking place during long-range transport. However, the adhesion force of such aged silicate dust did not show a noticeable increase and remained at the same level as the model dust particles. The degree of inorganic coating on silicate dust may not be as thick, such that it is not enough to completely turn the surface equally adhesive as the pure inorganic particles.
Interestingly, Ca-rich dust particles showed the largest adhesion force among all particles investigated in this study and were found to be equally adhesive as the SS particles. It is reported that calcite (CaCO3) is the most reactive fraction among dust particles, especially when it reacts with nitrate to form extremely hygroscopic Ca(NO3)2 when it undergoes complete processing and can turn from solid irregular particle into amorphous liquefied state. The physical property of such coating will be closer to deliquescent salt than its original mineral. The above results imply that the original mineralogical composition of individual dust particles, as well as the reaction pathway in the atmosphere, determines the physical properties on the dust surface and creates variation in the dust adhesion force after aging. The current result strongly supports the need to directly characterize particle physical properties on an individual basis, and that force–distance curve mapping can be a promising technique to resolve particle-to-particle variation of the adhesion force.
In addition, a much closer look at the individual particles reveals that several SS particles measured in this study are internally mixed. The SS particle in Figure 7 is an example of such an internally mixed particle, showing both crystalline and non-crystalline morphological features. The spatial distribution of the adhesion force on this particle is visualized by overlapping the AFM mag image with the adhesion force mapping (Figure 7a). Only the points with a modest slope on the surface (0–15 degrees) are accounted for in the figure. It was found that the adhesion force measured from the crystalline parts was generally larger than that of the non-crystalline parts. This result indicates that it is difficult to evaluate the representative adhesion force of a particle based only on an arbitrary, single point measurement. This is especially true when variable morphology, surface roughness, and phase states are found within the same particle, such as the one shown in Figure 7.

4. Conclusions

A new method, namely, force–distance curve mapping, was developed to quantitatively derive the adhesion force of individual aerosol particles using AFM. The tip loading force and surface slopes of particles were found to affect the adhesion force based on the initial tests on PSL. Measurement protocol and post data processing were optimized for a more comprehensive evaluation of the adhesion force.
The proposed method was then applied to both model and ambient aerosol particles. The adhesion forces of standard dust (quartz, ATD, and CJ-1) and inorganic (AS and ASS) particles, as well as the ambient aerosol particles collected from an aged Asian dust plume were measured and compared. The ambient particles were classified into SS, silicate dust, and Ca-rich dust particles based on individual chemical analysis (micro-Raman or EDX).
Two morphological types (crystalline and/or non-crystalline shapes) were observed from the AFM images of SS and ASS particles. Chemical analysis showed that SS particles have excess sulfur and nitrate that are normally absent in fresh SS or ASS, suggesting that SS had been aged in the atmosphere [35]. The adhesion forces of SS and ASS, however, were found to be at the same level. This result suggests that the aging of SS does not play a significant role in changing its adhesion force. On the other hand, there may be variation in the adhesion force depending on the shape, surface roughness, and phase state, even within the same particle.
Many silicate dust particles were found in the ambient aerosols collected during the Asian dust event, and were characteristically irregularly shaped in the AFM images. However, chemical analysis also showed signs that these particles have been aged in the atmosphere by acquiring sulfate. A comparison of the adhesion force of such aged silicate particles with standard dust (quartz, ATD, and CJ-1), did not show a significant increase, indicating that the sulfate coating may not be thick enough to noticeably affect their original adhesion force.
Although the aging of SS and silicate dust did not affect the adhesion force of the particles, a fraction of dust particles enriched in Ca were found to be particularly adhesive, and showed values similar to—or even higher than—pure inorganic salts. Such Ca-rich particles demonstrated a spherical outline and dome-like topography, indicating that they were heavily processed, formally composed of calcite and later reacted in the atmosphere to form Ca(NO3)2. This result clearly indicates that even though silicate and calcite dust particles are generally treated as if they belong in the same particle type as mineral dust, depending on their original composition and reaction pathways, their physical properties can be significantly different after long-range transport. This is a good demonstration of the importance of being able to evaluate physical properties on an individual particle basis, since such particle-to-particle variation and diversity cannot be resolved with conventional bulk methods.
This study demonstrates the applicability of force–distance curve mapping for the direct and quantitative evaluation of the adhesion force of individual aerosol particles. By applying the method on ambient aerosol particles, this study indicates that the aging process does not equally affect the adhesion force of different types of particles. It is subject to both the chemical composition of the original particle as well as its mixing counterparts. This highlights the need to conduct investigations on the physical properties on an individual particle basis for accurately assessing the environmental impact of particles following their deposition and interaction with the deposition surface. Currently, we limited the analysis and comparison to dry conditions. How the observed adhesion forces change depending on changing relative humidity (i.e., capillary force) remains a future task. We believe that force–distance curve mapping is a promising tool that can help improve our understanding of previously overlooked interactions between atmospheric aerosols and deposition surface.

Supplementary Materials

The following are available online at https://www.mdpi.com/2073-4433/11/5/489/s1, Figure S1: Conceptual illustration of a typical force–distance curve obtained by AFM, Figure S2: AFM images of 1 μm PSL particle in Figure 2, Figure S3: AFM images of model dust particles in Figure 3, Figure S4: AFM images of inorganic particles in Figure 4, Figure S5: AFM images of ambient aerosol particles identified in Figure 5, Figure S6: The original slope and adhesion force mapping images collected from the SS particle in Figure 7.

Author Contributions

Conceptualization, K.O. and A.M.; data curation, K.O. and Y.M.; software, K.O. and A.I., formal analysis, K.O. and Y.M.; funding acquisition, A.M.; investigation, K.O. and Y.M.; methodology, K.O., M.F., Y.M., T.F., R.K., N.T., and A.I.; project administration, A.M.; supervision, M.F., A.I., T.F., and A.M.; validation, K.O. and A.M.; writing—original draft, K.O.; writing—review and editing, K.O., A.I., and A.M. All authors have read and agree to the published version of the manuscript.

Funding

This study was supported by the Japan Society for the Promotion of Science (JSPS) Funding Program for Next-Generation World-Leading Researchers (grant no. GR045) and a JSPS KAKENHI Grant-in-Aid for Scientific Research B (grant no. JP18H03355).

Acknowledgments

We gratefully acknowledge Fumiya Komatsu and Takahiko Igarashi (Graduate School of Natural Science and Technology, Kanazawa University) for their technical support. Special thanks to Masataka Nishikawa (Tokyo University of Science) for providing valuable dust samples.

Conflicts of Interest

The authors declare no conflict of interest.

References

  1. Hinds, W.C. Aerosol Technology: Properties, Behavior, and Measurement of AIrborne Particles, 2nd ed.; John Wiley & Sons Inc.: Hoboken, NJ, USA, 1999. [Google Scholar]
  2. Virtanen, A.; Joutsensaari, J.; Koop, T.; Kannosto, J.; Yli-Pirilä, P.; Leskinen, J.; Mäkelä, J.M.; Holopainen, J.K.; Pöschl, U.; Kulmala, M.; et al. An amorphous solid state of biogenic secondary organic aerosol particles. Nature 2010, 467, 824–827. [Google Scholar] [CrossRef] [PubMed]
  3. Brambilla, S.; Speckart, S.; Brown, M.J. Adhesion and aerodynamic forces for the resuspension of non-spherical particles in outdoor environments. J. Aerosol Sci. 2017, 112, 52–67. [Google Scholar] [CrossRef]
  4. Fukuyama, T.; Fujiwara, H. Contribution of Asian dust to atmospheric deposition of radioactive cesium (137Cs). Sci. Total Environ. 2008, 405, 389–395. [Google Scholar] [CrossRef]
  5. Sayyah, A.; Horenstein, M.N.; Mazumder, M.K. Energy yield loss caused by dust deposition on photovoltaic panels. Sol. Energy 2014, 107, 576–604. [Google Scholar] [CrossRef]
  6. Chesnutt, J.K.W.; Ashkanani, H.; Guo, B.; Wu, C.Y. Simulation of microscale particle interactions for optimization of an electrodynamic dust shield to clean desert dust from solar panels. Sol. Energy 2017, 155, 1197–1207. [Google Scholar] [CrossRef]
  7. Petean, P.G.C.; Aguiar, M.L. Determining the adhesion force between particles and rough surfaces. Powder Technol. 2015, 274, 67–76. [Google Scholar] [CrossRef]
  8. Shi, Y.; Ma, Z.; Chu, D.; Wang, X.; Sun, F.; Guo, Z. An experimental study of ash particles adhesion force in flue gas. Adv. Powder Technol. 2017, 28, 1435–1442. [Google Scholar] [CrossRef]
  9. Leung, W.T.; Fu, S.C.; Sze To, G.N.; Chao, C.Y.H. Comparison of the resuspension behavior between liquid and solid aerosols. Aerosol Sci. Technol. 2013, 47, 1239–1247. [Google Scholar] [CrossRef]
  10. Nishikawa, M.; Hao, Q.; Morita, M. Preparation and evaluation of certified reference materials for asian mineral dust. Glob. Environ. Res. 2000, 4, 103–113. [Google Scholar]
  11. Mori, I.; Nishikawa, M.; Quan, H.; Morita, M. Estimation of the concentration and chemical composition of kosa aerosols at their origin. Atmos. Environ. 2002, 36, 4569–4575. [Google Scholar] [CrossRef]
  12. Murray, B.J.; O’Sullivan, D.; Atkinson, J.D.; Webb, M.E. Ice nucleation by particles immersed in supercooled cloud droplets. Chem. Soc. Rev. 2012, 41, 6519–6554. [Google Scholar] [CrossRef] [PubMed] [Green Version]
  13. Kojima, T.; Buseck, P.R.; Iwasaka, Y.; Matsuki, A.; Trochkine, D. Sulfate-coated dust particles in the free troposphere over Japan. Atmos. Res. 2006, 82, 698–708. [Google Scholar] [CrossRef]
  14. Trochkine, D.; Iwasaka, Y.; Matsuki, A.; Yamada, M.; Kim, Y.S.; Nagatani, T.; Zhang, D.; Shi, G.Y.; Shen, Z. Mineral aerosol particles collected in Dunhuang, China, and their comparison with chemically modified particles collected over Japan. J. Geophys. Res. Atmos. 2003, 108. [Google Scholar] [CrossRef] [Green Version]
  15. Zhang, D.; Zang, J.; Shi, G.; Iwasaka, Y.; Matsuki, A.; Trochkine, D. Mixture state of individual Asian dust particles at a coastal site of Qingdao, China. Atmos. Environ. 2003, 37, 3895–3901. [Google Scholar] [CrossRef] [Green Version]
  16. Zhang, D.; Iwasaka, Y.; Shi, G.; Zang, J.; Matsuki, A.; Trochkine, D. Mixture state and size of Asian dust particles collected at southwestern Japan in spring 2000. J. Geophys. Res. Atmos. 2003, 108, 1–12. [Google Scholar] [CrossRef] [Green Version]
  17. Matsuki, A.; Iwasaka, Y.; Shi, G.; Zhang, D.; Trochkine, D.; Yamada, M.; Yoon-Suk, K.; Chen, B.; Nagatani, T.; Miyazawa, T.; et al. Morphological and chemical modification of mineral dust: Observational insight into the heterogeneous uptake of acidic gases. Geophys. Res. Lett. 2005, 32, 1–4. [Google Scholar] [CrossRef] [Green Version]
  18. Tobo, Y.; Zhang, D.; Matsuki, A.; Iwasaka, Y. Asian dust particles converted into aqueous droplets under remote marine atmospheric conditions. Proc. Natl. Acad. Sci. USA 2010, 107, 17905–17910. [Google Scholar] [CrossRef] [Green Version]
  19. Cappella, B.; Dietler, G. Force-distance curves by atomic force microscopy. Surf. Sci. Rep. 1999, 34, 1–3. [Google Scholar] [CrossRef] [Green Version]
  20. Chow, E.H.H.; Bučar, D.K.; Jones, W. New opportunities in crystal engineering—The role of atomic force microscopy in studies of molecular crystals. Chem. Commun. 2012, 48, 9210–9226. [Google Scholar] [CrossRef]
  21. De Falco, G.; Commodo, M.; Minutolo, P.; Danna, A. Flame-formed carbon nanoparticles: Morphology, interaction forces, and hamaker constant from AFM. Aerosol Sci. Technol. 2015, 49, 281–289. [Google Scholar] [CrossRef] [Green Version]
  22. Tan, C.L.C.; Gao, S.; Wee, B.S.; Asa-Awuku, A.; Thio, B.J.R. Adhesion of dust particles to common indoor surfaces in an air-conditioned environment. Aerosol Sci. Technol. 2014, 48, 541–551. [Google Scholar] [CrossRef]
  23. Moutinho, H.R.; Jiang, C.S.; To, B.; Perkins, C.; Muller, M.; Al-Jassim, M.M.; Simpson, L. Adhesion mechanisms on solar glass: Effects of relative humidity, surface roughness, and particle shape and size. Sol. Energy Mater. Sol. Cells 2017, 172, 145–153. [Google Scholar] [CrossRef]
  24. Yabuki, S.; Kanayama, S.; Honda, M. Mineral composition of certified reference 18 material: China loess (CJ1) and Simulated Asian Mineral Dust (CJ2). Chikyu Kankyo 2002, 7, 171–179. [Google Scholar]
  25. Louis, S.; Matter, I. Product specification. Build. Res. Inf. 1993, 21, 21–22. [Google Scholar]
  26. Hutter, J.L.; Bechhoefer, J. Measurement and manipulation of van der Waals forces in atomic-force microscopy. J. Vac. Sci. Technol. B Microelectron. Nanom. Struct. Process. Meas. Phenom. 1994, 12, 2251–2253. [Google Scholar] [CrossRef]
  27. Iwata, A.; Matsuki, A. Characterization of individual ice residual particles by the single droplet freezing method: A case study in the Asian dust outflow region. Atmos. Chem. Phys. 2018, 18, 1785–1804. [Google Scholar] [CrossRef] [Green Version]
  28. Laskina, O.; Young, M.A.; Kleiber, P.D.; Grassian, V.H. Infrared extinction spectroscopy and micro-Raman spectroscopy of select components of mineral dust mixed with organic compounds. J. Geophys. Res. Atmos. 2013, 118, 6593–6606. [Google Scholar] [CrossRef]
  29. Freeman, J.J.; Wang, A.; Kuebler, K.E.; Jolliff, B.L.; Haskin, L.A. Characterization of natural feldspars by raman spectroscopy for future planetary exploration. Can. Mineral. 2008, 46, 1477–1500. [Google Scholar] [CrossRef]
  30. Tang, I.N.; Fung, K.H. Characterization of inorganic salt particles by Raman spectroscopy. J. Aerosol Sci. 1989, 20, 609–617. [Google Scholar] [CrossRef]
  31. Daly, F.P.; Brown, C.W.; Kester, D.R. Sodium and magnesium sulfate ion pairing: Evidence from raman spectroscopy. J. Phys. Chem. 1972, 76, 3664–3668. [Google Scholar] [CrossRef]
  32. Hiranuma, N.; Brooks, S.D.; Gramann, J.; Auvermann, B.W. High concentrations of coarse particles emitted from a cattle feeding operation. Atmos. Chem. Phys. 2011, 11, 8809–8823. [Google Scholar] [CrossRef] [Green Version]
  33. Baustian, K.J.; Cziczo, D.J.; Wise, M.E.; Pratt, K.A.; Kulkarni, G.; Hallar, A.G.; Tolbert, M.A. Importance of aerosol composition, mixing state, and morphology for heterogeneous ice nucleation: A combined field and laboratory approach. J. Geophys. Res. Atmos. 2012, 117, 1–13. [Google Scholar] [CrossRef] [Green Version]
  34. Iwata, A.; Imura, M.; Hama, M.; Maki, T.; Tsuchiya, N.; Kunihisa, R.; Matsuki, A. Release of highly active ice nucleating biological particles associated with rain. Atmosphere 2019, 10, 605. [Google Scholar] [CrossRef] [Green Version]
  35. Miura, K.; Kumakura, T.; Sekikawa, T. The Effect of Continental Air Mass on the Modification of Individual Sea-Salt Particles Collected over the Coast and the Open Sea. J. Meteorol. Soc. Japan 1991, 69, 429–438. [Google Scholar] [CrossRef] [Green Version]
  36. Laskin, A.; Iedema, M.J.; Ichkovich, A.; Graber, E.R.; Taraniuk, I.; Rudich, Y. Direct observation of completely processed calcium carbonate dust particles. Faraday Discuss. 2005, 130, 453–468. [Google Scholar] [CrossRef]
  37. Matsuki, A.; Schwarzenboeck, A.; Venzac, H.; Laj, P.; Crumeyrolle, S.; Gomes, L. Cloud processing of mineral dust: Direct comparison of cloud residual and clear sky particles during AMMA aircraft campaign in summer 2006. Atmos. Chem. Phys. 2010, 10, 1057–1069. [Google Scholar] [CrossRef] [Green Version]
  38. Miura, K. Production, and Chemical and Physical Properties of Sea Salt Particles. Bull. Soc. Sea Water Sci. Japan 2007, 61, 102–109. [Google Scholar]
Figure 1. Difference in the initial position between the normal atomic force microscopy (AFM) contact mode operation (I) and force–distance curve mapping (II). The range marked as III shows the amplitude of the moving tip.
Atmosphere 11 00489 g001
Figure 2. Atomic force microscopy (AFM) mag image (a), slope mapping (b), and adhesion force mapping (c) obtained from the same 1 μm PSL particle. Representative force–distance curves are shown for the point at which the tip is properly in contact with the surface with sufficient stroke (loading force), at the proper angle (d) and for the point further towards the edge where the tip is barely touching the surface at a steep angle (e). The black lines in panels (d) and (e) show the baseline in which the tip did not touch the particle or substrate. A plot of the relationship between the slope and the adhesion force is shown in panel (f). The plots in the shaded area are considered to represent the adhesion force of the particle. Corresponding AFM height and phase images can be found in Figure S2 in the Supplementary Information.
Atmosphere 11 00489 g002
Figure 3. Atomic force microscopy (AFM) mag images, adhesion force mapping images, slope–adhesion force plots, and micro-Raman spectrums of model dust particles: (a) quartz, (b) CJ-1, and (c) ATD. Corresponding AFM height and phase images can be found in Figure S3 in the Supplementary Information.
Atmosphere 11 00489 g003
Figure 4. Atomic force microscopy (AFM) mag images, adhesion force mapping images, and slope–adhesion force plots of inorganic particles: (a) ammonium sulfate (AS) and (b) artificial sea salt (ASS). Corresponding AFM height and phase images can be found in Figure S4 in the Supplementary Information.
Atmosphere 11 00489 g004
Figure 5. Atomic force microscopy (AFM) images, adhesion force mapping images, slope–adhesion force plots, micro-Raman, and EDX spectra results of ambient aerosol particles identified as (a) sea salt, (b) silicate dust, and (c) Ca-rich dust. Corresponding AFM height and phase images can be found in Figure S5 in the Supplementary Information.
Atmosphere 11 00489 g005
Figure 6. Comparison of adhesion force of aerosol particles measured in this study. A range of adhesion force values for flame-formed carbon soot particles [21] are also shown for comparison. Hollow shapes indicate the adhesion force values of individual particles, whereas solid shapes and whiskers indicate the mean and standard deviation, respectively.
Atmosphere 11 00489 g006
Figure 7. Example of a sea salt (SS) particle showing both crystalline and non-crystalline sections. (a) Composite of atomic force microscopy (AFM) mag image and adhesion force mapping. Only points with modest slope values (0–15 degrees) are shown. The white dotted line separates crystalline and non-crystalline morphological features; (b) slope–adhesion plot of the particle; (c) boxplot comparing the adhesion forces obtained from the crystalline and non-crystalline sections. The original slope and adhesion force mapping images can be found in Figure S6, along with the corresponding AFM height and phase images in the Supplementary Information.
Atmosphere 11 00489 g007
Table 1. Peak assignments for Raman shift obtained in this study.
Raman Peak Assignments
SpeciesRaman Shift (cm−1)
Quartz465 [28]
Feldspar485 [29]
(NH4)2SO4975 [30]
Na2SO4(aq)982 [31]
CaSO41005 [32]
Ca(NO3)24H2O1050 [30]
Mg(NO3)26H2O1059 [30]
NaNO31069 [30]
Na2CO31080 [28]
CaCO31089 [28]
Bonded OH stretch3200–3650 [33]
Fluorescence−4000

