Article

Investigation of the Successive Ozone Episodes in the El Paso–Juarez Region in the Summer of 2017

1
Environmental Science and Engineering, The University of Texas at El Paso, El Paso, TX 79968, USA
2
Computational Science, The University of Texas at El Paso, El Paso, TX 79968, USA
3
Atmospheric Science Department, Howard University, Beltsville, Washington, DC 20705, USA
4
Physics Department, The University of Texas at El Paso, El Paso, TX 79968, USA
*
Author to whom correspondence should be addressed.
Atmosphere 2020, 11(5), 532; https://doi.org/10.3390/atmos11050532
Submission received: 14 March 2020 / Revised: 8 May 2020 / Accepted: 18 May 2020 / Published: 21 May 2020
(This article belongs to the Special Issue Atmospheric Aerosols in North America)

Abstract

:
The adjacent cities of El Paso in Texas, USA, and Juarez in Mexico commonly experience pollution episodes, especially during the summer months. In the summer of 2017, successive high and low ozone episodes were observed. Aerosol backscattered data from a laser ceilometer was used to monitor and continuously measure the aerosol-layer characteristics. Meteorological parameters together with the aerosol layer height were used to determine the reason behind these successive high and low ozone events. In our research, both modelling and experimental data of the planetary boundary layer height (PBLH) were obtained and related to atmospheric stability. Aerosol backscatter data was used to investigate the structure, evolution, and influence of the top of the aerosol layer, which is a proxy for PBLHs. A shallow aerosol layer height (1164 ± 59 m) was observed during the high ozone episodes, in contrast to a deep aerosol layer (1990 ± 79 m) during the low ozone episodes. The ozone precursors, the ozone, and the ground-level aerosol concentrations were also examined during these episodes. It was observed that when the ozone was high, the PM2.5 was high, and when the ozone was low, the PM10 concentrations were high. Analysis of the wind patterns and synoptic scale meteorology also contributed to a better explanation of the nature of these events.

1. Introduction

Human health is adversely affected by ozone and particulate matter (PM10, particulate matter with an aerodynamic diameter of 10 μg or less, and PM2.5, particulate matter with an aerodynamic diameter of 2.5 μg or less) [1]. High ozone and particulate matter concentrations affect many major metropolitan cities in the United States, and the El Paso–Juarez airshed is one example. El Paso is a city in the far west corner of Texas, separated only by the Rio Grande River from the Mexican city of Juarez, which is one of the most populous cities in the Mexican state of Chihuahua and is surrounded by the Chihuahua desert. Both cities share the same airshed, the El Paso–Juarez airshed, and in the past, both have violated their air quality standards for ground-level ozone. The El Paso climate is very dry and is characteristic of the urban southwestern US climate. Its air quality problem is known to be partially due to contributions from industrial activities in the region, and to high emissions from automobiles due to prolonged traffic congestion across the international bridges between the two countries [2,3,4]. In addition, the geopolitical region of El Paso–Juarez exhibits exceptional meteorological conditions [5], such as higher planetary boundary layer heights (PBLHs), than any other Texas city, influenced by the local terrain.
In this work we performed a comprehensive study, using both models and instruments, of the most important factors contributing to the ozone episodes in the El Paso–Juarez region.
In the El Paso–Juarez airshed, higher ozone concentrations occur during the summer, and higher PM10 concentrations occur during the periods of thermal inversions and dust storm events.
The tropospheric formation of ozone and aerosols share much of the same physics and chemistry. Ozone is formed through photochemical reactions of the nitrogen oxides (NOx = NO + NO2) and volatile organic compounds (VOCs) [6]. These reactions produce atmospheric acids, such as nitric acid, sulfuric acid, and organic acids, and these acids are essential aerosol precursors [7]. Ozone may react with organic compounds, such as isoprene and other alkenes, to produce organic compounds with a low volatility that condense to produce a secondary organic aerosol (SOA) [8]. There are chemical reaction mechanisms involving ozone that convert nitrogenous compounds to nitric acid and produce SOA precursors during both the day and nighttime [8,9]. In turn, there are aerosol particles that affect the gas-phase chemistry of ozone formation. For example, aerosol particles scatter solar radiation, affecting the frequencies of the photolysis reactions [10]. Aerosol particles are sinks of gas-phase species [11].
The formation of particulate matter, ozone, and their precursors are affected by their concentrations. Concentrations of air pollutants in the planetary boundary layer (PBL) are affected by the atmospheric mixing height, which is a function of the planetary boundary layer height (PBLH). The PBL is the lowest part of the troposphere, which is directly influenced by the earth’s surface. It is the only part of the atmosphere where frictional forces play an essential role and where the temperature exhibits a diurnal cycle [12]. The mixing layer height is an essential parameter in modeling air pollution and its transport since it determines the adequate volume in which pollutants are dispersed [13]. If the surface emissions are consistent, then ozone concentrations will respond to the changes in the PBLH, depending on the volume available for dispersion. Ozone from the previous day can remain in the residual layer, and it can entrain when the convective boundary layer starts rising the following day, depending on the concentration within the PBL. The relationship between the PBLH and ozone is complicated and has not been studied in this region before. Since ozone episodes are frequent during the summer, continuous monitoring of the PBLH, especially in a region like El Paso–Juarez, can provide relevant information for a comprehensive regional air-quality assessment.
Previous studies were conducted in this airshed during the summer of 1996 [5,14,15,16] in order to quantify the air quality and meteorological parameters contributing to ozone episodes. However, almost no PBL studies have been performed in this region [4,5,14,17,18,19,20]. Some of the balloon studies observed PBLHs as high as 4 km during the late afternoon, when the average temperature in the region is at its peak. These PBLH observations are unusually high compared to most of the commonly studied regions and need a thorough investigation.
Therefore, the goal of our research was to perform a comprehensive ozone study for this unique region, using both models (e.g., WRF, HYSPLIT) and instruments (e.g., ceilometer, pollutant sensors, available radiosondes), and to analyze how the meteorology (e.g., the winds, temperature, the PBL, the mesoscale and synoptic meteorology), the atmospheric stability, and the ozone precursors impact the ozone concentrations in the El Paso–Juarez airshed during high and low ozone episodes. Given that the El Paso–Juarez airshed experiences high ozone precursor emissions, resulting in high ozone episodes, with unique topographical and meteorological conditions, it is critical to perform a thorough investigation of the significant factors contributing towards the ozone concentrations in this region. In addition, the particulate matter behavior was analyzed during high and low ozone events.
In Section 2, we describe the methodology, using both models and relevant instruments. In Section 3, we show our results. Section 4 is a discussion, and in Section 5 we provide our conclusions.

2. Methodology

2.1. Site Description

The city of El Paso (ELP), Texas (latitude: 31°47′20″ N; longitude: 106°25′20″ W; elevation: 1145 m a.s.l.), and the city of Ciudad Juarez (CDJ), Mexico, constitute one of the largest binational areas in the USA.
El Paso is adjacent to Ciudad Juarez, the two cities being separated only by the Rio Grande. CDJ is a major Mexican Industrial city. Based on the 2015 census conducted by the US Census Bureau, ELP has about 835,593 inhabitants. CDJ has approximately 2 million people as inhabitants, and it is the most populous city in the Mexican state of Chihuahua.
El Paso is the 5th largest city in Texas, and it ranks as the 23rd largest in the US, with the total area of the city being about 648 km2. The city of ELP is in the Chihuahua desert and has an average of 300 sunny days per year. The climate in this region is hot and dry in summer with mild and dry winters. The local dry environment and the proximity of loose desert soil is the reason that ELP experiences dust storms, which peak during March and April. For this study, ozone and other meteorological measurements made from 1 May 2017 to 31 October 2017, at different Texas Commission on Environmental Quality (TCEQ) sites in the city of ELP and its surroundings, were analyzed. The main locations involved in the measurements included the University of Texas at El Paso (UTEP) campus and the TCEQ Continuous Ambient Monitoring Stations (CAMS) in the ELP county. The CAMS data are provided on an hourly basis. The UTEP campus is approximately 2 km from downtown ELP and is about 1150 m above the sea level. To the northeast of UTEP, roughly 2.5 km distant, are the Franklin mountains, and 6.5 km southwest are the Juarez mountains (Figure 1). Most of the ELP and CDJ downtown and some of the nearby surrounding regions are situated in a valley.
For decades, CAMS has been set up in different parts of the city of ELP (Figure 1). These sites perform continuous monitoring of the ambient air, and they report and issue warnings during any pollution anomalies. One such station is CAMS 12, located in the UTEP campus (EPA site number 48-141-0037; 31.768291° N, 106.501260° W), operated and maintained by the TCEQ ELP regional office. It was commissioned on 10 June 1996 and had been collecting air-quality and meteorological data ever since. Continuous and fully functional monitors on this site include meteorological data, ozone, NOx, carbon monoxide, PM2.5, and PM10 (www.tceq.texas.gov/airquality/monops/data-reports). The data of interest for this work came from 4–7 and 11–13 June 2017. For most of this period, continuous data were obtained at the site with minor absences due to equipment maintenance. Similarly, CAMS 41, located at Chamizal National Memorial in ELP, 1 km northwest from the International Bridge of the Americas (one of the primary connections between ELP and CDJ), was instrumental in providing the VOCs data. CAMS 41 is at a distance approximately 4 km away from CAMS 12 (UTEP), where the majority of the data was collected. Several VOCs are measured at the site using automated gas chromatographs (AutoGCs). Ascarate Park CAMS 37 is also located along the border and is approximately 10 km southeast of UTEP. CAMS49, located at Socorro Hueco, is the TCEQ site farthest from the ELP downtown and UTEP sites, at a distance of approximately 22 km. In addition to the instruments that are available in CAMS 12, CAMS 49 has a Vaisala ceilometer CL31 and a radar wind profiler. Data from all these CAMS were also studied to ensure that the ozone episodes were regional and not confined only to the downtown part of the city. The CAMS located in CDJ had been decommissioned and hence there was no data available from the other side of the border for the year of study.

2.2. Ceilometer CL-31

The Vaisala ceilometer CL31 is an eye-safe, single-lens mini-lidar system, used to detect cloud base heights and vertical visibility by continuously monitoring the aerosol backscatter profiles at a wavelength of 910 nm. These profiles can also be used for determining the convective mixing layer height (MLH) [21]. The laser is an InGaAs MOCVD diode with a pulse frequency of 10 kHz, and the measurement range is from 0 to 7.7 km. The typical uncertainty of the attenuation of the backscatter coefficient for ~30 min average duration is ±20% and the changeover aerosol backscattering MLH determination for ~30 min is ±200 m [22]. The ceilometer CL31 located at the UTEP campus was used to estimate the aerosol MLH, which can be used as a proxy of PBLH [17,23]. It performs well, even in situations such as dust storms and shallow nocturnal layers. The instrument has been operational and collecting data since 2015. Details of the instrument and its functionality can be found in Mu Münkel, C. et al. [21].

2.3. Modeling Planetary Boundary Layer Heights

2.3.1. Weather Research and Forecasting (WRF)

Weather Research and Forecasting (WRF) is a next-generation mesoscale numerical weather prediction model system widely used for both atmospheric research and operational forecasting applications. The model serves a wide range of meteorological applications across scales from tens of meters to thousands of kilometers (www.mmm.ucar.edu). The Yonsei University Scheme (YSU), a vertical diffusion package with an explicit treatment of the entrainment process was used. It is a nonlocal WRF PBL scheme developed by Hong, S.Y. et al. [24] and later updated in WRF version 3 by increasing the critical bulk Richardson number from 0 to 0.25 over land and in the process increasing the boundary layer measurement accuracy [25].
For this study, we used WRF version 3.9.1 released by the National Center of Atmospheric Research (NCAR). The WRF model was configured for this simulation with three domains, each with a 172 × 172 mesh. The outer domain (d01), the middle (d02), and the inner domain (d03) have horizontal spatial resolutions of 36 km, 12 km, and 4 km, respectively, as seen in Figure 2. The 36-km domain covers the southwestern part of the US, while the 2nd domain covers mostly the southwest of Texas, some parts of CDJ, and some counties in New Mexico State. The 4-km domain focused on the Paso del Norte region, which is the area of interest for this work. The Lambert map projection was used for this study. The reference latitude and longitude of this simulation were 31.7569° N and 106.48854° W, respectively. All model domains have 50 vertical layers, and the model top is set at 50 hPa, while the lowest model for sigma levels are 1.0, 0.996, 0.99 to 0.91, 0.895, 0.865, and 0.80. For the initial and boundary conditions, we used the Global Forecast System (GFS) analysis data, which has a 0.5-degree spatial resolution. For the cumulus parameterization option, we use the Kain–Fritsch scheme for domain 01 and domain 02; although, there was no scheme used for the coarse domain [26,27]. Furthermore, for a daily run, we had 96 h of simulation, which consist of 72 h of spin-up and 24 h daily simulation. The setup of the WRF meteorological model is shown in Table 1.

2.3.2. Hybrid Single Particle Lagrangian Integrated Trajectory Model (HYSPLIT)

Together with WRF, PBLH was computed using the HYSPLIT model, version 4 [32]. The National Centers for Environmental Prediction’s (NCEP) archived meteorological files, EDAS (Eta Data Assimilation System), with a 40 km spatial and 3 h temporal resolution in addition to the WRF–HYSPLIT option, were used as the meteorological data inputs for the model [33]. UTEP was chosen as the source location, and the hourly PBLH values were obtained together with the trajectory. HYSPLIT model is a widely used trajectory model concerning the pollutant transport and dispersion that takes place within a well-mixed PBLH. The PBLH is calculated within the model from the potential temperature data by finding the height where the inversion take place. It assumes the recorded inversion height as the PBLH when the potential temperature at that height exceeds the found value by 2 Kelvin.

3. Results

3.1. Classification of the Regional Ozone Episodes

In the year 2017, a total of twelve high ozone episodes were reported in the region by TCEQ CAMS, including ten high ozone days indicated by the CAMS 12 station. Four of those ten high ozone days were successive in June, starting from the 4th to the 7th. The remaining six high ozone episodes occurred on 27 June, 10 and 28 July, 17 and 24 August, and the last one on 12 September. The high ozone episodes recorded by the TCEQ CAMS were the days with an 8 h ozone (O3) average concentration above 70 ppbv as per the Air Quality Index (AQI) set by the National Ambient Air Quality Standards (NAQQS). Correspondingly, in this study, we defined an event as a low ozone episode when the 8 h average of the ozone concentration was lower than 50 ppbv. The total number of annual high ozone episodes recorded by CAMS 12 and their monthly distribution by dates are given in Table 2. Historical data indicates June to August being the summer months with most of the high ozone episodes that are commonly recorded in this region (Table 2). This was expected, since all the favorable conditions for high production of ozone were available during these months, such as high temperatures (month of June and July, which are the peak summer months with an average temperature of approximately 40 °C or above) with calms winds (averaged approximately 4–5 m/s) and high solar radiation (averaged approximately 1.5 Langleys/min). However, the temperature decreases considerably from September (the beginning of the fall), and more low ozone events are observed in Table 3.
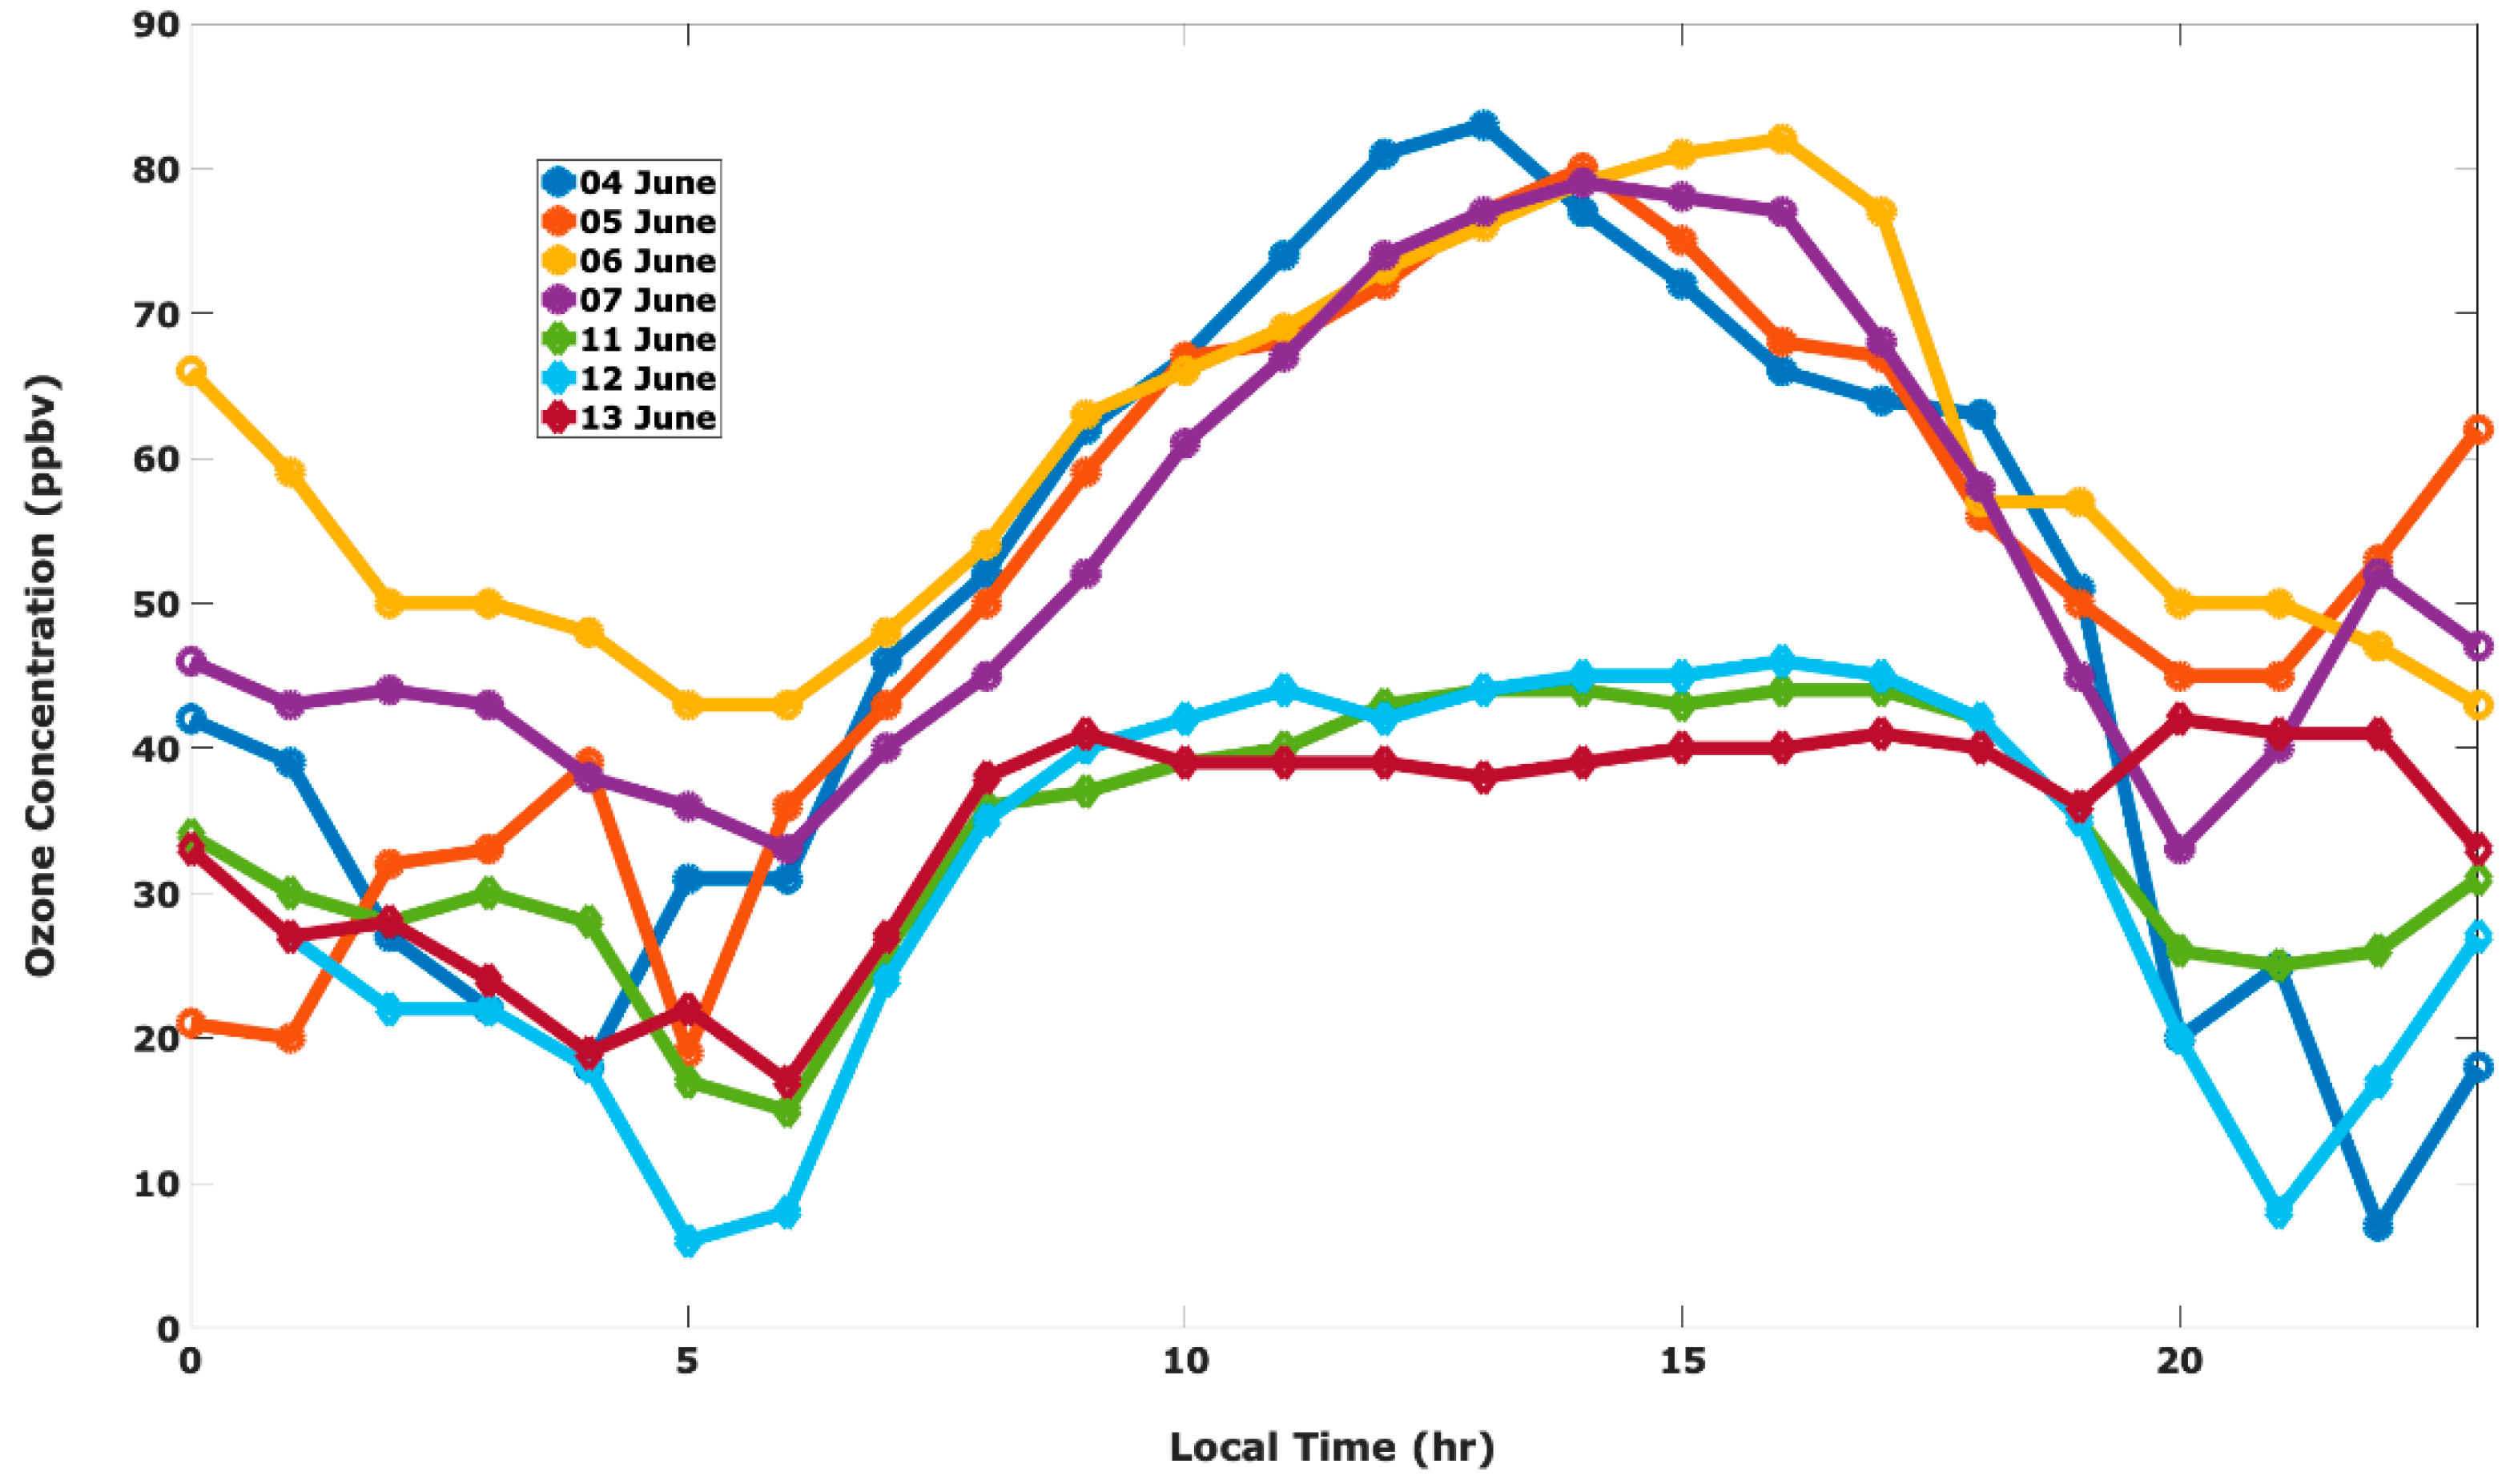
The focus of this study revolves around the four successive high ozone days that occurred in June 2017. Along with the ozone episodes, the correlational behavior of particulate matter (both PM2.5 and PM10) was also observed. Only one such incident of back-to-back high ozone episodes had been recorded previously during the ozone campaign of 2006 (Table 2). The uniqueness of this study is the fact that a week following the high ozone events, three successive low ozone events were also recorded (Figure 3). This event of successive high ozone episodes followed by low ozone episodes provided us with an excellent opportunity to analyze and study the meteorology, especially the influence the MLH and synoptics had on both high and low ozone events. Table 3 gives a distribution of the high and low ozone episodes for the year 2017 as recorded by CAMS 12. We also observed a trend of an increasing number of low ozone events from June–October 2017 at CAMS 12.
Diurnal variation in the ozone concentrations was observed both during the high and low ozone episodes. In the case of high ozone episodes, between 8 a.m. and 6 p.m., more elevated ozone concentrations were detected, as observed in Figure 3. During the successive low ozone days, after 8 a.m., the ozone concentration seemed to reach a plateau till late afternoon. The steep increase in the ozone level during both the events after 6 a.m. can most probably be attributed to the early morning rush hour when there are more vehicle emissions. The ozone concentrations during both the ozone events decreased in the evening after sunset, whereas the NOx emissions increased (Figure 7a) due to the evening rush-hour traffic. As seen in Figure 3, the diurnal variation in ozone concentration prevailed during both the high and low ozone episodes. Ozone levels were generally low in the early morning (before sunrise) and late evening, and maximum during the afternoon. The nocturnal ozone concentration significantly increased in the late evening of 5 June and continued to be on the higher side during the early morning of 6 June. This increase in the ozone concentration during this period can be credited to higher levels of VOCs, superficial levels of NOx, and higher temperatures. In particular, during the high ozone events, the nocturnal ozone levels, which are the residual of the daytime ozone, persisted due to insufficient NOx with which to react, as observed in Figure 3 and Figure 6a. The daily highest ozone level during the high ozone episodes was recorded on 4 June, followed by 6 June. Whereas, the lowest ozone concentration was registered on the morning of 12 June, just before the sunrise. The weekend ozone effect (WOE) is a phenomenon when higher ozone concentrations are observed on weekends even though anthropogenic VOCs and NOx emissions are usually lower on weekends. In the past [2,34], research has established that ELP–CDJ does experience WOE. The authors Pearson, R. et al. in [2] highlight some of the critical factors for the ozone formation in this region. One crucial factor in this case is the increased cross border operation of private and commercial vehicles, especially after the North American Free Trade Agreement (NAFTA). Except for 4 June, which was a Sunday, the remaining three high ozone days were observed on a weekday. The following Sunday, which was 11 June, and the next two days were low ozone days. This specific observation of low ozone days hinted towards the involvement of synoptic-scale meteorology, which is discussed in the subsequent section.

3.2. Heat Deficit Calculation during the High Ozone Event Relative to the Low Ozone Event

Heat deficit, Hh (J m−2), is a measure of the atmospheric stability of a column of air with a 1 m2 cross-section that extends from the Earth’s surface (altitude in meters above sea level, S) to height, h (m), and it is defined by Equation (1) [35].
H h = c p s h ρ ( z ) [ θ h θ ( z ) ] d z
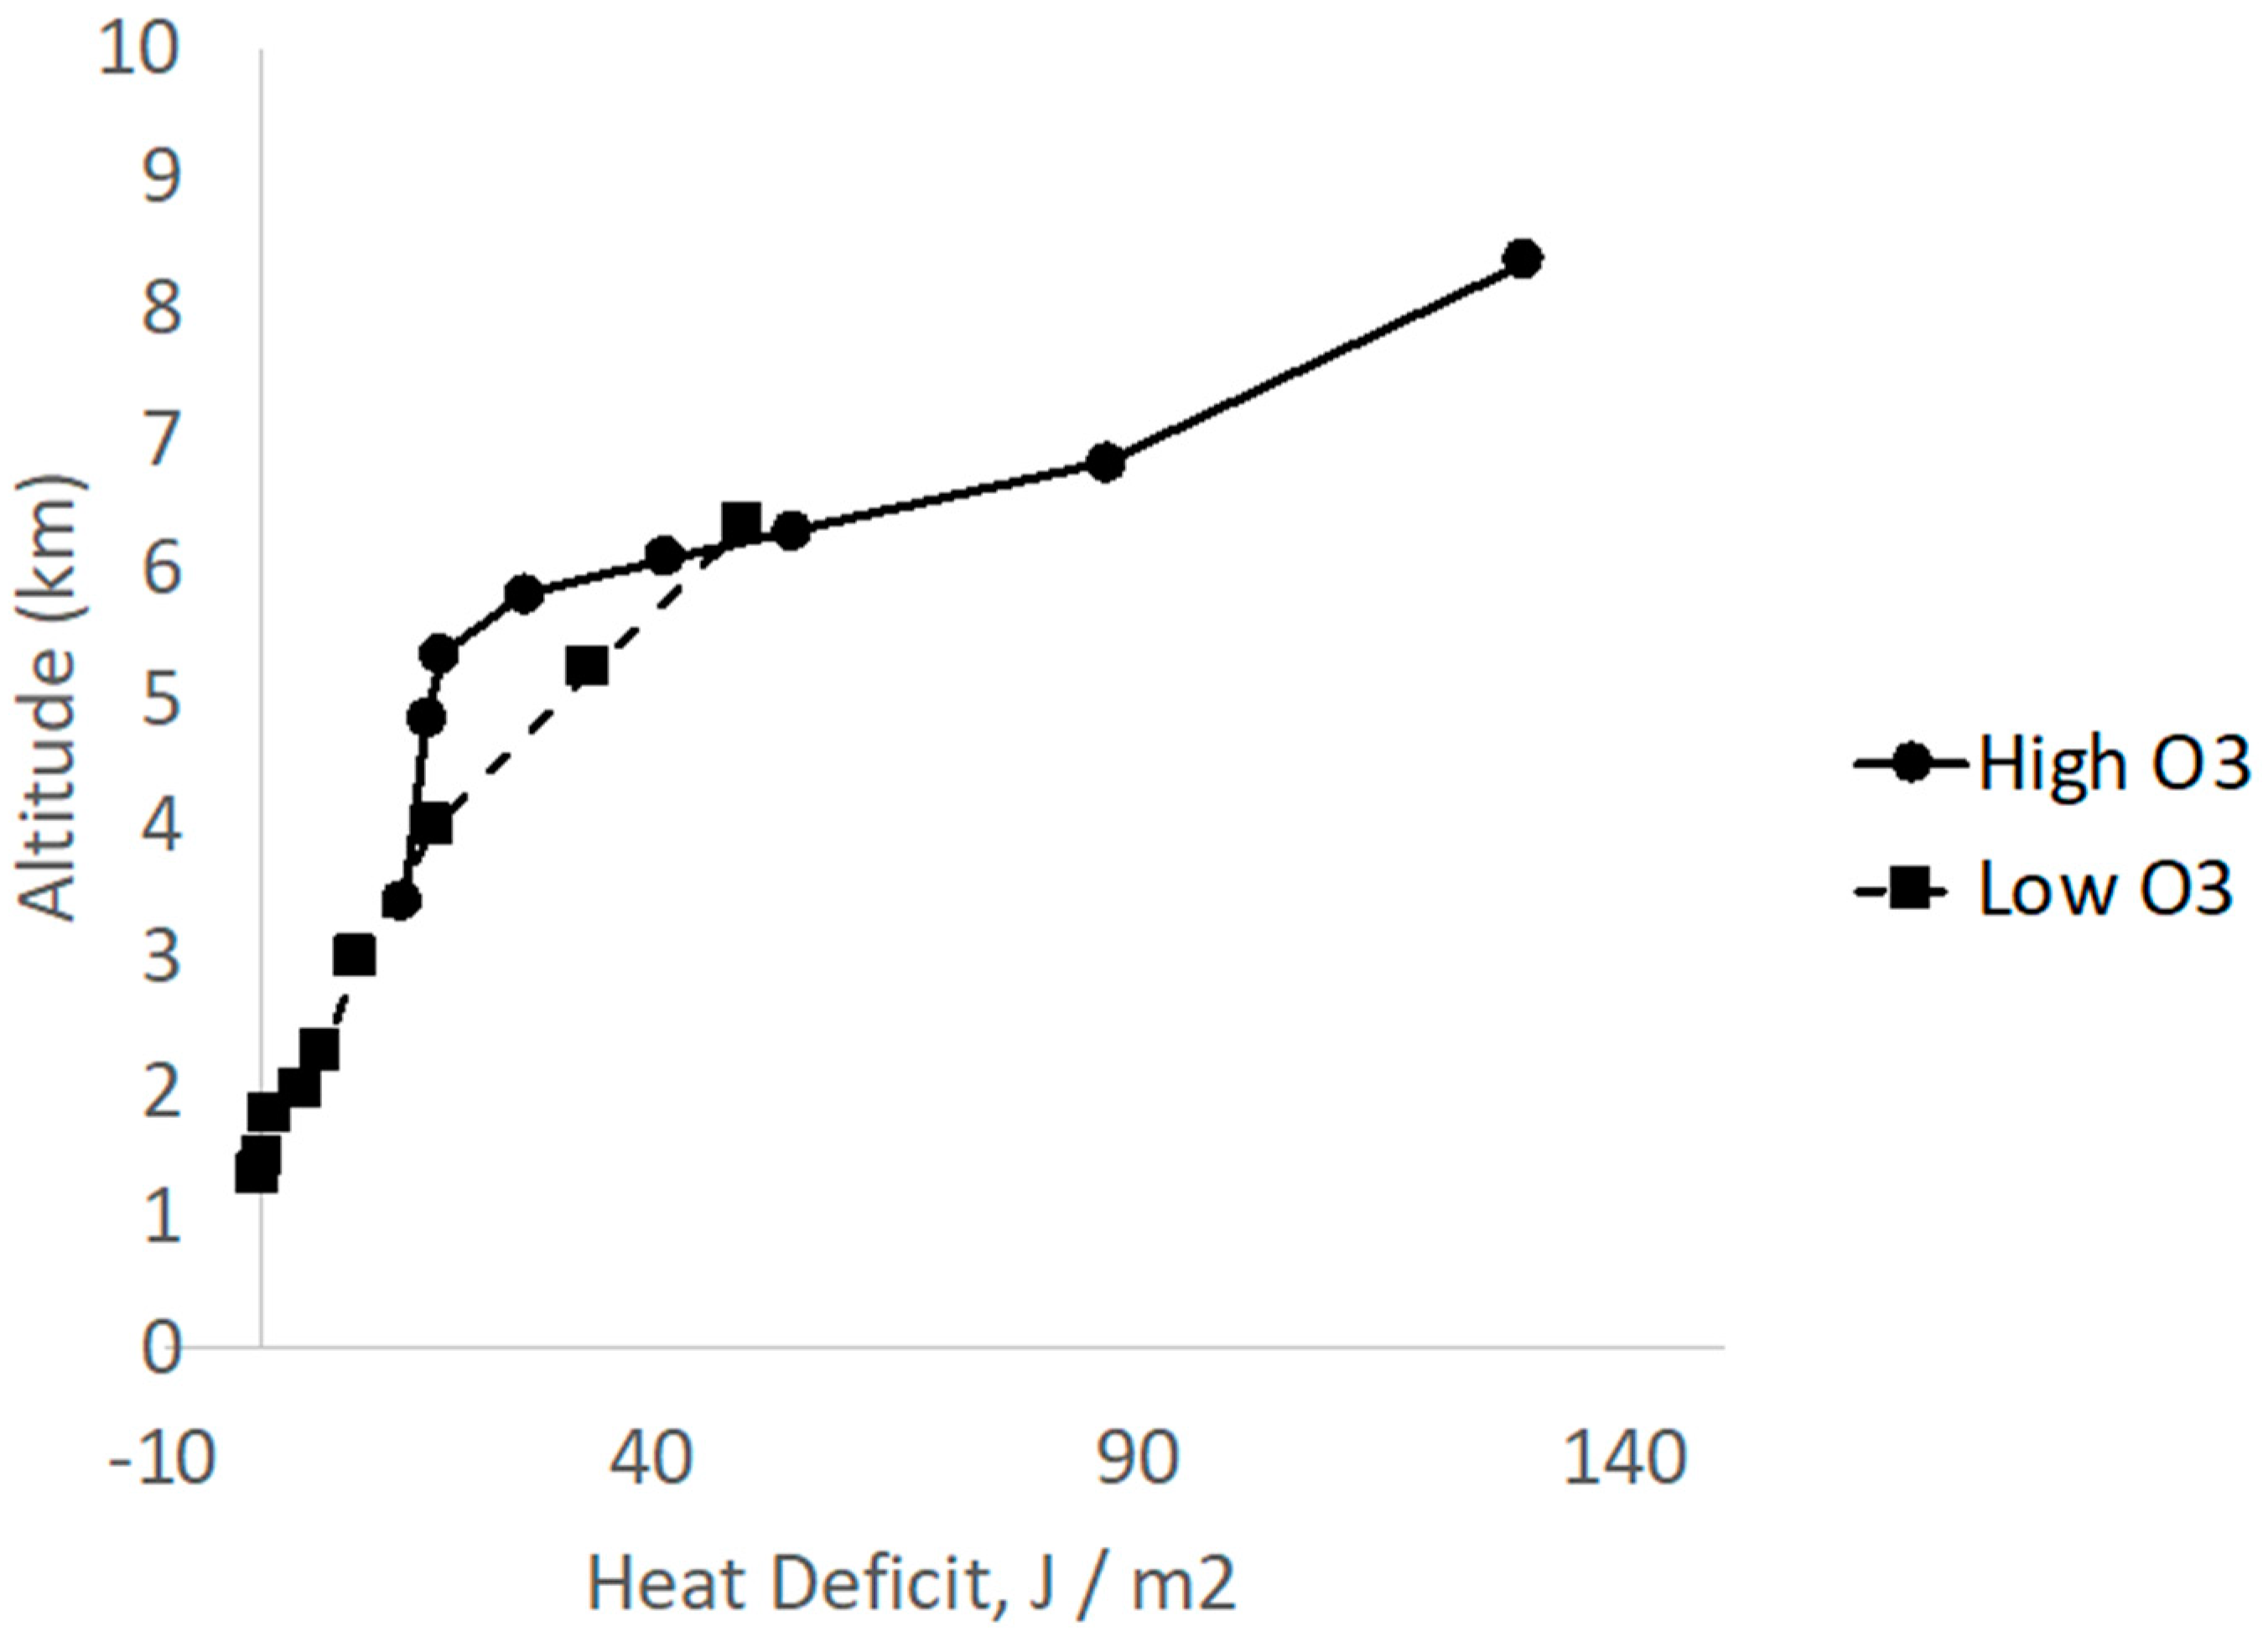
Equation (1) shows that the heat deficit is the heat Hh (in J m−2) required to warm the air column to the dry adiabatic lapse rate. Furthermore, in Equation (1), cp is the specific heat capacity of air at constant pressure, 1005 J kg−1 K−1; z is altitude; ρ(z) is the air density as a function of altitude; θh is the potential temperature at altitude h; and θ(z) is the potential temperature as a function of altitude. The air density and potential temperature data were taken from soundings from the El Paso ozone campaign of 2017, wherein ozonesondes and radiosondes were launched to monitor and analyze the air quality in the region. Vertical profiles were available for 5 June, which was a day with a high ozone episode; however, since there was no launch of a weather balloon during the low ozone events, the nearest possible day (9 June) data was considered for the analysis. It was confirmed that 9 June was a low ozone day to use for the analysis using the National Ambient Air Quality Standards (NAAQS). Figure 4 shows the heat deficit on a high ozone day (5 June) and a relatively low ozone day (9 June) for ELP. The figure suggests that for the high ozone day there is a more well-defined mixing layer that extends from the surface until 6 km. Above 6 km the atmospheric column becomes very stable according to the heat deficit. Overall, the heat deficit values for the atmospheric column are lower for the low ozone day than for the high ozone day. This suggests that on the low ozone day the lower atmosphere is less stable. This is in good agreement with the observations made by Whiteman, C.D. et al. in [35], which indicate that pollution episodes are triggered by an elevated heat deficit, which is a vertically integrated measure of the stability in the atmosphere.

3.3. Behavior of PM, NOx, VOCs, and Relative Humidity during the Ozone Events

Throughout the study, a decreasing daily peak ozone concentration was observed from CAMS 12 (downtown) towards CAMS 49. This observation is quite significant since it shows a slightly higher ozone concentrations in the downtown ELP region as compared to the other parts of the city. In their report, [36] observed that the local terrain seemed to be favoring the ozone accumulation in the downtown region relative to other locations because of the lower altitude compared to the surrounding areas, resulting in a slightly higher ozone level in the downtown region. The ELP–CDJ region forms a valley that is roughly a hundred meters deep below the surrounding plateau, while the mountains (north of ELP and west of CDJ) protrude into the upper flow some 700 m above the plateau (Figure 1). The authors concluded in their report that the complex ridges and valleys in this region possibly served to trap air masses with either ozone or its precursors, thereby limiting the dispersal of the pollutants, contributing to high pollution days [36].
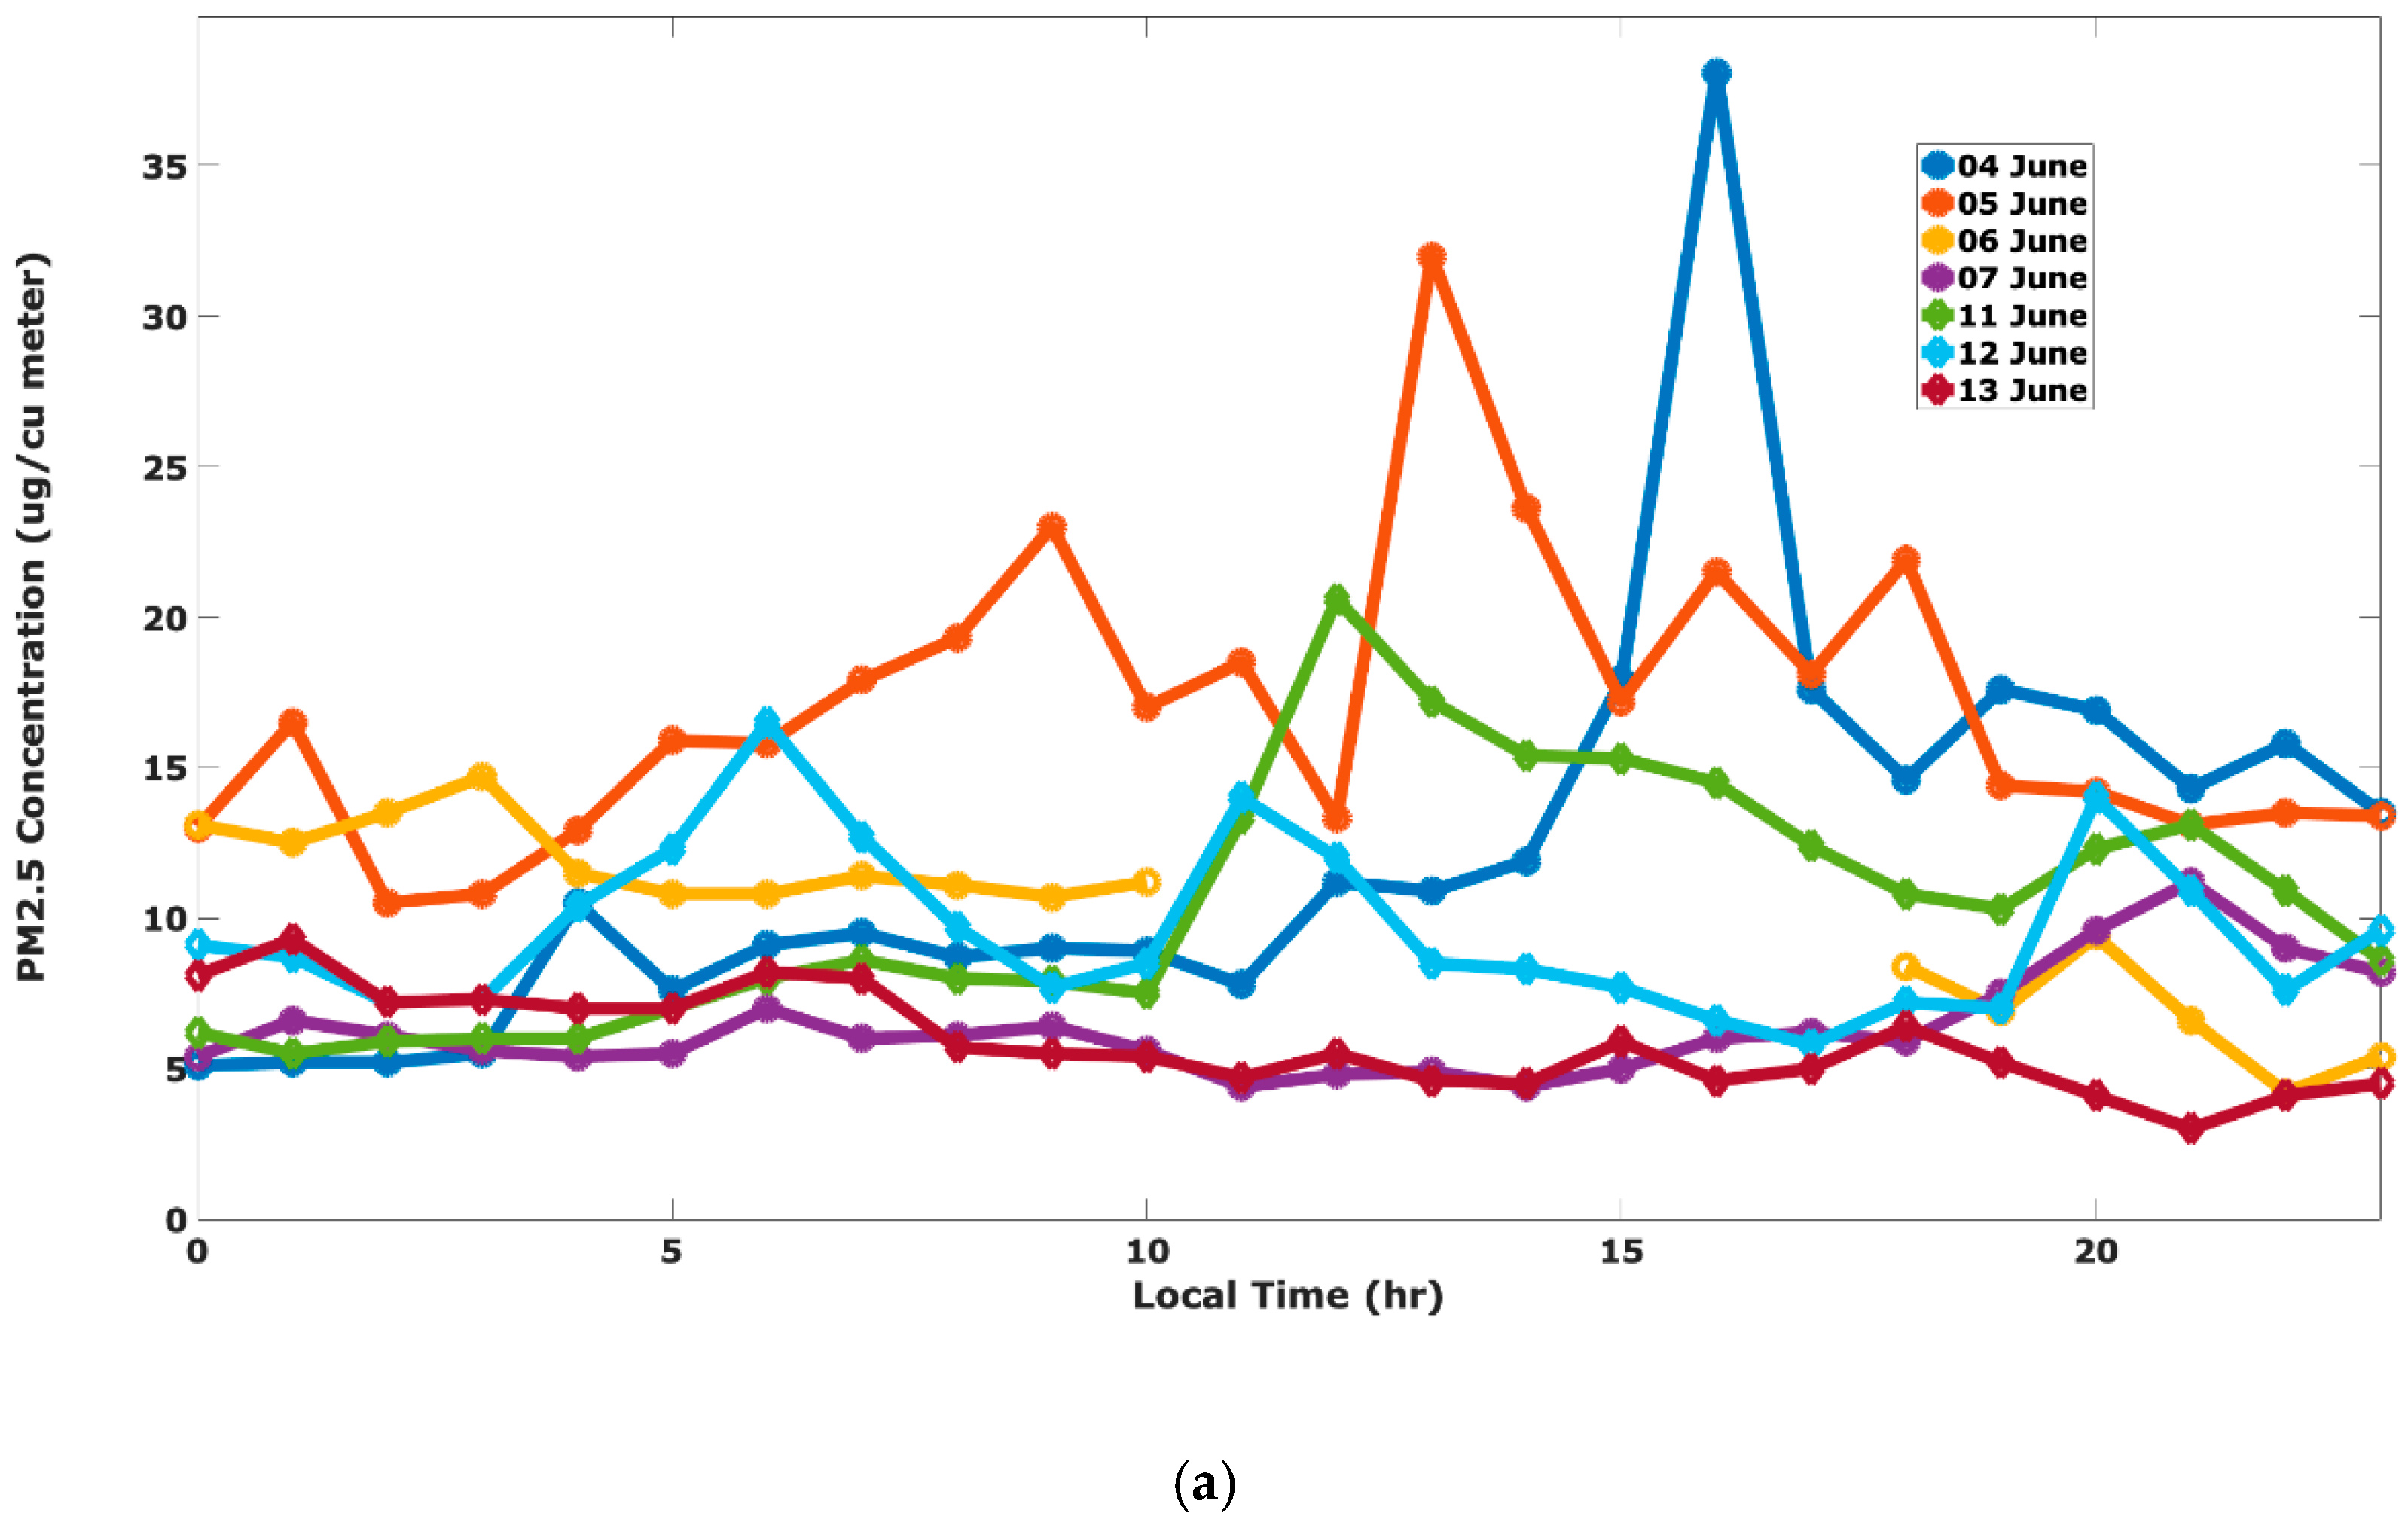
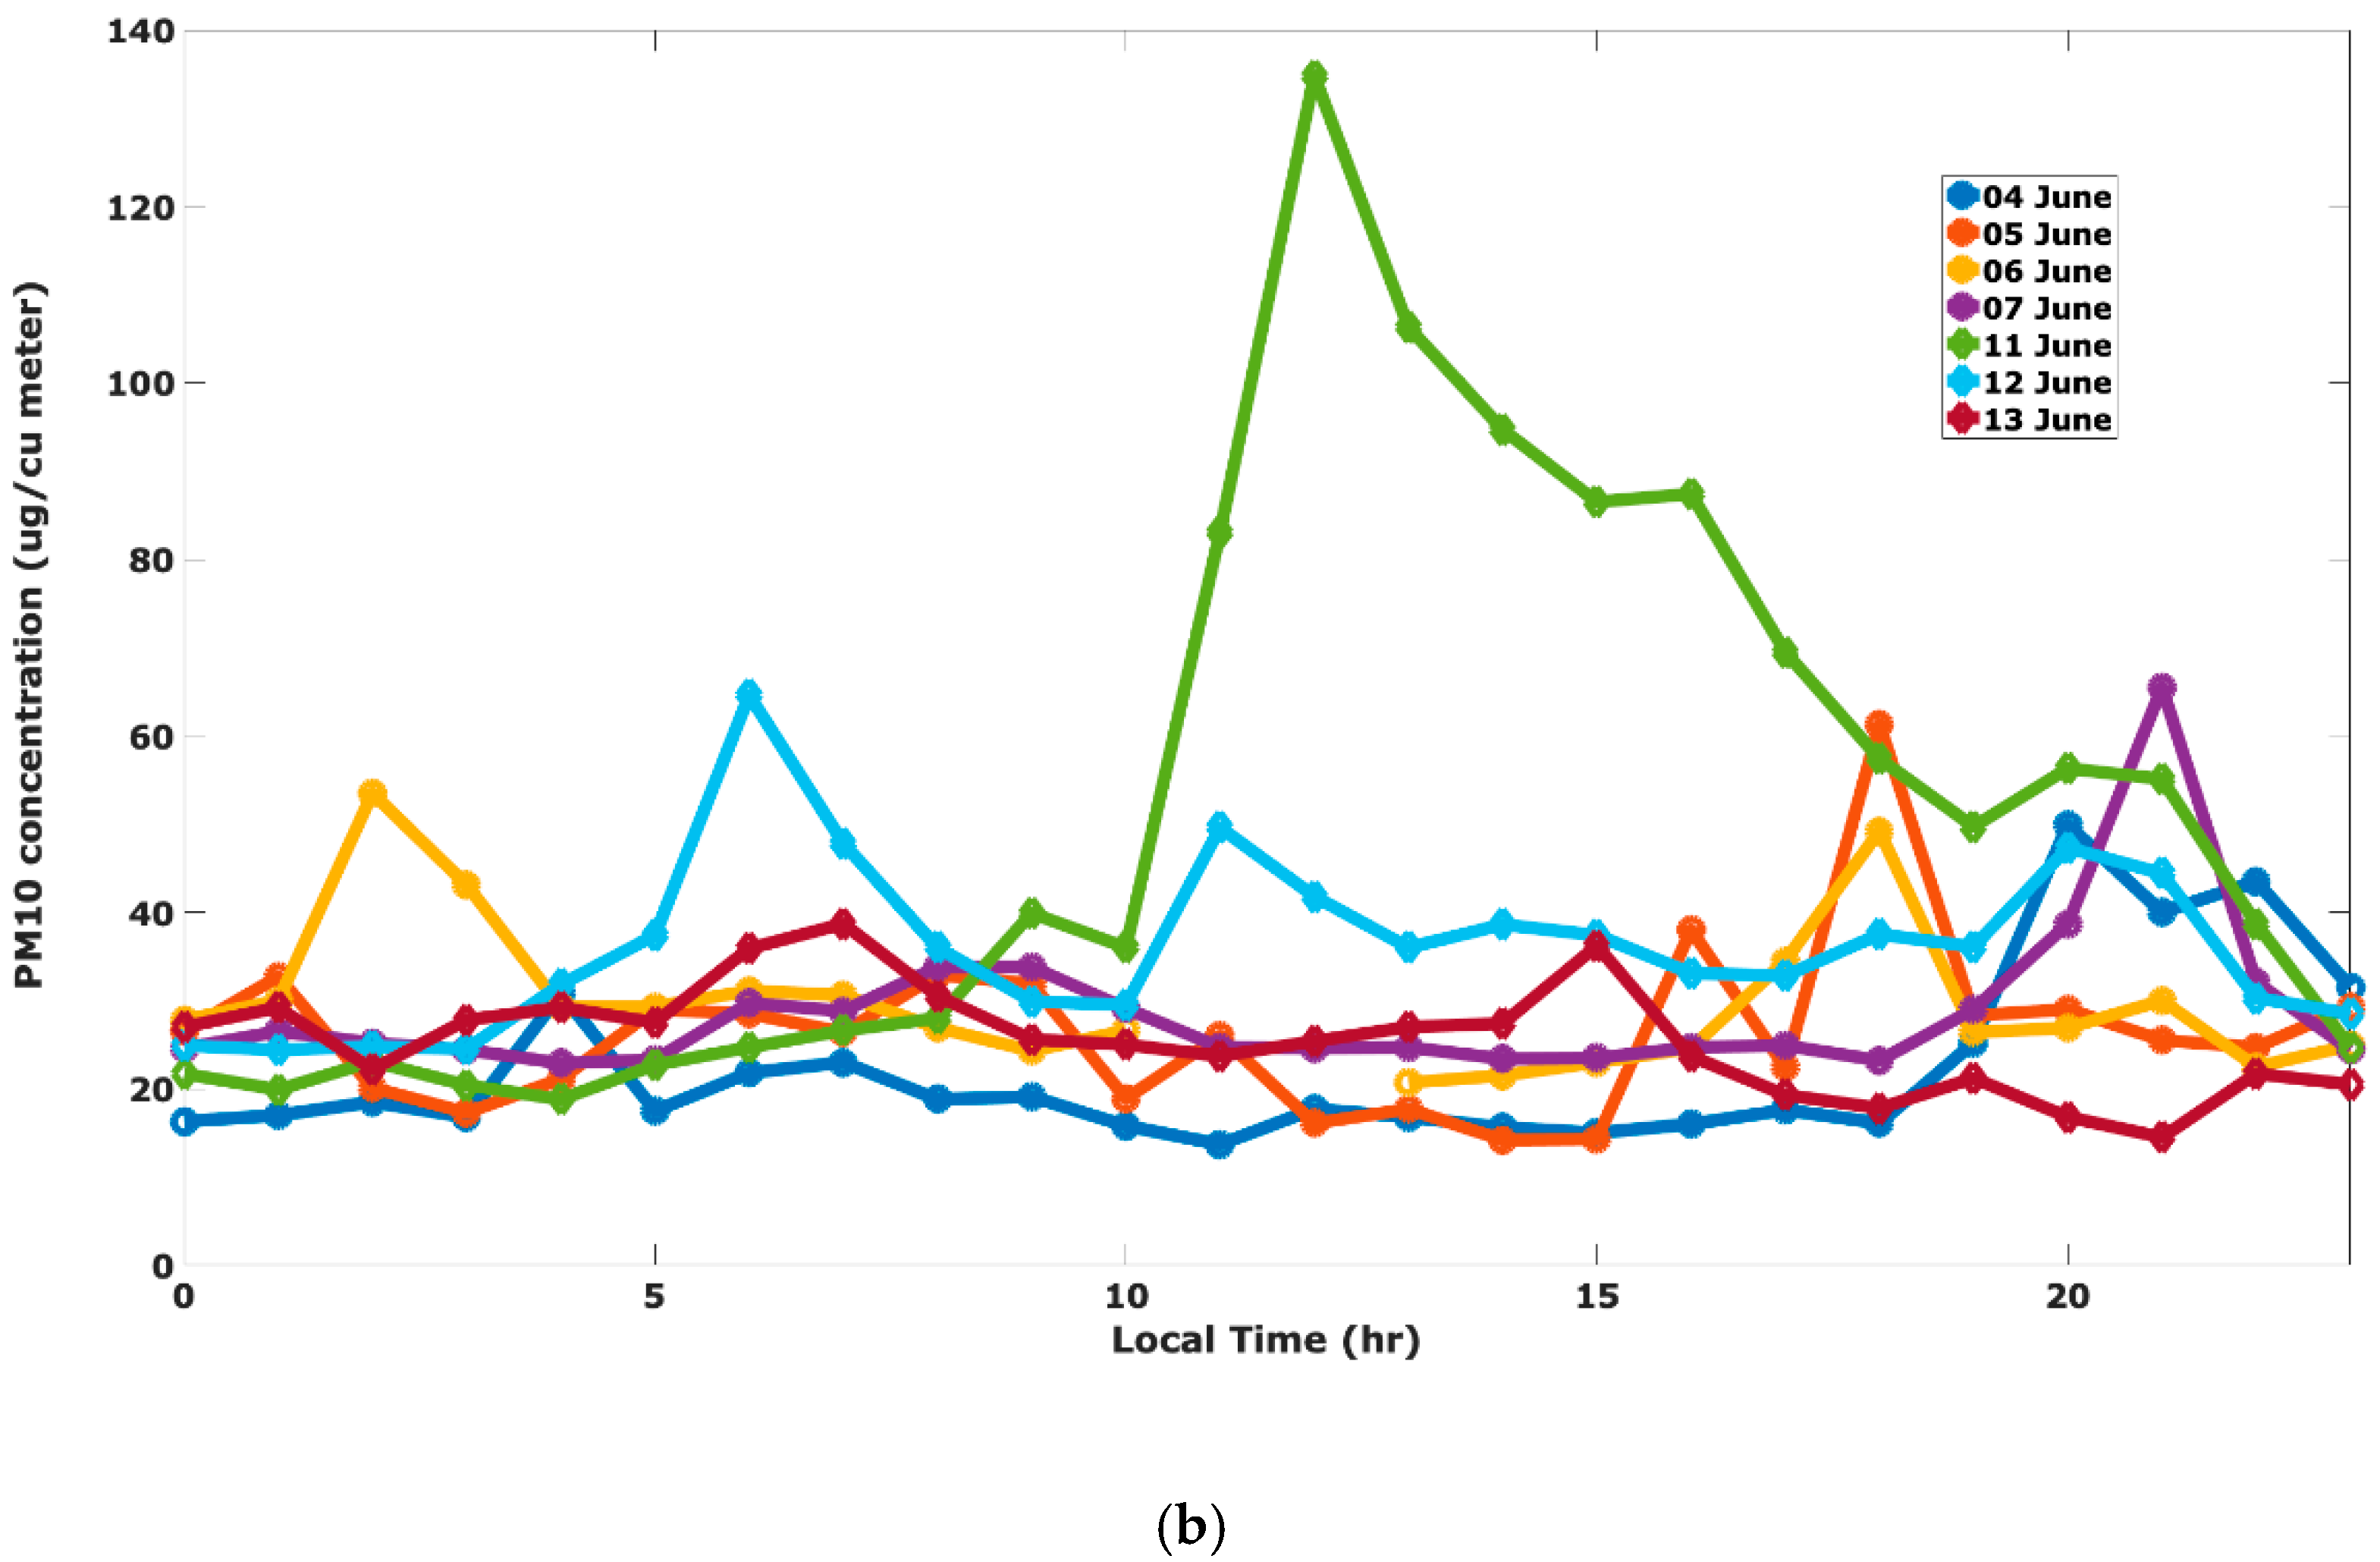
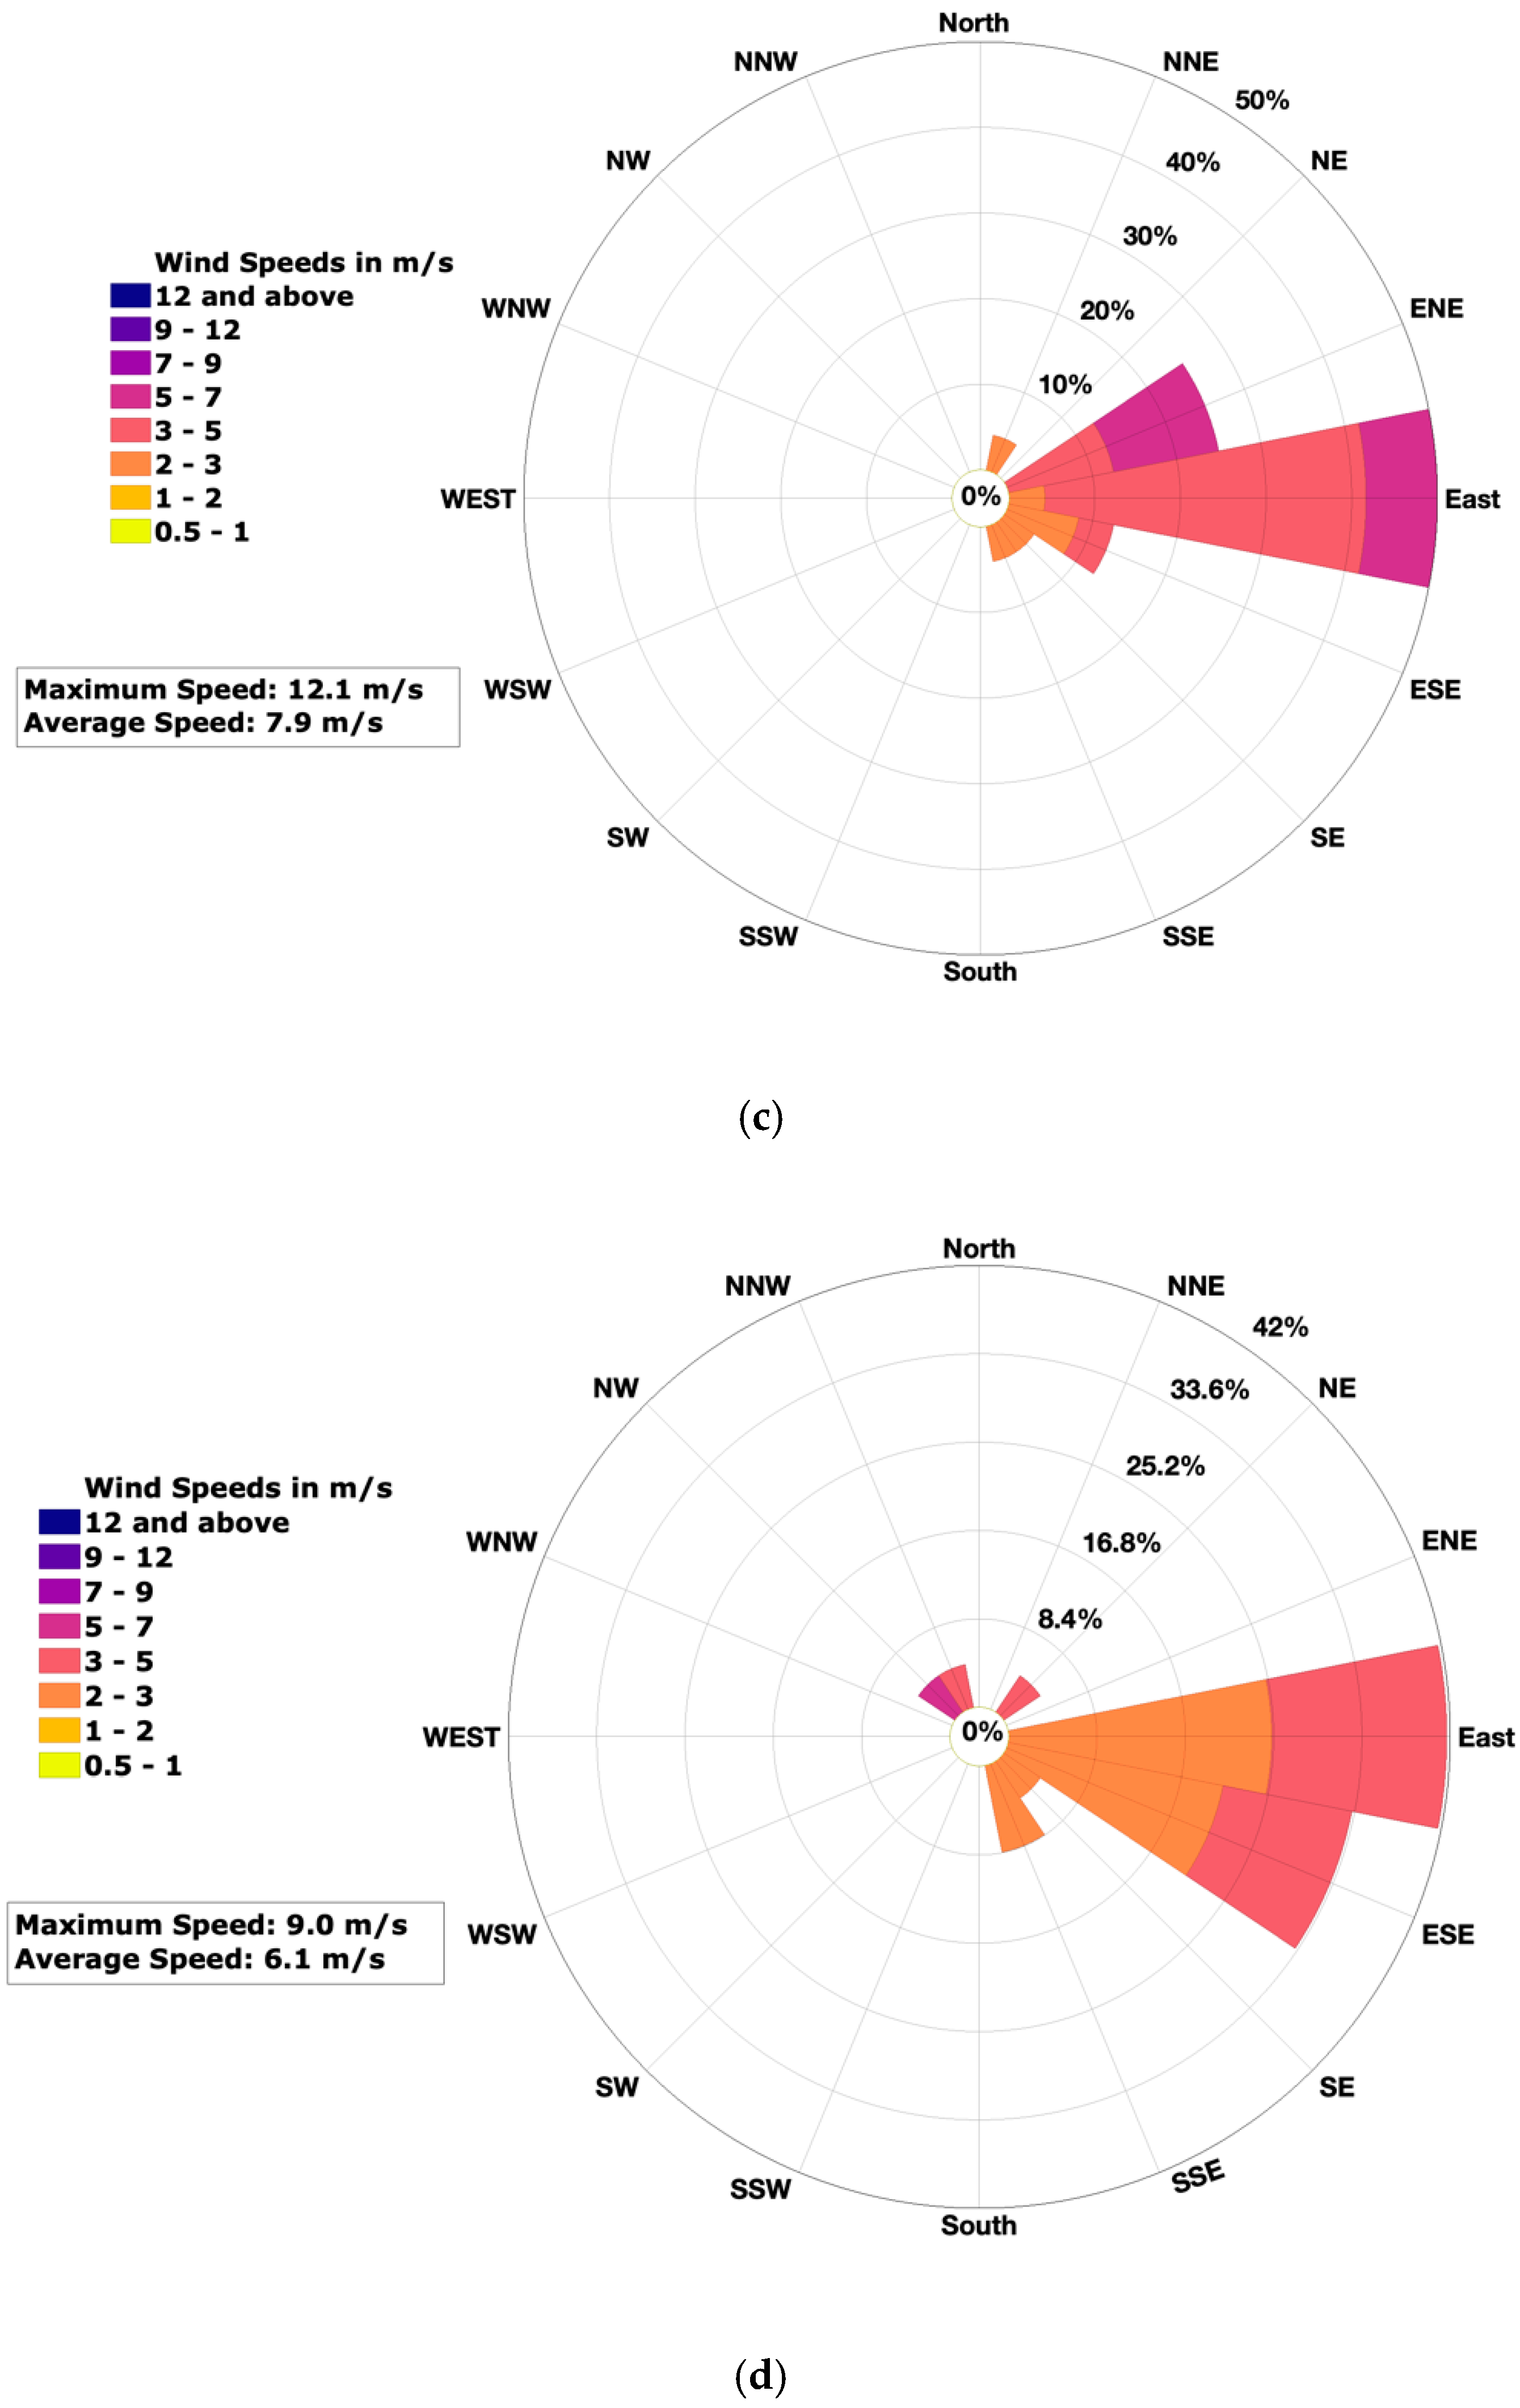
Figure 5a,b illustrate the diurnal evolution of PM (PM2.5 and PM10) throughout the episodes under study. The period from 10 a.m. to 6 p.m. is characterized by higher PM concentrations. This period, in general, reflects the buildup period of pollution. During the low ozone episodes, it was observed that the concentration of PM2.5 (4 and 5 June) was on the higher side during this period. June 4 and 5 had clear sky compared to 6 and 7 June, which were cloudy, as seen in the ceilometer aerosol backscattered profiles in Figure 13a. This spike in the PM2.5 concentration is due to the photochemical production during a bright and sunny day. Whereas, it was observed that 11 June was a windy day compared to the other two low ozone events. The average wind speed on 11 June was 9.44 m/s compared to 7.34 m/s and 7.66 m/s for 12 and 13 June, respectively, as observed in Figure 9. Therefore, the higher concentration of PM10 can be attributed to high wind speed and dust blown in the air.
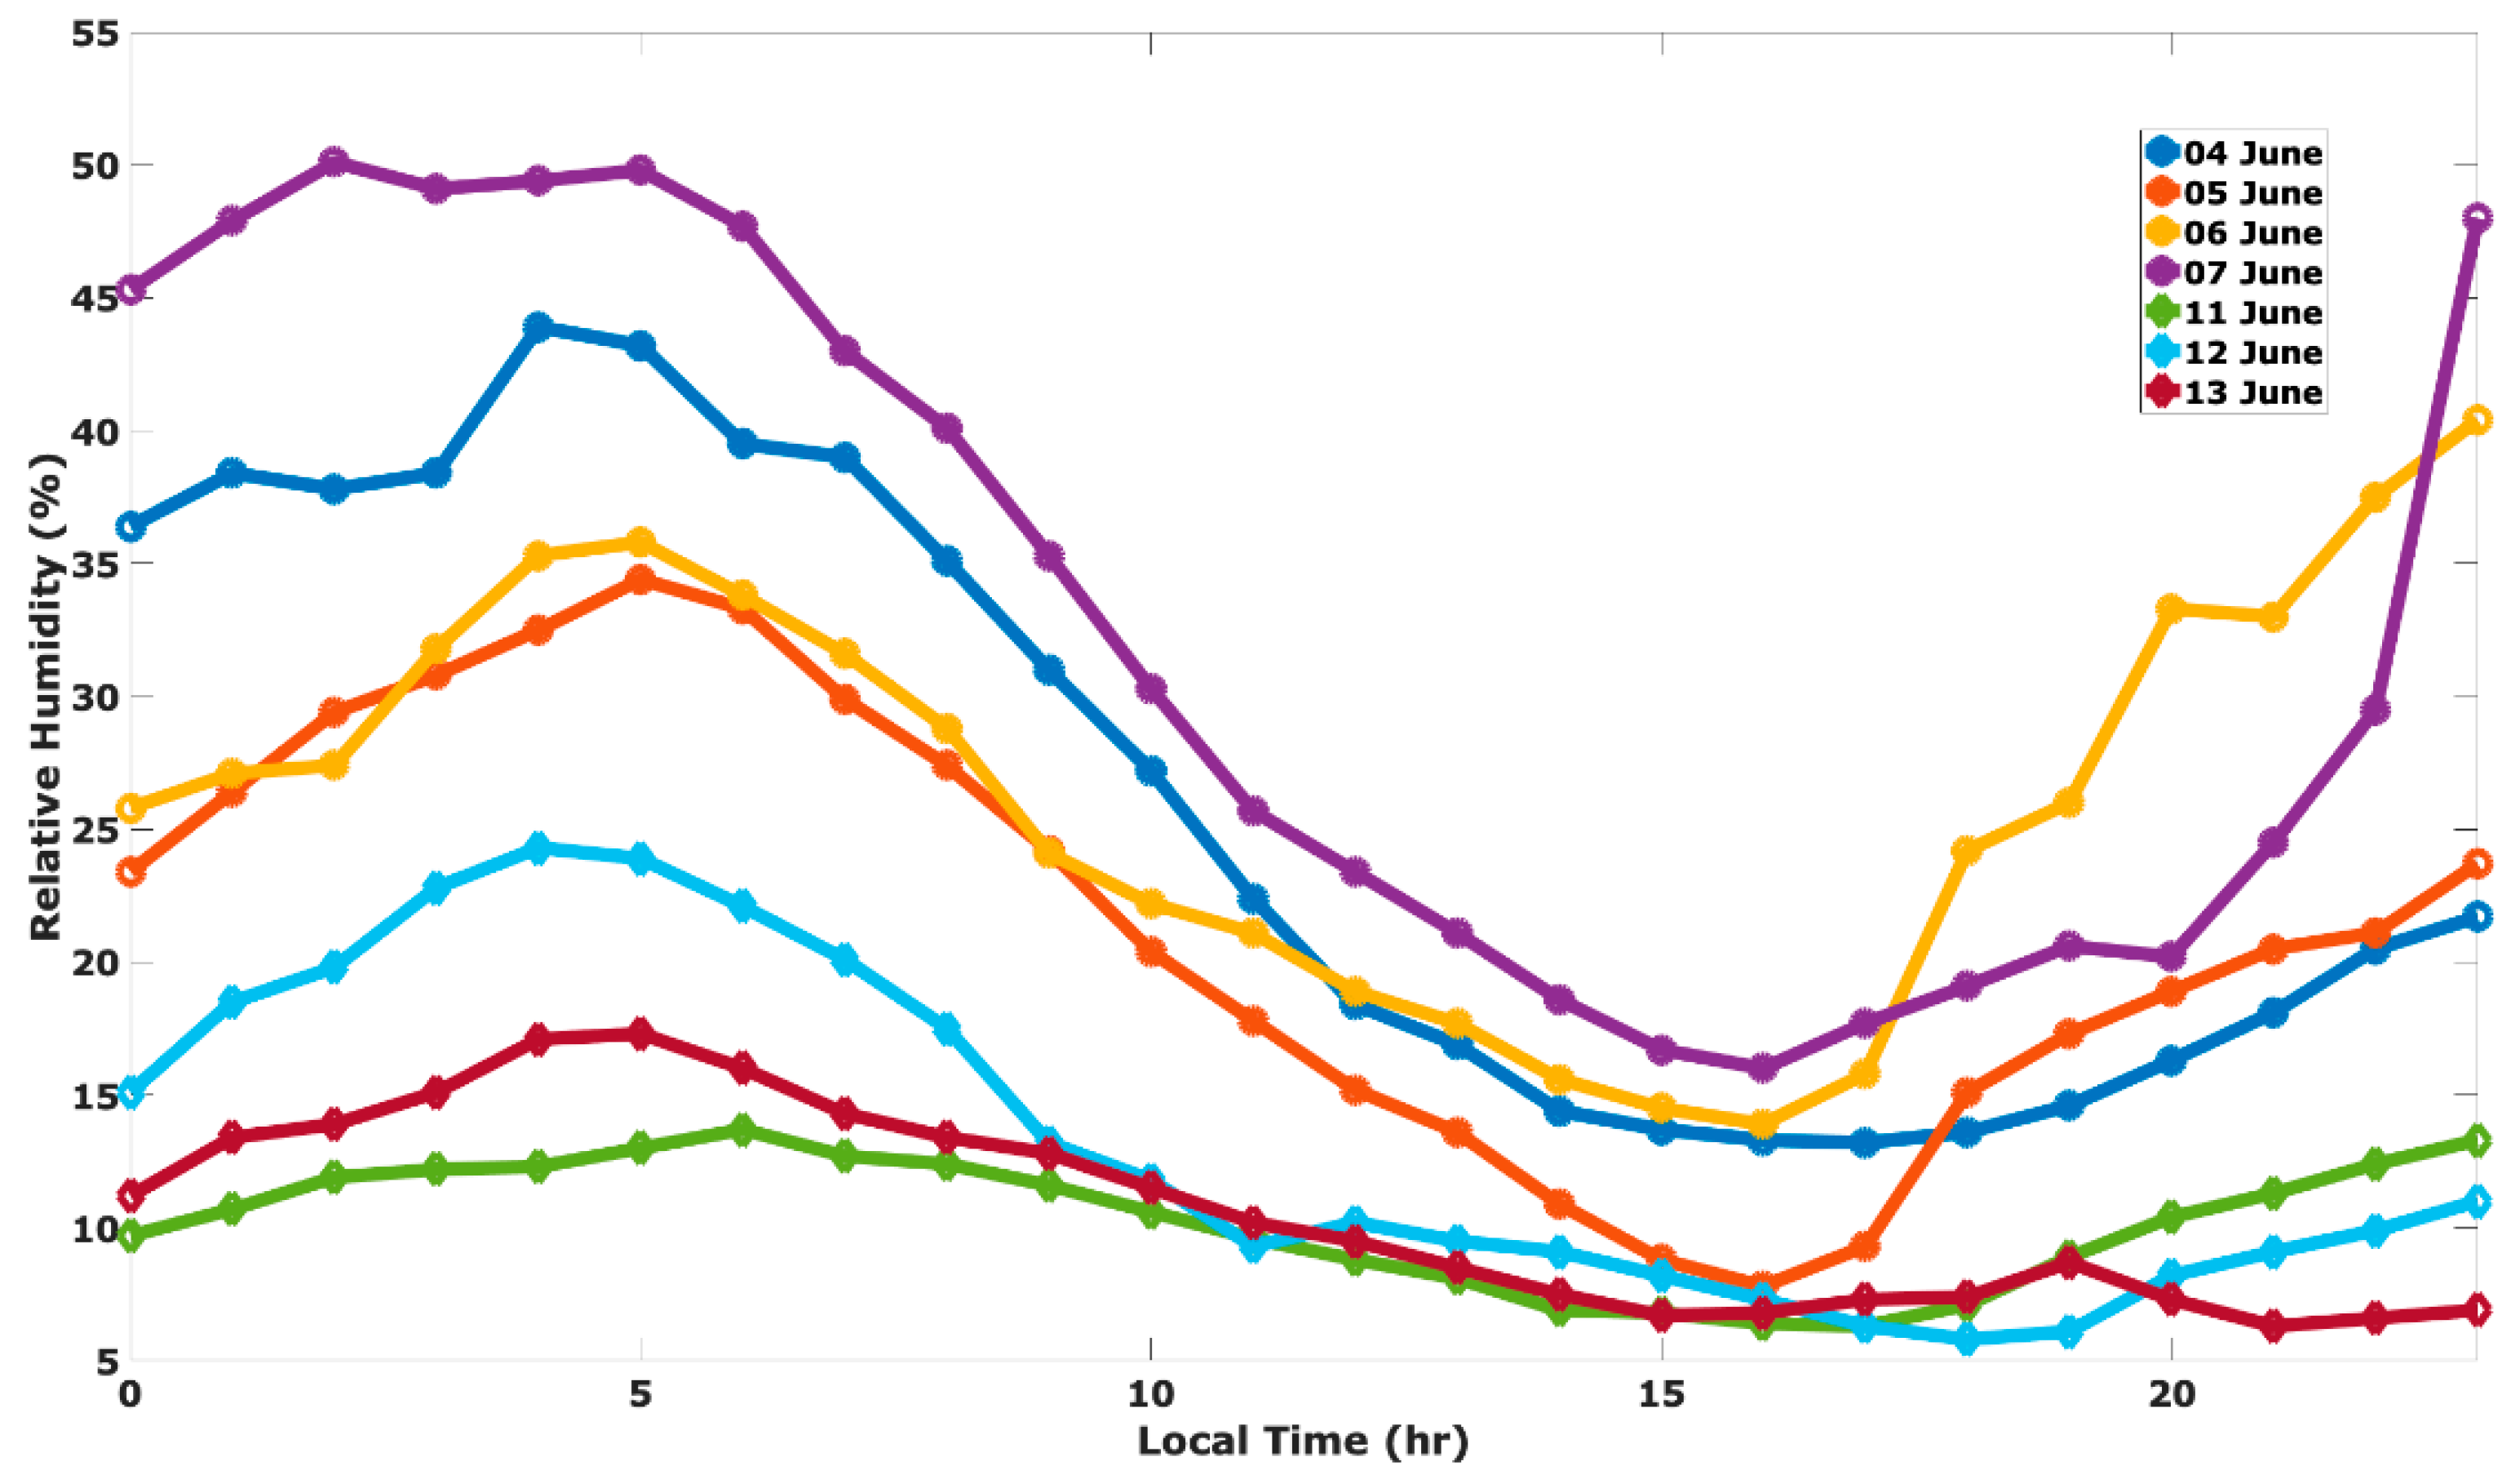
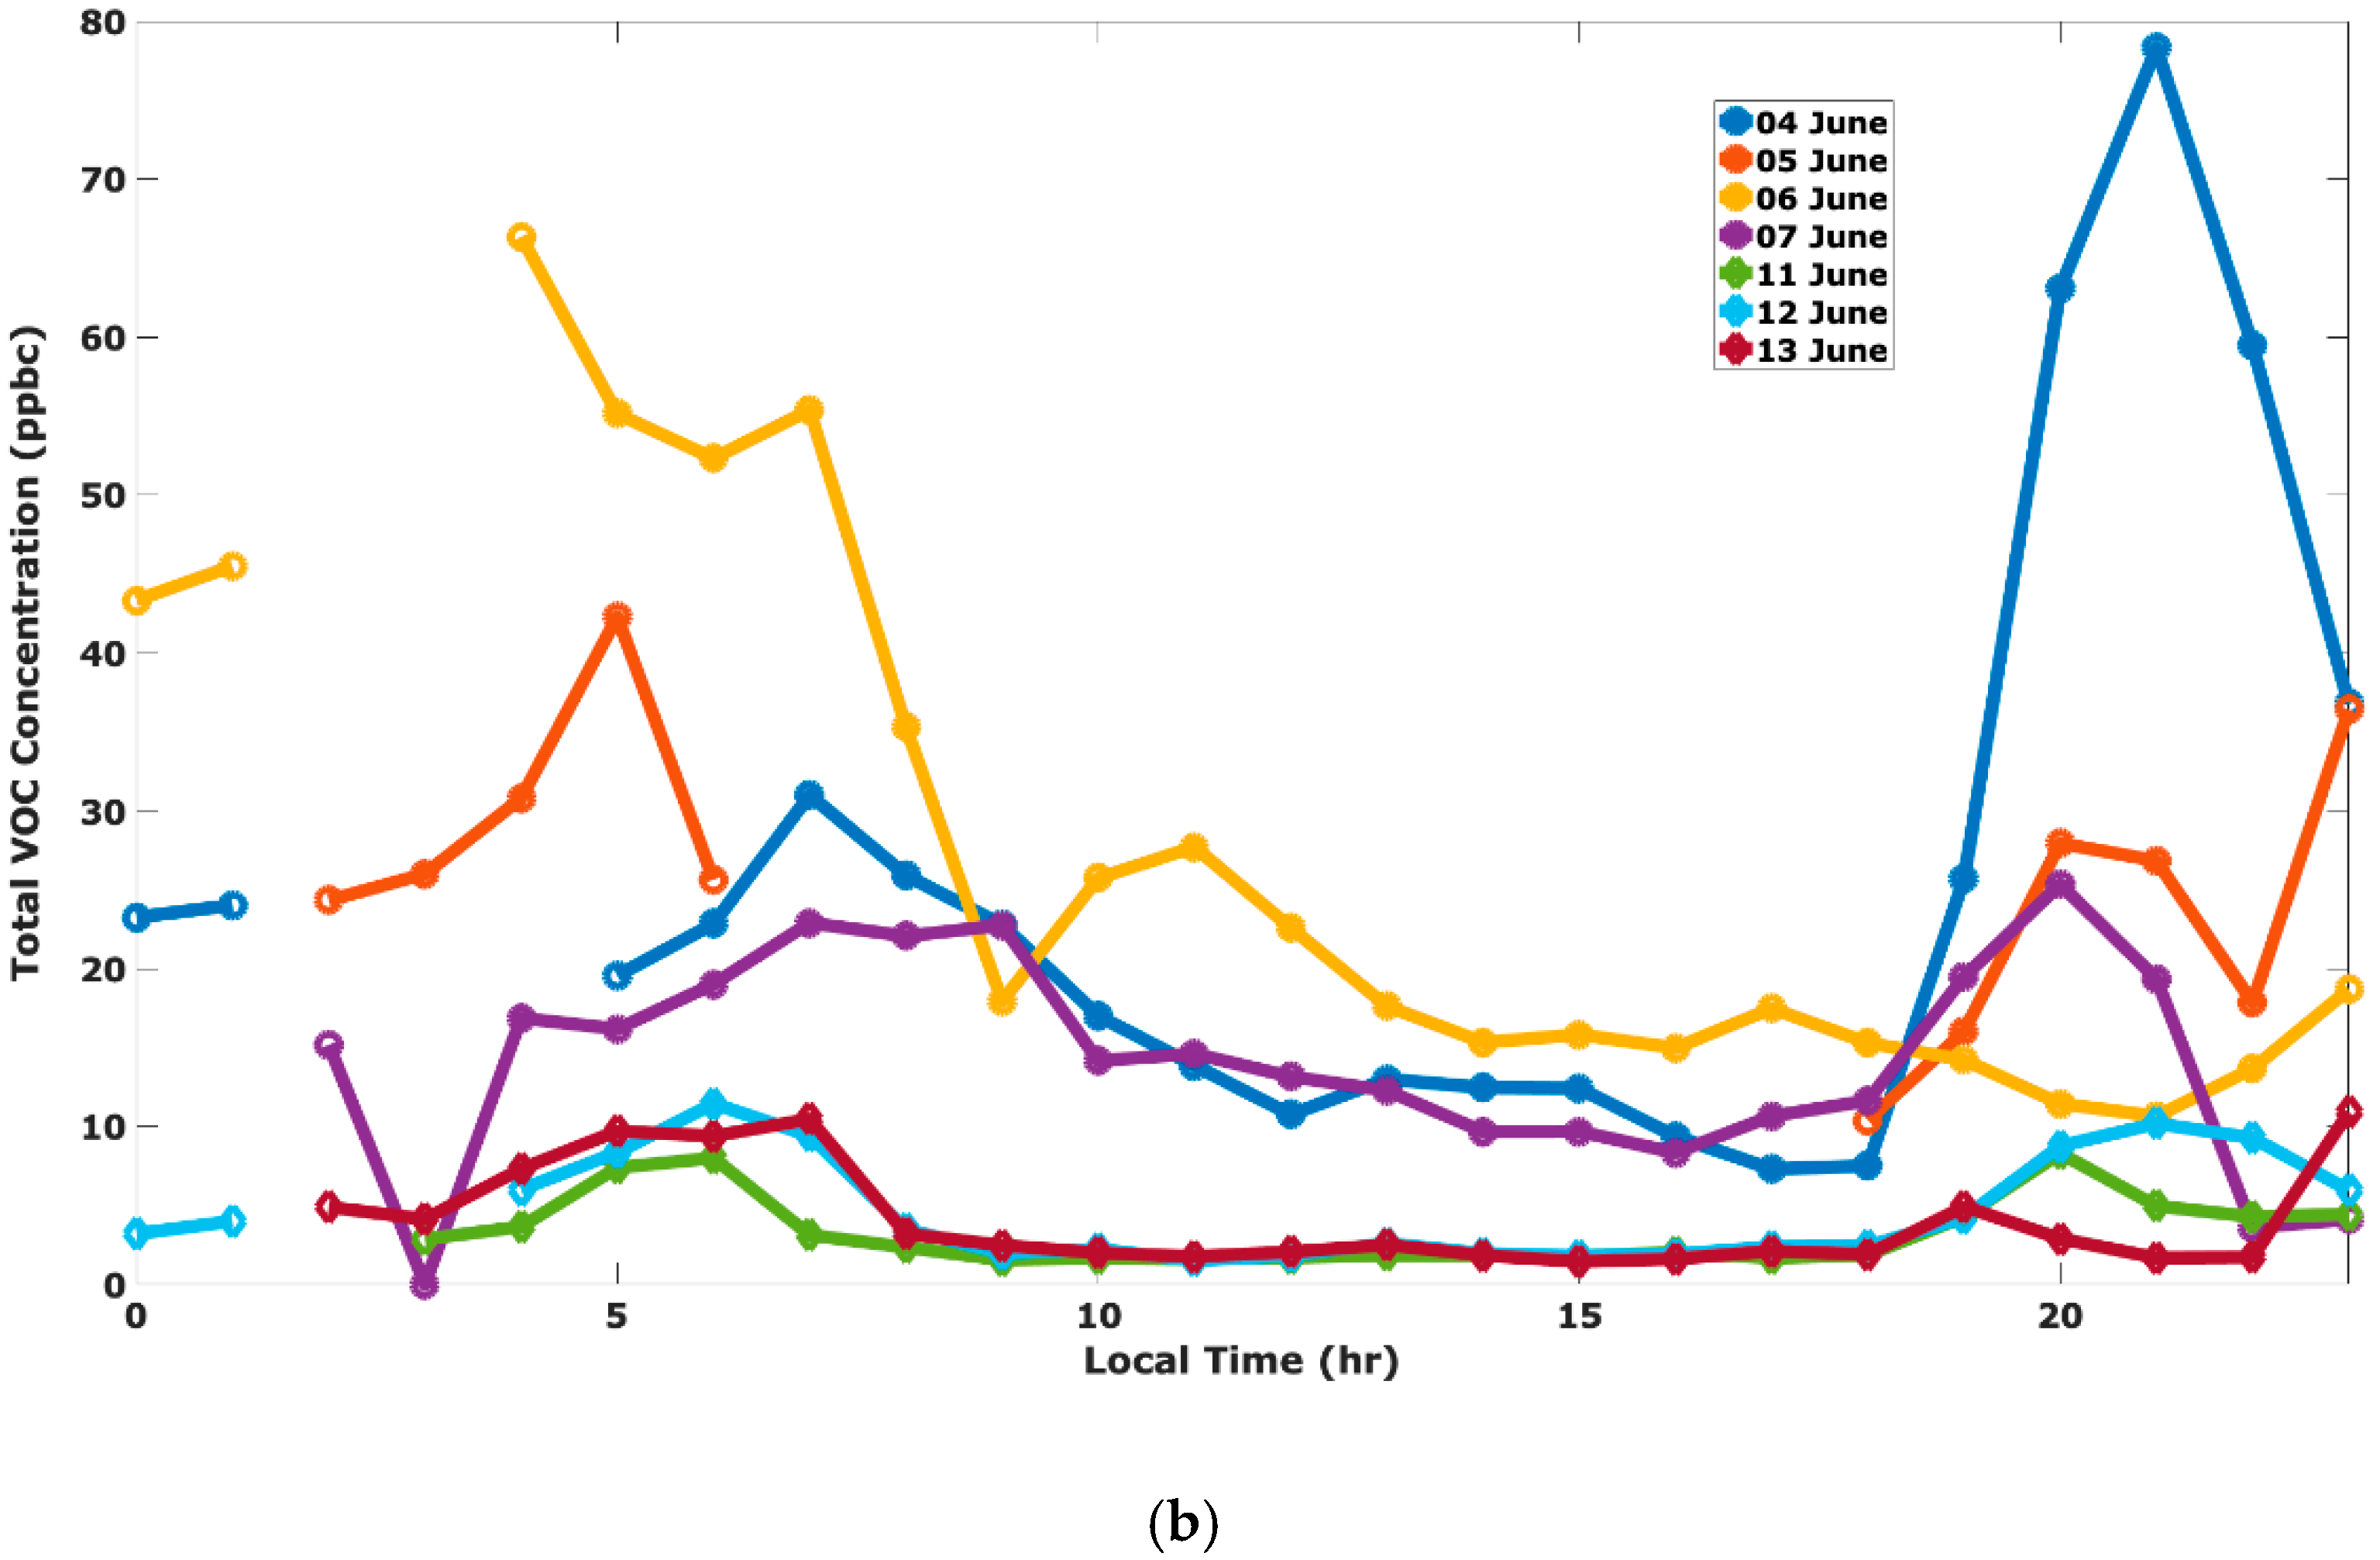
When the local temperature and relative humidity are both high, the atmospheric water vapor concentration is high, and higher levels of hydroxyl (HO) are associated with higher atmospheric water vapor concentrations [37]. The relative humidity during the high ozone episodes was higher than the low ozone events (Figure 6). This suggests that higher concentrations of the HO radicals were available to produce more ozone during the high ozone episodes than during the low ozone episodes for this event. The presence of precursors in the ELP region, such as NOx and VOC, are the result of local emissions and due to transport into the region from elsewhere. An ozone–NO–NO2 photo stationary state is a first-order approximation of ozone concentrations in the troposphere, [ O 3 ] = J N O 2 k [ N O 2 ] [ N O ] , where [ O 3 ] is the ozone concentration; J N O 2 is the photolysis rate coefficient of nitrogen dioxide; k is the rate coefficient for the reaction of ozone with nitric oxide (O3 + NO → NO2 + O2); [ N O 2 ] is the nitrogen dioxide concentration; and [ N O ] is the nitric oxide concentration. Note that the ozone concentration depends on the ratio of the nitrogen dioxide and nitric oxide concentrations and ozone concentrations may be increased by atmospheric chain-reactions that convert NO to NO2. Observations from the different CAMS reveal lower NOx concentrations during the high ozone episodes. Table 4 shows that the average VOC/NOx ratio is significantly higher on higher ozone days compared to the lower ozone days. Ozone formation is the most efficient at VOC/NOx ratios near 10 [38]. Lower VOC/NOx ratios lead to lower ozone concentrations.
An in-depth analysis of the sources of the ozone precursors and their formation is beyond the scope of this work; that said, from Figure 7a,b it can be seen that during the back-to-back high ozone episodes, the local NOx concentration was on the low side compared to the VOC concentration. It should be taken into consideration that the VOC site is at some distance from the UTEP site, and as our previous observations suggest, the level of precursors seems to be decreasing as we move away from the UTEP site towards the other sites located to the southeast direction. Lower emissions of NOx in the city during the four successive ozone episodes sustained the higher O3 concentration rate in the city. During the high ozone episodes, an increase in relative humidity after 5 p.m. was distinctly observed.

3.4. Winds and Related Synoptic Analysis during the Episodes

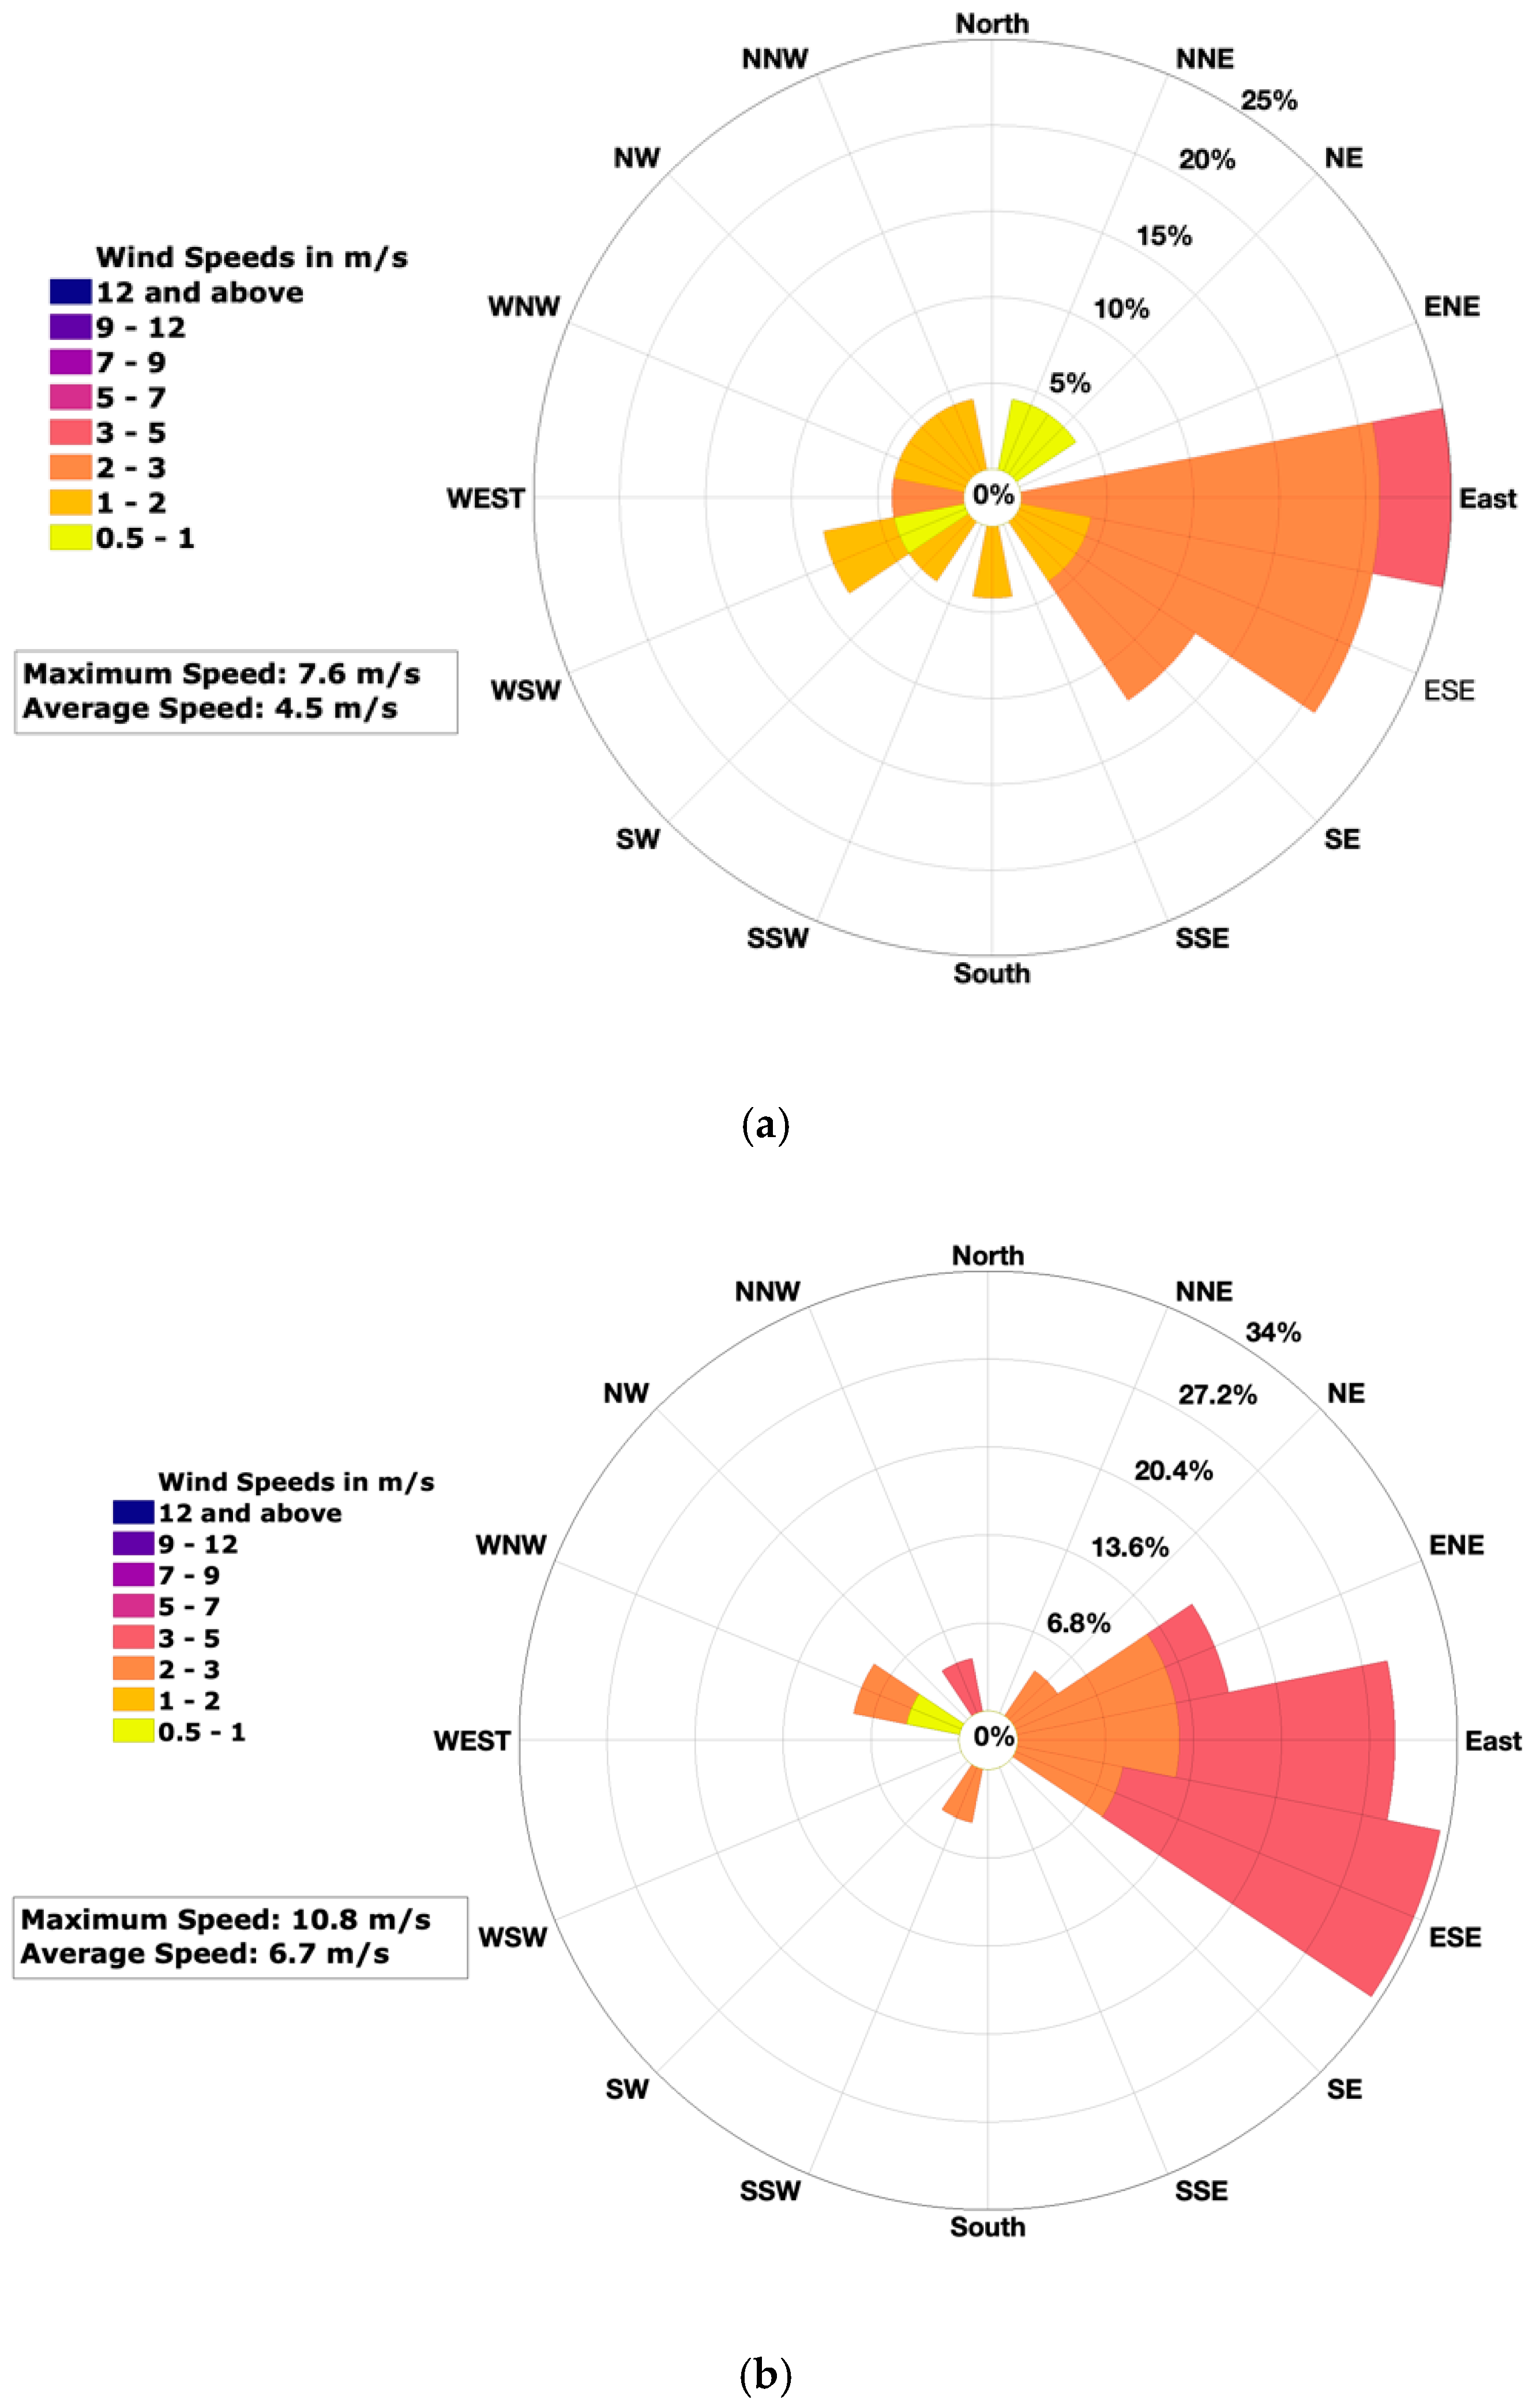
Wind plays a crucial role in the formation and dispersion of ground-level ozone [2]. Wind speed data obtained from the CAMS 12 station revealed that during the high ozone episodes, winds were calm, whereas strong winds were recorded during the low ozone episodes. This was expected because calm winds facilitate the accumulation of precursors and their ozone-producing reactions, whereas strong winds dilute the precursors and disperse them from the region. However, this behavior of the winds was observed only during the daytime hours when the ozone episodes took place. Erratic behavior of the wind was noted during the remaining hours. Wind roses were used to characterize the speed and directions of the winds during the ozone events. The wind directions during the ozone events were also a strong indicator of the direction of the incoming ozone and its precursors as recorded by the CAMS 12. Figure 8 and Figure 9 are the wind roses from the CAMS 12 station. Wind direction during the high ozone episodes tended to be E, ESE, and SE, and for the low ozone episodes W and NWN, which is consistent with observations made in the study conducted by the National Oceanic and Atmospheric Administration (NOAA’s) Earth System Research Laboratory (ESRL) group [39].
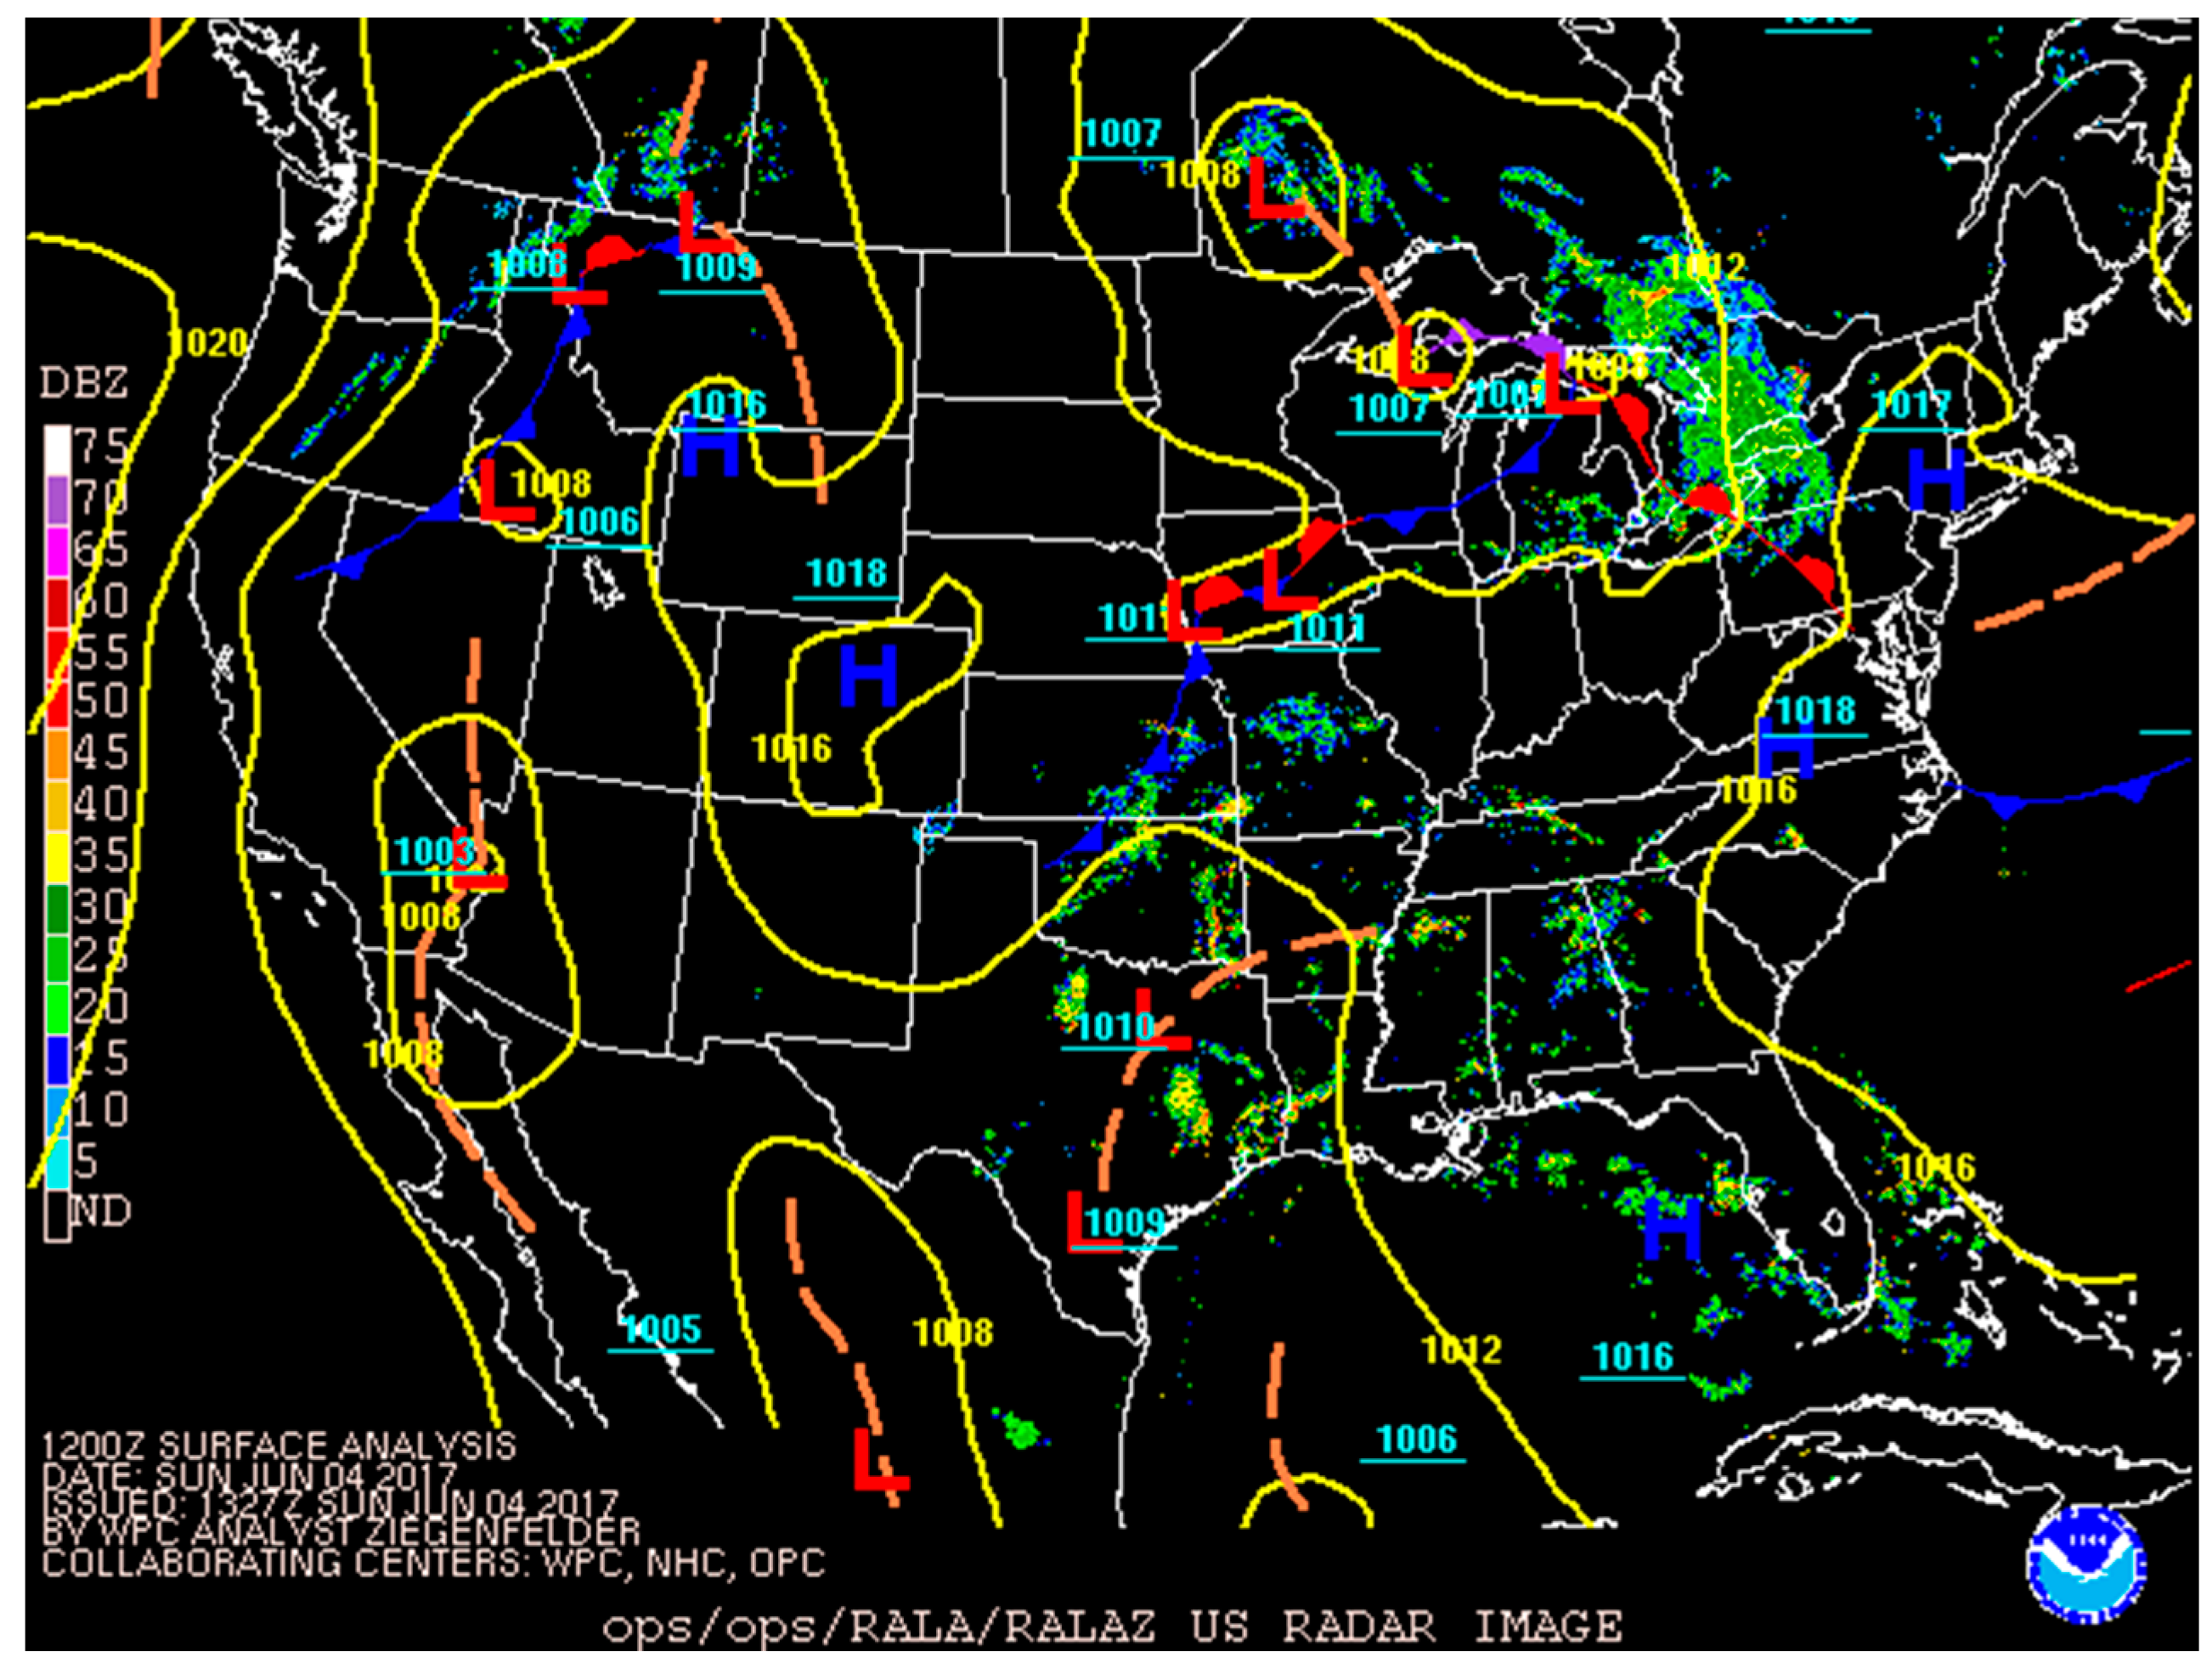
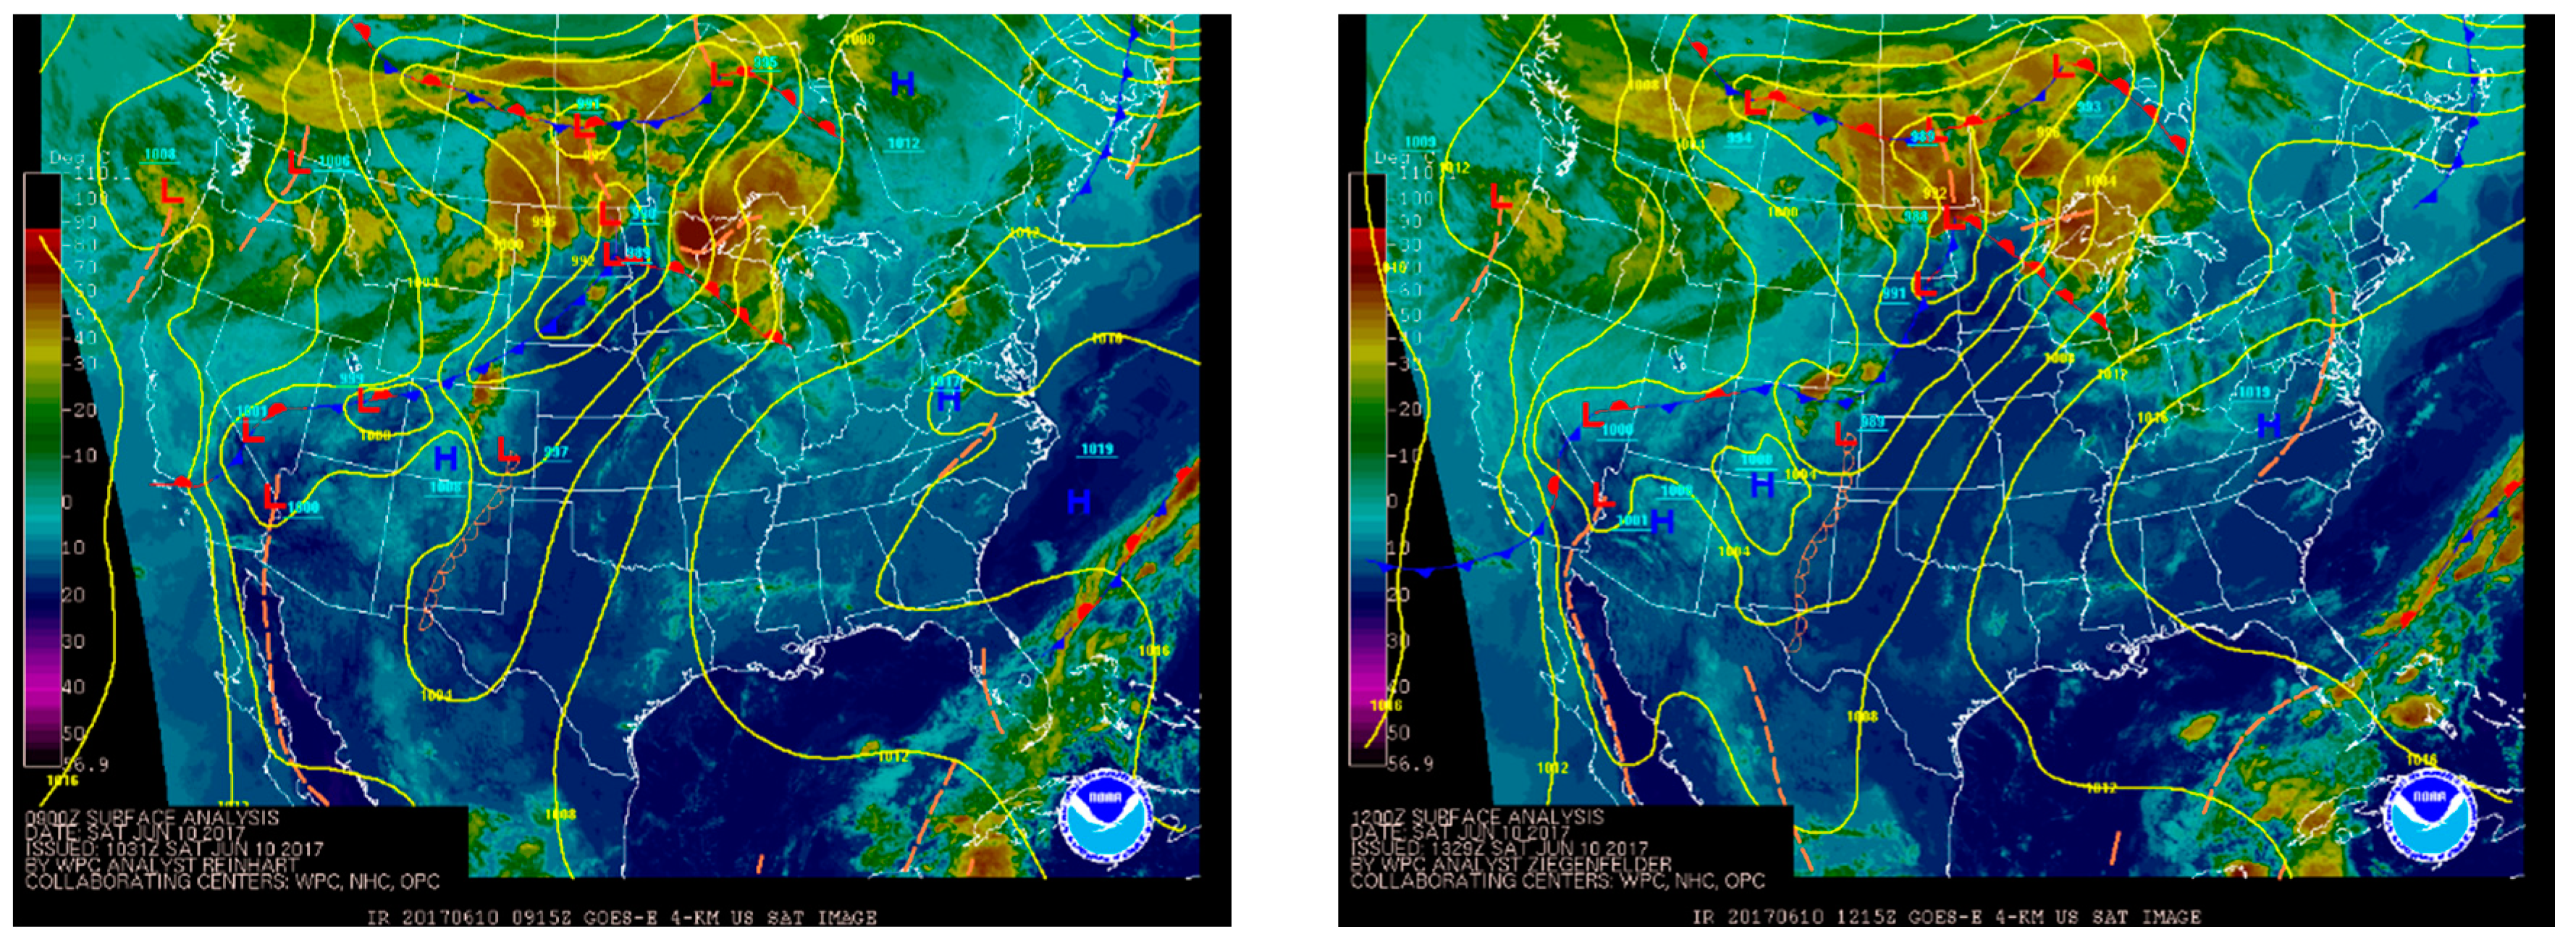
The observed wind pattern above during both the ozone events suggests that the synoptic meteorological forcing may be a factor in determining the difference between the high and low ozone events. Hence, synoptic-scale meteorology was examined during the high and low ozone episodes. During the high ozone episodes, the wind direction was predominantly from the east and southeast directions. Analysis of the composites of the 1000 mbar and 750 mbar geopotential heights reveals the presence of a high-pressure ridge on the north of the state of Texas during the four days of high ozone events (Figure 10). This is the reason why the high frequency of the winds during the four successive high ozone episodes was predominantly from the east and southeast side, as recorded by CAMS 12. It is to be noted that to the north of CAMS 12 are the Franklin Mountains. However, as observed during the low ozone episodes, the wind direction was mainly from the west direction. This was due to the passage of a dryline that passed through the region two days before the low ozone events (Figure 11). The dryline is a boundary separating the moist and dry air masses. It typically comprises of moist air from the Gulf of Mexico coming from the east direction and the dry and hot desert air coming from the Chihuahua desert region in the southwest [40]. A typical dryline passage results in a sharp drop in humidity, which was also seen in this case, subsequently clearing the skies and with a wind shift from a south or southeasterly to a west or southwesterly. Blowing dust and rising temperatures follow, especially if the dryline passes during the daytime. This is also the reason why higher concentrations of PM10 were recorded during the low ozone episodes; strong winds from the west carried the dust particles from the Chihuahua desert region into the ELP–CDJ.

3.5. Aerosol Layer Structure and Its Evolution during the Aerosol Events

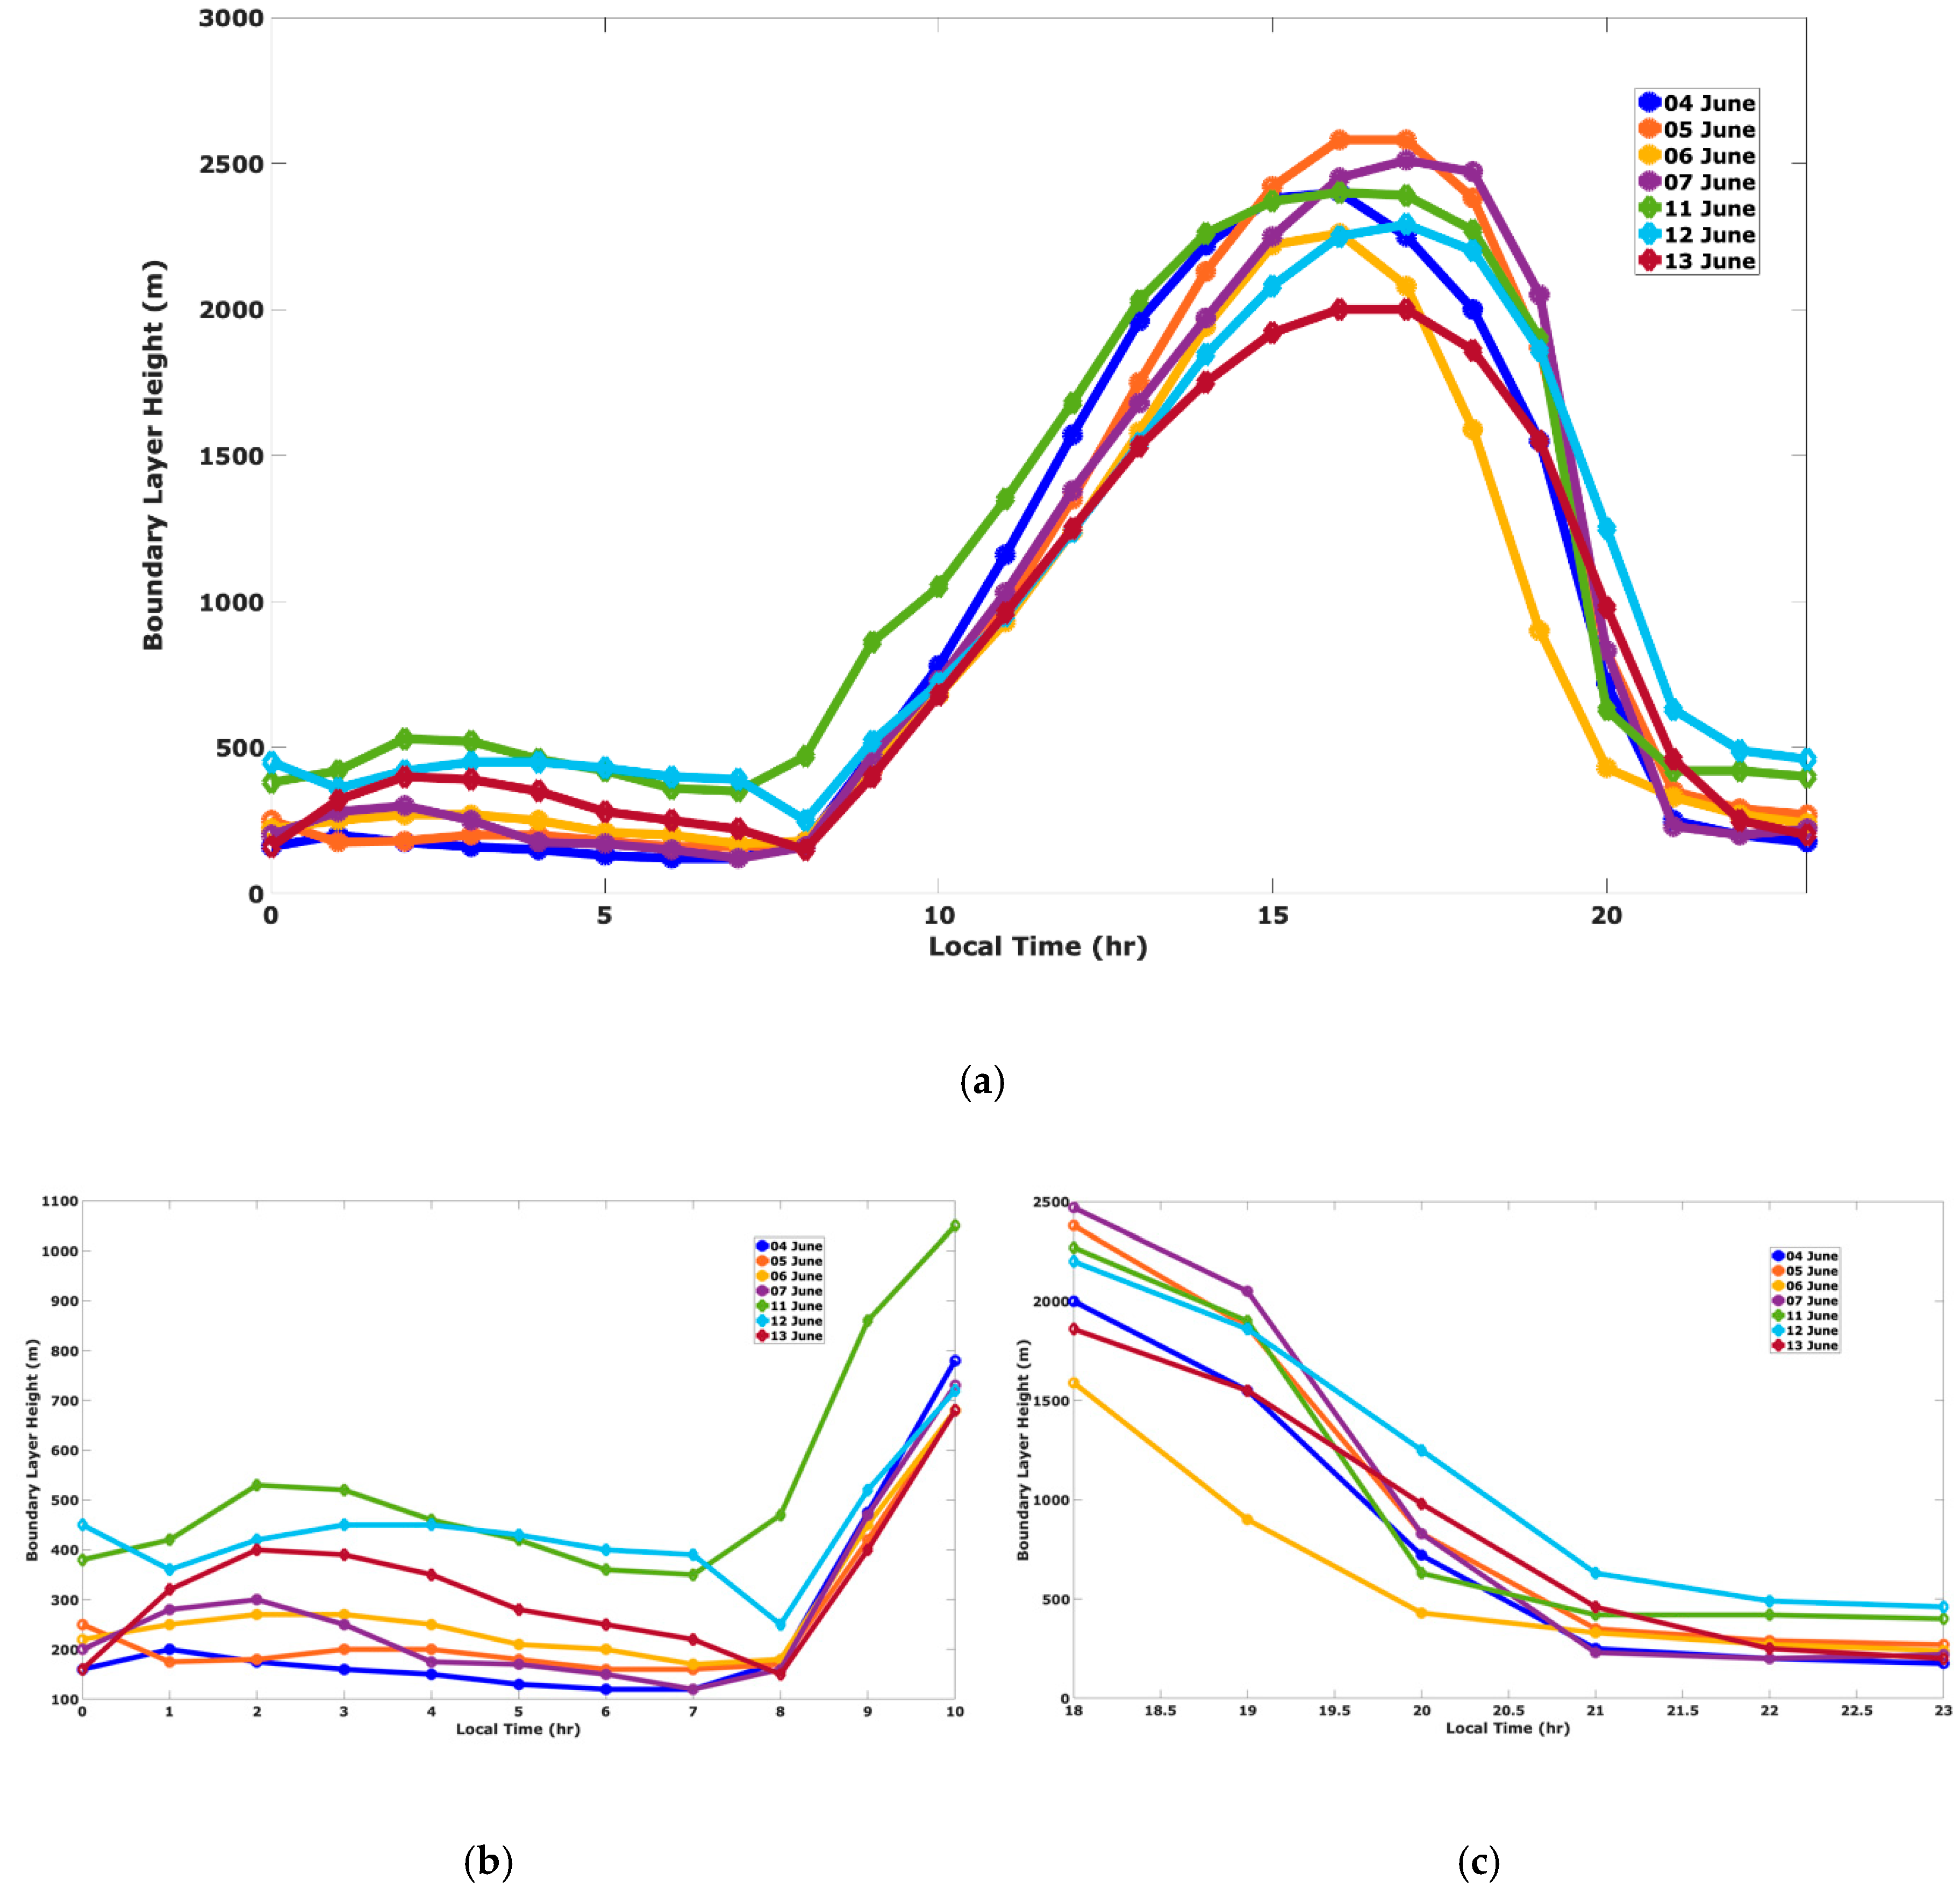
In some of the previous studies [41,42], the updated YSU PBL scheme within WRF has shown the excellent capability for capturing the nighttime minimum near surface ozone concentrations and its predictions when compared with the observed values. The diurnal evolution of the PBLHs was observed for both the high and low ozone events, as seen in Figure 12a. Considering the advantage of the WRF YSU scheme over the other available schemes, it was explicitly used in this region to obtain the hourly PBLH evolution. In addition, for the first time in this region, the hourly values of the mixing heights were acquired from the HYSPLIT model. Comparison of daily growth of the PBLH using WRF during the high ozone episodes revealed that the early morning and late evening PBLH seemed to be shallower compared to the low ozone episodes (Figure 12b,c). As seen in Figure 12b, the green, aqua blue, and red lines corresponding to the PBLH during the low ozone days are higher compared to the high ozone PBLH lines. This behavior suggests that the lower PBL must have caused the ozone precursors to be more reactive, and this led to the high ozone concentration that occurred during the daytime. However, the growth rate of the PBL seemed consistent during both the extreme ozone events. The growth rate of the convective PBLH appeared to be linear after the sunrise and peaks between 4 and 6 p.m. The time at which the modeled PBL growth begins is the same for both the ozone events. The peak of the simulated PBLH for the ozone events varied between 2000–2700 m. The daily peak PBLH during the high ozone event coincided mostly around 4 p.m. local time with the exception of 7 June, which peaked an hour later, as seen in Figure 12a. However, the daily PBLH peak overlapped at the same time around 5 p.m. local time during all the three low ozone episodes.
The Vaisala ceilometer CL31 provides the aerosol backscatter (i.e., the signal strength versus the height of the aerosol layer), which is then processed to calculate the cloud base and aerosol MLH that can be used as a proxy for the PBLH. In Figure 13a,b the backscatter profiles for both the back-to-back high and low ozone episodes are presented, as well as the estimated MLH using the proprietary BL View software (Vaisala Oyj). During the four successive high ozone episodes, a typical rise in the MLH during the daytime with strong convection in the afternoon and the presence of the residual layer during the night time and early morning hours before the sunrise can be clearly seen in Figure 13a from the ceilometer data. A higher residual layer on top of the elevated nocturnal boundary layer was observed on three successive low ozone days, as seen in Figure 13b. The diurnal variation during the low ozone events was not as clearly visible as compared to the high ozone events due to the horizontal homogeneity of the aerosol layer on 11–13 June 2017. Higher concentrations of PM10 were recorded by CAMS 12 for those three days of the low ozone episodes. Contrary to the PBLH obtained from the WRF, a distinct difference in the PBL structures during the high and low ozone events was observed. The average MLH from 15–18 LT (maximum PBLH in Figure 13a) during the high ozone episodes was shallower (1164 ± 59 m) than the low episode period (1990 ± 79 m) (Figure 12b). The black dots in Figure 13a,b represent the detection of the cloud base heights by the ceilometer roughly above 4 km. Clouds were detected on 6, 7, and 11 June, respectively, as also confirmed by the intensity of the aerosol backscatter.

3.6. Correlation between Boundary Layer Heights, Ozone, and Other Aerosols Concentrations

All the data from the CAMS and modeled PBLH throughout this study were available as hourly averages only. Hence it was convenient to use the 24 h averages of these data for the correlation studies. The correlation of the tropospheric ozone with the temperature is well known. The outdoor temperature measured by various monitoring stations is also closely correlated with other meteorological variables, such as solar radiation, cloud cover, circulation, and atmospheric stagnation. Calm winds accompany higher temperatures and cause the atmosphere to stagnate. Higher temperatures are also associated with higher emissions of VOC due to higher rates of vaporization of gasoline and other fuels, which tends to accelerate ozone production [43,44,45]. Hourly values of ozone, its precursor’s concentrations, and PBLH were used to investigate is the correlation coefficient (R) that shows the relation between the dependent variable (ozone and its precursors) and the independent variable (PBLH). The outcome of the correlation analyses with the modeled PBLH using ozone and its precursor’s concentrations data are shown in Table 5 and Table 6. It turns out that both the modeled PBLHs (using WRF and HYSPLIT) show a higher correlation coefficient for ozone as compared to its precursors, indicating a significant correlation between the modeled PBLHs and ozone. When compared between the two modeled PBLHs, the WRF-derived PBLH (Table 5) showed a stronger correlation to ozone as compared to the HYSPLIT-derived PBLH. Correlations for 7 June seemed consistently on the lower side for both the cases.

4. Discussion

The slow growth in the PBLH in the morning and calm winds during daytime made a significant contribution to the occurrence of high ozone episodes. This observation is in agreement with the recorded field data reported by (Macdonald, C.P. et al; Brown, M.J. et al.) [5,14]. In all recorded high ozone events, the wind direction and speed played a significant role. During the high ozone concentrations, the wind speed was low, and the converse held true. This validates the well-known inverse proportionality relationship between the ground-level ozone concentrations and wind speed. In addition, in all high ozone events the wind direction was from the east of ELP. No strong correlation between the modeled (WRF and HYSPLIT) daytime PBLH peak and ozone concentration peak was observed during this study. This result was very much in agreement with the survey conducted previously by (Banta, R.M. et al.) [46]. A lower MLH implies less volume available for the pollution dispersion and lower vertical mixing. The presence of clouds around 5 km vertical height can be seen more distinctly on the 6th and 7th of June. Conversely, deeper MLH during the three successive low ozone events led to the dilution of precursors and ozone concentration. Strong winds ensured that the existing pollutants, such as ozone and VOCs, are dispersed out from the region (hence a drop in their concentration). The winds, however, brought in dust from the Chihuahua desert.
The contribution of the ozone from the residual layer into the convective boundary layer is beyond the scope of this work, but it deserves future attention. Analysis of the upper air data, the synoptic meteorology, showed a high-pressure ridge present during the high ozone events.
A high peak in the PM10 concentration was recorded on 11 June, in the late afternoon, and can also be noticed in the form of a strong backscattering signal on the ceilometer aerosol backscatter profile.

5. Conclusions

A comprehensive study of the successive high and low ozone episodes in June 2017 was performed using both models and instrumentation, to analyze the major factors, e.g., meteorology (focusing on PBL, synoptic) and ozone precursors, that contributed towards the ozone events.
This work was the first systematic, and rigorous PBLH analysis performed during the ozone episodes in the ELP–CDJ region made using the ceilometer aerosol backscattering and numerical modeling. Ozone events from 4–7 June 2017 were classified as successive high ozone episodes whereas 11–13 June 2017 ozone events were identified as low ozone episodes. This work established the influence of the PBLH and other meteorological parameters on these ozone events. The aerosol backscattered profiles clearly indicate that the boundary layer played a significant role during these successive high and low ozone episodes. Analysis of nearly two decades of data shows that the month of June is a favorable month for ozone events in the ELP–CDJ airshed. The observed aerosol layer height was shallow during the high ozone days and is instrumental in allowing ozone precursors, such as NOx and VOCs, to accumulate and react due to limited availability of volume for dispersion.
The relation between the PBLH and the diurnal pollutant evolution was established using statistical analysis. For ozone diurnal variation, the WRF model performed better than HYSPLIT during the high ozone episodes. The correlation coefficient (R) in Table 5 and Table 6 indicated that the PBLHs variation could explain from 48% to 73% of the observed ozone during the high ozone episode period. Whereas, for the low ozone period, only one-day changes in the PBL had an R higher than 50%, indicating that PBL height development was not modulating the diurnal ozone evolution. WRF simulations showed that during the early morning and late evening the PBLHs were lower during the high ozone events compared to the low ozone events. These simulation results were consistent throughout the high and low ozone episodes, respectively. Other than 11 June, all PBLHs showed a constant growth rate between 8 a.m. and 11 a.m. Modeled and observed PBLH growth showed a difference in behavior. This difference was attributed to the way PBLH is defined for each.
The heat deficit calculations provided a greater understanding of the atmospheric stability during the high and low ozone episodes. A high ozone day exhibited strong atmospheric stability together with a high-pressure ridge, whereas during the low ozone episodes the lower atmosphere was less stable. The high atmospheric stability also affected the vertical dispersion of ozone and its precursors, leading to the pollutant build-up within the stable air mass.
High temperatures and clear skies ensured that abundant sunlight was available for the photochemical reactions necessary to produce high ozone concentrations. Lower wind speeds permitted significant accumulation of ozone and its precursors, resulting in lower dispersion rates. The consistent beginning of the ozone growth starting from 6 a.m., during both the high and low ozone events, was a result of the early morning peak traffic hours in the region.
The results of this study demonstrate the importance of continuous boundary layer monitoring in the ELP–CDJ region. This can be achieved using aerosol backscattered profiles from a compact and lightweight remote sensing instrument, such as a ceilometer, and modelling simulations using HYSPLIT (with WRF as input) and WRF. The present study provides a better understanding of the aerosol transport, especially during the synoptic scale frontal passages. The contribution of the PBL, winds, and synoptic scale meteorology on the build-up of ozone and aerosol concentrations in the ELP–CDJ region was successfully demonstrated and constitutes a major achievement of this study.

Author Contributions

Conceptualization: N.N.K.; data curation: S.M.; formal analysis: R.K.S., R.M.F. and W.R.S.; funding acquisition: R.M.F.; investigation: N.N.K.; methodology: N.N.K. and S.M.; resources: S.M., R.K.S., R.M.F., V.R.M. and W.R.S.; software: N.N.K. and S.M; supervision: R.K.S., R.M.F., V.R.M. and W.R.S.; validation: R.K.S., R.M.F. and W.R.S. visualization: N.N.K. and R.K.S.; writing—original draft: N.N.K.; writing—review and editing: R.K.S., R.M.F. and W.R.S. All authors have read and agreed to the published version of the manuscript.

Funding

This research was funded by the NOAA Center for Atmospheric Science—Meteorology (NCAS-M), which is funded by the National Atmospheric Administration/Educational Partnership Program under Cooperative Agreement #NA16SEC4810006.

Acknowledgments

The authors wish to thank Eddie Moderow, Fernando Mercado, Erick Gribbin, and Patty de la Cruzfor both their intellectual and financial support. The authors want to especially thank Belay Demoz for his research suggestions used in the ceilometer network and Garry Morris and Paul Walter for 2017 ozone campaign data.

Conflicts of Interest

The authors declare no conflict of interest. The funders had no role in the design of the study; in the collection, analyses, or interpretation of data; in the writing of the manuscript, or in the decision to publish the results”.

References

  1. Stewart, D.R.; Saunders, E.; A Perea, R.; Fitzgerald, R.; E Campbell, D.; Stockwell, W.R. Linking Air Quality and Human Health Effects Models: An Application to the Los Angeles Air Basin. Environ. Health Insights 2017, 11, 1178630217737551. [Google Scholar] [CrossRef] [PubMed] [Green Version]
  2. Pearson, R.; Fitzgerald, R. Application of a Wind Model for the El Paso-Juarez Airshed. J. Air Waste Manag. Assoc. 2001, 51, 1096–2247. [Google Scholar] [CrossRef] [PubMed]
  3. Shi, C.; Fernando, H.J.S.; Yang, J. Contributors to ozone episodes in three U.S./Mexico border twin-cities. Sci. Total Environ. 2009, 407, 5128–5138. [Google Scholar] [CrossRef]
  4. Medina, R.; Fitzgerald, R.; Min, Q. Retrieval of the single scattering albedo in the El Paso-Juarez Airshed using the TUV model and a UV-MFRSR radiometer. Atmos. Environ. 2012, 46, 430–440. [Google Scholar] [CrossRef]
  5. Macdonald, C.P.; Roberts, P.T.; Main, H.H.; Dye, T.S.; Coe, D.L.; Yarbrough, J. The 1996 Paso del Norte Ozone Study: Analysis of meteorological and air quality data that influence local ozone concentrations. Sci. Total. Environ. 2001, 276, 93–109. [Google Scholar] [CrossRef]
  6. Stockwell, W.R.; Lawson, C.V.; Saunders, E.; Goliff, W.S. A Review of Tropospheric Atmospheric Chemistry and Gas-Phase Chemical Mechanisms for Air Quality Modeling. Atmosphere (Basel) 2011, 3, 1–32. [Google Scholar] [CrossRef] [Green Version]
  7. Stewart, D.; Saunders, E.; Perea, R.; Fitzgerald, R.; Campbell, D.E.; Stockwell, W.R. Projected changes in particulate matter concentrations in the South Coast Air Basin due to basin-wide reductions in nitrogen oxides, volatile organic compounds, and ammonia emissions. J. Air Waste Manag. Assoc. 2018, 69, 192–208. [Google Scholar] [CrossRef]
  8. Stockwell, W.R.; Saunders, E.; Goliff, W.S.; Fitzgerald, R.M. A perspective on the development of gas-phase chemical mechanisms for Eulerian air quality models. J. Air Waste Manag. Assoc. 2019, 70, 44–70. [Google Scholar] [CrossRef]
  9. Goliff, W.S.; Luria, M.; Blake, D.R.; Zielinska, B.; Hallar, A.G.; Valente, R.J.; Lawson, C.V.; Stockwell, W.R. Nighttime air quality under desert conditions. Atmos. Environ. 2015, 114, 102–111. [Google Scholar] [CrossRef] [Green Version]
  10. Kim, D.; Loughner, C.; Wetzel, M.A.; Goliff, W.S.; Stockwell, W.R. A comparison of photolysis rate parameters estimated from measured and simulated actinic flux for wintertime conditions at Storm Peak Laboratory, Colorado. J. Atmos. Chem. 2007, 57, 59–71. [Google Scholar] [CrossRef]
  11. Saylor, R.D. An estimate of the potential significance of heterogeneous loss to aerosols as an additional sink for hydroperoxy radicals in the troposphere. Atmospheric Environ. 1997, 31, 3653–3658. [Google Scholar] [CrossRef]
  12. Emeis, S. Analytical Description and Vertical Structure of the Atmospheric Boundary Layer. Air-Sea Exch. Phys. Chem. Dyn. 2011, 40, 9–32. [Google Scholar]
  13. Athanassiadis, G.A.; Rao, S.; Ku, J.-Y.; Clark, R.D. Boundary Layer Evolution and its Influence on Ground-Level Ozone Concentrations. Environ. Fluid Mech. 2002, 2, 339–357. [Google Scholar] [CrossRef]
  14. Brown, M.J.; Muller, C.; Wang, G.; Costigan, K. Meteorological simulations of boundary-layer structure during the 1996 Paso del Norte Ozone Study. Sci. Total. Environ. 2001, 276, 111–133. [Google Scholar] [CrossRef]
  15. Lu, D.; Reddy, R.S.; Fitzgerald, R.; Stockwell, W.R.; Williams, Q.L.; Tchounwou, P.B. Sensitivity Modeling Study for an Ozone Occurrence during the 1996 Paso Del Norte Ozone Campaign. Int. J. Environ. Res. Public Health 2008, 5, 181–203. [Google Scholar] [CrossRef] [PubMed]
  16. Stockwell, W.R.; Fitzgerald, R.; Lu, D.; Perea, R. Differences in the variability of measured and simulated tropospheric ozone mixing ratios over the Paso del Norte Region. J. Atmos. Chem. 2013, 70, 91–104. [Google Scholar] [CrossRef]
  17. Hicks, M.; Sakai, R.; Joseph, E. The Evaluation of a New Method to Detect Mixing Layer Heights Using Lidar Observations. J. Atmos. Ocean. Technol. 2015, 32, 2041–2051. [Google Scholar] [CrossRef]
  18. Karle, N.; Mahmud, S.; Fitzgerald, R.M.; Sakai, R.K.; Stockwell, W.R.; Demoz, B.B.; Morris, V.R. Analysis of Regional Meteorology During the Ozone Episodes in the El Paso—Juarez Airshed in the Summer of 2017. In Proceedings of the 99th American Meteorological Society Annual Meeting, Boston, MA, USA, 7 January 2019. [Google Scholar]
  19. Karle, N.; Mahmud, S.; Villalobos, C.; Labrado, N.; Fitzgerald, R.; Sakai, R.; Morris, V. Study of the Urban Heat Island and its Effect on the Planetary Boundary Layer for the El Paso-Juarez Airshed. AGUFM 2017, 2017. [Google Scholar] [CrossRef]
  20. Mahmud, S.; Wangchuk, P.; Fitzgerald, R.; Stockwell, W. Study of Photolysis Rate Coefficients to Improve Air Quality Models. Bull. Am. Phys. Soc. 2016, 61, 15. [Google Scholar]
  21. Münkel, C.; Eresmaa, N.; Räsänen, J.; Karppinen, A. Retrieval of mixing height and dust concentration with lidar ceilometer. Boundary-Layer Meteorol. 2007, 124, 117–128. [Google Scholar] [CrossRef]
  22. Tsaknakis, G.; Papayannis, A.D.; Mamouri, R.E. Atmospheric Measurement Techniques Inter-comparison of lidar and ceilometer retrievals for aerosol and Planetary Boundary Layer profiling over Athens, Greece. Atmos. Meas. Tech. 2011, 4, 1261–1273. [Google Scholar] [CrossRef] [Green Version]
  23. Compton, J.C.; Delgado, R.; Berkoff, T.A.; Hoff, R. Determination of planetary boundary layer height on short spatial and temporal scales: A demonstration of the covariance wavelet transform in ground-based wind profiler and lidar measurements. J. Atmospheric Ocean. Technol. 2013, 30, 1566–1575. [Google Scholar] [CrossRef]
  24. Hong, S.-Y.; Pan, H.-L. Nonlocal Boundary Layer Vertical Diffusion in a Medium-Range Forecast Model. Mon. Weather Rev. 1996, 124, 2322–2339. [Google Scholar] [CrossRef] [Green Version]
  25. Hong, S.-Y.; Noh, Y.; Dudhia, J. A New Vertical Diffusion Package with an Explicit Treatment of Entrainment Processes. Mon. Weather. Rev. 2006, 134, 2318–2341. [Google Scholar] [CrossRef] [Green Version]
  26. Mahmud, S.; Bhuiyan, A.M.; Sarmin, N.; Elahee, S. Study of wind speed and relative humidity using stochastic technique in a semi-arid climate region. AIMS Environ. Sci. 2020, 7, 156–173. [Google Scholar] [CrossRef]
  27. Hu, X.M.; Nielsen-Gammon, J.W.; Zhang, F. Evaluation of three planetary boundary layer schemes in the WRF model. J. Appl. Meteorol. Climatol. J. Appl. Meteorol. Clim. 2010, 49, 1831–1844. [Google Scholar] [CrossRef] [Green Version]
  28. Hong, S.-Y.; Dudhia, J.; Chen, S.-H. A Revised Approach to Ice Microphysical Processes for the Bulk Parameterization of Clouds and Precipitation. Mon. Weather Rev. 2004, 132, 103–120. [Google Scholar] [CrossRef]
  29. Tewari, M.; Chen, F.; Wang, W.; Dudhia, J.; Lemone, M.A.; Mitchell, K.E. Implementation and verification of the unified Noah land-surface model in the WRF model [presentation]. In Proceedings of the 20th Conference on Weather Analysis and Forecasting/16th Conference on Numerical Weather Prediction, Seattle, WA, USA, 11 January 2004. [Google Scholar]
  30. Monin, A.S.; Obukhov, A.M. Basic laws of turbulent mixing in the surface layer of the atmosphere. Contrib. Geophys. Inst. Slovak Acad. Sci. 1954, 24, 163–187. [Google Scholar]
  31. Kain, J.S.; Kain, J.S. The Kain–Fritsch Convective Parameterization: An Update. J. Appl. Meteorol. 2004, 43, 170–181. [Google Scholar] [CrossRef] [Green Version]
  32. Rolph, G.; Stein, A.; Stunder, B. Real-time Environmental Applications and Display sYstem: READY. Environ. Model. Softw. 2017, 95, 210–228. [Google Scholar] [CrossRef]
  33. Koracin, D.; Vellore, R.; Lowenthal, D.H.; Watson, J.; Koracin, J.; Mccord, T.; Dubois, D.; Chen, L.-W.A.; Kumar, N.; Knipping, E.M.; et al. Regional Source Identification Using Lagrangian Stochastic Particle Dispersion and HYSPLIT Backward-Trajectory Models. J. Air Waste Manag. Assoc. 2011, 61, 660–672. [Google Scholar] [CrossRef] [PubMed]
  34. Mukerjee, S.; Smith, L.A.; Norris, G.A.; Morandi, M.T.; Gonzales, M.; Noble, C.A.; Neas, L.M.; Özkaynak, A.H. Field Method Comparison between Passive Air Samplers and Continuous Monitors for VOCs and NO 2 in. J. Air Waste Manag. Assoc. 2004, 54, 307–319. [Google Scholar] [CrossRef] [PubMed]
  35. Whiteman, C.D.; Hoch, S.; Horel, J.D.; Charland, A. Relationship between particulate air pollution and meteorological variables in Utah’s Salt Lake Valley. Atmos. Environ. 2014, 94, 742–753. [Google Scholar] [CrossRef]
  36. Einfeld, W.; Church, H. Winter Season Air Pollution in El Paso-Ciudad Juarez. A Review of Air Pollution Studies in an International Airshed; Sandia National Laboratories: Albuquerque, NM, USA; Livermore, CA, USA, 1995. [Google Scholar]
  37. Calvert, J.; Orlando, J.; Stockwell, W.; Wallington, T. The Mechanisms of Reactions Influencing Atmospheric Ozone; Oxford University Press: New York, NY, USA, 2015. [Google Scholar]
  38. Fujita, E.M.; Campbell, D.E.; Stockwell, W.R.; Lawson, D.R. Past and future ozone trends in California’s South Coast Air Basin: Reconciliation of ambient measurements with past and projected emission inventories. J. Air Waste Manag. Assoc. 2013, 63, 54–69. [Google Scholar] [CrossRef]
  39. Wilczak, J.M.; Djalalova, I.; McKeen, S.; Bianco, L.; Bao, J.-W.; Grell, G.; Peckham, S.; Mathur, R.; McQueen, J.; Lee, P. Analysis of regional meteorology and surface ozone during the TexAQS II field program and an evaluation of the NMM-CMAQ and WRF-Chem air quality models. J. Geophys. Res. Space Phys. 2009, 114, D7. [Google Scholar] [CrossRef] [Green Version]
  40. Parsons, D.B.; Shapiro, M.; Hardesty, R.M.; Zamora, R.J.; Intrieri, J. The Finescale Structure of a West Texas Dryline. Mon. Weather Rev. 1991, 119, 1242–1258. [Google Scholar] [CrossRef] [Green Version]
  41. Hu, X.-M.; Klein, P.; Xue, M. Evaluation of the updated YSU planetary boundary layer scheme within WRF for wind resource and air quality assessments. J. Geophys. Res. Atmos 2013, 118, 490–500. [Google Scholar] [CrossRef]
  42. Cuchiara, G.C.; Li, X.; Carvalho, J.; Rappenglück, B. Intercomparison of planetary boundary layer parameterization and its impacts on surface ozone concentration in the WRF/Chem model for a case study in Houston/Texas. Atmos. Environ. 2014, 96, 175–185. [Google Scholar] [CrossRef]
  43. Shen, L.; Mickley, L.J.; Gilleland, E. Impact of increasing heat waves on U.S. ozone episodes in the 2050s: Results from a multimodel analysis using extreme value theory. Geophys. Res. Lett. 2016, 43, 4017–4025. [Google Scholar] [CrossRef]
  44. Morris, G.A.; Ford, B.; Rappenglück, B.; Thompson, A.M.; Mefferd, A.; Ngan, F.; Lefer, B. An evaluation of the interaction of morning residual layer and afternoon mixed layer ozone in Houston using ozonesonde data. Atmos. Environ. 2010, 44, 4024–4034. [Google Scholar] [CrossRef]
  45. Caputi, D.J.; Faloona, I.C.; Trousdell, J.; Smoot, J.; Falk, N.; Conley, S. Residual layer ozone, mixing, and the nocturnal jet in California’s San Joaquin Valley. Atmos. Chem. Phys. 2019, 19, 4721–4740. [Google Scholar] [CrossRef] [Green Version]
  46. Banta, R.M.; Senff, C.J.; Alvarez, R.J.; Langford, A.O.; Parrish, D.D.; Trainer, M.; Darby, L.; Hardesty, R.M.; Lambeth, B.; Neuman, J.A. Dependence of daily peak O3 concentrations near Houston, Texas on environmental factors: Wind speed, temperature, and boundary-layer depth. Atmos. Environ. 2011, 45, 162–173. [Google Scholar] [CrossRef]
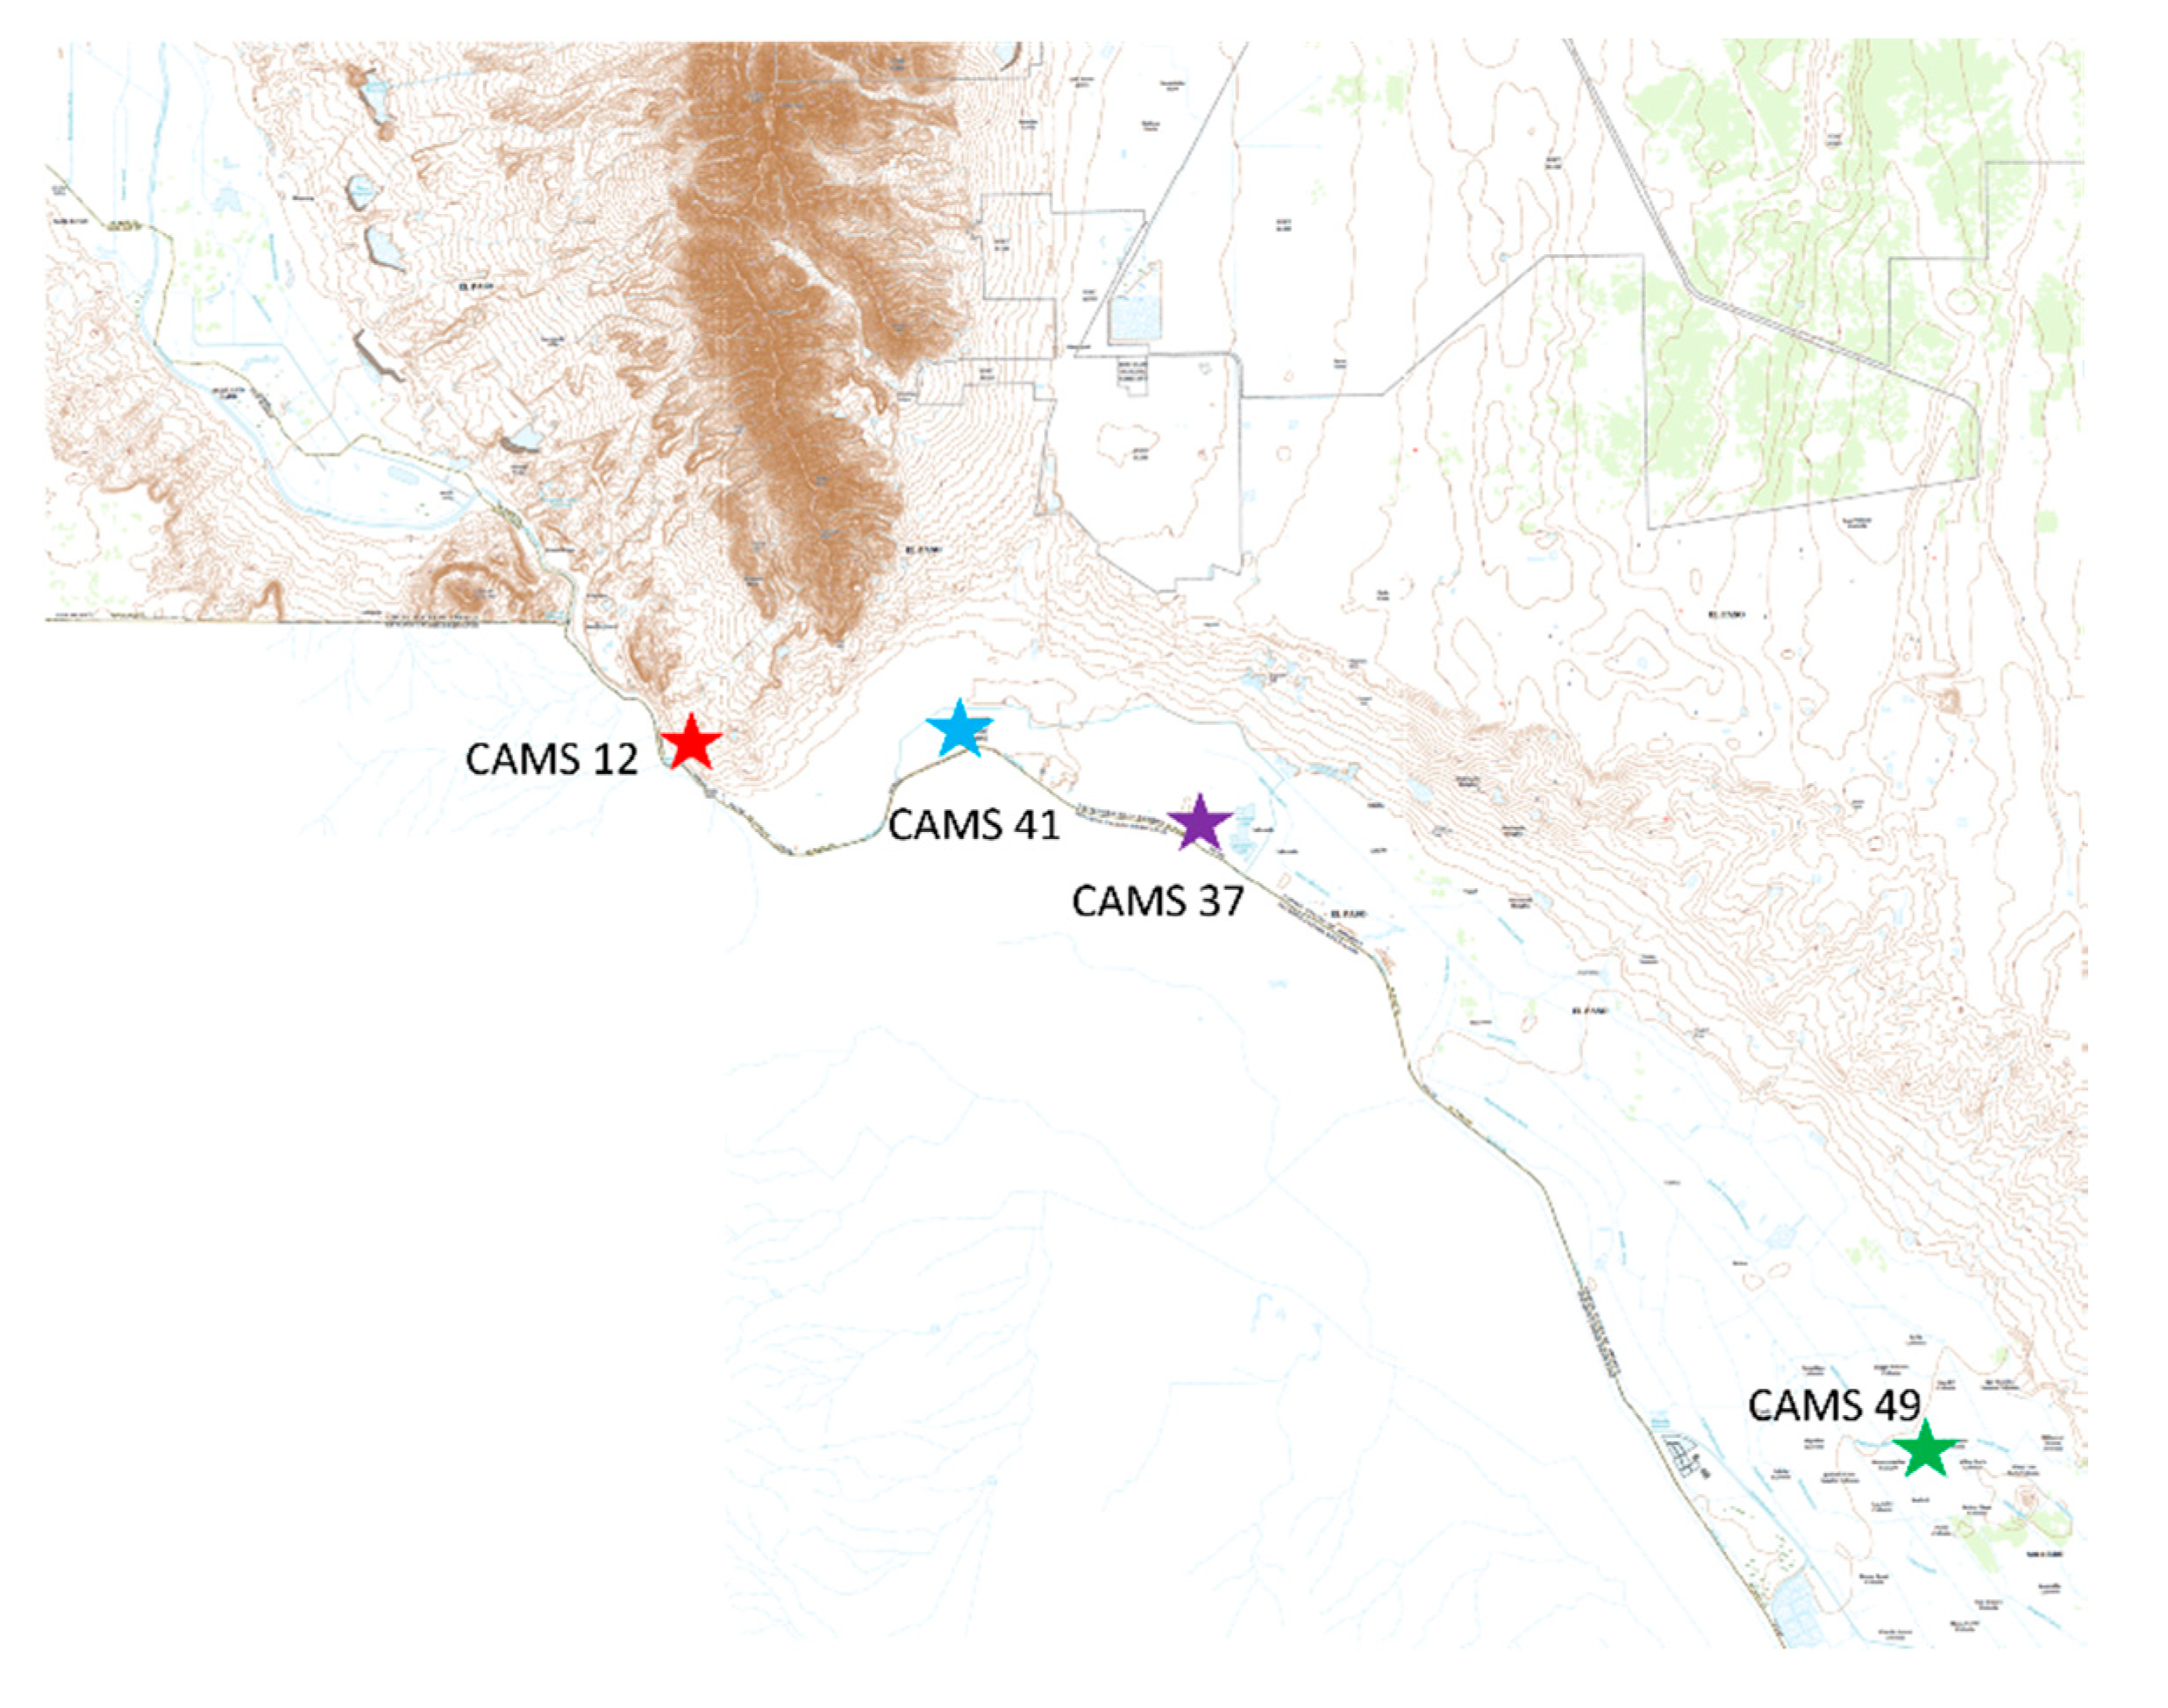
Figure 1. The geography of the El Paso region clearly showing apparent elevations in the downtown part and along the banks of the Rio Grande compared to the surroundings. Locations of the four major Texas Commission on Environmental Quality (TCEQ) Continuous Ambient Monitoring Stations (CAMS) sites used in this study. CAMS 12 and the ceilometer is at the University of Texas at El Paso (UTEP) (red), CAMS 41 at Chamizal Park (blue), CAMS 37 at Ascarate Lake (purple), and CAMS 49 at Socorro Hueco (green). Source: US Topo, USGS (www.usgs.gov/products/maps/topo-maps).
Atmosphere 11 00532 g001
Figure 2. The domain used for the Weather Research and forecasting (WRF) simulations, with outer domain d01 with a resolution of 36 km × 36 km; d02 with a resolution of 12 km × 12 km; and inner domain d03 with a resolution of 4 km × 4 km.
Atmosphere 11 00532 g002
Figure 3. Ozone concentrations (ppbv) for both the high and low ozone episodes for the city of El Paso (ELP). Source: TCEQ CAMS 12. Note: 4–7 June 2017 are high ozone days and 11–13 June 2017 are low ozone days.
Atmosphere 11 00532 g003
Figure 4. Heat deficit on high (5 June) and relatively low (6 June) ozone days for the ELP–CDJ region. The solid line with the filled circles is the heat deficit on the high ozone day of 5 June 2017 at around 1 p.m. The dashed line with the filled squares is the heat deficit on the low ozone day of 9 June 2017 at around 1 p.m.
Atmosphere 11 00532 g004
Figure 5. (a) PM2.5 concentrations and (b) PM10 concentrations during the high and low ozone episodes. Data obtained from TCEQ CAMS 12.
Atmosphere 11 00532 g005aAtmosphere 11 00532 g005b
Figure 6. Percent relative humidity (%RH) during the high and low ozone episodes for the city of ELP. Data obtained from TCEQ CAMS 12. In contrary to most of the observations in the past, %RH was higher during the high ozone days and lower during the low ozone days.
Atmosphere 11 00532 g006
Figure 7. (a) The nitrogen oxides (NOx) concentration plot, and (b) the total VOC concentrations for the high and low ozone episodes for the city of ELP. Data obtained from TCEQ CAMS 12 and CAMS 41, respectively.
Atmosphere 11 00532 g007aAtmosphere 11 00532 g007b
Figure 8. Wind roses for (a) 4 June, (b) 5 June, (c) 6 June, and (d) 7 June, providing details of the percentage (%) frequency of the wind speed from a direction as recorded at the TCEQ CAMS 12 (UTEP) during the successive high ozone episodes. Each color represents wind intensities as follows: navy blue: 12 and above m/s; violet: 9–12 m/s; purple: 7–9 m/s; magenta: 5–7 m/s; red: 3–5 m/s; orange: 2–3 m/s; amber: 1–2 m/s and yellow: 0.5–1 m/s.
Atmosphere 11 00532 g008aAtmosphere 11 00532 g008b
Figure 9. Wind roses for (a) 11 June, (b) 12 June, and (c) 13 June, providing details of the percentage (%) frequency of the wind speed from a direction as recorded at the TCEQ CAMS 12 (UTEP) during the back-to-back low ozone episodes. Each color represents wind intensities as follows: navy blue: 12 and above m/s; violet: 9–12 m/s; purple: 7–9 m/s; magenta: 5–7 m/s; red: 3–5 m/s; orange: 2–3 m/s; amber: 1–2 m/s and yellow: 0.5–1 m/s.
Atmosphere 11 00532 g009aAtmosphere 11 00532 g009b
Figure 10. Radar composite map of 4 June, with 12Z showing the presence of a high-pressure ridge on the northern part of Texas. Source: National Weather Service’s (NWS) Weather Prediction Center (WPC) Surface Analysis Archive.
Atmosphere 11 00532 g010
Figure 11. Satellite composite map of 10 June, with 09Z (left) and 12Z (right) showing the arrival and passage of a dryline through ELP region. Source: National Weather Service’s (NWS) Weather Prediction Center (WPC) Surface Analysis Archive.
Atmosphere 11 00532 g011
Figure 12. (a) WRF-generated planetary boundary layer height (PBLH) plots for high ozone days (4–7 June 2017) and low ozone days (11–13 June 2017) using the Yonsei University Scheme (YSU) scheme; (b) the PBLH in the early morning; and (c) the PBLH in the late evening.
Atmosphere 11 00532 g012
Figure 13. (a) Aerosol backscatter heatmap time series profile for the high ozone episode period. The black dots represent the cloud base detection, and the cyan dots are the aerosol mixing layer height estimated by BL-View; (b) for low ozone days. β represents the aerosol backscatter intensity.
Atmosphere 11 00532 g013
Table 1. WRF options used for the simulations.
Physics SchemeWRF OptionReferences
Planetary Boundary Layer (PBL)First Order Closure YSU (Yonsei University)[25]
MicrophysicsWRF Single-Moment (WSM)[28]
Land SurfaceNoah Land Surface[29]
Surface LayerMonin–Obukhov Similarity[30]
CumulusKain–Fritsch[31]
Table 2. The total number of annual high ozone episodes recorded at CAMS 12 (UTEP) and their monthly distribution as per the dates they occurred.
Year# of High Ozone EpisodesMarchAprilMayJuneJulyAugustSeptember
200023-2619–21, 28–301, 4, 7, 257, 9, 10, 18, 20, 281, 5, 19, 26, 273
2001112016-911, 254, 8, 19, 20, 255
200212-21, 22-1, 27, 293, 10, 213, 91, 2
200317---5, 14, 15, 181, 2, 4–6, 9, 13, 19, 21, 269, 106
200403----21, 304-
200519--16, 21, 2313, 14, 24, 298, 10, 14, 16, 1710, 15, 16, 25, 279, 22
200620---2–5, 12, 17, 18, 27, 29, 301, 3, 4, 10, 11, 23, 26, 2823, 27-
200711---2, 10, 15, 16, 21, 24, 28, 292, 3, 16--
200808---9, 14, 22-7, 8, 11, 195
200902----2410-
201005----13, 15, 1910, 20-
201103---4, 2220--
201210---28, 2912–144, 12, 21, 312
201306-282411317, 19-
201403---10, 2115--
201504---17, 21, 29-10-
201604---6, 23168-
201710---4–7, 2710, 2817, 2412
Table 3. Observed at CAMS 12, the high and low ozone episodes (as defined in Section 3.1) for the year 2017.
Month# High Ozone Days# Low Ozone Days
May-10
June54
July28
August211
September118
October-29
Table 4. Average VOC/NOx ratio for both high and low ozone episodes.
DaysVOC/Nitrogen Oxides
High Ozone
4 June1.36
5 June4.25
6 June4.39
7 June1.78
Low Ozone
11 June0.39
12 June0.31
13 June0.53
Table 5. The correlation coefficient (R) between the modeled PBLH (using WRF) and ozone concentrations and its precursors during the high and low ozone days.
DaysOzoneNOxTotal VOCs
High Ozone
4 June0.590.260.33
5 June0.480.300.49
6 June0.730.000.29
7 June0.570.010.05
Low Ozone
11 June0.680.460.34
12 June0.440.250.27
13 June0.300.160.32
Table 6. The correlation coefficient (R) between the modeled PBLH (using HYSPLIT) and ozone concentrations and its precursors during the high and low ozone days.
DaysOzoneNOxTotal VOCs
High Ozone
4 June0.400.120.11
5 June0.360.190.40
6 June0.420.020.51
7 June0.280.000.00
Low Ozone
11 June0.560.480.20
12 June0.450.250.23
13 June0.460.110.37