Article

Predictability of the Strong Ural blocking Event in January 2012 in the Subseasonal to Seasonal Models of Europe and Canada

1
School of Physical Science and Technology, Yangzhou University, Yangzhou 225000, China
2
School of Atmospheric Sciences, and Key Laboratory of Tropical Atmosphere-Ocean System, Ministry of Education, Sun Yat-sen University, Zhuhai 519082, China
3
Southern Marine Science and Engineering Guangdong Laboratory, Zhuhai 519082, China
4
School of Atmospheric Sciences, Lanzhou University, Lanzhou 730000, China
5
Laboratory for Climate Studies, National Climate Center, China Meteorological Administration, Beijing 100081, China
*
Authors to whom correspondence should be addressed.
Atmosphere 2020, 11(5), 538; https://doi.org/10.3390/atmos11050538
Submission received: 26 April 2020 / Revised: 16 May 2020 / Accepted: 19 May 2020 / Published: 22 May 2020

Abstract

:
The occurrence of a Ural blocking (UB) event is an important precursor of severe cold air outbreaks in Siberia and East Asia, and thus is significant to accurately predict UB events. Using subseasonal to seasonal (S2S) models of the European Centre for Medium-Range Weather Forecasts (ECMWF) and the Environment and Climate Change Canada (ECCC), we evaluated the predictability of a persistent UB event on 18 to 26 January 2012. Results showed that the ECCC model was superior to the ECMWF model in predicting the development stage of the UB event ten days in advance, while the ECMWF model had better predictions than the ECCC model for more than ten days in advance and the decaying stage of the UB event. By comparing the dynamic and thermodynamic evolution of the UB event predicted by the two models via the geostrophic vorticity tendency equation and temperature tendency equation, we found that the ECCC model better predicted the vertical vorticity advection, ageostrophic vorticity tendency, the tilting effect, horizontal temperature advection, and adiabatic heating during the development stage, whereas the ECMWF model better predicted the three dynamic and the two thermodynamic terms during the decaying stage. In addition, during both the development and decaying stages, the two models were good (bad) at predicting the vortex stretching term (horizontal vorticity advection), with the PCC between both the predictions and the observations larger (smaller) than +0.70 (+0.10) Thus, we suggest that the prediction of the persistent UB event in the S2S model might be improved by the better prediction of the horizontal vorticity advection.

Graphical Abstract

1. Introduction

Atmospheric blocking is a large-scale persistent high-pressure center of atmospheric circulation, which exerts a high impact on extreme weather events downstream and upstream of the blocking region. In the winter, the climatology of blocking frequency shows two peaks over the Euro-Atlantic and Pacific sectors [1,2]. In addition, the third peak of the frequency is located in the vicinity of the Ural Mountains (–60° E), which has a pronounced impact on East Asian winter monsoon activities [3,4,5,6,7]. As the occurrence of a Ural blocking (UB) event is crucial for reinforcing the Siberian high, the establishment of UB has been identified as an important precursor of cold air outbreaks in East Asia [8,9,10,11,12,13,14]. For instance, the long-lasting cold weather in Southern China in January 2008 was closely related to the persistent UB event [15,16,17,18]. On the other hand, UB is located in the downstream of North Atlantic storm tracks. When the North Atlantic storm track extends eastward to the European continent coupled with a high-pressure ridge over Europe, the wave-mean flow interaction associated with the storm track and the high-pressure ridge is crucial for the Rossby wave breaking and the establishment of UB [19,20,21]. The important role of UB on the cold event in East Asia highlights the demand for a better prediction of UB events.
Atmospheric blocking is a challenge to the short-term and medium-range weather forecasts. Systematic errors of dynamic models contribute to the errors of the blocking prediction [1,22,23,24,25]. The blocking frequency is always underestimated in climate models, including those participating in the Atmospheric Model Intercomparison Project and the Coupled Model Intercomparison Project [26,27,28,29,30]. For example, Jia et al. [31] evaluated the predictability of the wintertime blocking event in NCEP Climate Forecast System version 2 (CFSv2) and found that CFSv2 simulates the distribution of blocking in the Northern Hemisphere well, but it underestimates the blocking intensity and frequency. Moreover, CFSv2 predicts the development and decaying stages of the blocking events five days in advance well, and the forecasting skill of blocking events over the Pacific sector is higher than those over the Euro-Atlantic sector. Most of the previous studies focused on the blocking predictions over the Euro-Atlantic and Pacific sectors, but few studies focused on the predictions of UB. In addition to the evaluation of the predictability of the wintertime blocking frequency, it is also important to assess the performance of climate models in predicting persistent UB events.
In January–February of 2012, extremely cold weather occurred in Europe and large parts of Asia. The associated extremely low temperatures broke the historical records in parts of Europe and Siberia, which resulted in large property losses and casualty [32]. Specifically, the long-lasting severe cooling in East Asia from mid-January to early February in 2012 was closely tied to the frequent occurrence of persistent UB events [33,34], and thus, it is important to investigate the predictability of these persistent UB events. Considering that the World Weather Research Programme and the World Climate Research Programme launched the subseasonal to seasonal (S2S) project in November 2013, and established a database containing hindcasts up to 60 days forecasting from 11 meteorological centers [35], in this study we evaluate the predictability of the persistent UB event in January 2012 using the model outputs from the European Centre for Medium-Range Weather Forecasts (ECMWF) and the Environment and Climate Change Canada (ECCC) participating in the S2S project. As suggested by Quinting and Vitart [36], both models have a higher resolution and a better forecasting skill in predicting the UB events.

2. Data and Methods

2.1. Data

Daily fields of the ECMWF and ECCC predictions in the S2S Prediction Project Database were extracted. The ECMWF and ECCC models are selected for their highest resolution among the 11 S2S models, with the resolution of 0.25° × 0.25° within 10 days (0.5° × 0.5° after) and 0.45° × 0.45°, respectively. Both models are derived 24-hourly at 00 UTC and interpolated to a resolution of 1.5° × 1.5° in the S2S prediction project [35]. The observational datasets used for model verification were provided by the NCEP-NCAR reanalysis datasets (grid resolution 2.5° × 2.5°) [37]. The high-resolution rectilinear grids (ECMWF and ECCC) are interpolated to low-resolution rectilinear grids (NCEP-NCAR) with the area-weighted averaging interpolation. Variables include the 500 hPa geopotential height (Z500), the zonal mean wind (U), the meridional mean wind (V), and omega (ω). The 2011/2012 winter included three consecutive months from December 2011 to February 2012. We obtained 11 (4) members for the ECMWF (ECCC) model predictions initialized on 12 and 19 January 2012 with the forecast lead time of 47 (32) days. The ensemble-mean was taken as the unweighted averaged of 11 (4) members for the ECMWF (ECCC) model. The root-mean-square-difference (RMSE) and the pattern correlation coefficient (PCC) between the two predictions and the observations were used to evaluate the forecasting skills. Statistical significance was computed by the two-tailed Student’s t-test using the effective number of degrees of freedom, N e f f , which can be calculated by the following approximation [38,39]
1 N e f f 1 N + 2 N j = 1 N N j N ρ X X ( j ) ρ Y Y ( j )
where N is the sample size and ρ X X ( j ) and ρ Y Y ( j ) are the auto-correlations of two sampled time-series X and Y at time lag j, respectively.

2.2. Detection of Blocking

We followed the method proposed by Barriopedro et al. [40] to detect blocking events, and a brief description of this method is given below. Blocking is defined by the 500 hPa geopotential height. Blocking is typically composed of a low-pressure south at 40° N and a ridge near 60° N [41], associated with a negative geopotential height gradient at its northern part (ZGN) and a positive geopotential height gradient at its southern part (ZGS). The blocking center is a closed high, so its anomaly should be positive in sign. The following equations are used for each grid point to detect blocking:
Z G N ( λ ) = Z 500 ( λ ,   φ N ) Z 500 ( λ ,   φ 0 ) φ N φ 0 < 10 Z G S ( λ ) = Z 500 ( λ ,   φ 0 ) Z 500 ( λ ,   φ S ) φ 0 φ S < 0   Z 500 ( λ , φ 0 ) Z 500 ( λ ,   φ 0 ) ¯ > 0   ,
where
λ [ 0 , 357.5 ] φ N = 80 ° N + Δ φ 0 = 60 ° N + Δ φ S = 40 ° N + Δ Δ = 5 , 2.5 , 0 , 2.5 ,   or   5 .
We select 60° N as the central reference point ( φ 0 ) [41,42], 40° N as the southern reference point ( φ S ) and 80° N as the northern reference point ( φ N ) [1]. The position of the blocking center changes with geographic regions and seasons [2,43], so a 5° latitude fluctuation is used to overcome the disadvantage of this one-dimensional index [1]. When one of the latitude pairs of a grid point satisfies the three criteria simultaneously in Equation (2), the grid is considered as a blocked longitude.
Blocking is a large-scale system, so we require a blocking region with more than five consecutive blocked longitudes (i.e., >10° longitude) each day. Then, the longitudes at the easternmost and westernmost are recorded, and the longitudes between them were defined as the extension. The area-averaged Z500 of UB was regarded as the intensity. Following Tyrlis and Hoskins [44], daily storm tracks were defined as the root mean square value of the 2–6 day band pass-filtered eddy kinetic energy ( V V ) at 250 hPa [20,44]. The primes represent the departure from the climatological mean during the 1981–2010 period.

2.3. Diagnostic Equations

First, we use the temperature tendency equation to diagnose the thermal structures of UB. The equation is written as:
T t a = ( U T λ + V T φ ) b   W T θ θ p c   + Q ˙ C P d
where (a) is the temperature tendency, (b) is the horizontal temperature advection, (c) is the adiabatic heating term due to vertical motion, and (d) is the diabatic heating. Q ˙ is the diabatic heating rate per unit mass, C p is the specific heat at constant pressure (=1004 J·K−1·kg1), and θ is the potential temperature which is derived from T using Poisson’s equation.
We use the geostrophic vorticity tendency equation to diagnose the height structure of UB. The geostrophic vorticity tendency equation is expressed as:
ξ g t a = 1 r ( U ξ a cos φ λ + V ξ a φ ) b   ξ a r ( U cos φ λ + V φ ) c   1 r ( W cos φ λ V p W φ U p ) d W ξ a p e   ξ a g t f   + 1 r ( F φ F cos φ λ ) g
where (a) is the geostrophic vorticity tendency, (b) is the horizontal vorticity advection, (c) is the vortex stretching term, (d) is the tilting effect, (e) is the vertical vorticity advection, (f) is the ageostrophic vorticity tendency, and (g) is the frictional effect. ξ is vorticity, and r is the Earth’s radius. Subscripts ag, a, and g denotes the ageostrophic, absolute and geostrophic vorticity, respectively [37]. The partial derivatives in the λ , φ , and p directions are calculated through the 2nd-order centered finite difference method, and a one-sided finite difference method is used at both boundaries. Note that the frictional effect (term g) is negligibly small [45,46], and hence it is not considered in this study.

3. Simulation of the Evolution of UB Event

We defined UB when the blocking center was located between 30° E and 100° E [5]. The UB event was selected as the UB persisting for more than five consecutive days. Figure 1a shows the evolution of blocking regions over the Northern Hemisphere in January 2012 based on the observational datasets. Before 15 January, one weak UB event occurred from 6 to 9 January, with an extension of less than 20 longitudes. Afterward, blocking events occurred frequently near the Urals and the western Pacific. In particular, a strong UB event centered at 60° E was established on 18 January, and then slightly moved westward from 19 to 25 January, and finally decayed on 27 January. This strong UB event persisted for 9 days and was extended from 30 to 100° E, which induced the cold air outbreak and intense cooling in East Asia [33].
The storm tracks export warm eddies to the downstream, which modulates the establishment and maintenance of blocking [20,21,47]. To explore the possible roles of the storm tracks anomalies in this strong UB event, Figure 1b shows the evolution of the storm tracks anomalies over the Ural Mountains from December 2011 to February 2012. It was found that the establishment of this strong UB event was closely related to weakening (strengthening) of the storm tracks over 50–60° N (70–80° N) after mid-January, with values below −15 m2·s−2 (exceeding 30 m2·s−2) (Figure 1b).
Figure 2 compares the evolution of the UB event in model predictions to the observations, where Z500 anomalies are the departure from the 1981–2010 daily climatology (Figure 2a–c), and the Z500 biases are the difference between the two model predictions and observation (Figure 2e–l). On 14 January, a ridge began to develop over Ural Mountains, associated with a trough over Eastern Europe (Figure 2a). When the trough deepened, the Ural ridge amplified and extended northward, with a closed isoline of geopotential height on 18 January, indicating the establishment of an Ural blocking event (Figure 2b). Afterward, the trough moved eastward and weakened on 22 January (Figure 2c), which was accompanied by a slight westward shift of the UB event on 26 January (Figure 2d), and the UB event decayed on 27 January (Figure 1a). Considering the movement of the UB event, we focus on the blocking central region (50–65° N, 50–75° E) in our analysis. When the two models’ predictions initialized on 12 January are compared to the observations, although the Z500 biases are increasing as the damping of initial conditions, we find that their predicted Z500 pattern are comparable to the observations before the blocking establishment (Figure 2e–g,i–k). On 14 January, the PCC between the predictions of two models and the observations exceeded +0.98. Indeed, the predictions of the two models had some discrepancies. Whereas the ECCC model predicted the closed isoline of geopotential height well on 18 January (Figure 2j), which was consistent with the observations, the ECMWF model did not predict the establishment of a UB event. Therefore, the predictions of the establishment of the UB event by the ECCC model were better than the ECMWF model. During the decaying stage of the UB event on 26 January, on the other hand, the ECMWF model had a higher forecasting skill than the ECCC model, as evidenced by a significantly higher PCC and lower RMSE (Figure 2h vs. Figure 2l). The ECMWF model better predicted the decay of the UB event more than ten days in advance, although it had a lower prediction skill of the formation of the UB event.
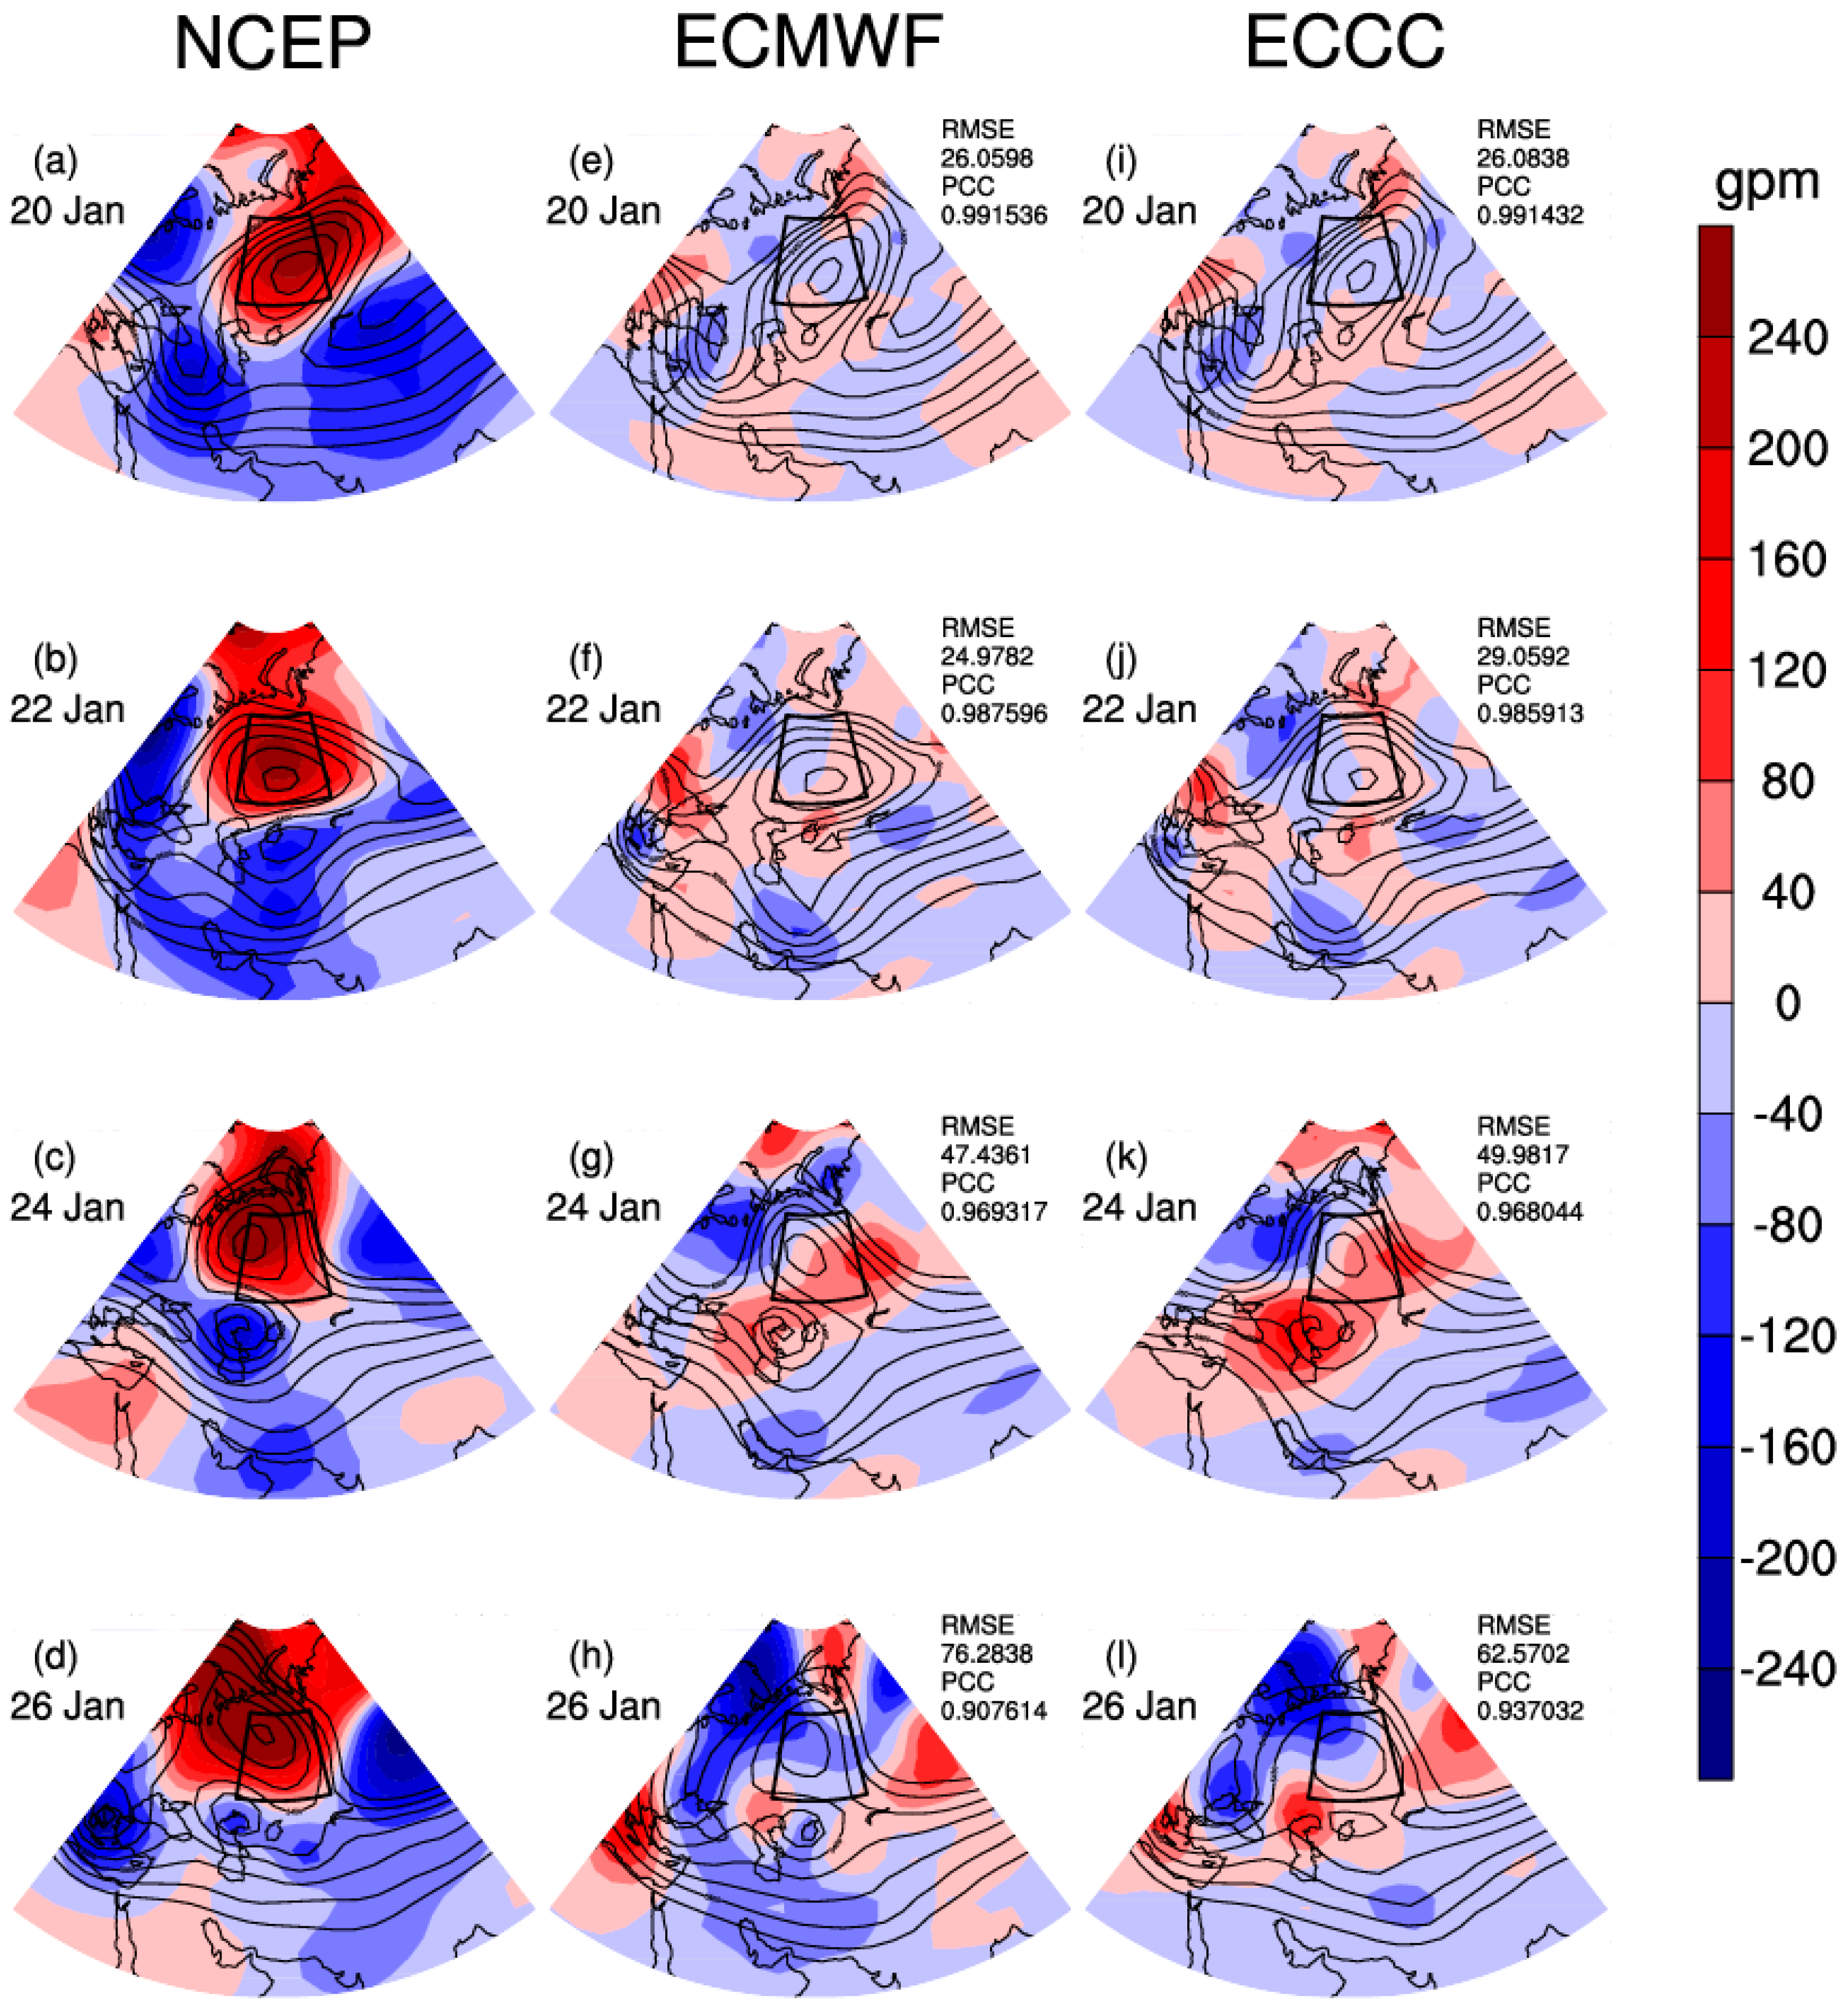
The forecasting skill significantly decreased with increasing lead time. Both predictions initialized on 12 January had large biases in predicting the UB event after 22 January (Figure 2h,l), so we further compared the predictions initialized on the 19 January and analyzed the prediction skill of the decaying stage of the UB event, as shown in Figure 3. On 20 and 22 January, predictions by the two models reproduced the persistence of the closed isoline of geopotential height, with the RMSE (PCC) smaller (larger) than 26 gpm (+0.98), indicating a strong resemblance to the observations (Figure 3e,f,i,j). Although the RMSE of their predictions was increased on 24 and 26 January, they predicted the persistence of the UB event with the PCC exceeding +0.90 (Figure 3g,k,h,l) well. Additionally, both models simulated the decay of the UB event from 24 to 26 January well, where the positive anomaly center on 26 January was weaker than that on 24 January (Figure 3g vs. Figure 3h; Figure 3k vs. Figure 3l); this was consistent with the observations (Figure 3c vs. Figure 3d). Overall, the predictions initialized on 12 January could simulate the establishment of the UB event, especially the ECCC model, and the ECMWF model performed better for more than ten days in advance. These predictions had large biases in simulating the decay of the UB event due to the long lead time. Such biases were greatly reduced by the predictions initialized on 19 January.

4. Characteristics and Dynamic–Thermodynamic Structure of UB Event

4.1. Characteristics

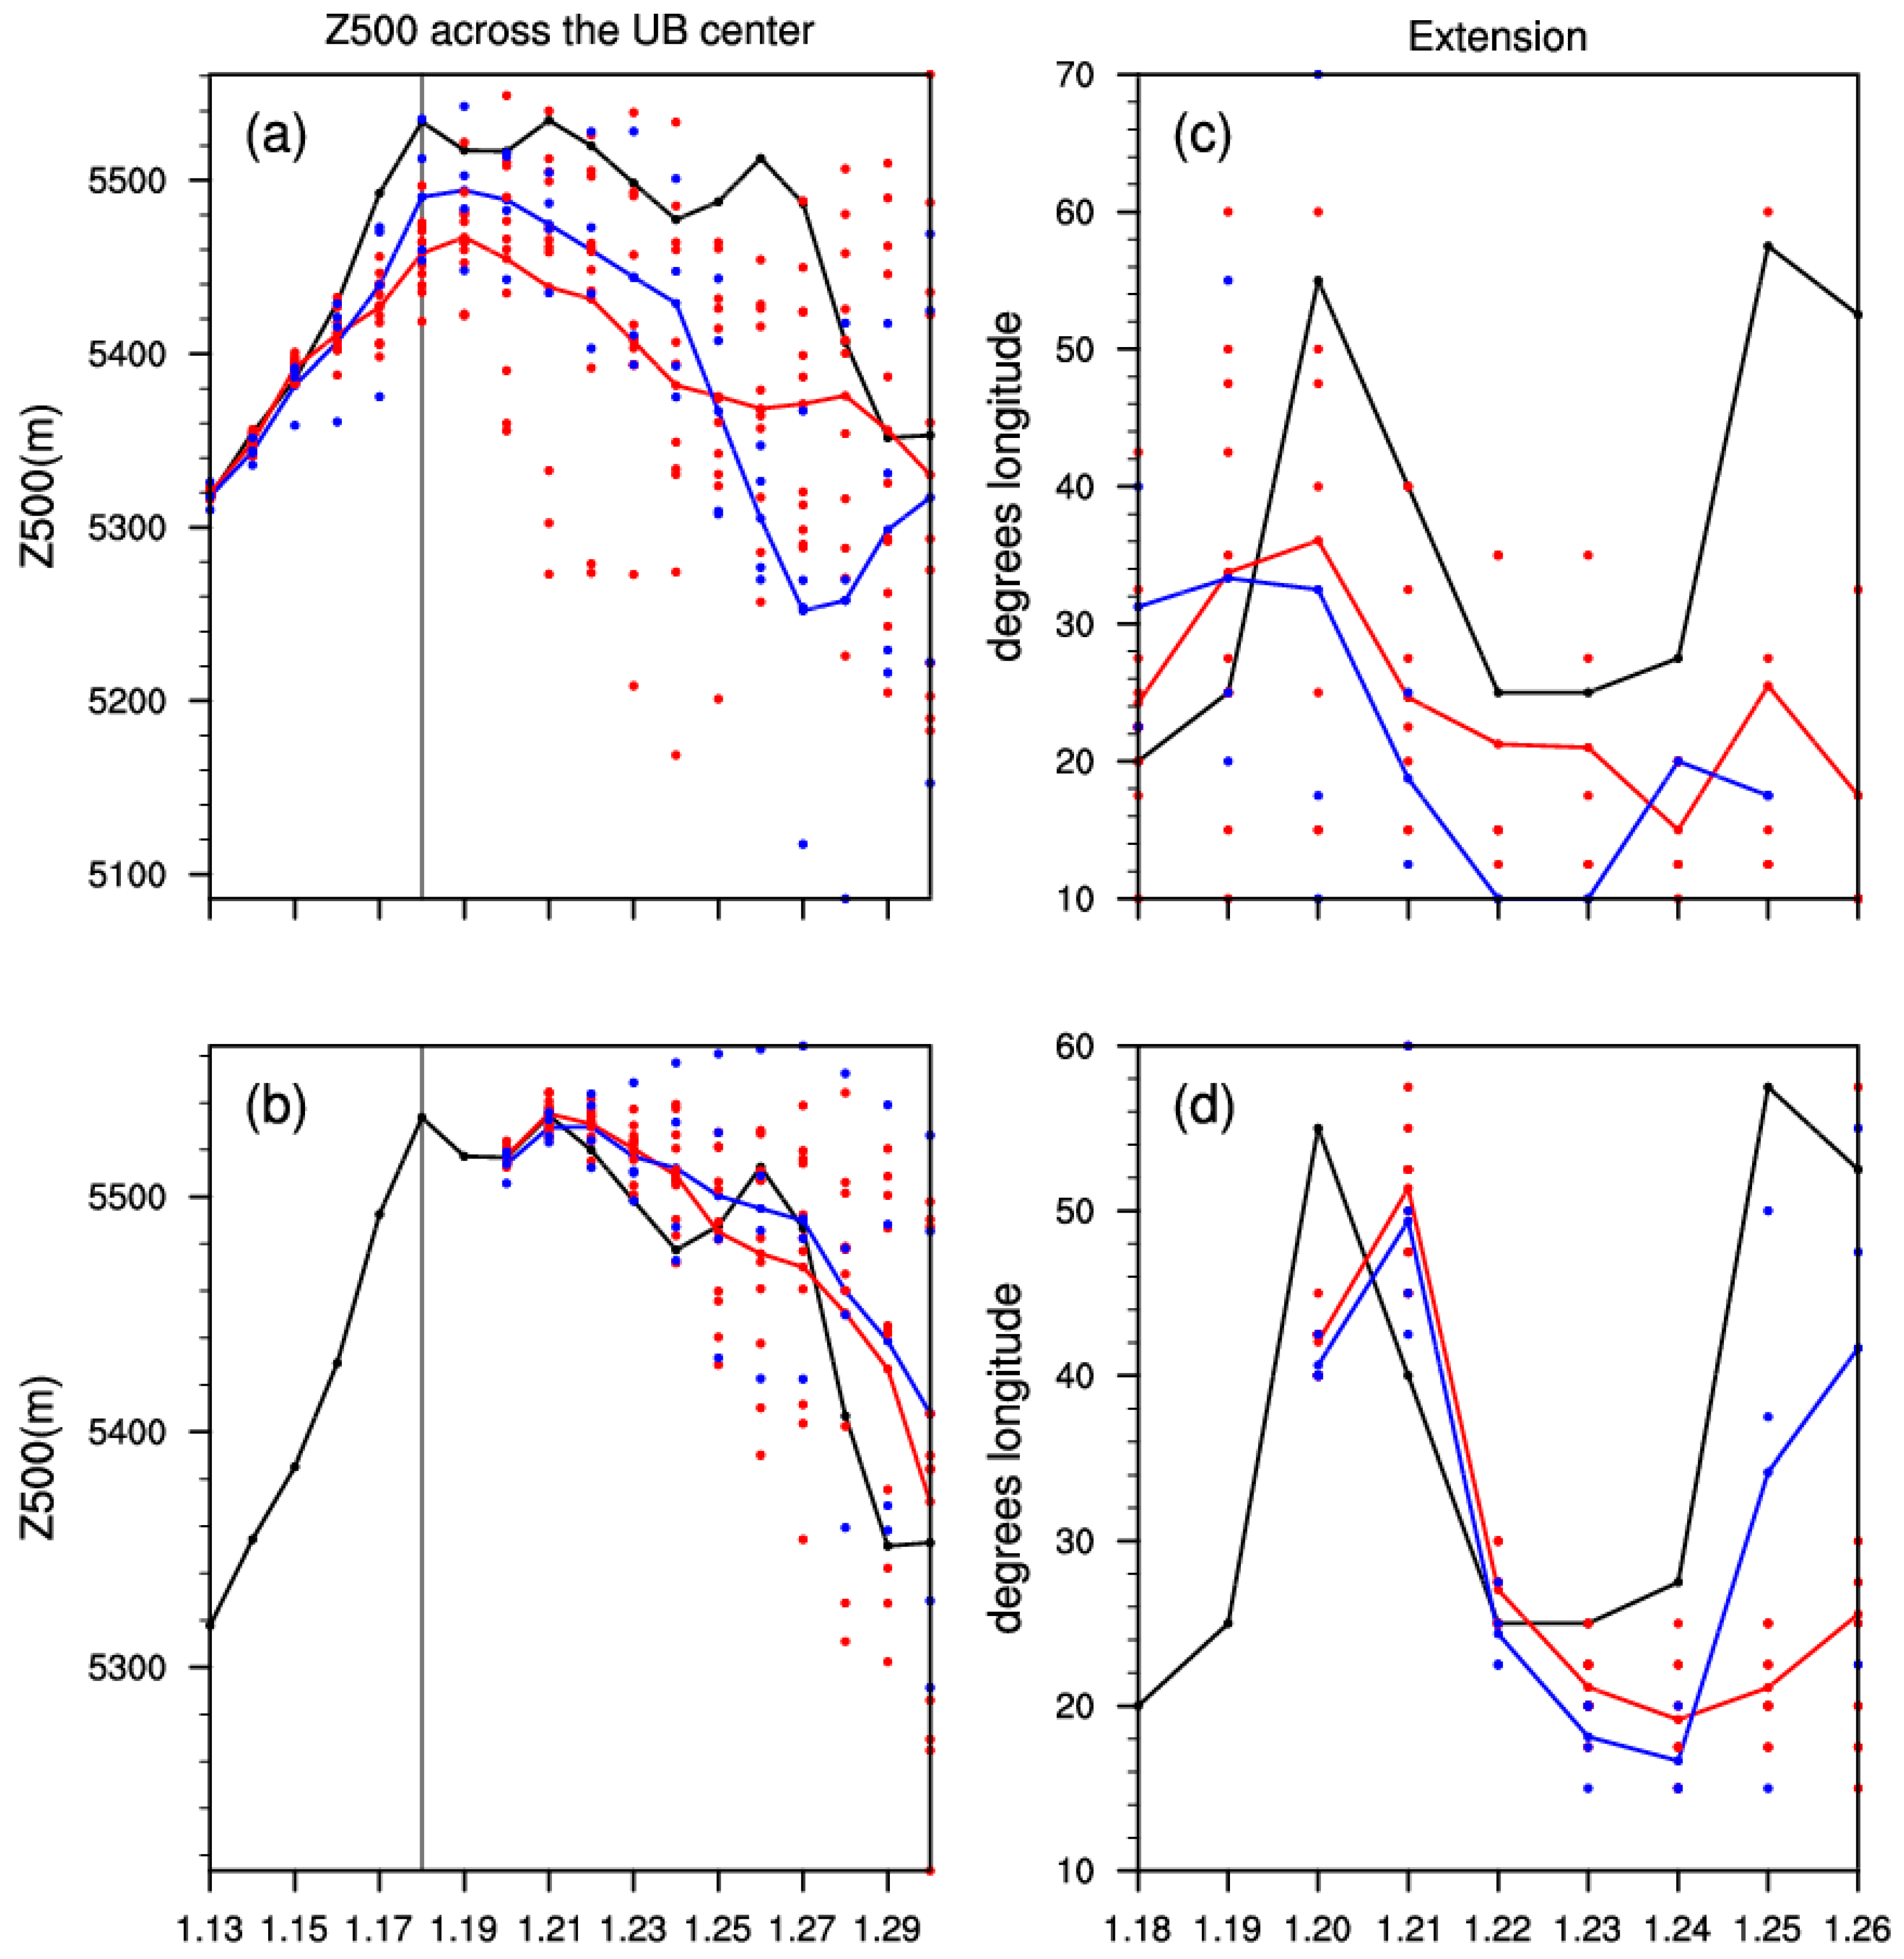
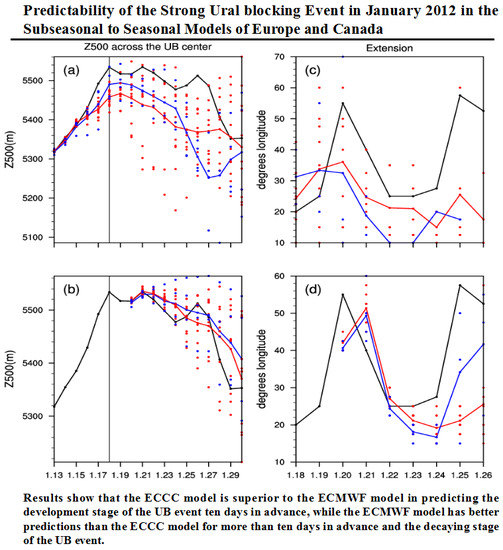
Different UB events have different intensities, extensions, and durations [5]. Figure 4 shows the intensity and extension of the UB event in January 2012. The observed UB intensity continuously increased from 13 January to the establishment of the UB event on 18 January. After 18 January, the UB intensity persisted and reached the peak on 21 January. Afterward, the intensity fluctuated between 22 and 25 January, and dramatically decreased after 26 January (Figure 4a,b). The evolution of the observed UB extension was similar to the observed UB intensity, except that the largest extension occurred on 20 January (Figure 4c,d). Because the intensity of the UB event was increasing from 20 to 21 January, we defined 21 January as the peak time of this UB event.
When the predictions initialized on 12 January were compared, the ECCC model was found to have a higher intensity that is closer to the observations than the ECMWF model before 18 January, suggesting that the ECCC model performs better during the development stage of the UB event. However, the predicted UB intensity decayed much faster in the ECCC model than the ECMWF model after 23 January, suggesting that the ECMWF model performed better for more than ten days in advance (Figure 4a). For the predictions initialized on January 19, both models accurately predicted the decrease in intensity since 21 January, where the ECMWF predictions were closer to observations, suggesting that the ECMWF model performed better during the decay of the UB event (Figure 4b). Furthermore, Figure 4c,d show the prediction of the UB extension by the two models initialized on 12 and 19 January. Compared to the ECCC model, the members of the ECMWF model initialized on 12 January completely cover the range of the observed UB extension (Figure 4c). For the predictions initialized on 19 January, although both models predict the extension during the decay of the UB event well, they predicted a peak on 21 January, which was one day later than the observations (Figure 4d). In summary, the ECCC model better predicted the development stage of the UB event, while the ECMWF model was superior to the ECCC model in predicting the decay of the UB event, especially the blocking intensity.

4.2. Dynamic and Thermodynamic Structure

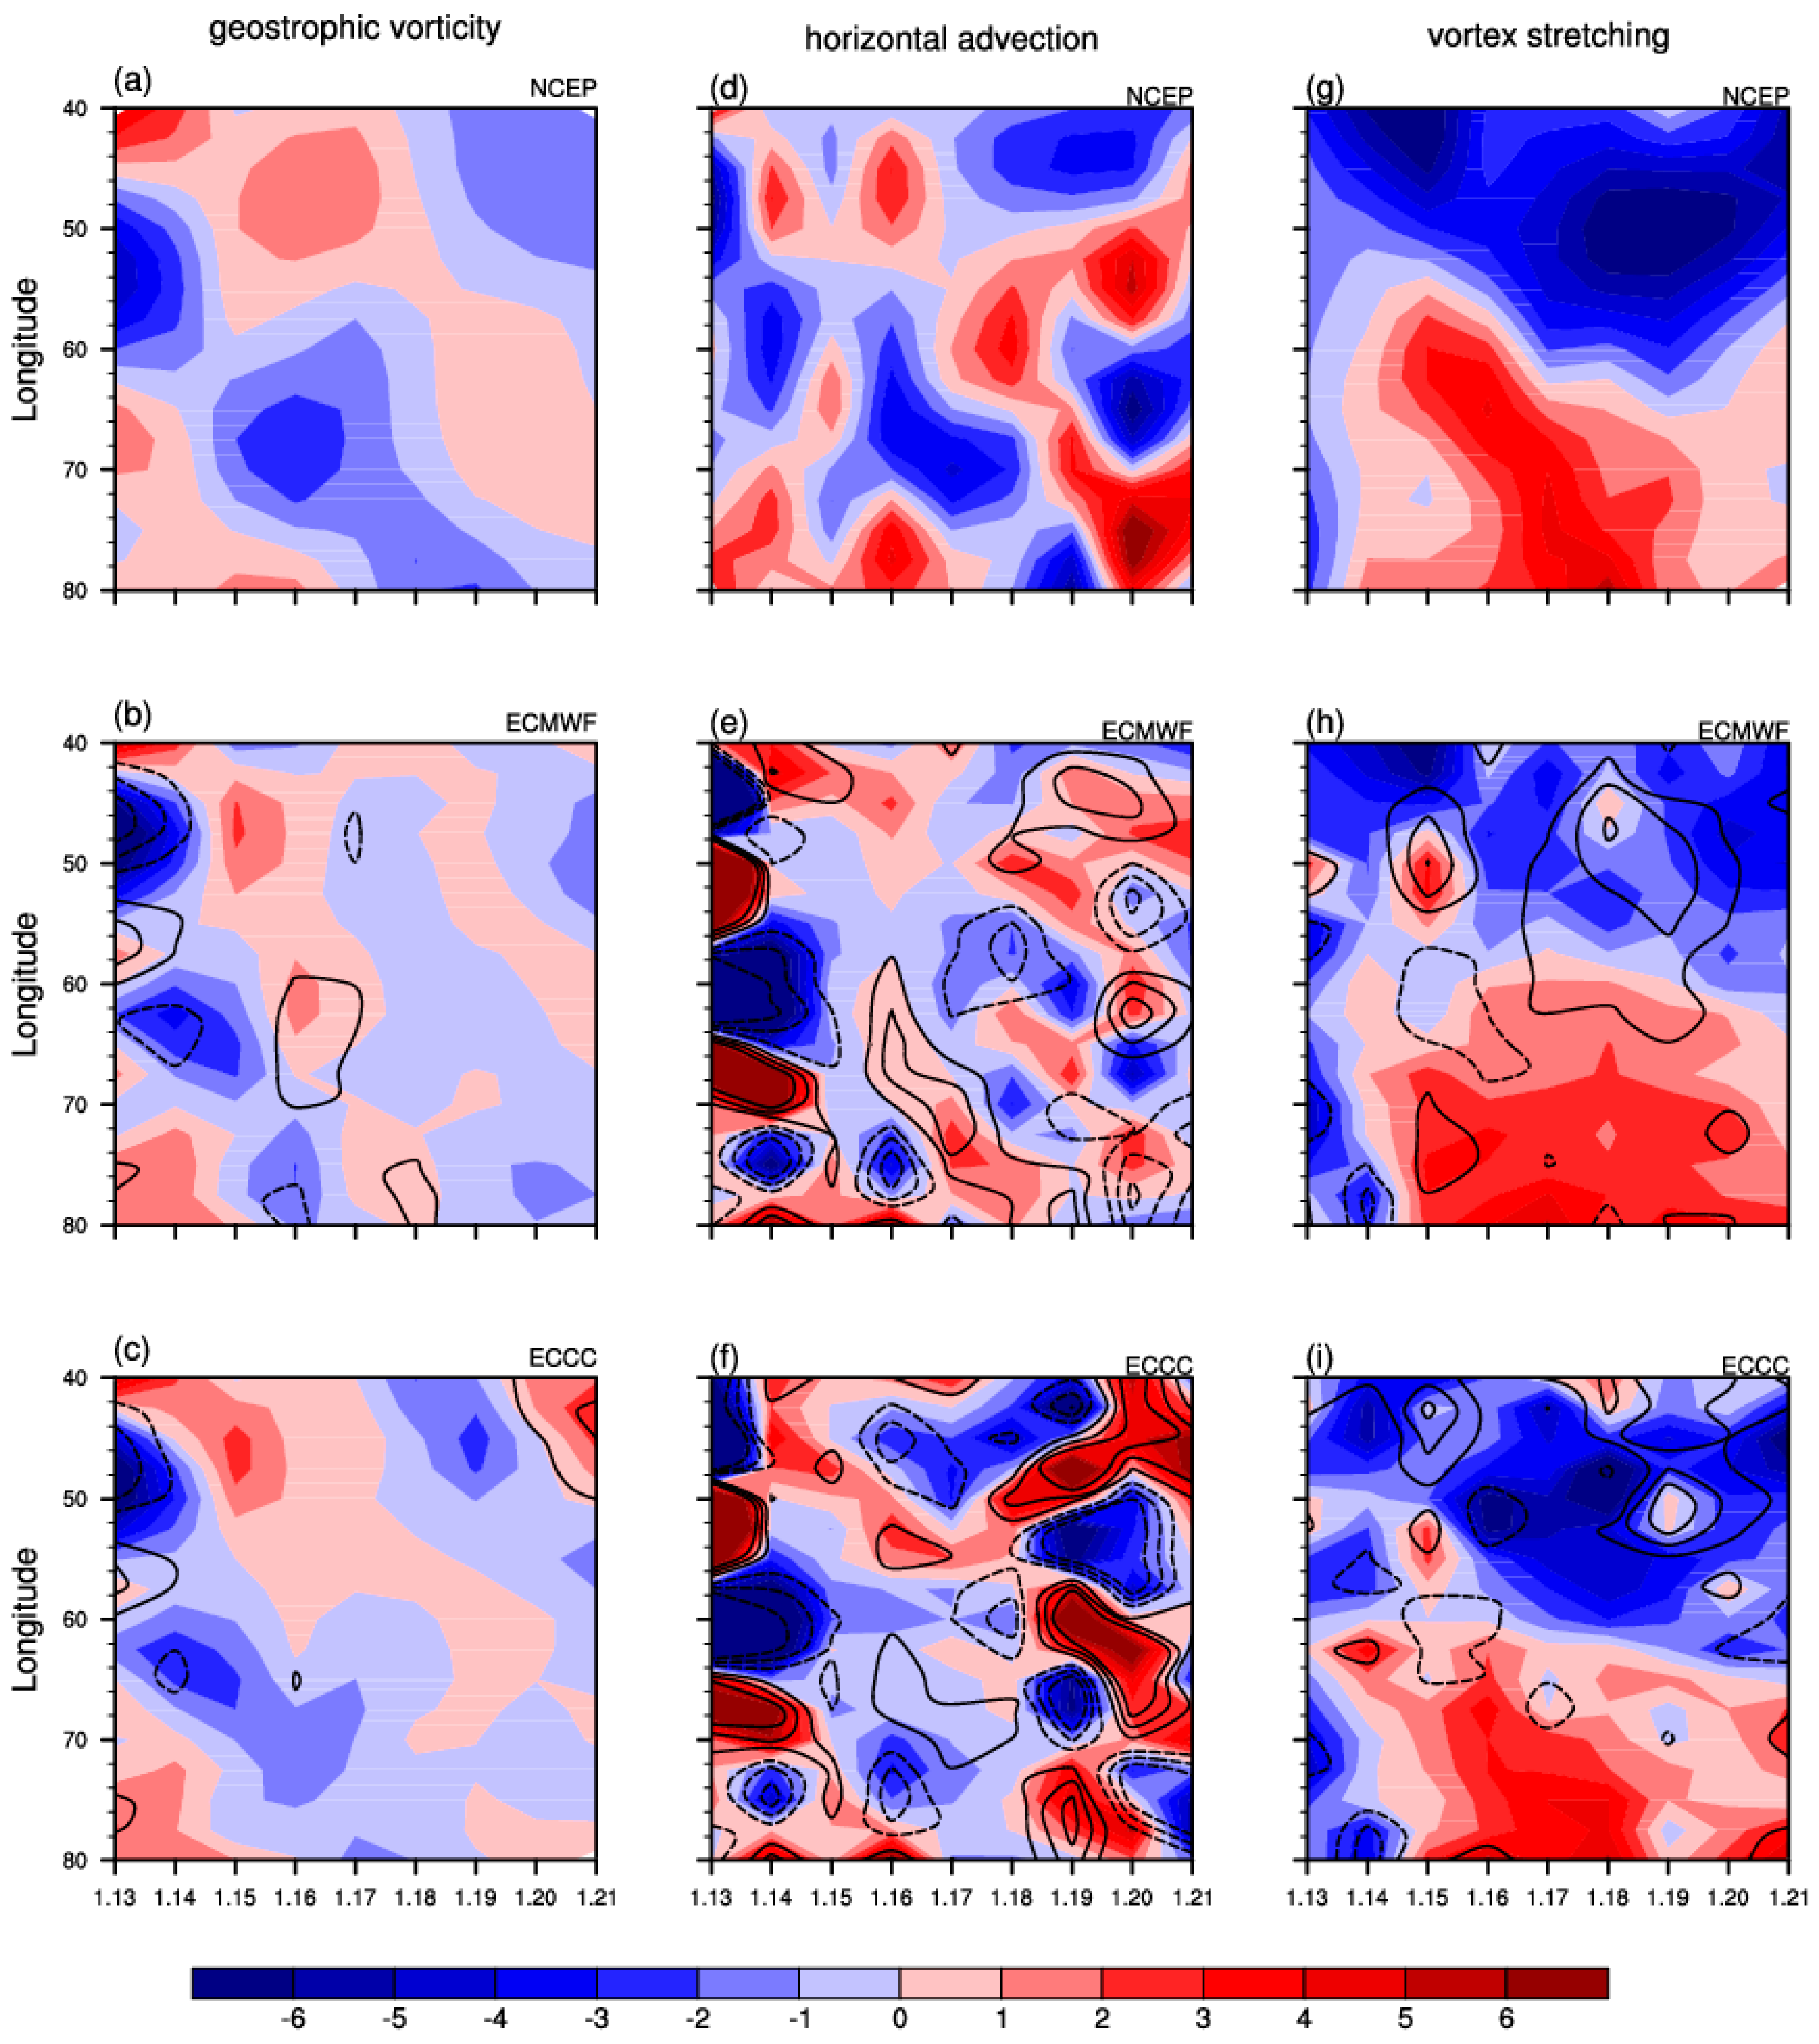
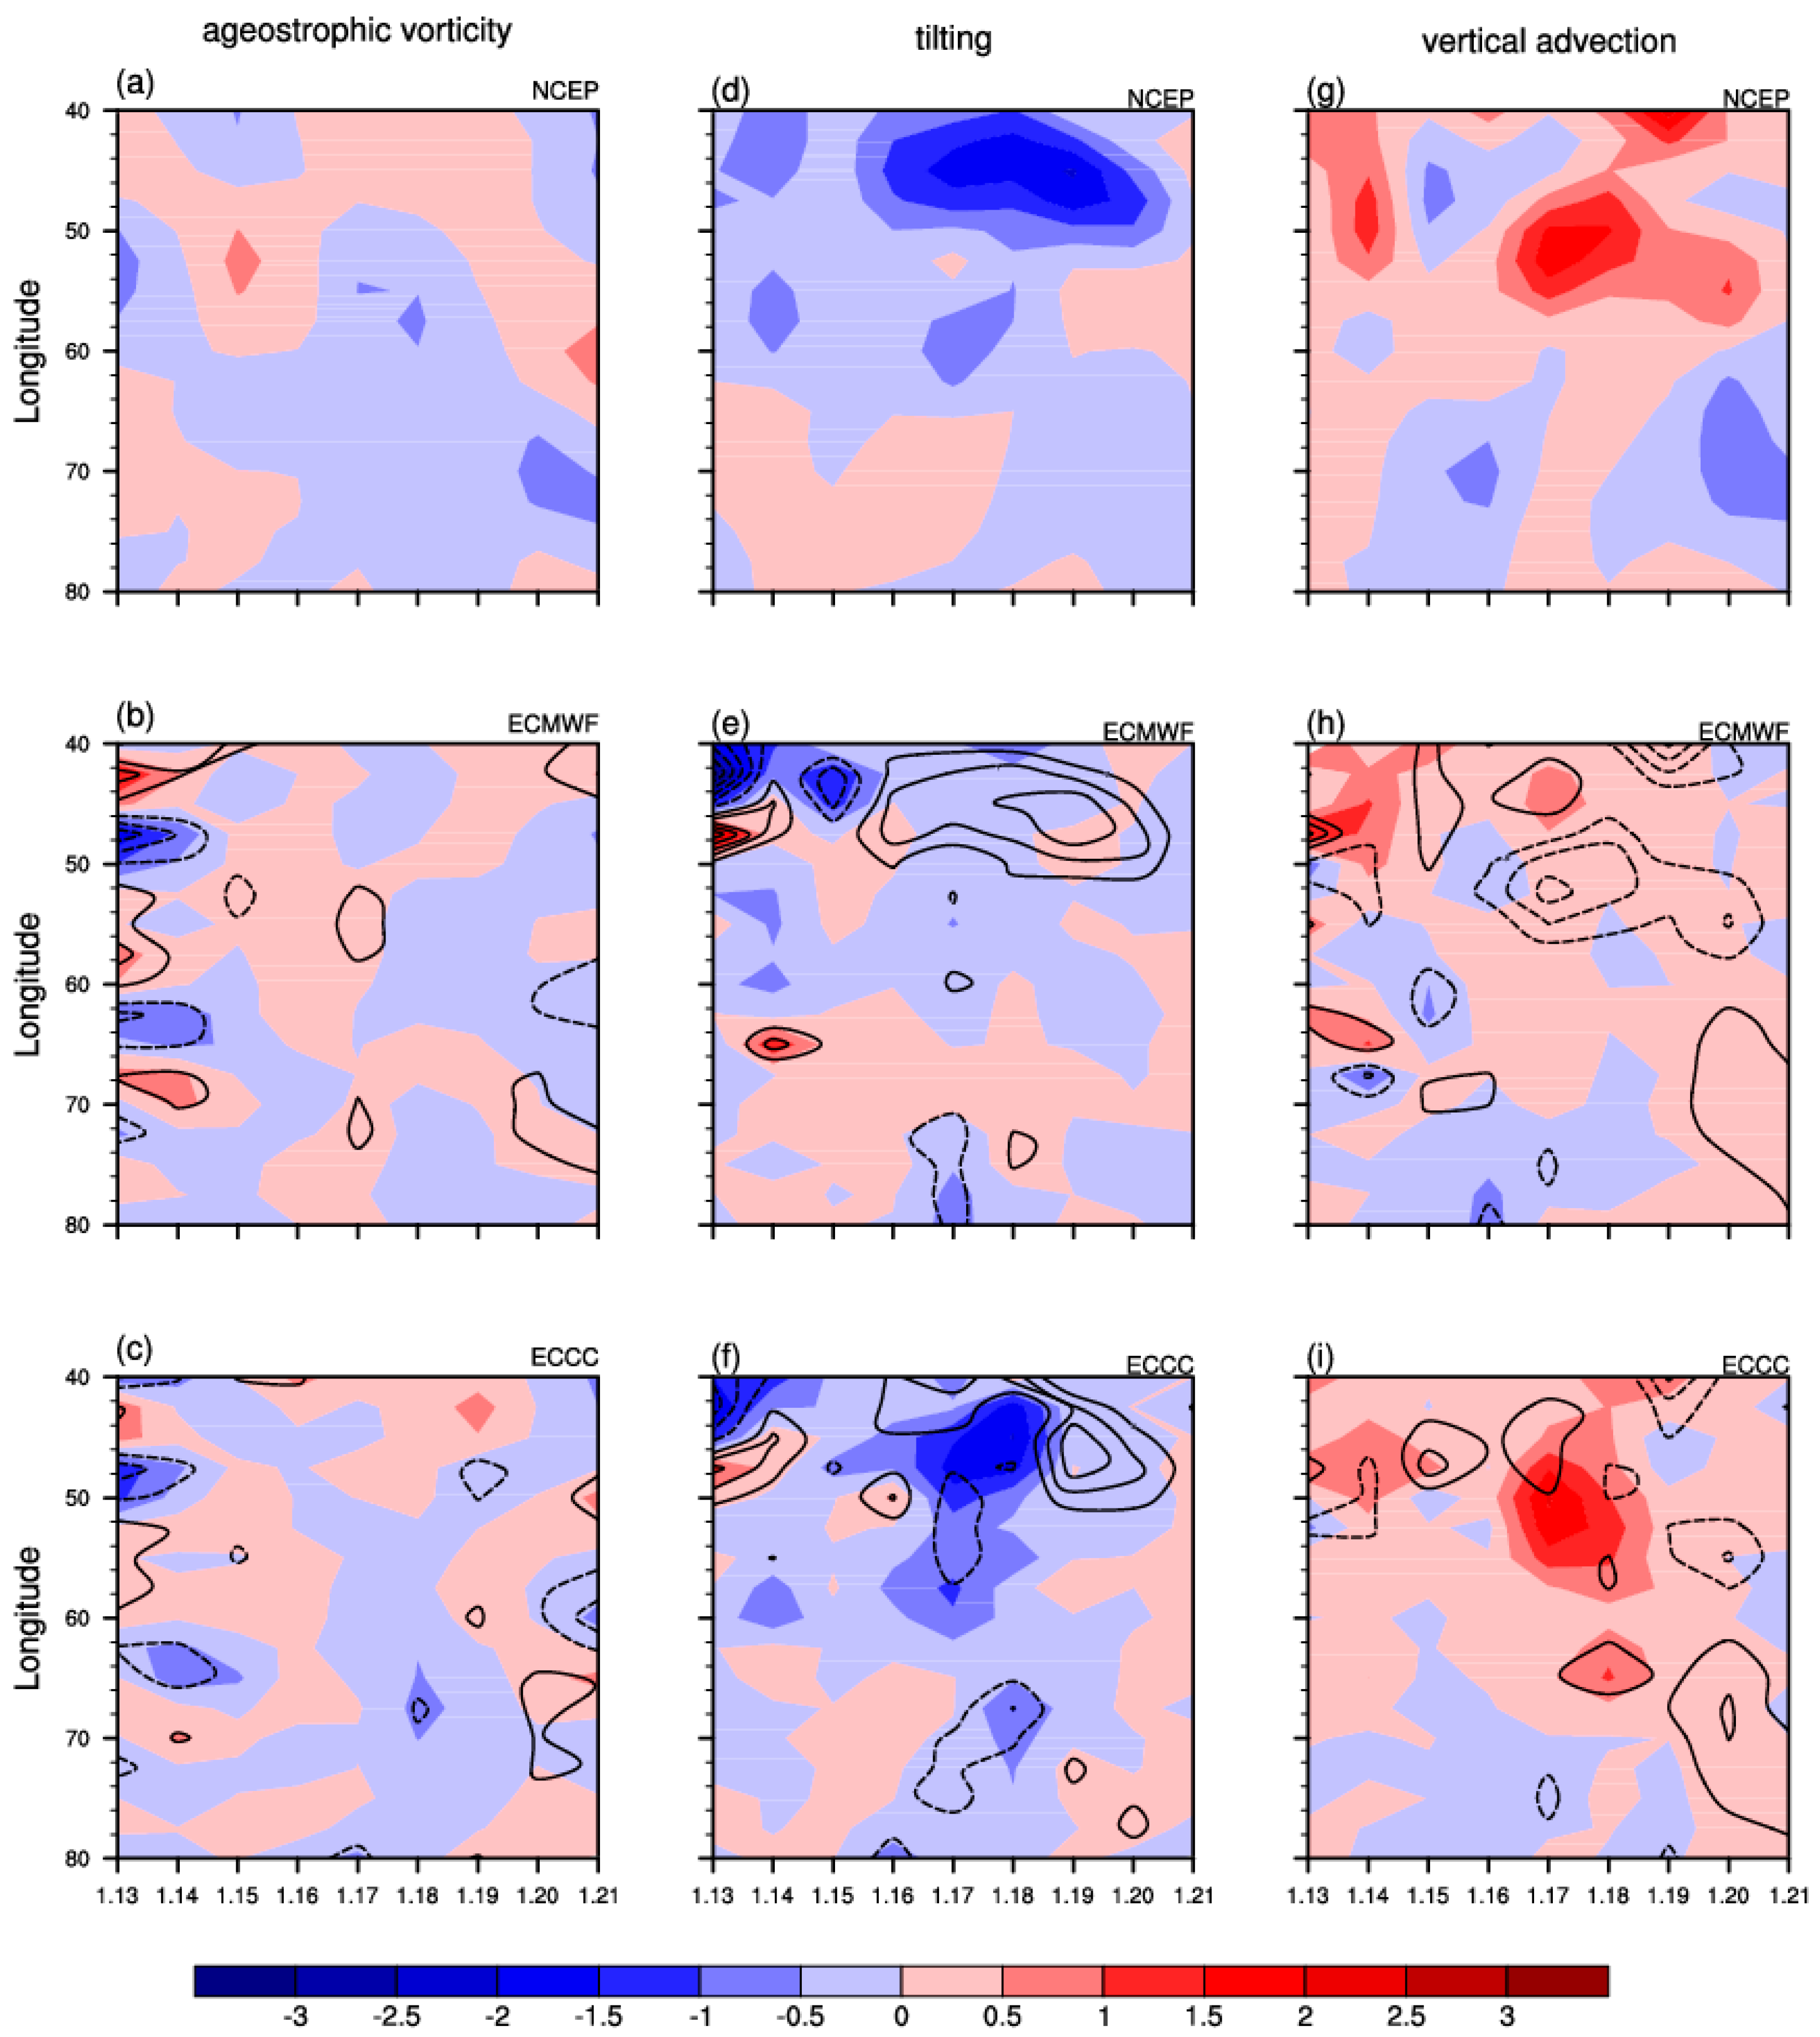
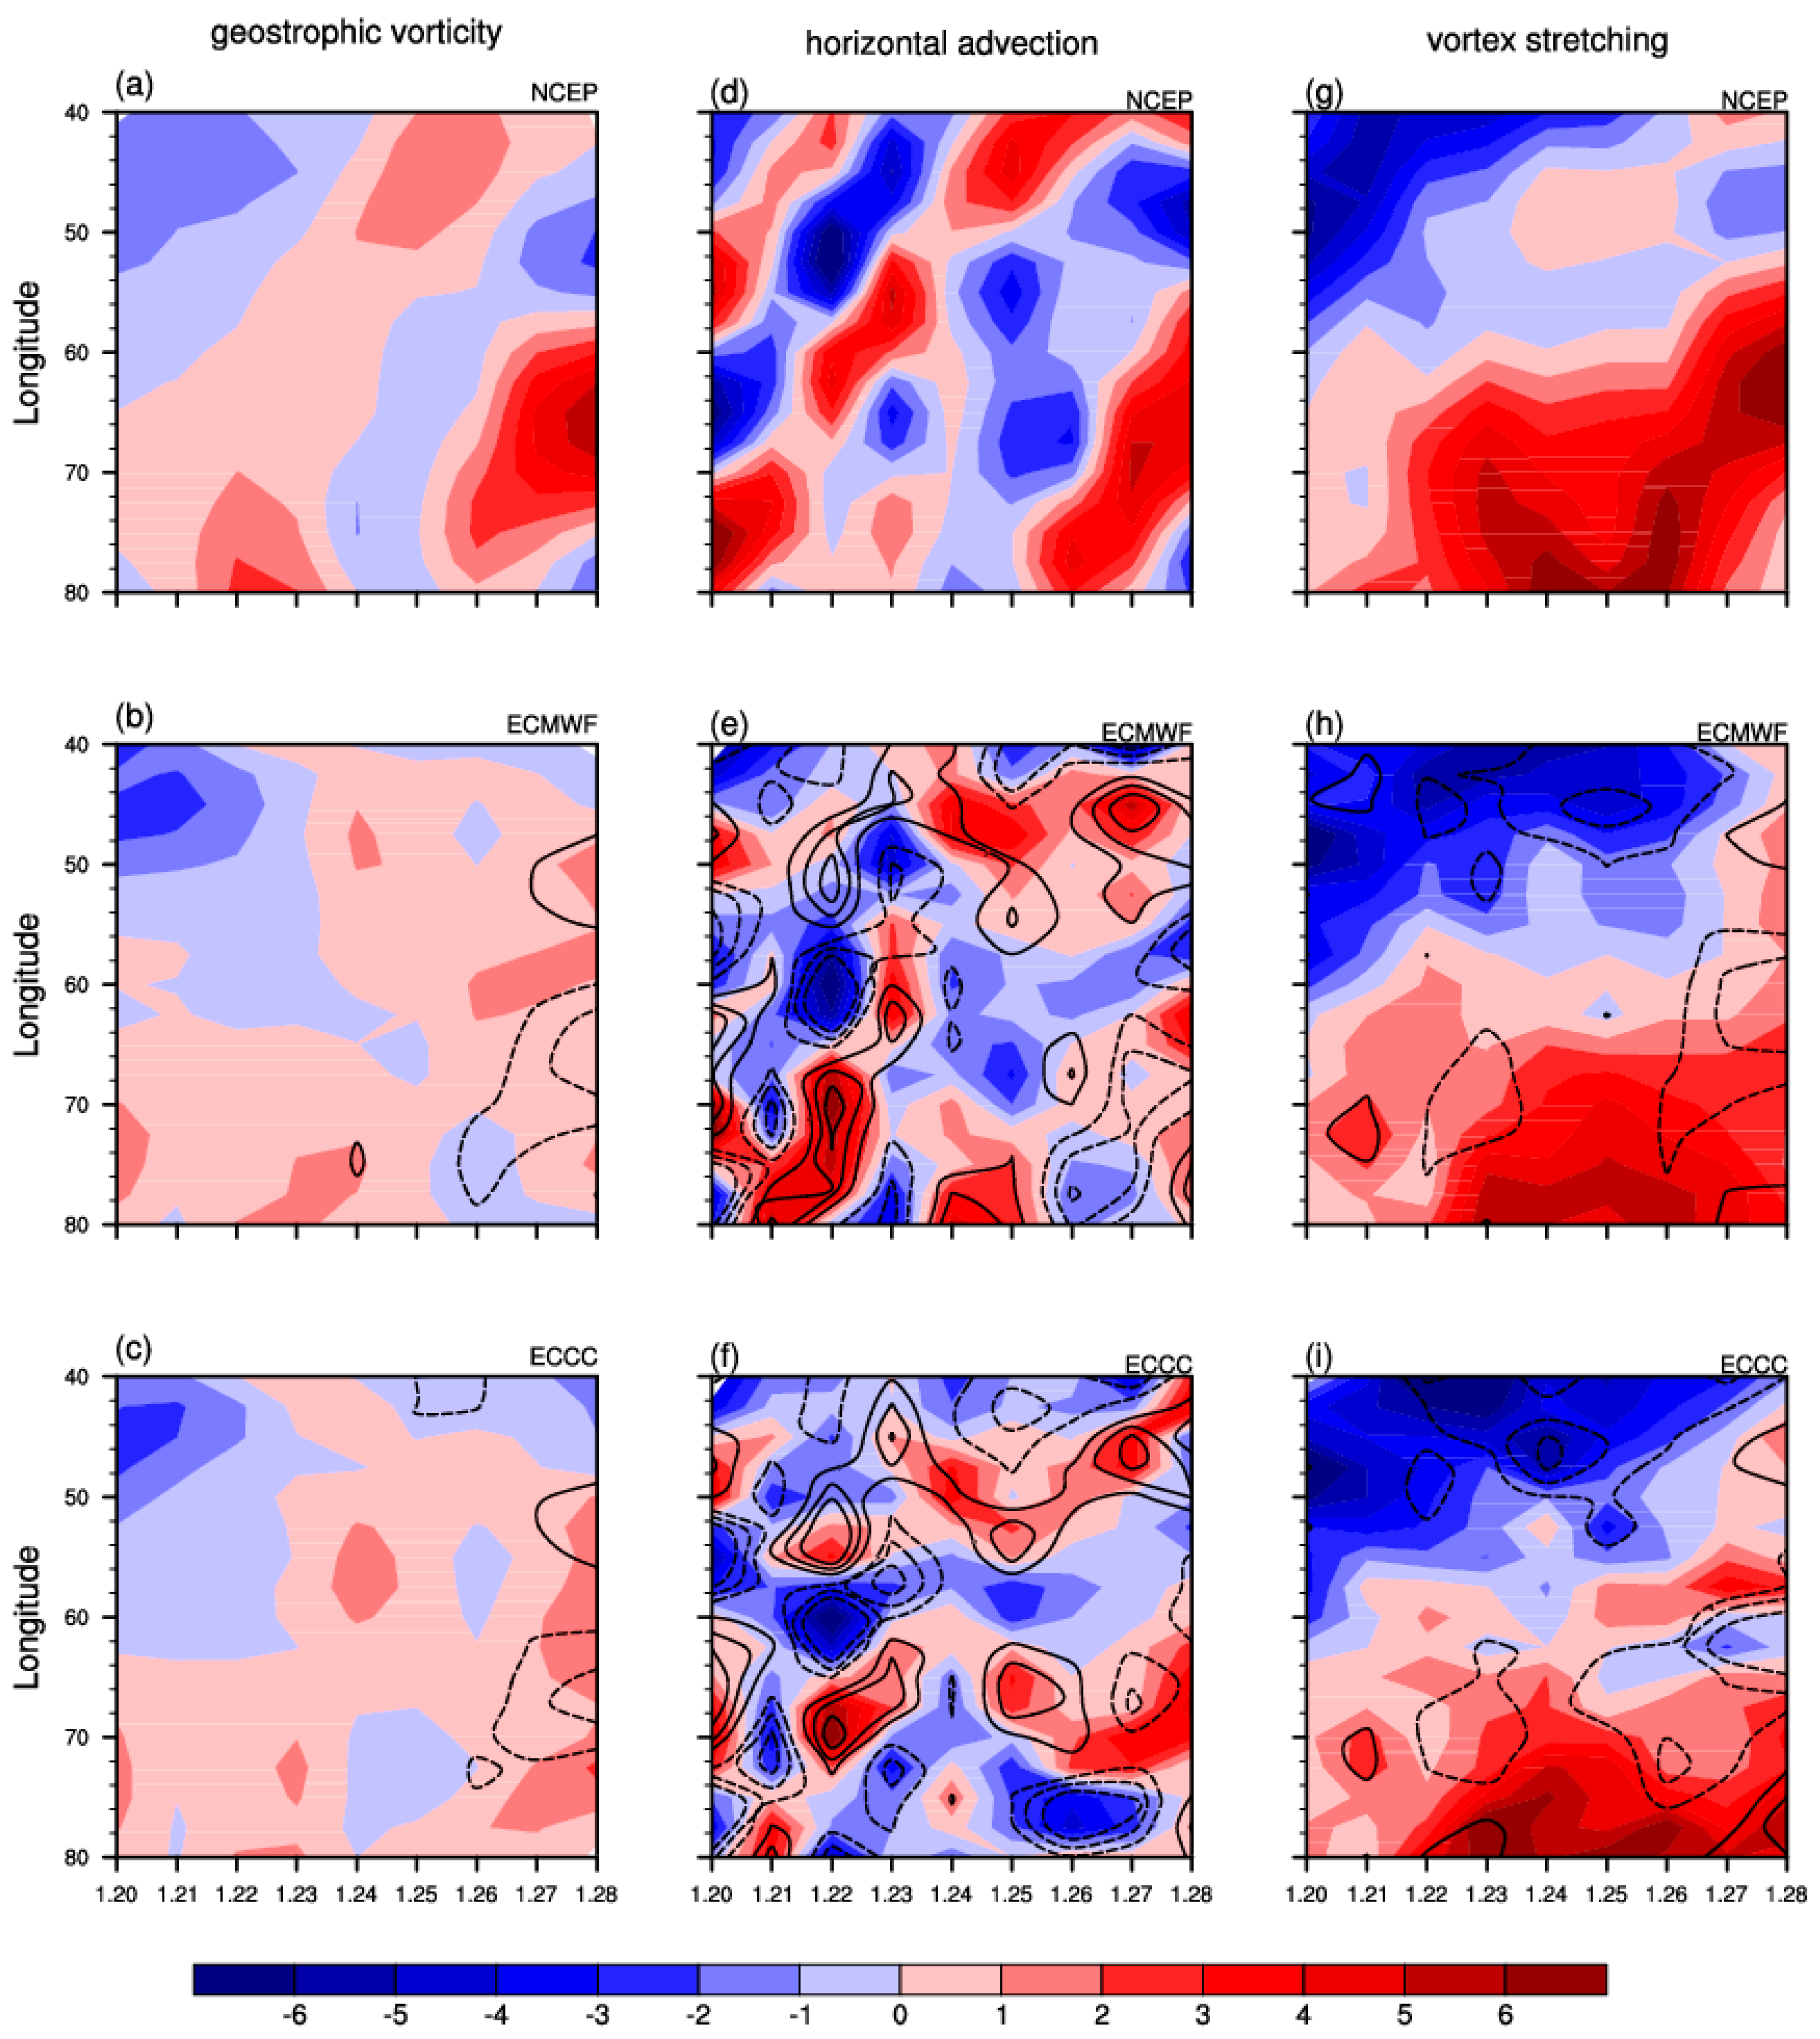
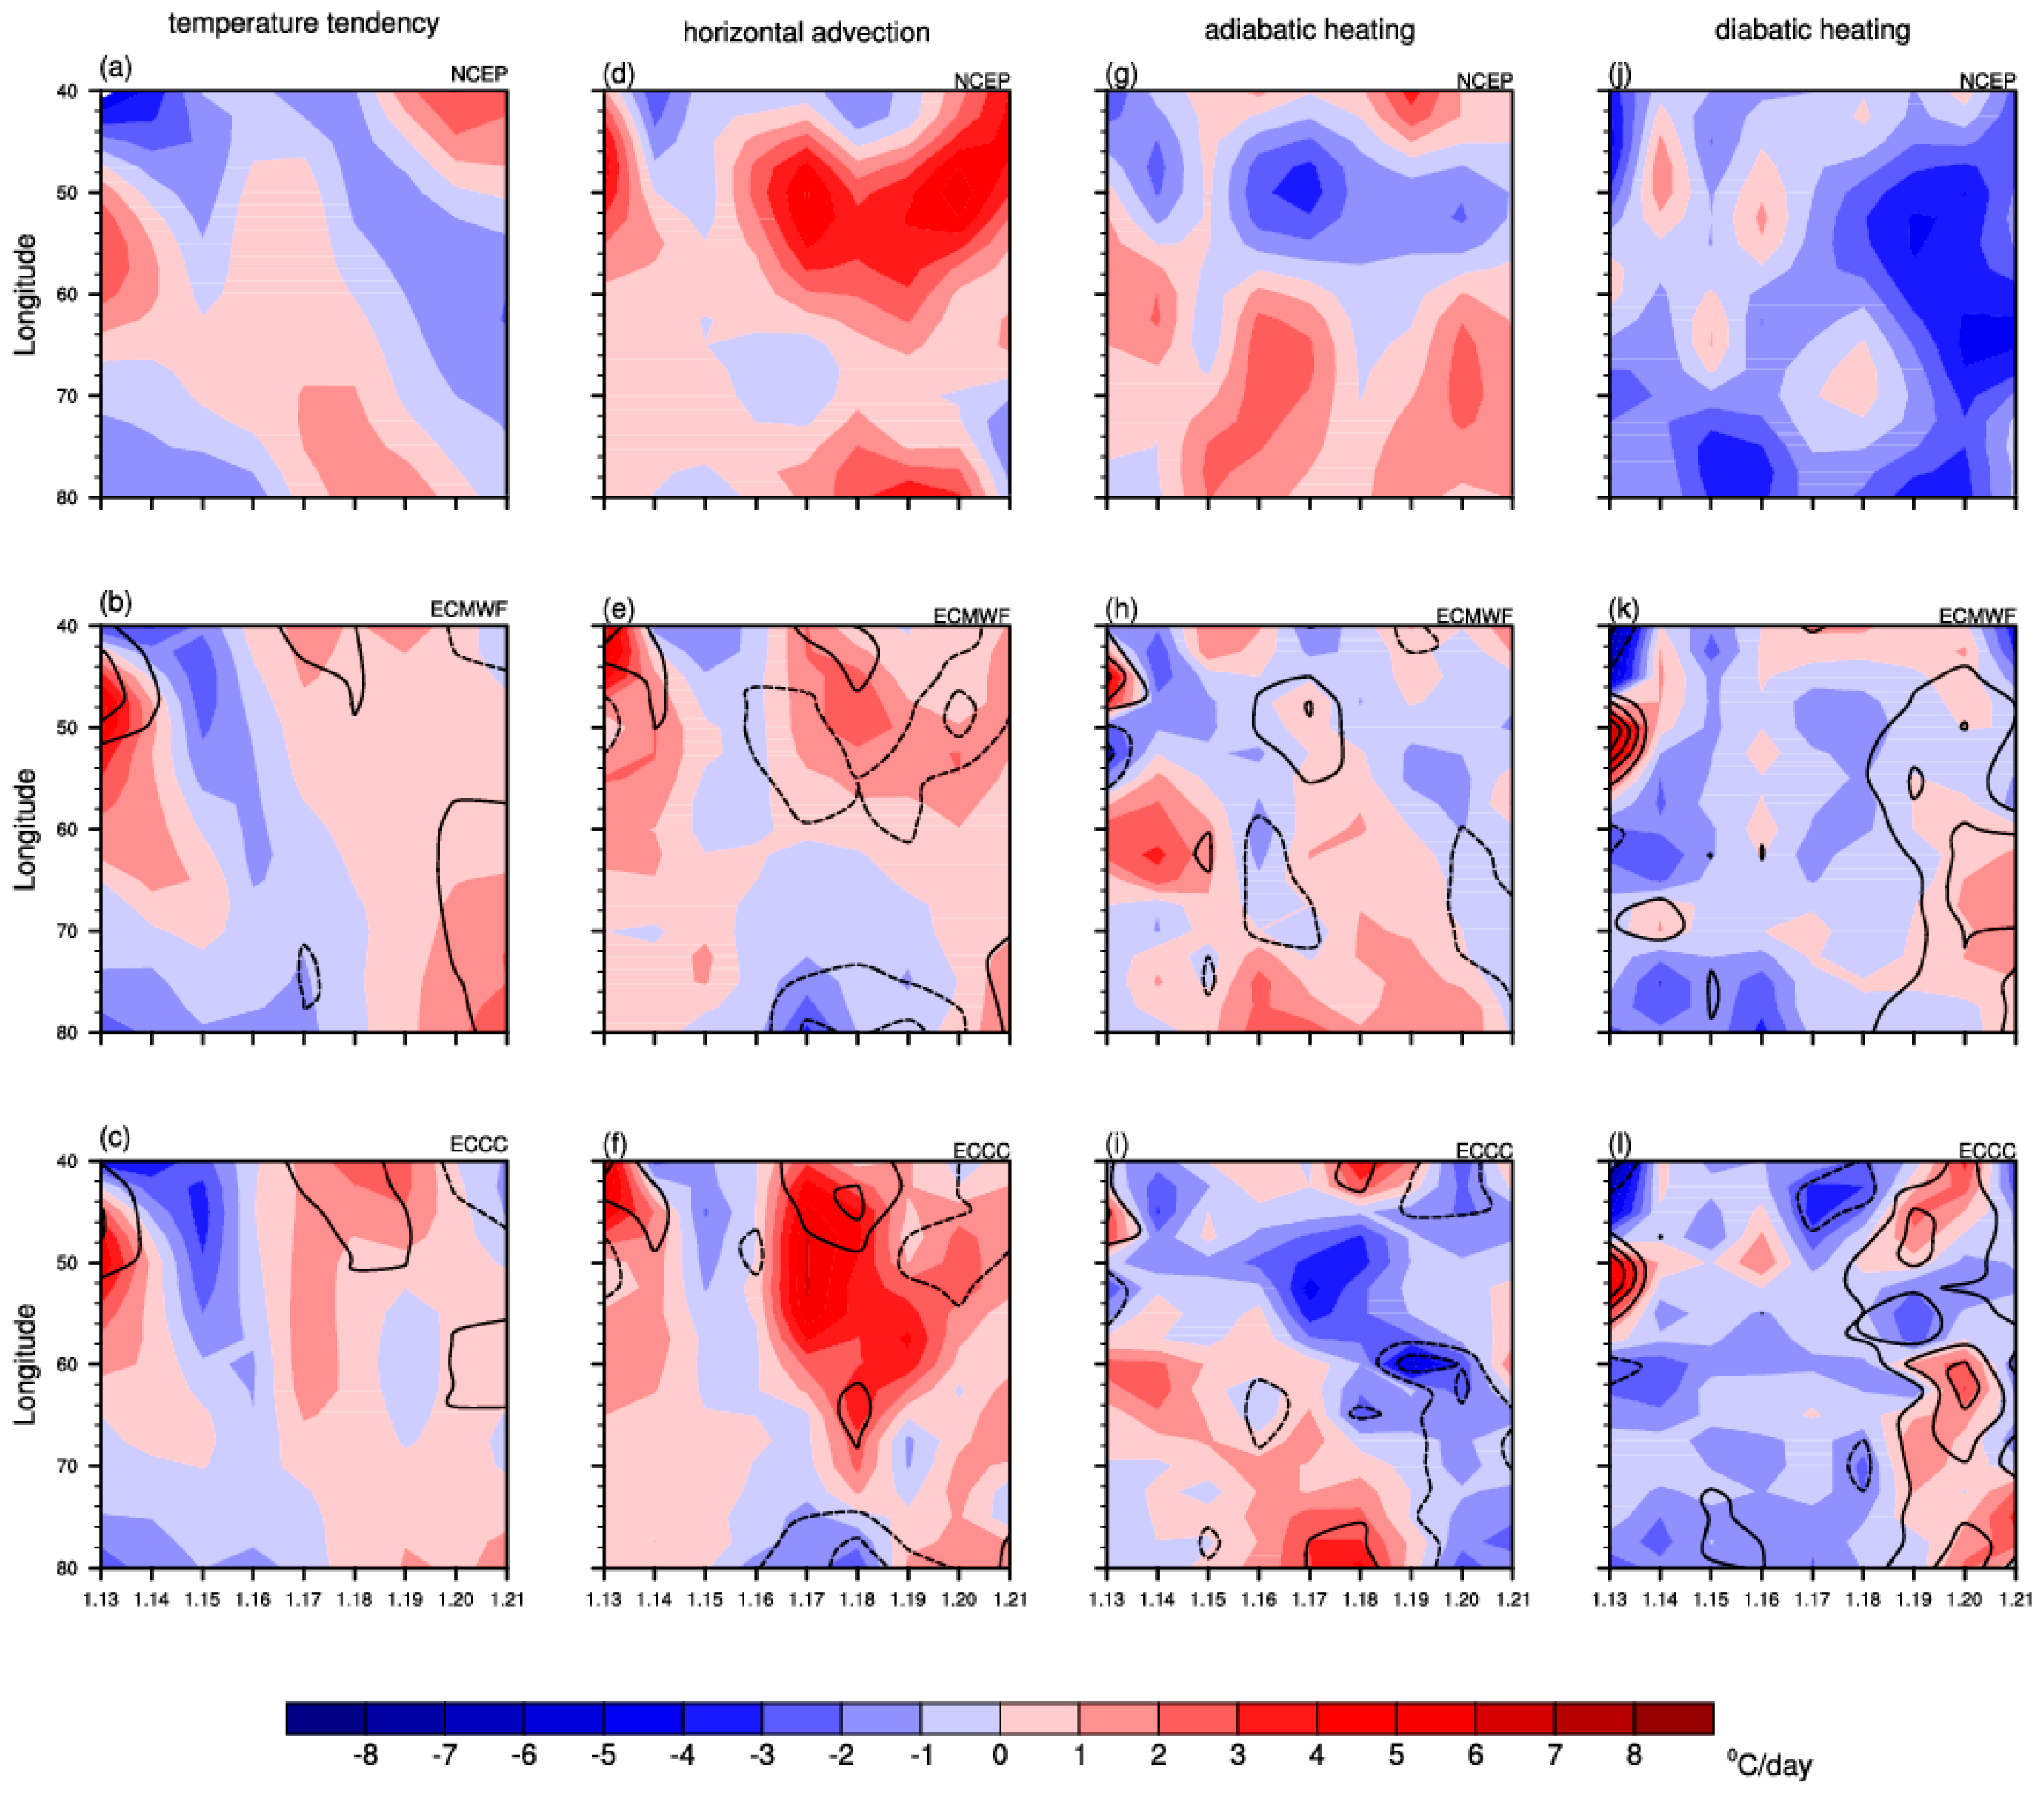
Investigating the individual terms of the geostrophic vorticity tendency equation and temperature tendency equation are important to understand the dynamic-thermodynamic processes of the blocking event [45,46]. We further analyzed individual terms of the geostrophic vorticity tendency equation and the temperature tendency equation to understand the dynamics and thermodynamics of the observed and predicted UB event. Note that the values of the geostrophic vorticity tendency, horizontal advection, and vortex stretching term were higher than the other three terms of the geostrophic vorticity tendency equation (Figure 5 vs. Figure 6; Figure 7 vs. Figure 8). During the development stage of the observed UB event, the geostrophic vorticity tendency over 50–60° E was negative on 13 January, which gradually moved eastward from 13 to 18 January, indicating the persistent enhancement of the high pressure center (Figure 5a). The region with a negative geostrophic vorticity tendency before 18 January was mainly due to the horizontal advection and ageostrophic vorticity tendency, because they showed a similar spatial distribution with the evolution of the geostrophic vorticity tendency (Figure 5a vs. Figure 5d; Figure 5a vs. Figure 6a). Conversely, the positive sign of the vortex stretching term offset the negative sign of the geostrophic vorticity tendency (Figure 5a vs. Figure 5g). In addition, the tilting over 50–60° E before 15 January and the vertical vorticity advection over 60–75° E on 14 to 15 January, also partly contributed to the negative sign of the geostrophic vorticity tendency (Figure 5a vs. Figure 6d; Figure 5a vs. Figure 6g). Correspondingly, the positive sign of the temperature tendency over 50–60° E was gradually moving eastward from 13 January, suggesting the regional warming prompted the development of the UB event (Figure 9a). The region with a positive temperature tendency was mainly attributed to the positive signs of horizontal temperature advection and adiabatic heating (Figure 9a vs. Figure 9d; Figure 9a vs. Figure 9g). In contrast, the diabatic heating partly dampened the blocking (Figure 9d vs. Figure 9j). Therefore, the dynamic terms of horizontal advection and vortex stretching term were important during the development stage of the UB event, which coincided well with the thermodynamic terms of horizontal temperature advection and adiabatic heating.
Compared to the observations, the two models’ predictions initialized on 12 January simulated the development stage of the UB event well, as well as the eastward propagation of negative geostrophic vorticity tendency from 13 to 18 January (Figure 5b,c). Recall that the ECCC model predicted better the development stage of the UB event. The PCC of the geostrophic vorticity tendency evolution between the ECCC prediction and the observations (+0.51) were higher than that between the ECMWF prediction and the observations (+0.35) (both significant at the 95% confidence level; Table 1). Meanwhile, the vortex stretching (horizontal vorticity advection) predicted by the two models was the best (worst) performance, with the PCC between both model predictions and observations larger (smaller) than +0.70 (+0.10) (Table 1). In addition, the ECCC model better simulated the evolution of temperature tendency during the development stage (Figure 9a–c; Table 1), which was related to the better simulation of horizontal temperature advection and diabatic heating (Figure 9d–l; Table 1).
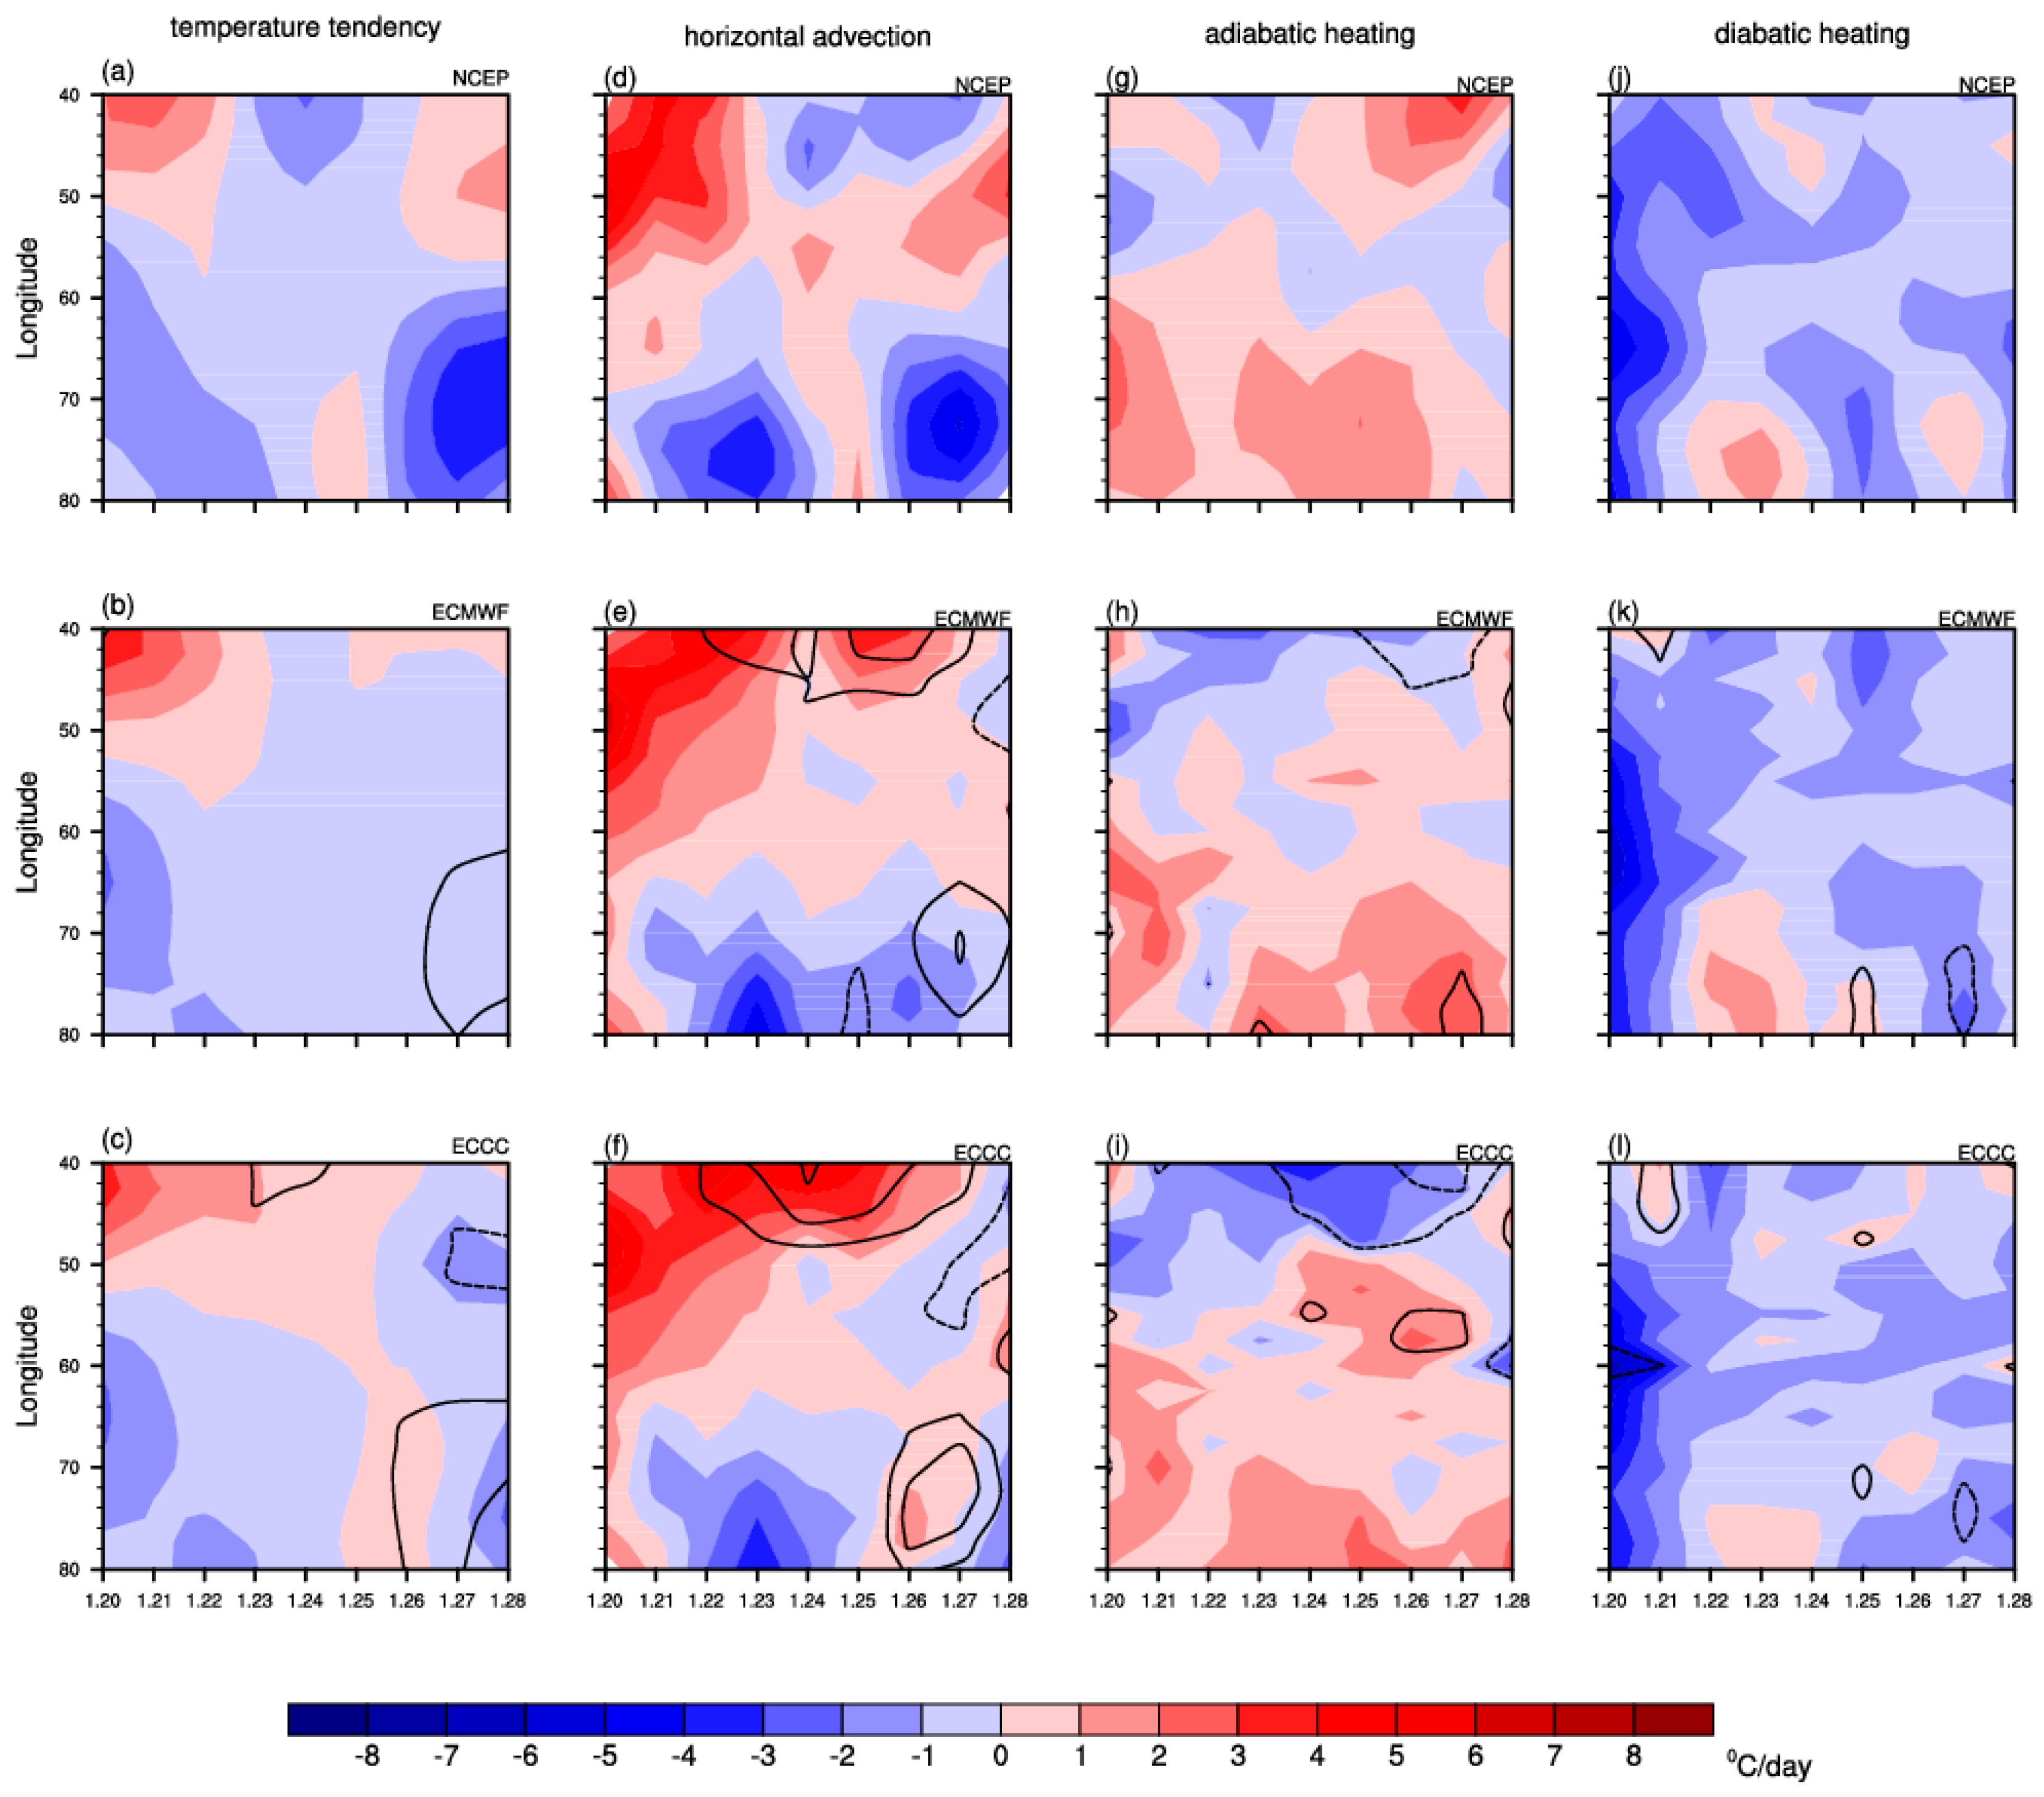
During the development stage of the UB event, most of the terms are simulated better by the ECCC model than the ECMWF model. Furthermore, based on the predictions initialized on 19 January, we compared the performance of the two models in predicting the dynamics during the decaying stage of the UB event. In observations, the geostrophic vorticity tendency was negative over 50–60° E before 21 January, which promoted UB to reach the peak on 21 January (Figure 7a). Afterward, the geostrophic vorticity tendency became positive, indicating a weakening of UB. The positive sign of the geostrophic vorticity tendency after 21 January was attributed to the horizontal advection, vortex stretching, ageostrophic vorticity tendency and tilting (Figure 7a vs. Figure 7d; Figure 7a vs. Figure 7g; Figure 7a vs. Figure 8a; Figure 7a vs. Figure 8d). In contrast, the vertical vorticity advection partly offset the positive sign of geostrophic vorticity tendency during the decaying stage of the UB event (Figure 7a vs. Figure 8g). The temperature tendency represented a persistent negative sign over 50–70° E after 20 January, suggesting the regional cooling prompted the decay of the UB event (Figure 10a). The negative sign of temperature tendency was largely attributed to diabatic heating effects, which was important to offset the positive sign of the horizontal temperature advection and adiabatic heating (Figure 10j vs. Figure 10d; Figure 10j vs. Figure 10g).
For the predictions of the two models initialized on 19 January, the negative sign of the geostrophic vorticity tendency over 40–60° E was well simulated from 20 to 24 January (Figure 7b,c). The spatial distribution of the geostrophic vorticity tendency evolution agreed well with the observations, with the PCCs of the geostrophic vorticity tendency between two models and the observations exceeding +0.35 (Table 1). As mentioned previously, the ECMWF model better predicted the decaying stage of the UB event. Moreover, both models accurately predicted the vortex stretching, where the PCCs between the two models’ predictions and the observations exceeded +0.70 (Table 1). In addition, the ECMWF model better predicted the evolution of four terms in temperature tendency equation during the decaying stage (Figure 10), especially for the horizontal temperature advection effect and diabatic heating effect, with the PCCs exceeding +0.70 and +0.69 (Table 1).

5. Discussion

The observed characteristics of the persistent UB event in January 2012 are consistent with previous studies [2,48,49,50]. When an extratropical cyclone moves eastward to upstream of a high-pressure ridge over Eastern Europe or the Ural Mountains, the high-pressure center advection on the eastern side of the cyclone makes the high-pressure ridge extend northward, which is crucial for the establishment of a UB event. The UB event decays when the cyclone further moves eastward and gradually weakens. Interestingly, we find that both models’ predictions have huge differences between the development and decaying stages of the UB event. The ECCC model is better than the ECMWF model during the development stage, but during the decaying stage, the ECMWF model performs better than the ECCC model. However, our conclusions are only based on a single persistent UB event. Moreover, the geostrophic vorticity tendency equation and temperature tendency equation were applied in our study to assess the predictability, but it is insufficient because the isentropic potential vorticity equation has advantages in discerning the differences of tendencies between the prediction and observation [51]. To better understand the predictability of strong UB events, we will (1) analyze more intense and persistent UB events simulated by different models, and (2) apply the isentropic potential vorticity equation to further investigate the predictability of the UB event in the future.

6. Summary

The occurrence of UB events is crucial for the severe cold air outbreaks in East Asia, so it is important to predict the UB event accurately. We investigated the ability of two S2S models (ECMWF and ECCC) to predict the persistent UB event from 18 to 26 January 2012. It was found that the establishment of this strong UB event was closely related to the weakening (strengthening) of the storm tracks over 50–60° N (70–80° N) after mid-January. The establishment of this UB event was well simulated by the predictions initialized on 12 January, especially for the ECCC model. While the ECMWF predictions performed better for more than ten days in advance, with the PCC between the ECMWF predictions and the observations exceeding +0.81 on 26 January, which was much higher than the PCC between the ECCC predictions and the observations. However, the predictions initialized on 12 January had large biases in simulating the decaying stage of the UB event after 21 January. These biases were significantly reduced by the predictions initialized on 19 January, especially for the ECMWF model. In short, the ECCC model is good in predicting the UB intensity during the development stage, while the ECMWF model is superior to the ECCC model in predicting the UB intensity during the decaying stage.
Furthermore, we compare the dynamic and thermodynamic evolution of the predictions to the observations via the geostrophic vorticity tendency equation and temperature tendency equation. The ECCC model better predicts the development stage of the UB event, so it predicts better the change of geostrophic vorticity tendency from the negative sign to the positive sign, with the PCC between the predictions and the observations exceeding +0.51. The better predictions are mainly related to the vertical vorticity advection, the ageostrophic vorticity tendency, and the tilting effect. Correspondingly, the temperature tendency is also predicted well by the ECCC model during the development stage, with the PCC exceeding +0.46. The positive sign of temperature tendency was mainly attributed to the positive signs of horizontal temperature advection and adiabatic heating. On the other hand, the ECMWF model better predicts the decaying stage of the UB event. Its predictions of the ageostrophic vorticity tendency, tilting effect, vertical vorticity advection, horizontal temperature advection, adiabatic heating, and diabatic heating have improvements from the development stage to the decaying stage. In addition, the two models accurately predict the evolution of the vortex stretching term during both the development and the decaying stage of the UB event, with the PCCs exceeding +0.70. However, their predicted horizontal vorticity advection has large biases with the PCC less than +0.10. Thus, we need to improve the prediction of the horizontal vorticity advection by the S2S models in order to better predict the UB event.

Author Contributions

Conceptualization, D.C. and S.Q.; Methodology, D.C., S.Q. and H.N.C.; Software, D.C. and S.Q.; Validation, D.C., S.Q. and H.N.C.; Formal analysis, D.C. and S.Q.; Investigation, D.C. and S.Q.; Resources, G.F., S.Q. and H.N.C.; Data curation, D.C. and S.Q.; Writing—original draft preparation, D.C.; Writing—review and editing, D.C., S.Q., H.N.C., S.T. and J.L.; Visualization, D.C.; supervision, S.Q. All authors have read and agreed to the published version of the manuscript.

Funding

This research received no external funding.

Acknowledgments

This study acknowledges the support of the National Key Research and Development Program of China (2017YFC1502303), the Key Program of the National Natural Science Foundation of China (41530531), the General Program of the National Natural Science Foundation of China (41905057, 41905050, 41975088, 41875101) and the China Postdoctoral Science Foundation funded project (2018M640848).

Conflicts of Interest

The authors declare no conflict of interest.

References

  1. Tibaldi, S.; Molteni, F. On the operational predictability of blocking. Tellus 1990, 42, 343–365. [Google Scholar] [CrossRef] [Green Version]
  2. Barriopedro, D.; García-Herrera, R.; Lupo, A.R.; Hernández, E.A. Climatology of Northern Hemisphere blocking. J. Clim. 2006, 19, 1042–1063. [Google Scholar] [CrossRef] [Green Version]
  3. Wu, M.C.; Leung, W.H. Efect of ENSO on the Hong Kong winter season. Atmos. Sci. Lett. 2009, 10, 94–101. [Google Scholar] [CrossRef]
  4. Wang, B.; Wu, Z.; Chang, C.P.; Liu, J.; Li, J.; Zhou, T. Another look at interannual-to-interdecadal variations of the East Asian winter monsoon: The northern and southern temperature modes. J. Clim. 2010, 23, 1495–1512. [Google Scholar] [CrossRef] [Green Version]
  5. Cheung, H.N.; Zhou, W.; Mok, H.Y.; Wu, M.C. Relationship between Ural-Siberian blocking and the East Asian winter monsoon in relation to the Arctic Oscillation and El Niño-Southern Oscillation. J. Clim. 2012, 25, 4242–4257. [Google Scholar] [CrossRef]
  6. Cheung, H.N.; Zhou, W.; Lee, S.M.; Tong, H.W. Interannual and interdecadal variability of the number of cold days in Hong Kong and their relationship with large-scale circulation. Mon. Weather Rev. 2015, 143, 1438–1454. [Google Scholar] [CrossRef]
  7. Qiao, S.; Zou, M.; Cheung, H.N.; Dong, W. Predictability of the wintertime 500 hPa geopotential height over Ural-Siberia in the NCEP climate forecast system. Clim. Dyn. 2020, 54, 1591–1606. [Google Scholar] [CrossRef]
  8. Tao, S. A cold wave in East Asia during a period of blocking decaying. Act Meteorol. Sin. 1957, 28, 63–74. (In Chinese) [Google Scholar]
  9. Joung, C.H.; Hitchman, M.H. On the role of successive downstream development in East Asian polar air outbreaks. Mon. Weather Rev. 1982, 110, 1224–1237. [Google Scholar] [CrossRef] [Green Version]
  10. Takaya, K.; Nakamura, H. Mechanisms of intraseasonal ampli-fication of the cold Siberian high. J. Atmos. Sci. 2005, 62, 4423–4440. [Google Scholar] [CrossRef]
  11. Takaya, K.; Nakamura, H. Geographical dependence of upper-level blocking formation associated with intraseasonal amplification of the Siberian high. J. Atmos. Sci. 2005, 62, 4441–4449. [Google Scholar] [CrossRef]
  12. Lu, M.-M.; Chang, C.-P. Unusual late-season cold surges during the 2005 Asian winter monsoon: Roles of Atlantic blocking and the Central Asian anticyclone. J. Clim. 2009, 22, 5205–5217. [Google Scholar] [CrossRef]
  13. Gong, Z.; Feng, G.; Ren, F.; Li, J. A regional extreme low temperature event and its main atmospheric contributing factors. Theor. Appl. Clmatol. 2014, 117, 195–206. [Google Scholar] [CrossRef]
  14. Gong, Z.; Wang, X.; Ren, F.; Feng, G. The Euro-Asia height positive anomalies character and its probable influence on regional extreme low-temperature events in winter in China. Chin. J. Atmos. Sci. 2013, 37, 1274–1286. (In Chinese) [Google Scholar]
  15. Tao, S.Y.; Wei, J. Severe snow and freezing-rain in January 2008 in the southern China. Clim. Environ. Res. 2008, 13, 337–350. (In Chinese) [Google Scholar]
  16. Ding, Y.H.; Wang, Z.Y.; Song, Y.F.; Zhang, J. Causes of the unprecedented freezing disaster in January 2008 and its possible association with the global warming. J. Meteorol. Res. 2008, 66, 808–825. (In Chinese) [Google Scholar]
  17. Li, Y.; Wang, S.G.; Jin, R.H.; Wang, J.Y.; Li, J.P. Abnormal characteristics of blocking high during durative low temperature, snowfall and freezing weather in southern China. Plateau Meteorol. 2012, 31, 94–101. (In Chinese) [Google Scholar]
  18. Qiao, S.; Gong, Z.; Feng, G.; Qian, Z. Relationship between cold winters over northern Asia and the subsequent hot summers over mid-lower reaches of the Yangtze River valley under global warming. Atmos. Sci. Lett. 2015, 16, 479–484. [Google Scholar] [CrossRef]
  19. Gao, S.T.; Zhu, W.M.; Dong, M. Eddy-mean flow interaction in atmospheric low-frequency variation (blocking situation). Act Meteorol. Sin. 1998, 56, 665–680. (In Chinese) [Google Scholar]
  20. Tyrlis, E.; Hoskins, B.J. The morphology of Northern Hemisphere blocking. J. Atmos. Sci. 2008, 65, 1653–1665. [Google Scholar] [CrossRef]
  21. Luo, D.; Zhou, W.; Wei, K. Dynamics of eddy-driven North Atlantic Oscillations in a localized shifting jet: Zonal structure and downstream blocking. Clim. Dyn. 2010, 34, 73–100. [Google Scholar] [CrossRef]
  22. Tracton, M.S. Predictability and its relationship to scale interaction processes in blocking. Mon. Weather Rev. 1990, 118, 1666–1695. [Google Scholar] [CrossRef] [Green Version]
  23. Tibaldi, S.; Tosi, E.; Navarra, A.; Pedulli, L. Northern and Southern Hemisphere seasonal variability of blocking frequency and predictability. Mon. Weather Rev. 1994, 122, 1971–2003. [Google Scholar] [CrossRef] [Green Version]
  24. Tibaldi, S.; Ruti, P.; Tosi, E.; Maruca, M. Operational predictability of winter blocking at ECMWF: An update. Ann. Geophys. 1995, 13, 305–317. [Google Scholar]
  25. Colucci, S.J.; Baumhefner, D.P. Numerical prediction of the onset of blocking: A case study with forecast ensembles. Mon. Weather Rev. 1998, 126, 773–784. [Google Scholar] [CrossRef]
  26. D’ Andrea, F.; Tibaldi, S.; Blackburn, M.; Boer, G.; Déqué, M.; Dix, M.R.; Dugas, B.; Ferranti, L.; Iwasaki, T.; Kitoh, A.; et al. Northern Hemisphere atmospheric blocking as simulated by 15 atmospheric general circulation models in the period 1979–1988. Clim. Dyn. 1998, 14, 385–407. [Google Scholar] [CrossRef]
  27. Scaife, A.A.; Woollings, T.; Knight, J.; Martin, G.; Hinton, T. Atmospheric blocking and mean biases in climate models. J. Clim. 2010, 23, 6143–6152. [Google Scholar] [CrossRef] [Green Version]
  28. Guan, X.D.; Ma, J.R.; Huang, J.P.; Huang, R.X.; Zhang, L.; Ma, Z.G. Impact of oceans on climate change in drylands. Sci. China Earth Sci. 2019, 62, 891–908. [Google Scholar] [CrossRef]
  29. Barnes, E.A.; Slingo, J.; Woollings, T. A methodology for the comparison of blocking climatologies across indices, models, and climate scenarios. Clim. Dyn. 2012, 38, 2467–2481. [Google Scholar] [CrossRef]
  30. Giacomo, M.; Hoskins, B.J.; Woollings, T. Winter and summer Northern Hemisphere blocking in CMIP5 models. J. Clim. 2013, 26, 7044–7059. [Google Scholar]
  31. Jia, X.; Yang, S.; Song, W.; He, B. Prediction of wintertime Northern Hemisphere blocking by the NCEP Climate Forecast System. J. Meteorol. Res. 2014, 28, 76–90. [Google Scholar] [CrossRef]
  32. World Meteorological Organization. Cold Spell in Europe and Asia in Late Winter 2011/2012. 2012. Available online: https://www.wmo.int/pages/mediacentre/news/documents/dwd (accessed on 8 March 2012).
  33. Lan, X.Q.; Chen, W. Strong cold weather event over Eurasia during the winter of 2011/2012 and a downward Arctic Oscillation signal from the stratosphere. Chin. J. Atmos. Sci. 2013, 37, 863–872. (In Chinese) [Google Scholar]
  34. Wu, B.; Yang, K.; Francis, J.A. A cold event in Asia during January–February 2012 and its possible association with Arctic sea ice loss. J. Clim. 2017, 30, 7971–7990. [Google Scholar] [CrossRef]
  35. Vitart, F.; Ardilouze, C.; Bonet, A.; Brookshaw, A.; Chen, M.; Codorean, C.; Zhang, L. The subseasonal to seasonal (S2S) prediction project database. Bull. Am. Meteorol. Soc. 2017, 98, 163–173. [Google Scholar] [CrossRef]
  36. Quinting, J.F.; Vitart, F. Representation of synoptic-scale Rossby wave packets and blocking in the S2S prediction project database. Geophys. Res. Lett. 2019, 46, 1070–1078. [Google Scholar] [CrossRef]
  37. Kalnay, E.; Kanamitsu, M.; Kistler, R.; Collins, W.; Deaven, D.; Gandin, L.; Iredell, M.; Saha, S.; White, G.; Woolen, J.; et al. The NCEP/NCAR 40-year reanalysis project. Bull. Am. Meteorol. Soc. 1996, 77, 437–471. [Google Scholar] [CrossRef] [Green Version]
  38. Pyper, B.J.; Peterman, R.M. Comparison of methods to account for autocorrelation in correlation analyses of fish data. Can. J. Fish. Aquat. Sci. 1998, 55, 2127–2140. [Google Scholar] [CrossRef]
  39. Li, J.; Sun, C.; Jin, F.F. NAO implicated as a predictor of Northern Hemisphere mean temperature multidecadal variability. Geophys. Res. Lett. 2013, 40, 5497–5502. [Google Scholar] [CrossRef]
  40. Barriopedro, D.; García-Herrera, R.; Trigo, R.M. Application of blocking diagnosis methods to General Circulation Models. Part I: A novel detection scheme. Clim. Dyn. 2010, 35, 1373–1391. [Google Scholar] [CrossRef]
  41. Austin, J.F. The blocking of mid-latitude westerly wind by planetary waves. Quart. J. R. Meteorol. Soc. 1980, 106, 327–350. [Google Scholar] [CrossRef]
  42. Lejenäs, H.; Øakland, H. Characteristics of Northern Hemisphere blocking as determined from long time series of observational data. Tellus 1983, 35, 350–362. [Google Scholar] [CrossRef]
  43. Pelly, J.L.; Hoskins, B.J. A new perspective on blocking. J. Atmos. Sci. 2003, 60, 743–755. [Google Scholar] [CrossRef]
  44. Tyrlis, E.; Hoskins, B.J. Aspects of a Northern Hemisphere atmospheric blocking climatology. J. Atmos. Sci. 2008, 65, 1638–1652. [Google Scholar] [CrossRef]
  45. Cheung, H.N.; Zhou, W.; Shao, Y.; Chen, W.; Mok, H.Y.; Wu, M.C. Observational climatology and characteristics of wintertime atmospheric blocking over Ural-Siberia. Clim. Dyn. 2013, 41, 63–79. [Google Scholar] [CrossRef]
  46. Lupo, A.R.; Smith, P.J.; Zwack, P. A diagnosis of the explosive development of two extratropical cyclones. Mon. Weather Rev. 1992, 120, 1490–1523. [Google Scholar] [CrossRef] [Green Version]
  47. Woollings, T.; Hoskins, B.J.; Blackburn, M.; Berrisford, P. A new Rossby wave-breaking interpretation of the North Atlantic Oscillation. J. Atmos. Sci. 2008, 65, 609–626. [Google Scholar] [CrossRef]
  48. Lupo, A.R.; Smith, P.J. Climatological features of blocking anticyclones in the Northern Hemisphere. Tellus 1995, 47, 439–456. [Google Scholar] [CrossRef] [Green Version]
  49. Diao, Y.; Li, J.; Luo, D. A new blocking index and its application: Blocking action in the Northern Hemisphere. J. Clim. 2006, 19, 4819–4839. [Google Scholar] [CrossRef]
  50. Mullen, S.L. Transient eddy forcing of blocking flows. J. Atmos. Sci. 1987, 44, 3–22. [Google Scholar] [CrossRef]
  51. Bluestein, H.B. Synoptic-Dynamic Meteorology in Mid-latitudes. Volume II: Observations and Theory of Weather System; Oxford University Press: Oxford, UK, 1993; p. 594. [Google Scholar]
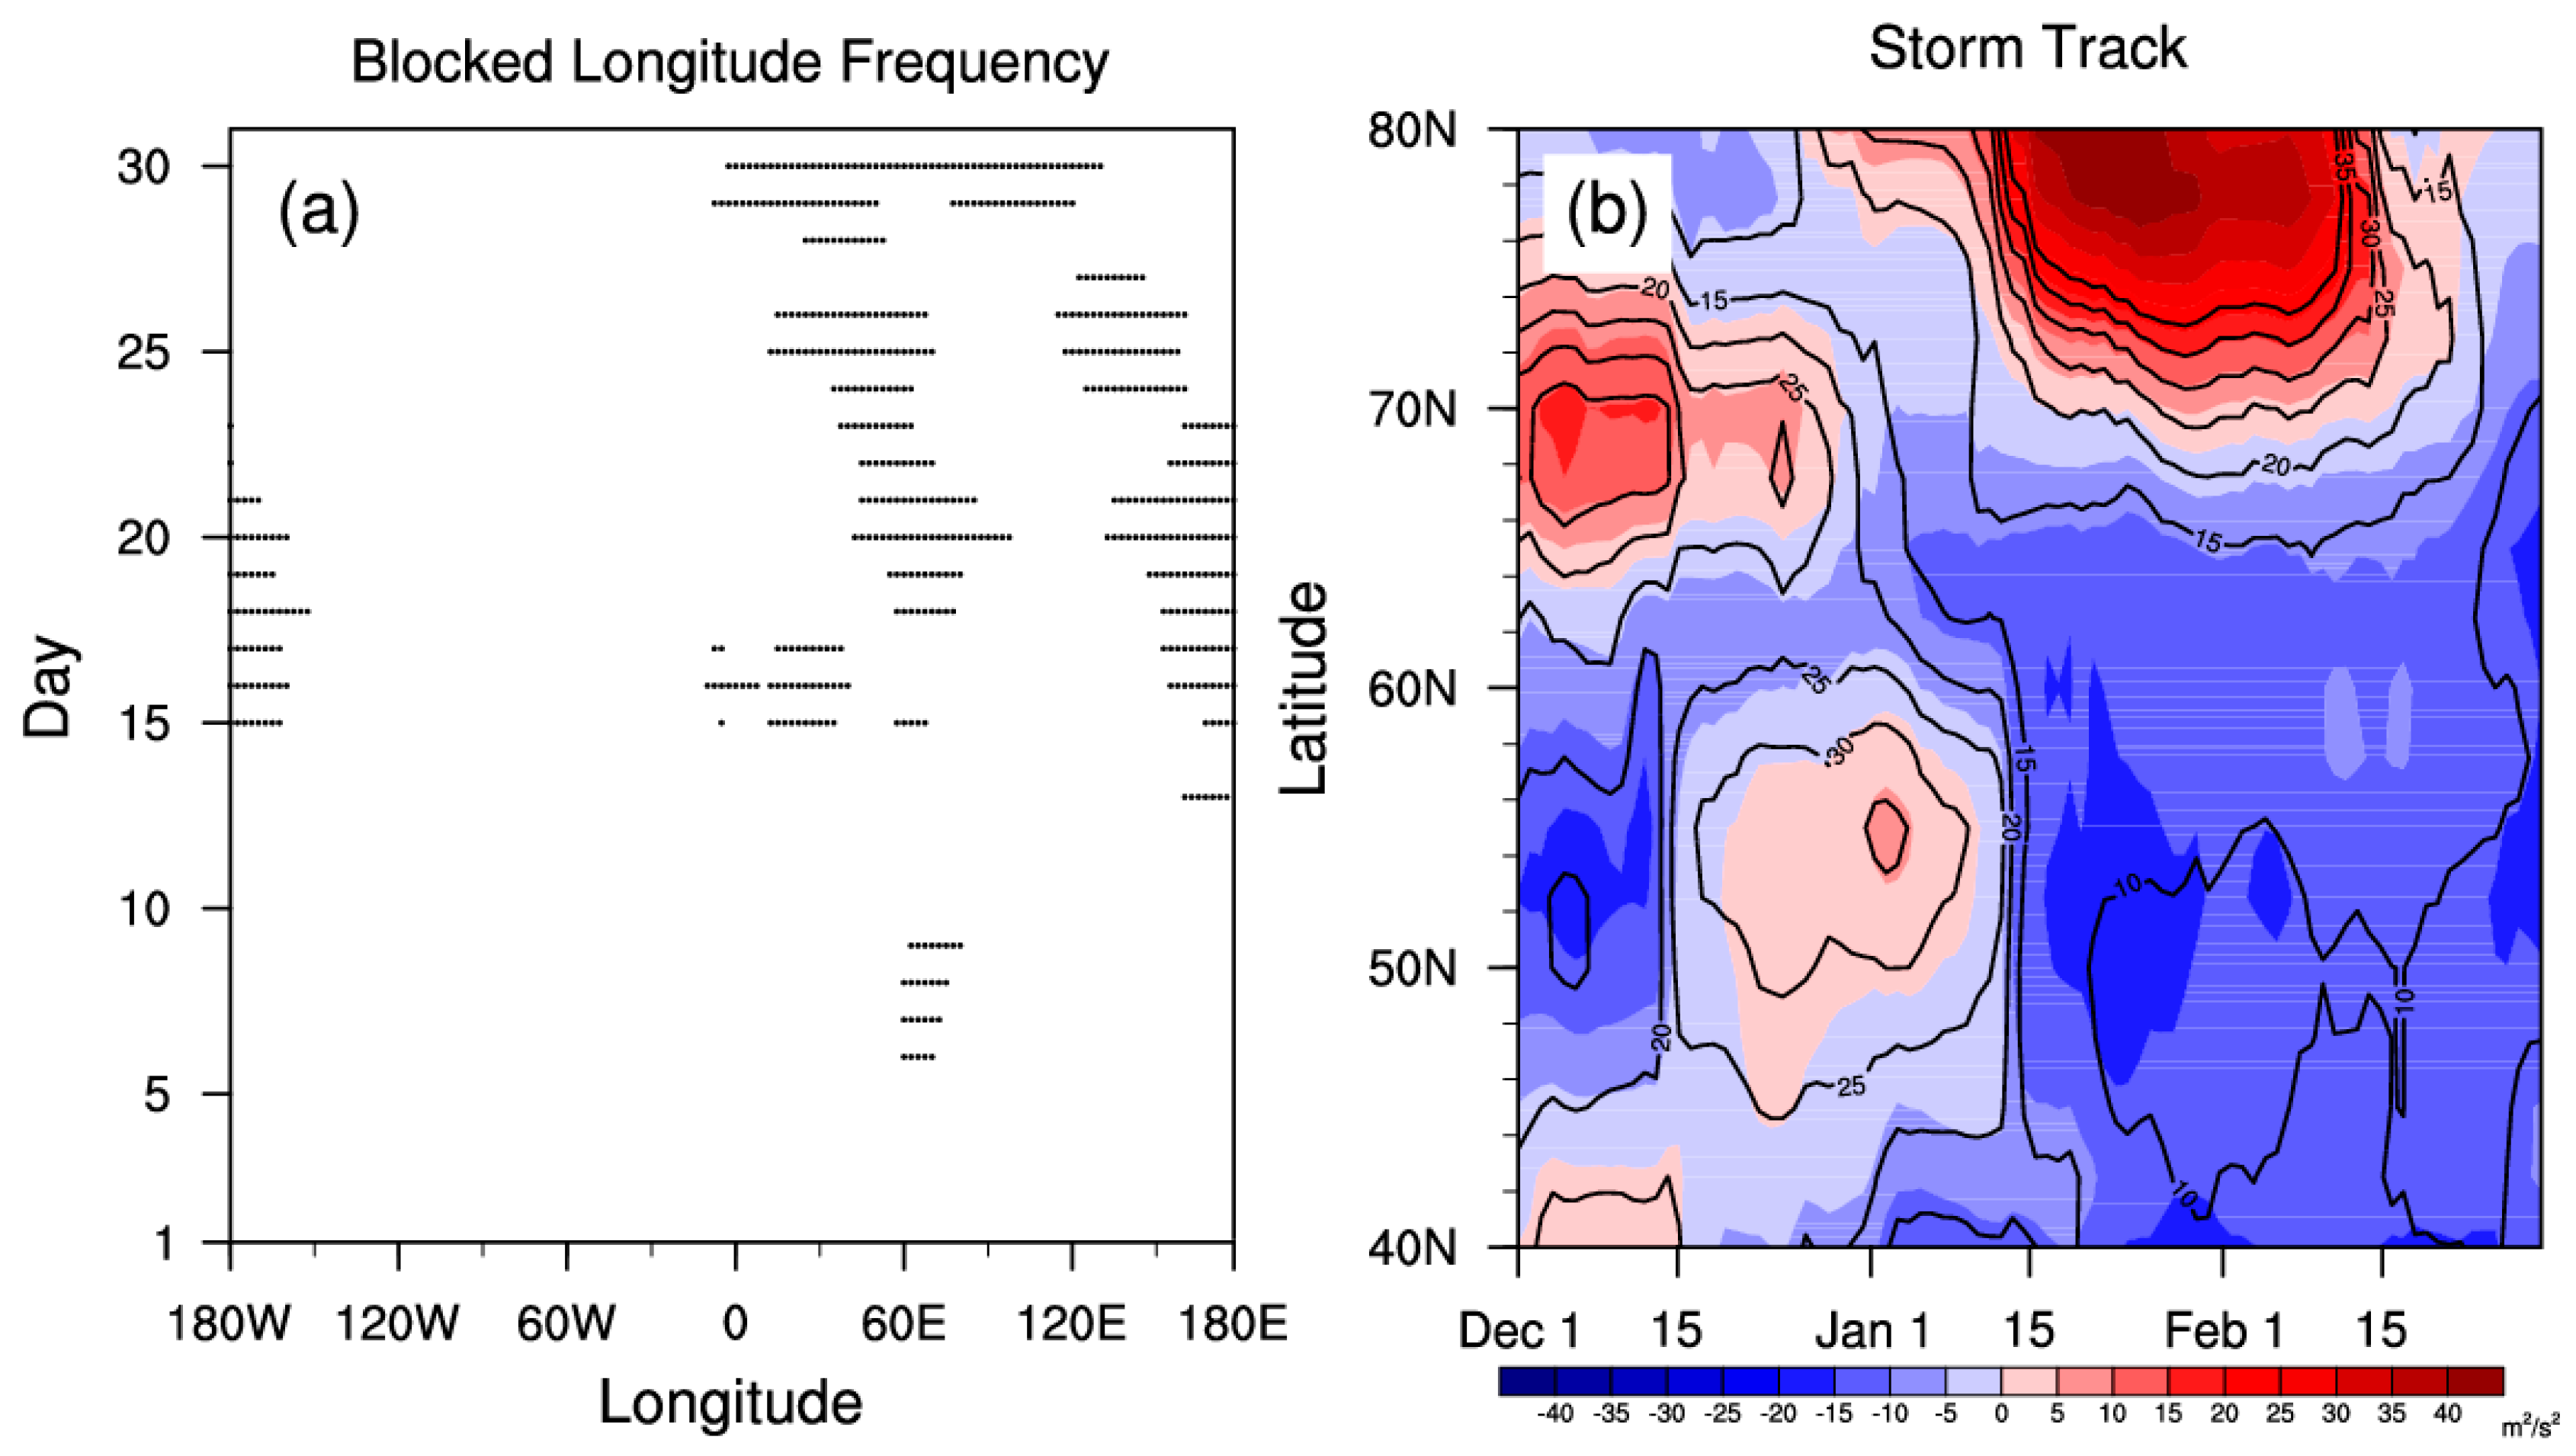
Figure 1. (a) Zonal distribution of blocking regions from 1 to 31 January 2012. (b) time–latitude cross-section of the 15-day running-mean storm tracks (contour interval, 5 m2·s−2) and their anomalies (shaded) averaged over 40–70° E from December 2011 to February 2012 in observations. Labels on the time axis are the central day of the 15-day moving window.
Atmosphere 11 00538 g001
Figure 2. Evolution of the Z500 (contour interval, 40 gpm) and Z500 anomalies (shaded, gpm) in (ad) the observations from 14 to 26 January 2012. Evolution of the Z500 difference between the two model predictions and observation (shaded, gpm) and Z500 (contour interval: 40 gpm) in (eh) the ECMWF predictions initialized on 12 January and (il) the ECCC predictions initialized on 12 January. The RMSE and PCC between the predictions and the observations over the region (20–80° N, 20–100° E) are indicated at the top right.
Atmosphere 11 00538 g002
Figure 3. Same as Figure 2, but for the ECMWF and ECCC predictions initialized on 19 January. (ad) the observations, (eh) the ECMWF predictions, (il) the ECCC predictions from 20 to 26 January 2012. The contour interval is 50 gpm.
Atmosphere 11 00538 g003
Figure 4. (a,b) UB intensity (units, gpm) from 13 to 29 January 2012. (c,d) UB extension from 18 to 26 January 2012. The black line is observations, the red (blue) dots are the prediction of 11 (4) members for the ECMWF (ECCC) model, and the red (blue) line is the ensemble-mean of the ECMWF (ECCC) model. In (a) and (c) ((b) and (d)), the predictions were initialized on 12 January (19).
Atmosphere 11 00538 g004
Figure 5. Time-longitude cross-sections of the three terms in the geostrophic vorticity tendency equation (shaded; 1 × 10⁻¹⁰ s−2) averaged over the latitudes 50–65° N from 13 to 21 January 2012, (ac) the tendency of geostrophic vorticity, (df) the horizontal advection of the absolute vorticity, (gi) the vortex stretching. (top) The observations, (middle) the ECMWF predictions initialized on 12 January, and (bottom) the ECCC predictions initialized on 12 January. The contours represent differences between the models predictions and the observations (contour interval: 2 × 10⁻¹⁰ s−2). Negative values are represented by dashed contours, while positive values are represented by solid contours, and the zero contours are omitted.
Atmosphere 11 00538 g005
Figure 6. Same as Figure 5, but for the other three terms in the geostrophic vorticity tendency equation. (ac) tendency of ageostrophic vorticity, (df) tilting, (gi) vertical advection of absolute vorticity.
Atmosphere 11 00538 g006
Figure 7. Same as Figure 5, but for (top) the observations from 20 to 28 January 2012, (middle) the ECMWF predictions initialized on 19 January, and (bottom) the ECCC predictions initialized on 19 January. (ac) the tendency of geostrophic vorticity, (df) the horizontal advection of the absolute vorticity, (gi) the vortex stretching.
Atmosphere 11 00538 g007
Figure 8. Same as Figure 6, but for (top) the observations from 20 to 28 January 2012, (middle) the ECMWF predictions initialized on 19 January, and (bottom) the ECCC predictions initialized on 19 January. (ac) tendency of ageostrophic vorticity, (df) tilting, (gi) vertical advection of absolute vorticity.
Atmosphere 11 00538 g008
Figure 9. Time-longitude cross-sections of the four terms in the temperature tendency equation (shaded; °C·day−1) averaged over the latitudes 50–65° N from 13 to 21 January 2012, (ac) temperature tendency, (df) horizontal temperature advection, (gi) adiabatic heating, (jl) diabatic heating. (top) The observations, (middle) the ECMWF predictions initialized on 12 January, and (bottom) the ECCC predictions initialized on 12 January. The contours (interval, 2 °C·day−1) represent the departures of models from the observations. Negative values are represented by dashed contours, while positive values are represented by solid contours, and the zero contours are omitted.
Atmosphere 11 00538 g009
Figure 10. Same as Figure 9, but for (top) the observations from 20 to 28 January 2012, (middle) the ECMWF predictions initialized on 19 January, and (bottom) the ECCC predictions initialized on 19 January. (ac) temperature tendency, (df) horizontal temperature advection, (gi) adiabatic heating, (jl) diabatic heating.
Atmosphere 11 00538 g010
Table 1. The PCCs between both models predictions and the observations about the terms of the geostrophic vorticity tendency equation and temperature tendency equation (* denotes the values are significant at the 95% confidence level).
PCCECMWF (Initialized on 12 January)ECCC (Initialized on 12 January)ECMWF (Initialized on 19 January)ECCC (Initialized on 19 January)
geostrophic vorticity tendency+0.35 *+0.51*+0.35 *+0.51 *
horizontal vorticity advection+0.09−0.02−0.01−0.12
vortex stretching term+0.71 *+0.73 *+0.81 *+0.73 *
tilting effect+0.14+0.43 *+0.42 *+0.28 *
vertical vorticity advection+0.24 *+0.57 *+0.32 *+0.19
ageostrophic vorticity tendency+0.07+0.23 *+0.40 *+0.23
temperature tendency+0.30+0.46 *+0.59 *+0.46 *
horizontal temperature advection+0.29+0.50 *+0.70 *+0.52 *
adiabatic heating+0.22+0.37 *+0.39 *+0.23
diabatic heating+0.15+0.11+0.69 *+0.65 *