Article

Study on the Pollution Characteristics and Sources of Ozone in Typical Loess Plateau City

1
School of Environment and Safety Engineering, North University of China, Taiyuan 030051, China
2
State Key Laboratory of Environmental Criteria and Risk Assessment, Chinese Research Academy of Environmental Sciences, Beijing 100012, China
3
Taiyuan Eco-Environment Monitoring Center of Shanxi Province, Taiyuan 030051, China
*
Authors to whom correspondence should be addressed.
Atmosphere 2020, 11(6), 555; https://doi.org/10.3390/atmos11060555
Submission received: 15 April 2020 / Revised: 10 May 2020 / Accepted: 12 May 2020 / Published: 27 May 2020

Abstract

:
Ground-level ozone is a secondary pollutant produced by photochemical reactions and it adversely affects plant and human health. Taiyuan City, a typical city on the loess plateau, is suffering from severe ozone pollution. We utilized the data from eight national environmental monitoring sites of Taiyuan, including concentrations of O3 and nitric oxide, and meteorological factors, such as air temperature and wind, to study the pollution characteristics and sources of ozone (O3) in Taiyuan in 2018. Results show that during 2018, the maximum value and 90th percentile of the maximum 8-h running average of O3 concentration were 257 μg/m3 and 192 μg/m3, respectively. There were 72 days where the O3 concentration exceeded the standard in 2018, which were mainly during April to August. The O3 concentration increased from March, reached a high level in April through August, and decreased significantly from September. The O3 concentrations displayed a typical “single peak” diurnal variation, which was high during the day with peak at around 13:00–15:00 and low at night. From April to August, the O3 concentrations at Jinyuan was the highest, followed by Xiaodian and Taoyuan, and the O3 concentrations at Shanglan and Nanzhai were the lowest. When the O3 concentration exceeded the standard value, Jinyuan contributed the most to the O3 pollution of Taiyuan, followed by Taoyuan and Xiaodian. High temperature and pressure, south and southwest winds can lead to an increase in O3 concentration. The O3 pollution in the Taiyuan urban area is caused by local generation, and the transportation of polluted air masses containing oxides of nitrogen (NOx) and volatile organic compounds (VOCs) emitted by industries, such as the coking and steel plants in counties of Jinzhong City in southern Taiyuan, and Qingxu County, and some counties in Lyuliang City to the southwest. In addition, the mountain winds and low nitric oxide concentration are the main reasons for the increase of O3 concentration, often observed in Shanglan at night.

1. Introduction

Ground-level O3 is a major component of photochemical oxidants, which is mainly generated by the photochemical reactions between oxides of nitrogen (NOx) and volatile organic compounds (VOCs) in the presence of sunlight [1]. Therefore, the formation of O3 is influenced by meteorological factors, such as solar radiation intensity and air temperature, as well as by the transport of polluted air masses [2,3,4,5]. O3 pollution affects not only human health, but also plant health and growth [6]. In recent years, O3 pollution in many areas of China has been more severe year after year with increased urban population and number of motor vehicles. Thus O3 has become another important pollutant next to PM2.5 affecting the air quality [7,8] in China.
Taiyuan is a typical loess plateau city with an average elevation of 800 m. The highest and lowest altitudes are 2670 m and 760 m, respectively. It is adjacent to the Taihang Mountains on the east, Lyuliang Mountain on the west, Yunzhong Mountain and Xizhou Mountain on the north, and it has river valleys in the middle and south. Moreover, located in the south of Taiyuan, Xiaodian district together with the areas to its south are characterized by open terrain, and the terrain of the areas to the north of Xiaodian are relatively narrow. However, the northernmost part of Taiyuan, which shares a border with the Yunzhong Mountain, is particularly narrow, making Taiyuan a trumpet-shaped basin shown in Figure 1. Only when the north wind blows at a high speed the air pollutants can be dispersed effectively. However, when the south wind blows, the polluted air masses from the south and southwest of Taiyuan can be transported to Taiyuan, affecting the O3 concentration in the urban area of Taiyuan.
In the past two years, although the pollution of PM2.5 has been effectively controlled in Taiyuan, the pollution caused by O3 has been increasing year by year. The first time that ozone concentrations exceeded the standard in Taiyuan in 2017 was 2 May 2017 (173 μg/m3), and the first time that ozone concentrations exceeded the standard in 2018 was 30 March 2018 (174 μg/m3). The time when the ozone concentrations exceeded the standard in 2018 was earlier than the time when the ozone concentrations exceeded the standard in 2017, and the degree of ozone pollution in 2018 was more serious, causing the ambient air quality of Taiyuan City to decline. Therefore, it is particularly important to study the characteristics of O3 pollution in Taiyuan and explore its sources. However, there are still few reports available and this study aims to make clear the temporal variation and spatial distribution characteristics of O3 concentration in Taiyuan, explore its sources and the causes of O3 pollution, which will provide reference for the government to formulate effective measures and improve the air quality of Taiyuan.

2. Data and Methods

The data used in this research are collected by the eight national environmental monitoring sites of Taiyuan during 2018, including the concentrations of such pollutant gases as O3 and NOx (in standard condition, 273.15 K and 101.325 Kpa) as well as meteorological factors, such as air temperature and wind direction (Provided by the Taiyuan Ecological Environment Monitoring Center of Shanxi Province). The eight sites from north to south are Shanglan (the background site, not participating in the calculation of the mean value of sampling in Taiyuan), Nanzhai, Jiancaoping, Taoyuan, Wucheng, Jinsheng, Xiaodian, and Jinyuan, as shown in Figure 2.
To explore the sources of air masses and their contribution to the O3 pollution in Taiyuan, when the O3 concentration exceeds the standard value, the HYSPLIT model, developed by the United States National Oceanic and Atmospheric Administration, fed by meteorological data provided by the Global Data Assimilation System of the United States National Centers for Environmental Prediction (ftp://arlftp.arlhq.noaa.gov/pub/archives/gdas1, resolution: 1° × 1°), has been used to conduct backward trajectory simulations.

3. Results and Discussion

3.1. The O3 Pollution in Taiyuan in 2018

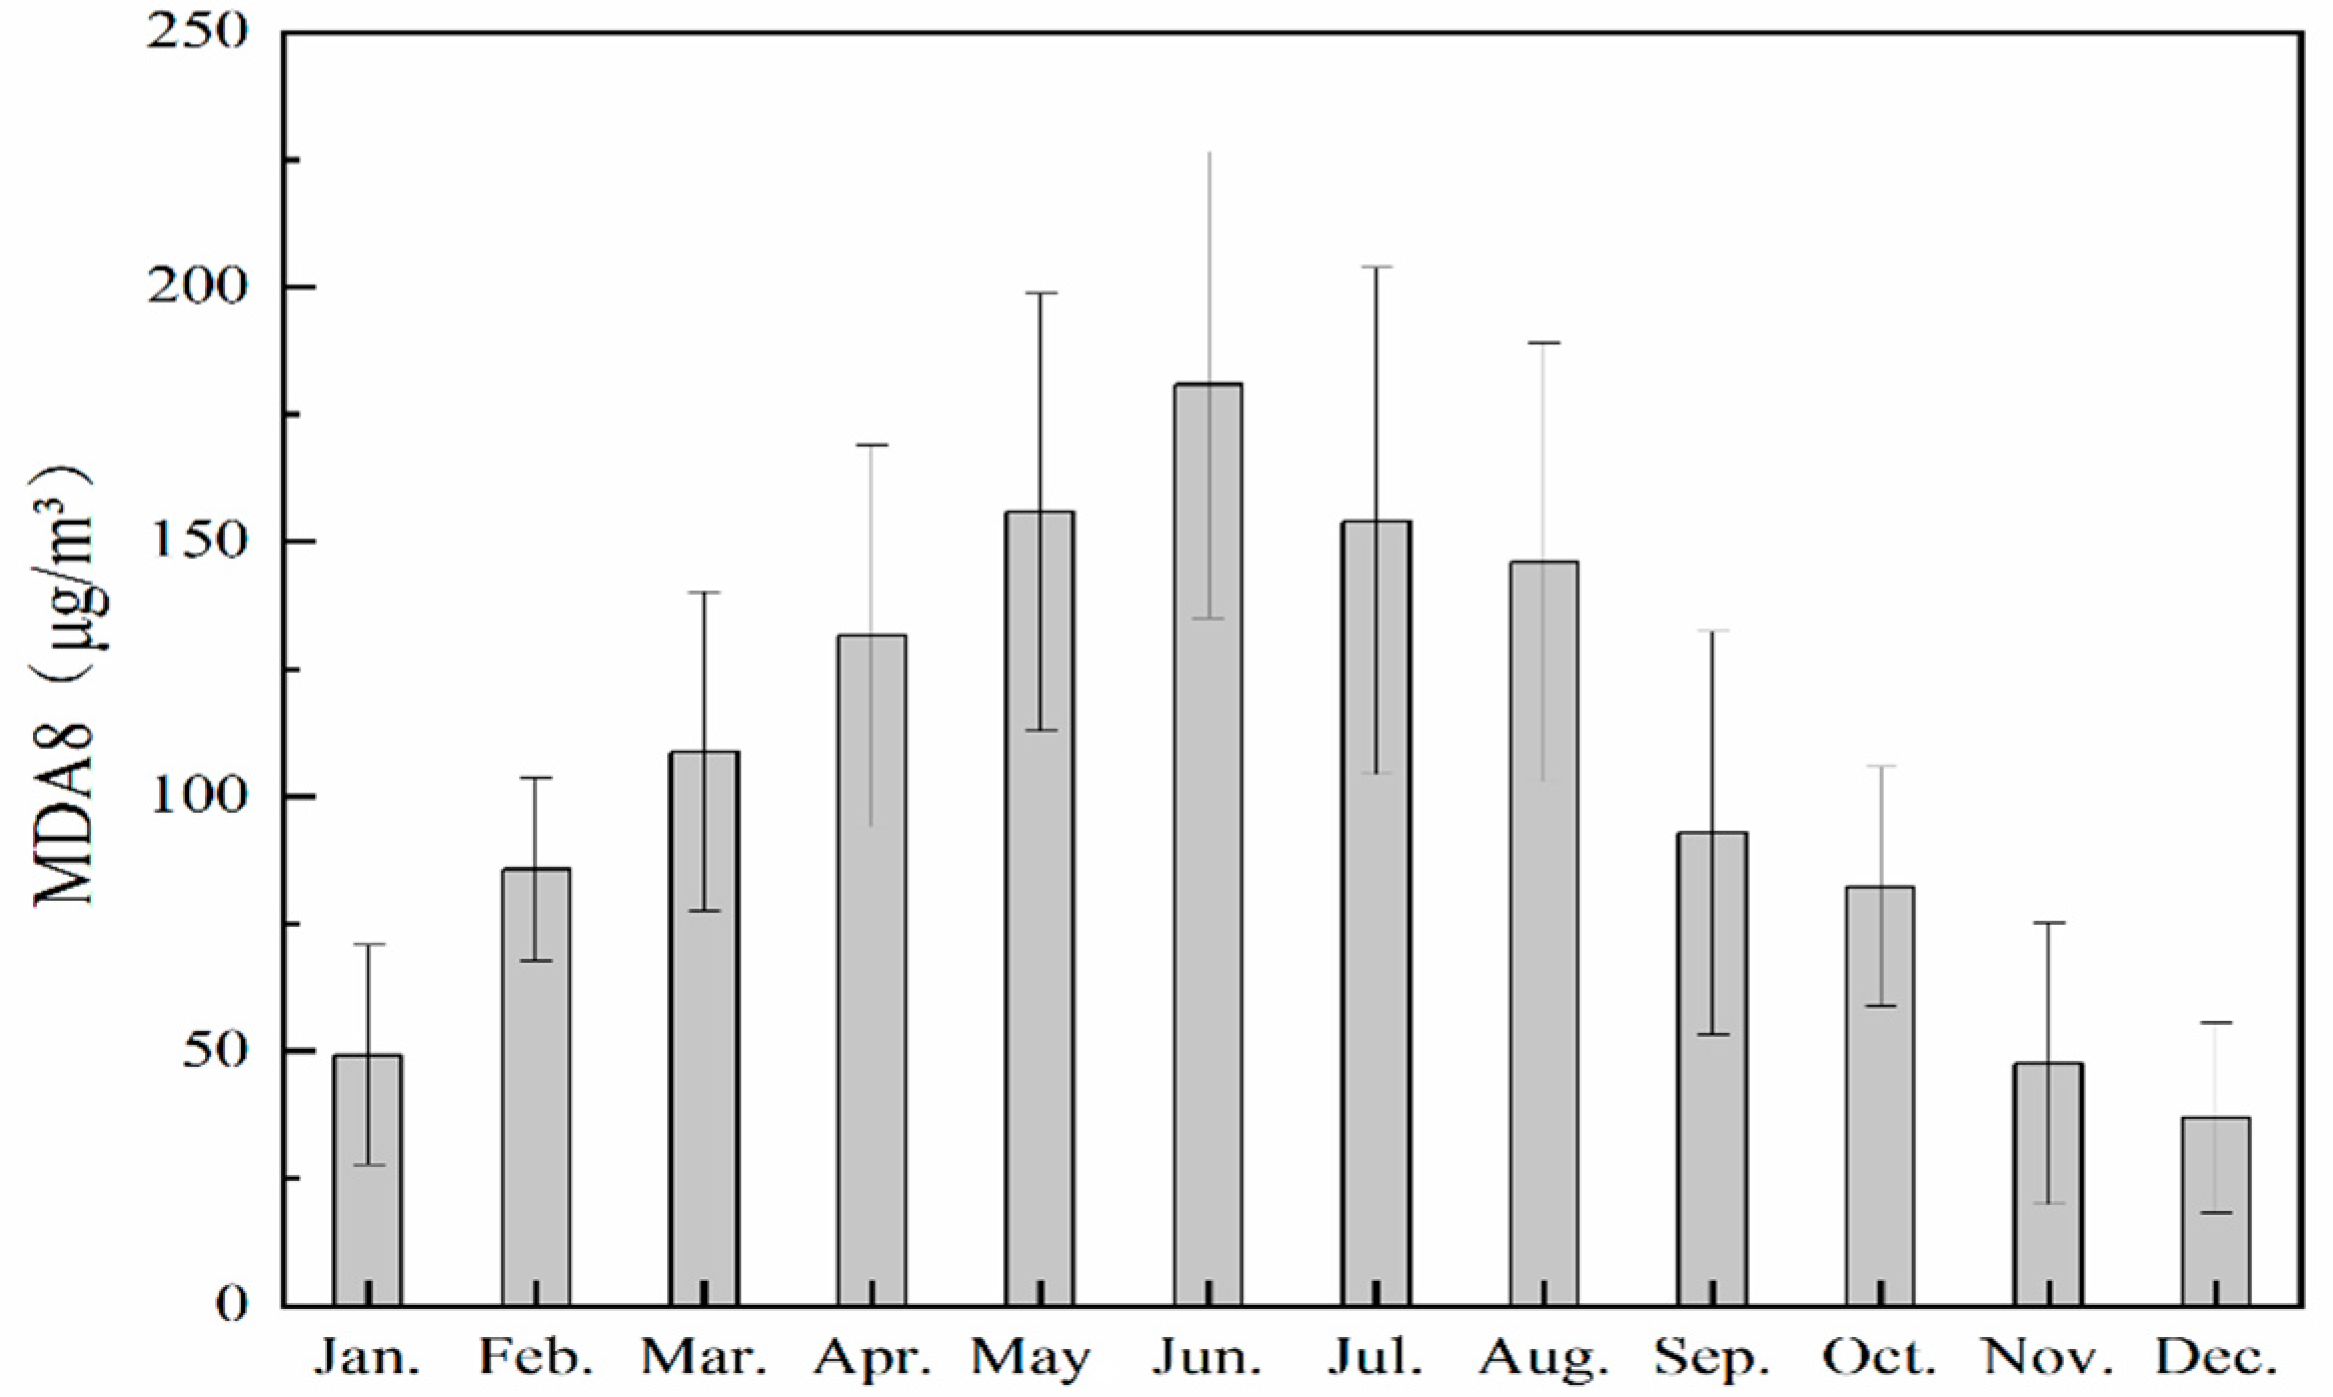
3.1.1. O3 Concentrations Standard and Variation of O3 Concentrations

In 2018, the maximum 1-h ozone concentrations in Taiyuan was 316 μg/m3, in this year, a total of 253 h of ozone concentrations exceeded the standard (Grade II Standard in Ambient Air Quality Standard (GB3095-2012) [9], the average 1-h ozone concentrations in this standard is 200 μg/m3). The maximum ozone concentrations of MDA8 for the whole year is 257 μg/m3, and the MDA8 for 72 days in this year exceeds the standard (Grade II Standard in Ambient Air Quality Standard (GB3095-2012), the concentrations of ozone MDA8 in this standard is 160 μg/m3). The ozone concentrations of Taiyuan City is the average ozone concentration of each monitoring site in Taiyuan City (except Shanglan; the Shanglan monitoring site is a background site and does not participate in the calculation of the average value of Taiyuan City).
Figure 3 shows the temporal variation and monthly average values of MDA8 from January to December, respectively. As can be seen from the two figures, MDA8 increased from March, reached its maximum in June, and began to decline significantly in mid-September. Overall, MDA8 was higher from April to August, and lower in January, November, and December. In addition, the temperature in July is usually the highest in a year, but due to more rainy days and less solar radiation, the average MDA8 in July was significantly lower than that in June.
In 2018, there were 70 days from April to August that the MDA8 exceeded the standard, with the largest number in June (20 days), and the smallest numbers in March and September (Table 1). Therefore, the data from April to August was selected to study the characteristics of O3 pollution.

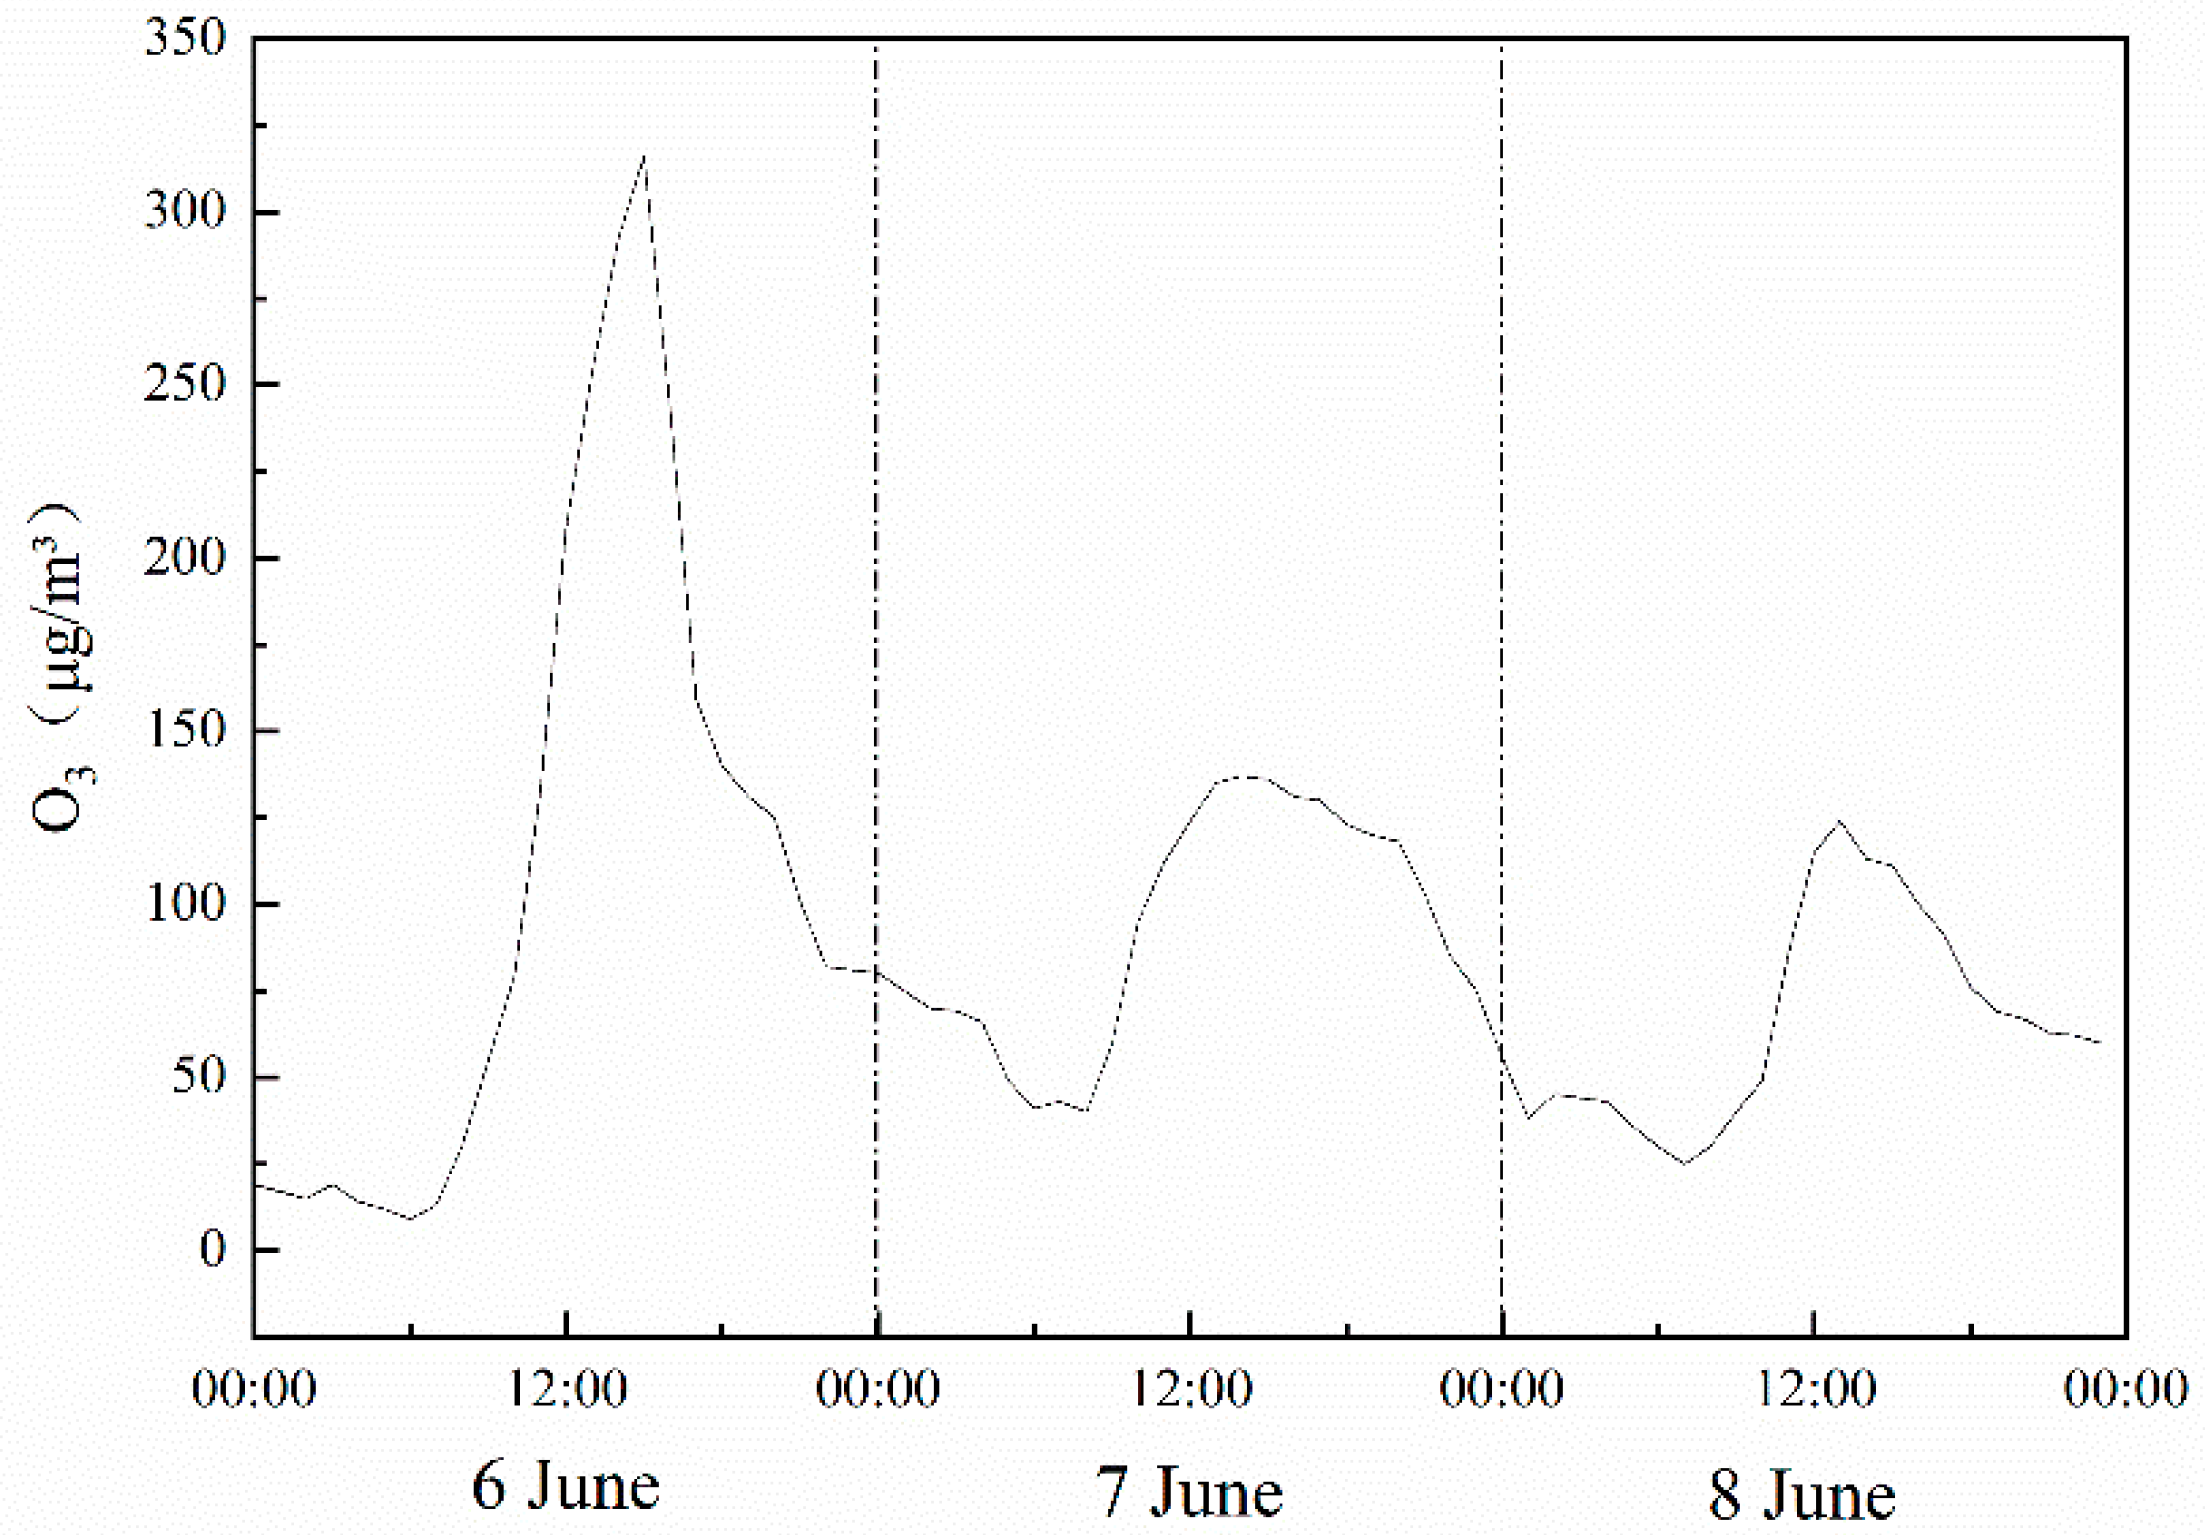
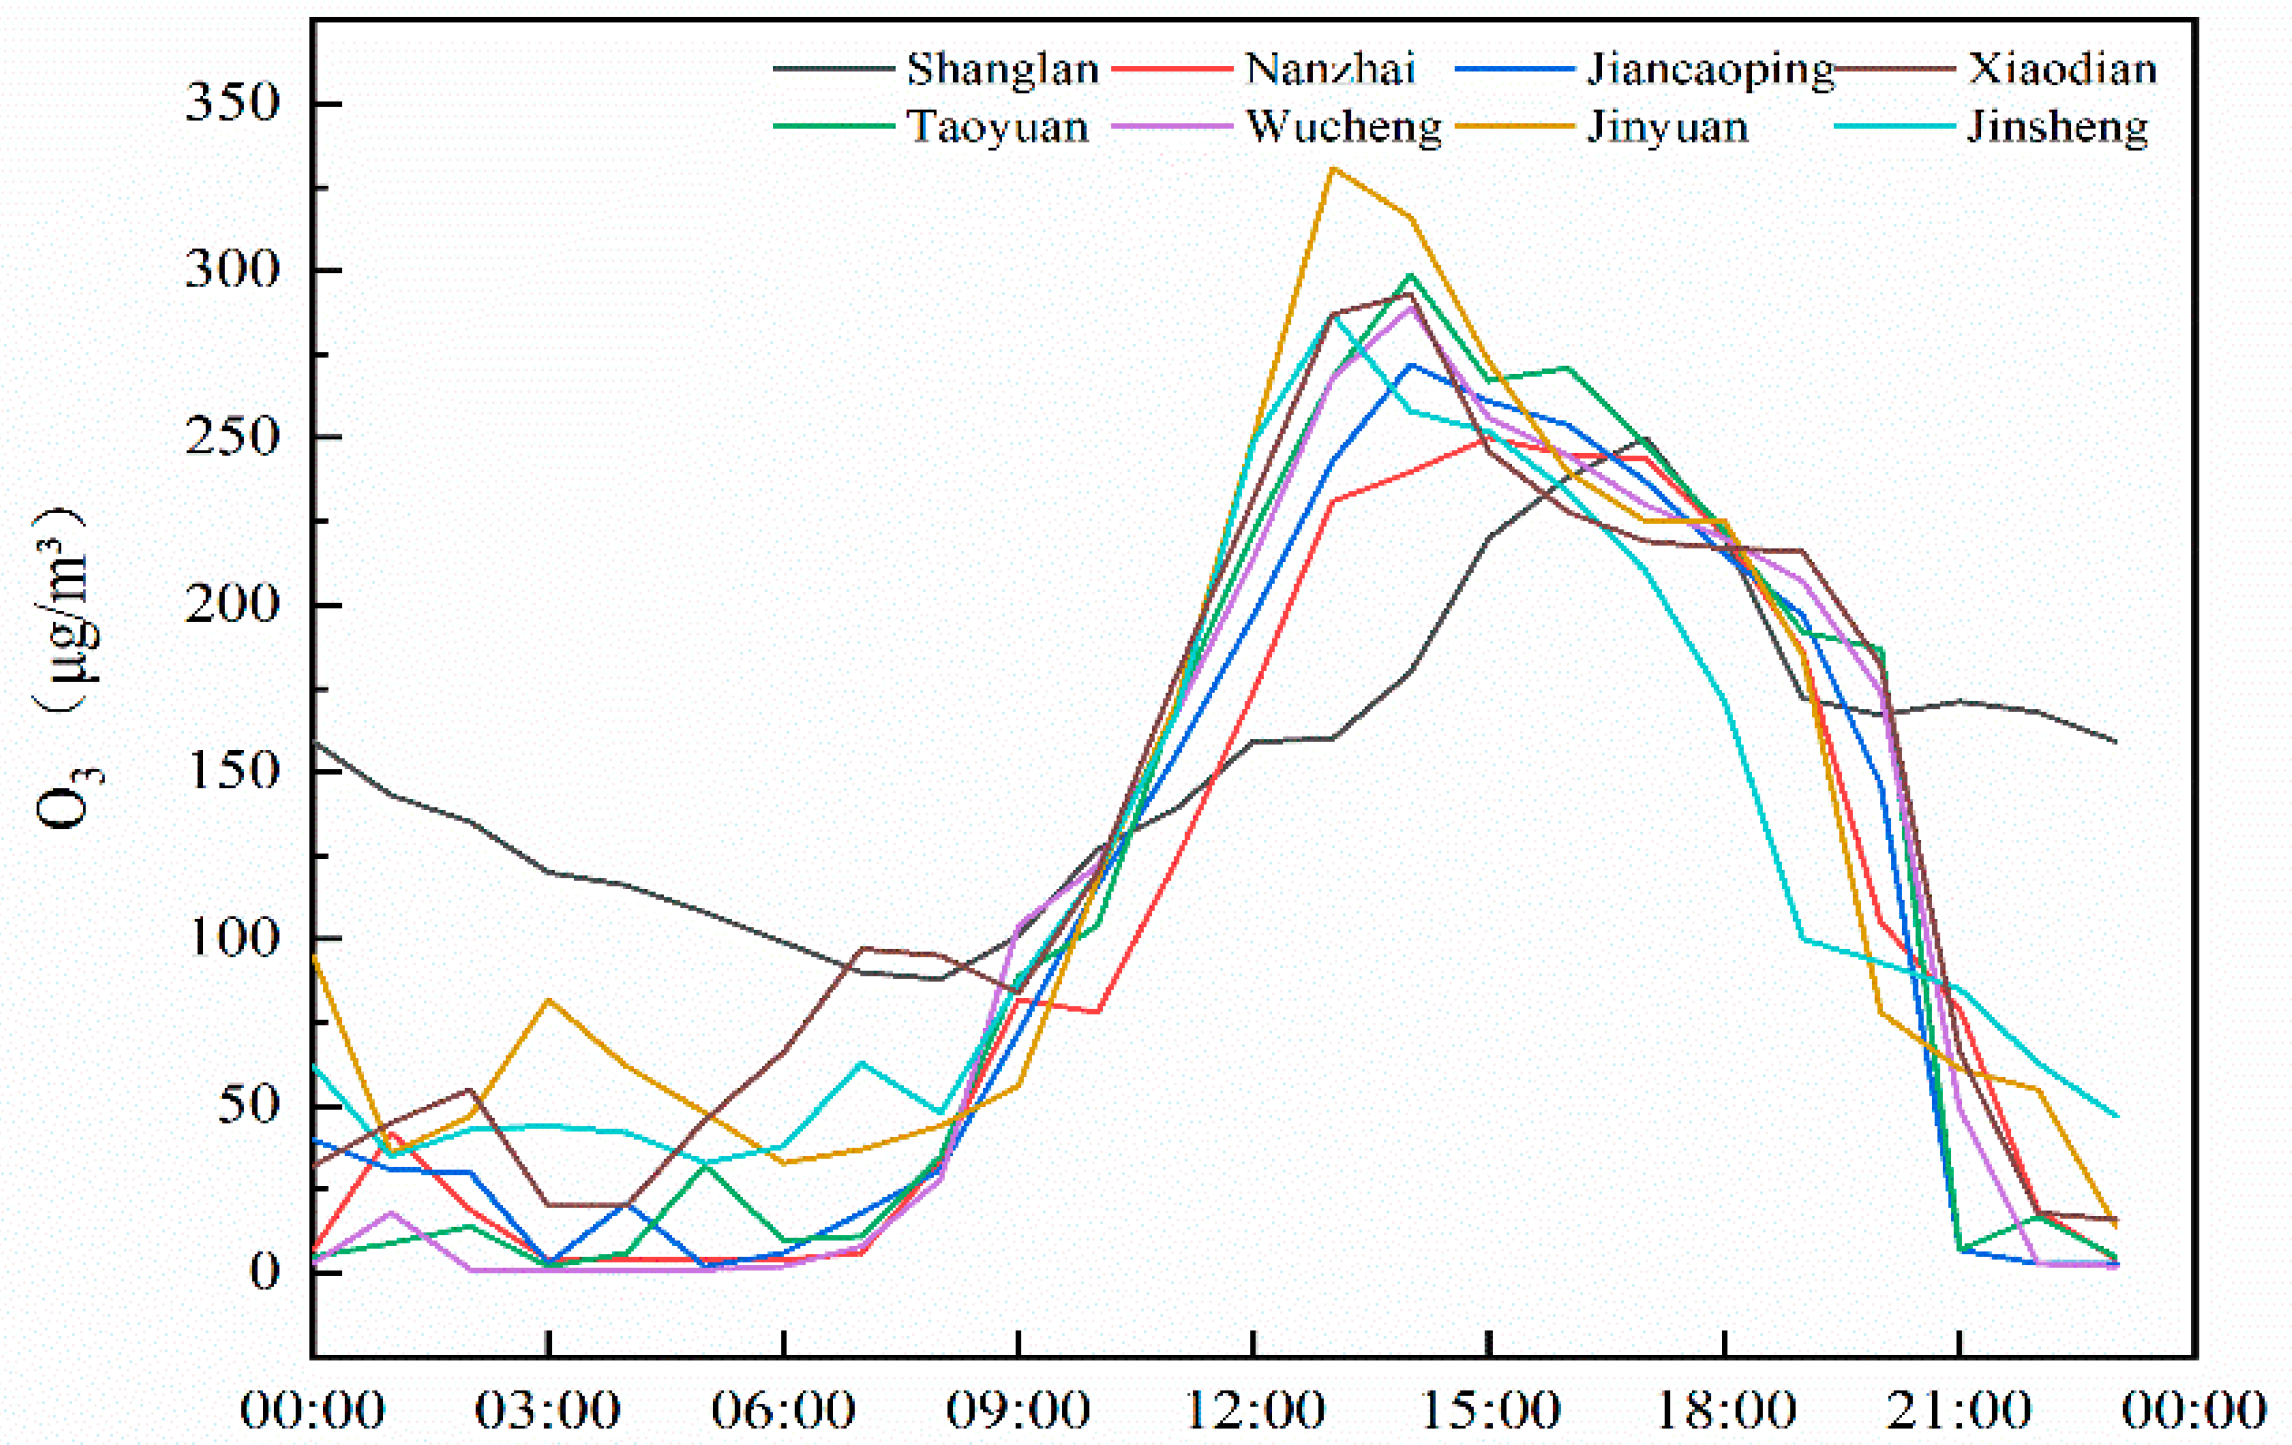
3.1.2. Diurnal Variation of O3 Concentration

The O3 concentration generally shows a typical “single peak” diurnal variation on sunny days. It usually has the lowest concentrations at 7:00, due to the weak process of precursor conversion to ozone at nighttime and the strong ozone depletion effect caused by NO titration and dry sedimentation [10,11,12]. It reached its maximum around 13: 00–15: 00, and decreased from 17: 00 or 18: 00 (Figure 4), this is because O3 is a secondary product of atmospheric photochemical reactions, and high air temperature and high intensity of solar radiation are conducive to its generation. In addition, mixing ozone rich air from the free troposphere into the ozone depleted surface layer in the morning, as the nocturnal stable layer breaks up, it is also a significant factor in the shape of the diurnal cycle [13]. On most cloudy days, the O3 concentration exhibited the same diurnal variation as on sunny days, except that its maximum was significantly lower than that of sunny days (Figure 4), which was due to less solar radiation and lower temperature.

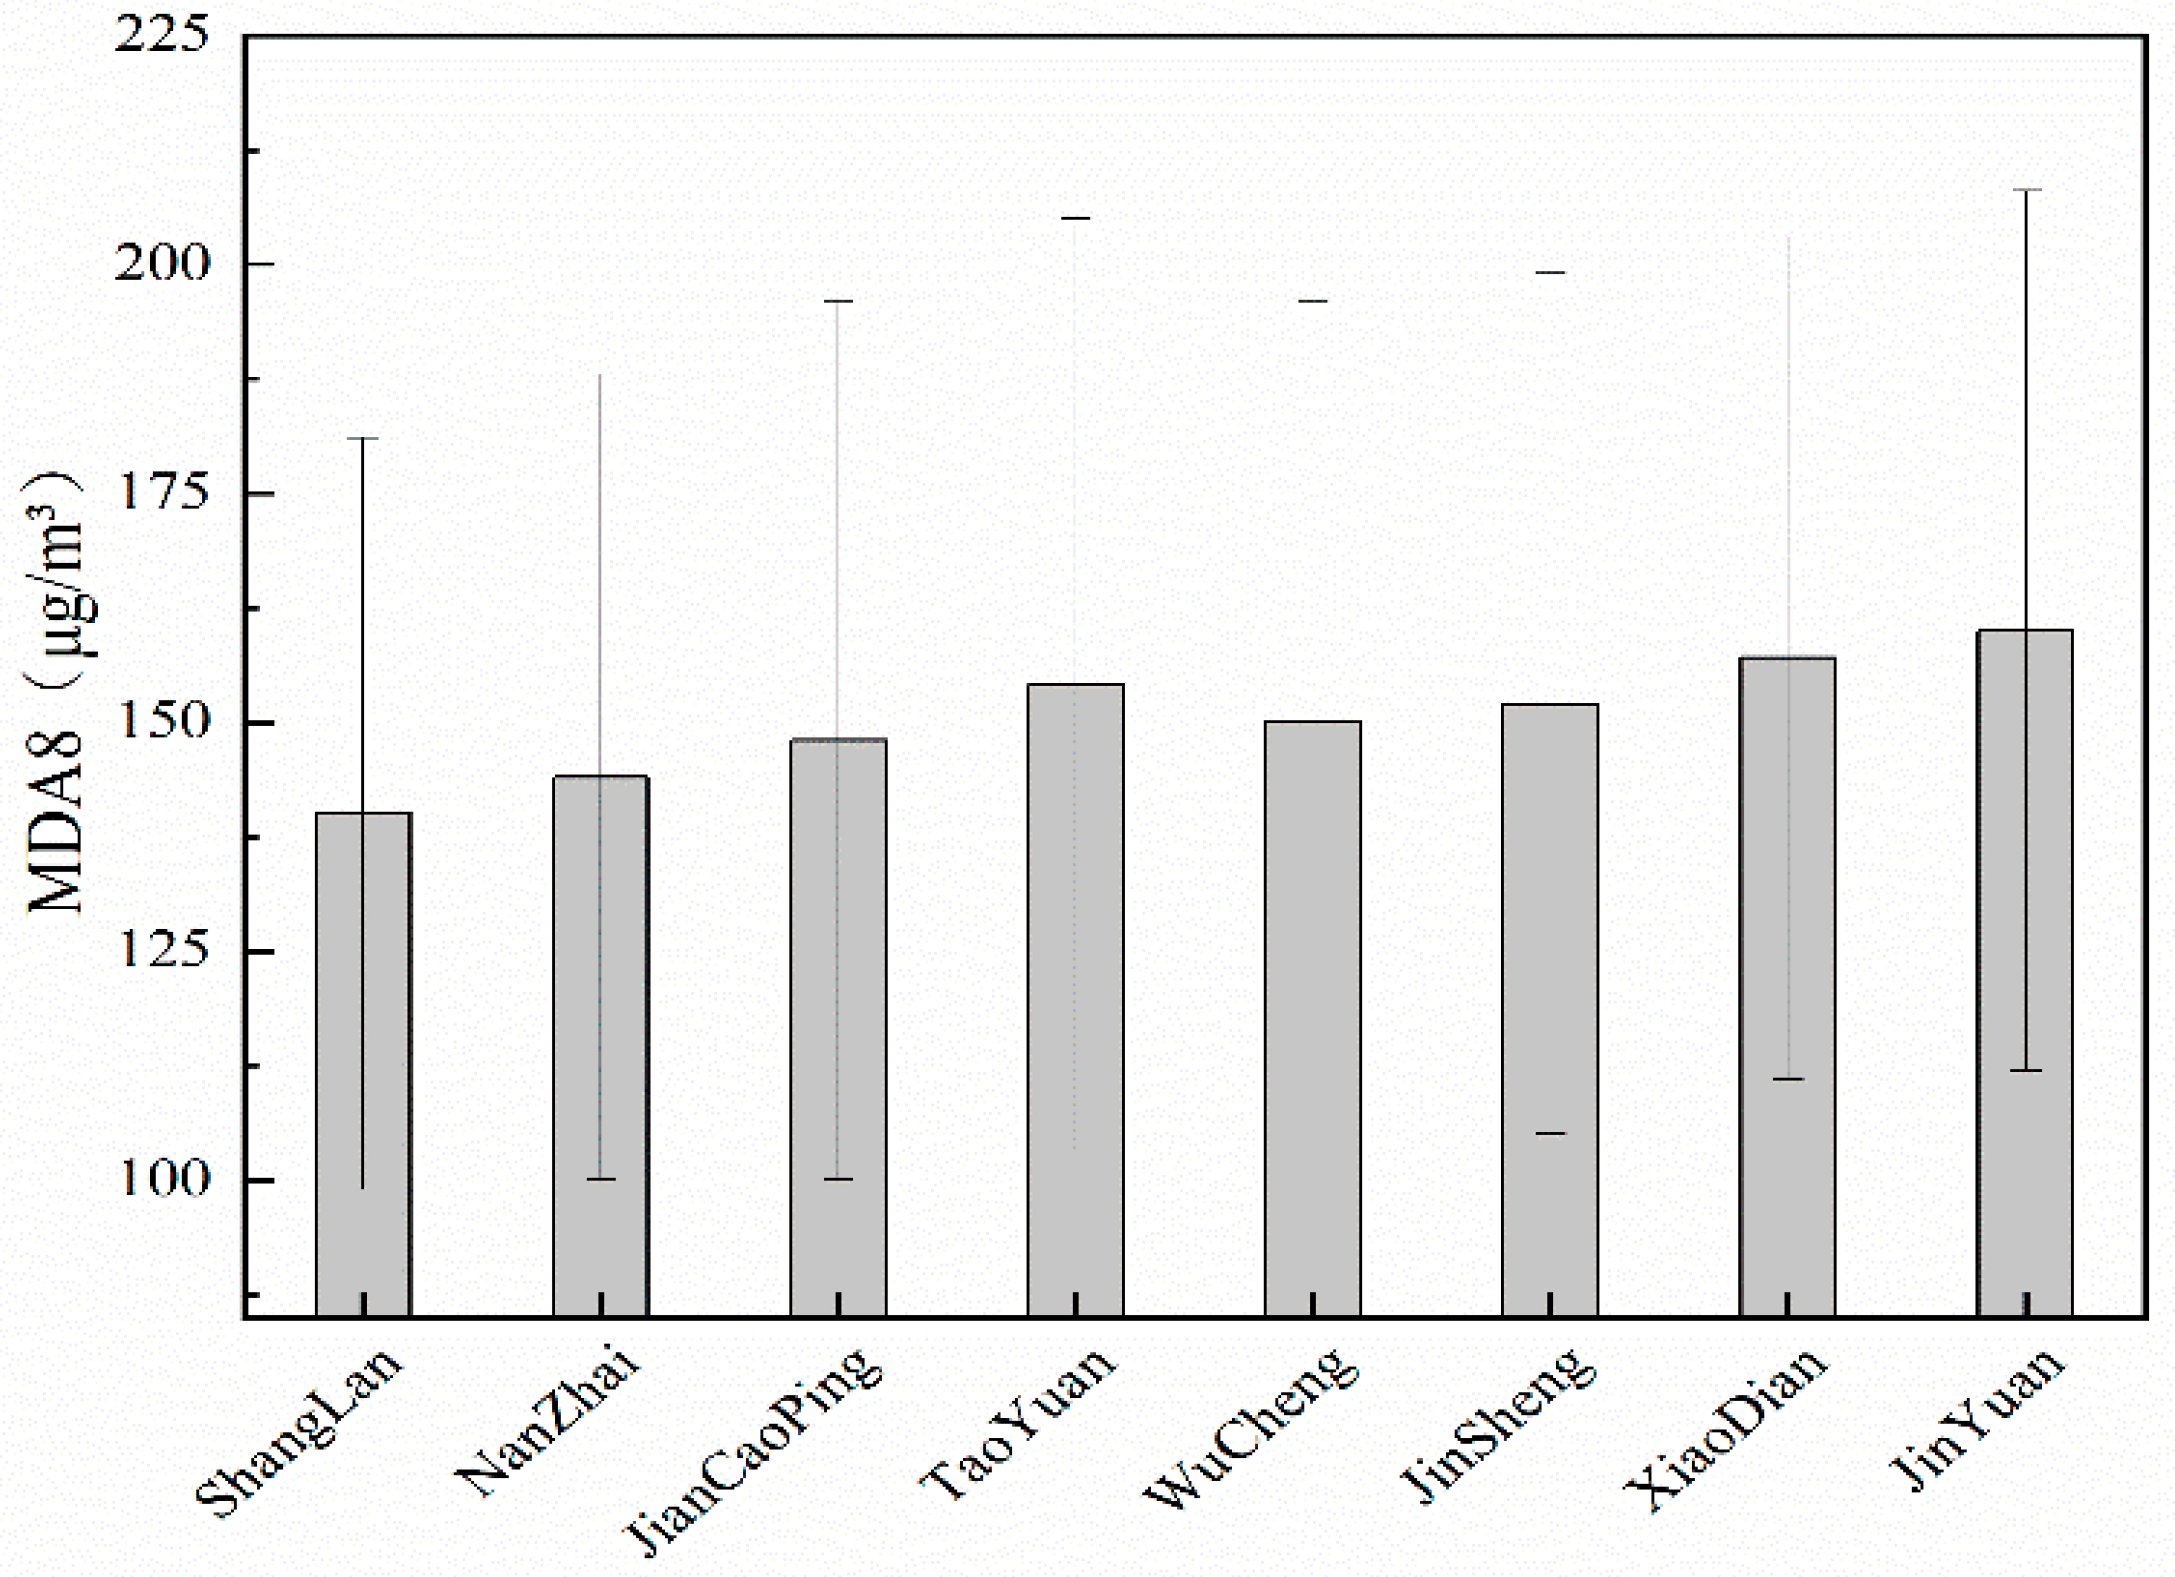
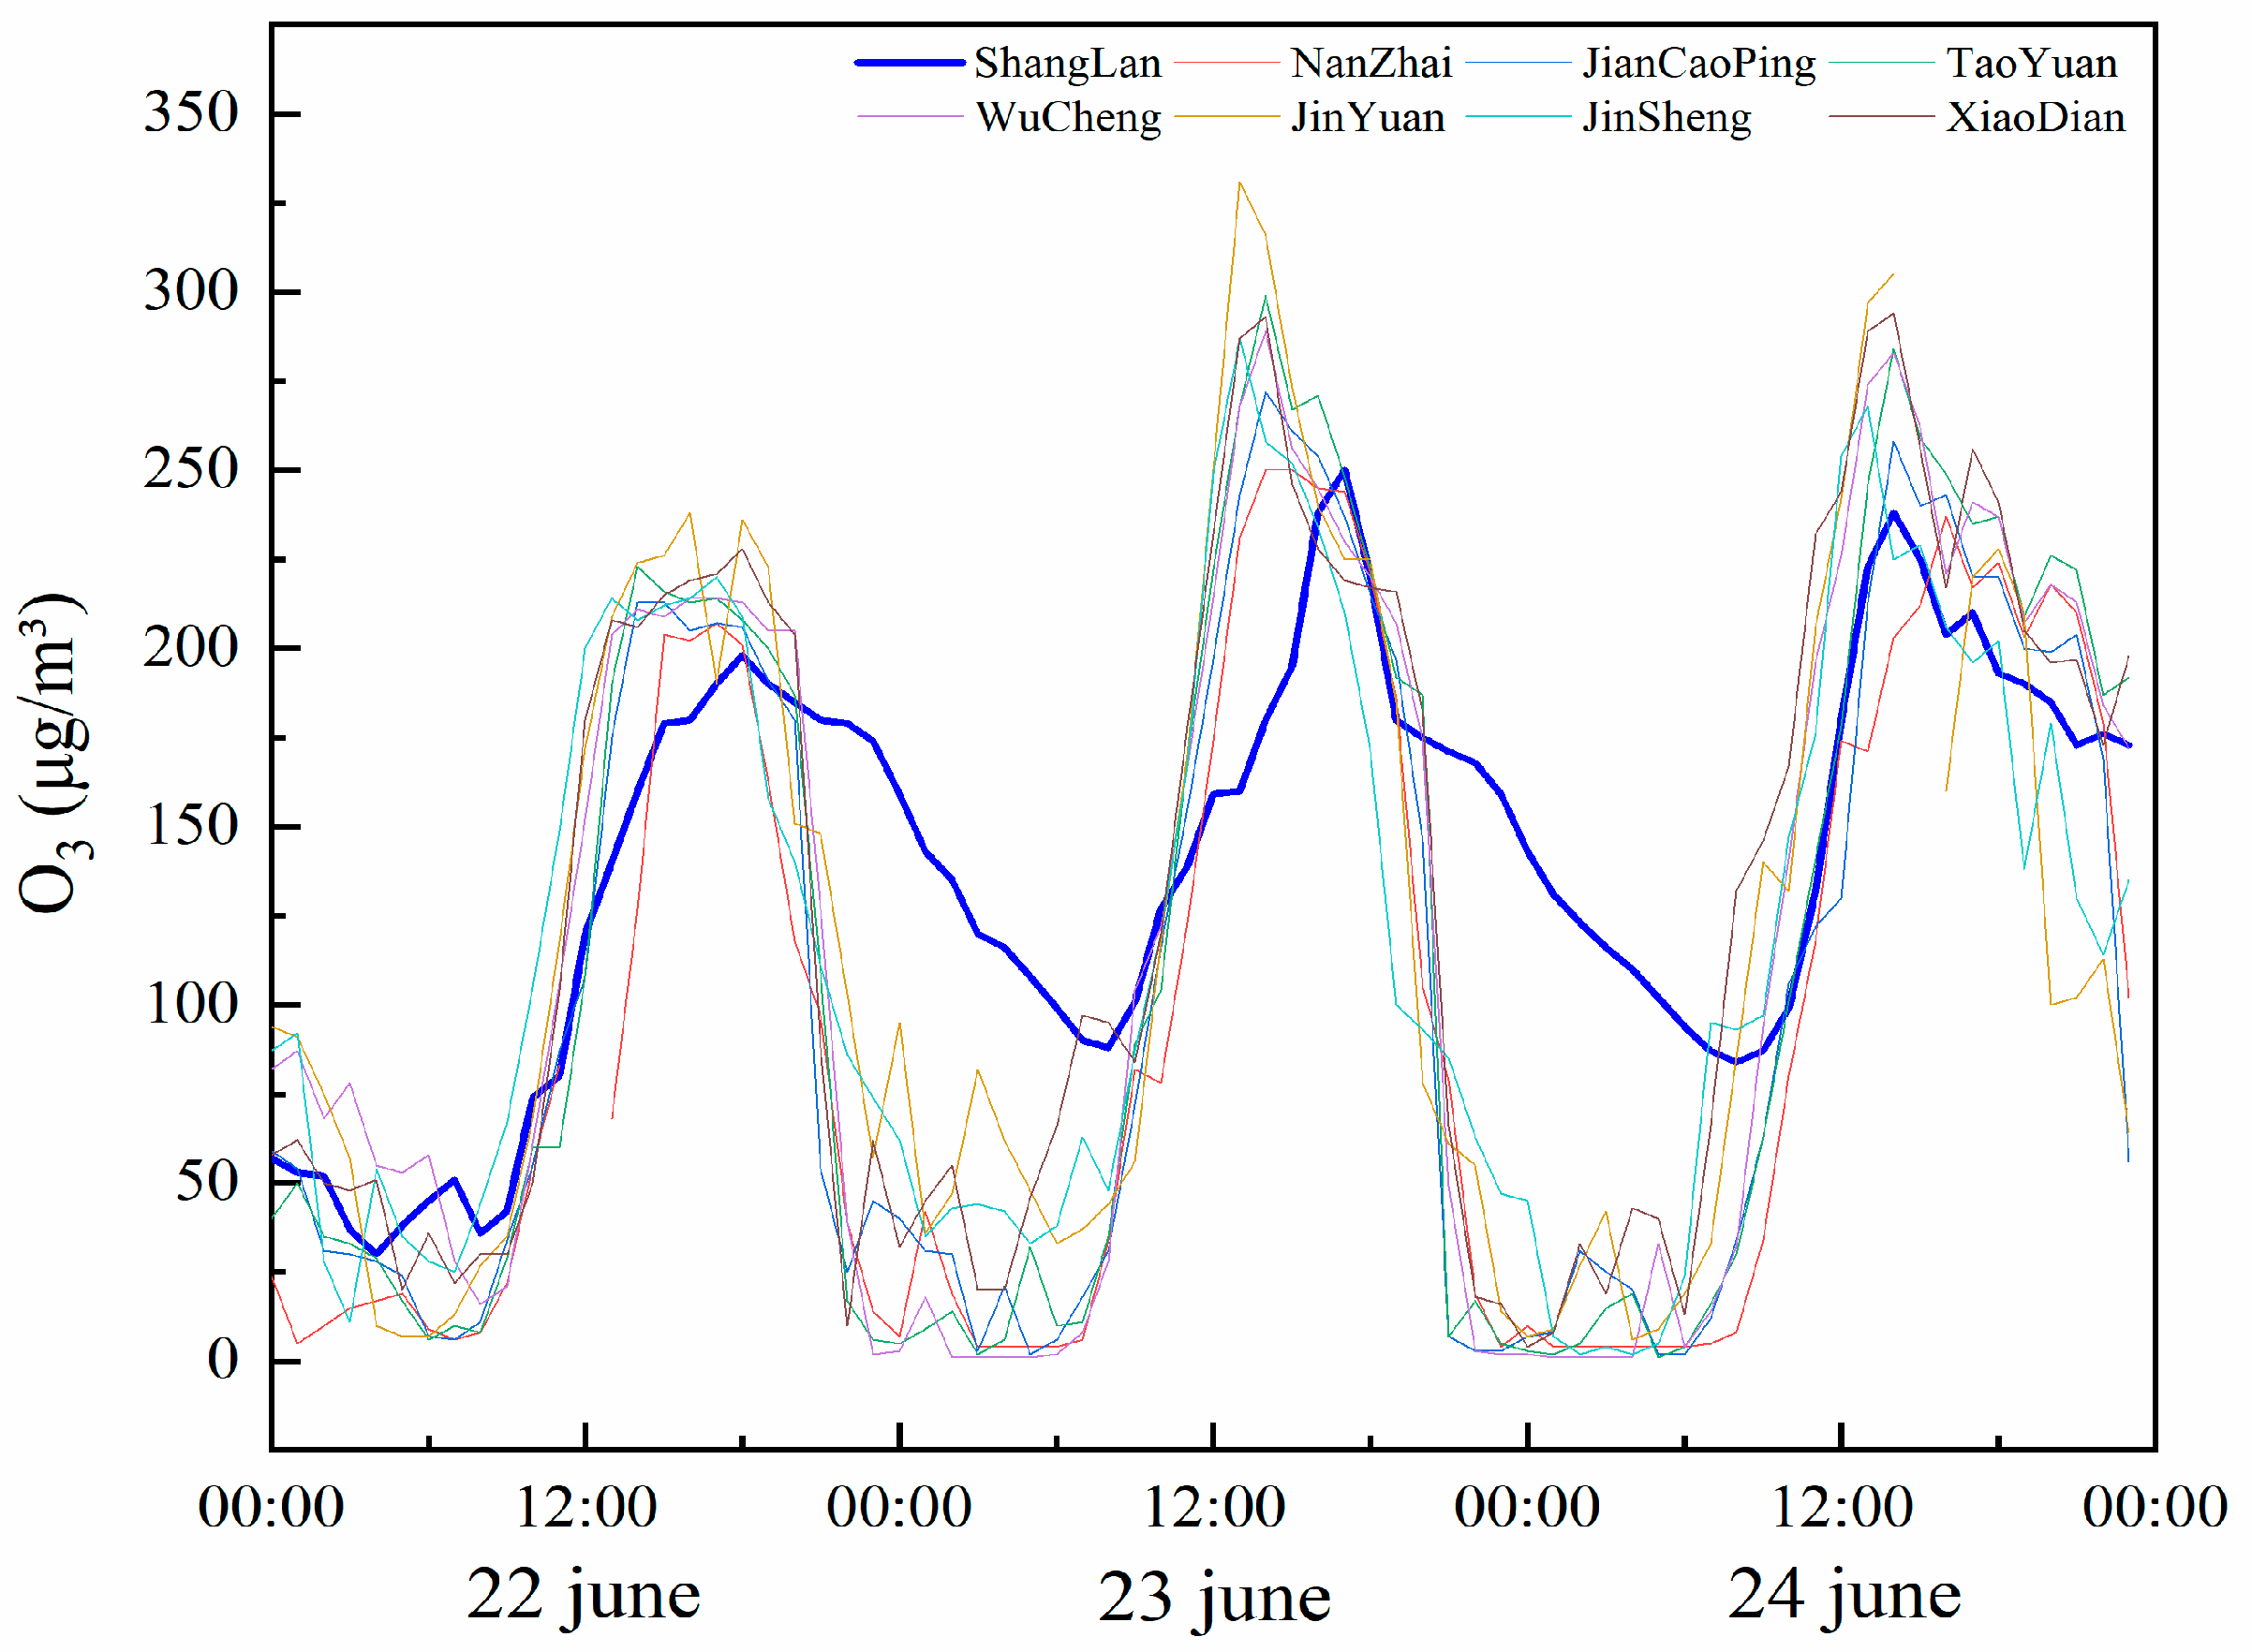
3.1.3. Variation of MDA8 at Each Monitoring Site and Their Contributions to the Average of MDA8 in Taiyuan

Figure 5 shows the average of MDA8 at each monitoring site from April to August. The contribution of each monitoring site to the MDA8 is different under different levels of O3 pollution. When the O3 pollution was slight, Taoyuan had relatively high contribution (Figure 6a). When the O3 pollution was moderate, Jinyuan contributed the most to the pollution (Figure 6b). Jinyuan to the southwest of the urban area of Taiyuan and Xiaodian to the south are on the air pollution transmission routes from Qingxu County, Lyuliang City, and Jinzhong City to Taiyuan. Due to the impact of transported air masses, the ozone reaches the peak at different times for each site, as evidenced by Figure 7, showing the ozone diurnal variation at each monitoring site on June 23. The Jinyuan and Jinsheng sites are closer, and the ozone concentration peaks reached at 13:00. For the Xiaodian, Jiancaoping, Taoyuan, and Wucheng sites, the ozone concentration peaks were reached at 14:00. Nanzhai and Shanglan are located in the northernmost part, Nanzhai reached peak at 15:00, and Shanglan reached peak time at 17:00. There are many factories, including coking and steel plants in Qingxu County and Lvliang City, to the southwest of Jinyuan, and in Jinzhong City, which is located to the south of Xiaodian. Location of these cities are shown in Figure 14. These plants emit large amounts of the O3 precursors: NOx and VOCs. When winds blow from south or southwest, these precursors are transported to Taiyuan’s urban area, leading to O3 formation through chemical reactions. During the transport, or after they reach Taiyuan, O3 can be generated through chemical reactions, increasing O3 concentrations in the urban area of Taiyuan. Geng. F et al. [14] also observed that polluted air mass transport caused an increase of ozone concentrations in Shanghai.

3.2. Study on the Causes of O3 Pollution in Taiyuan
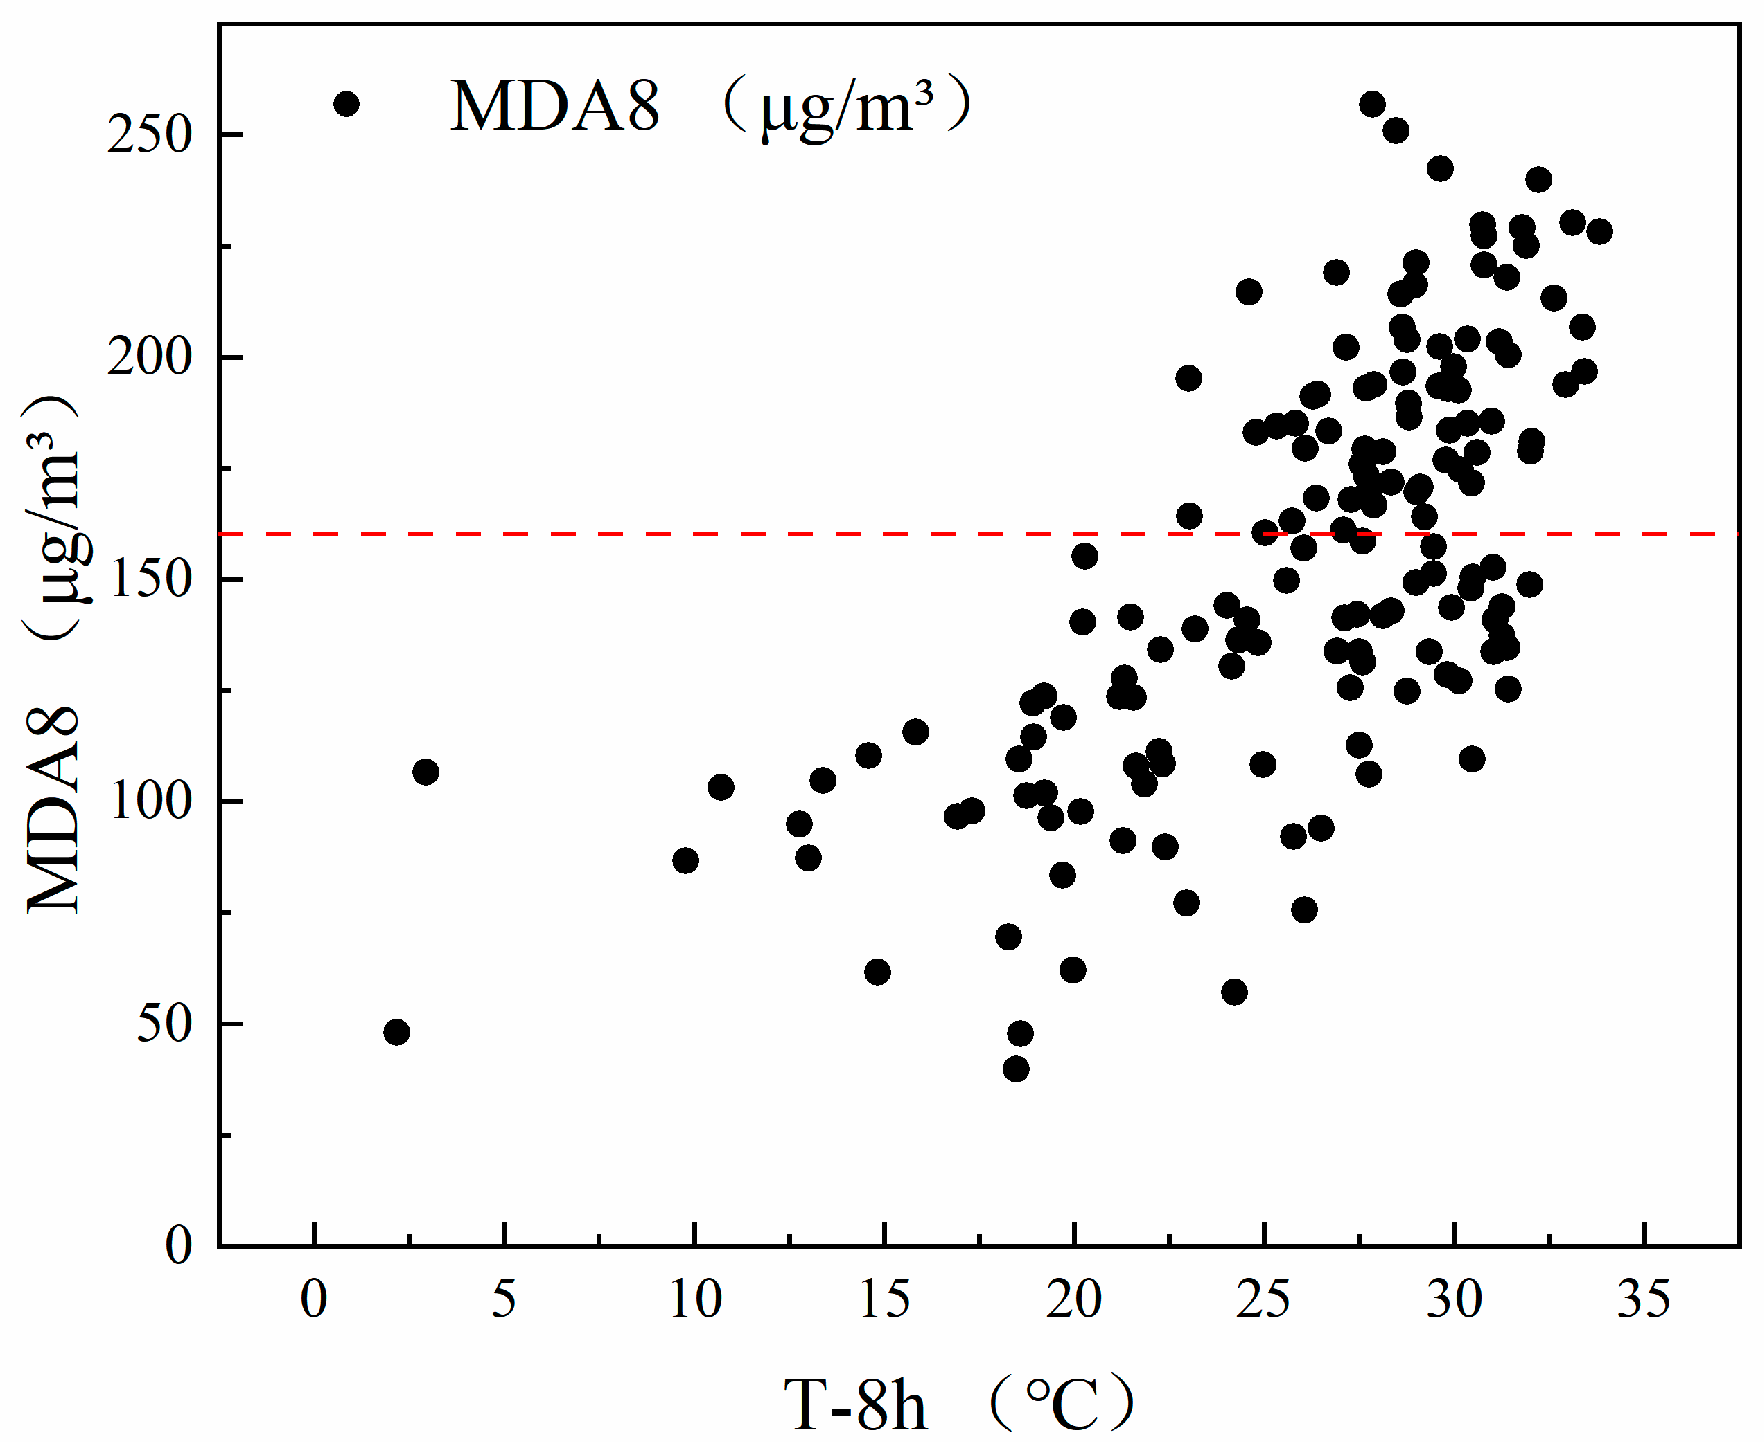
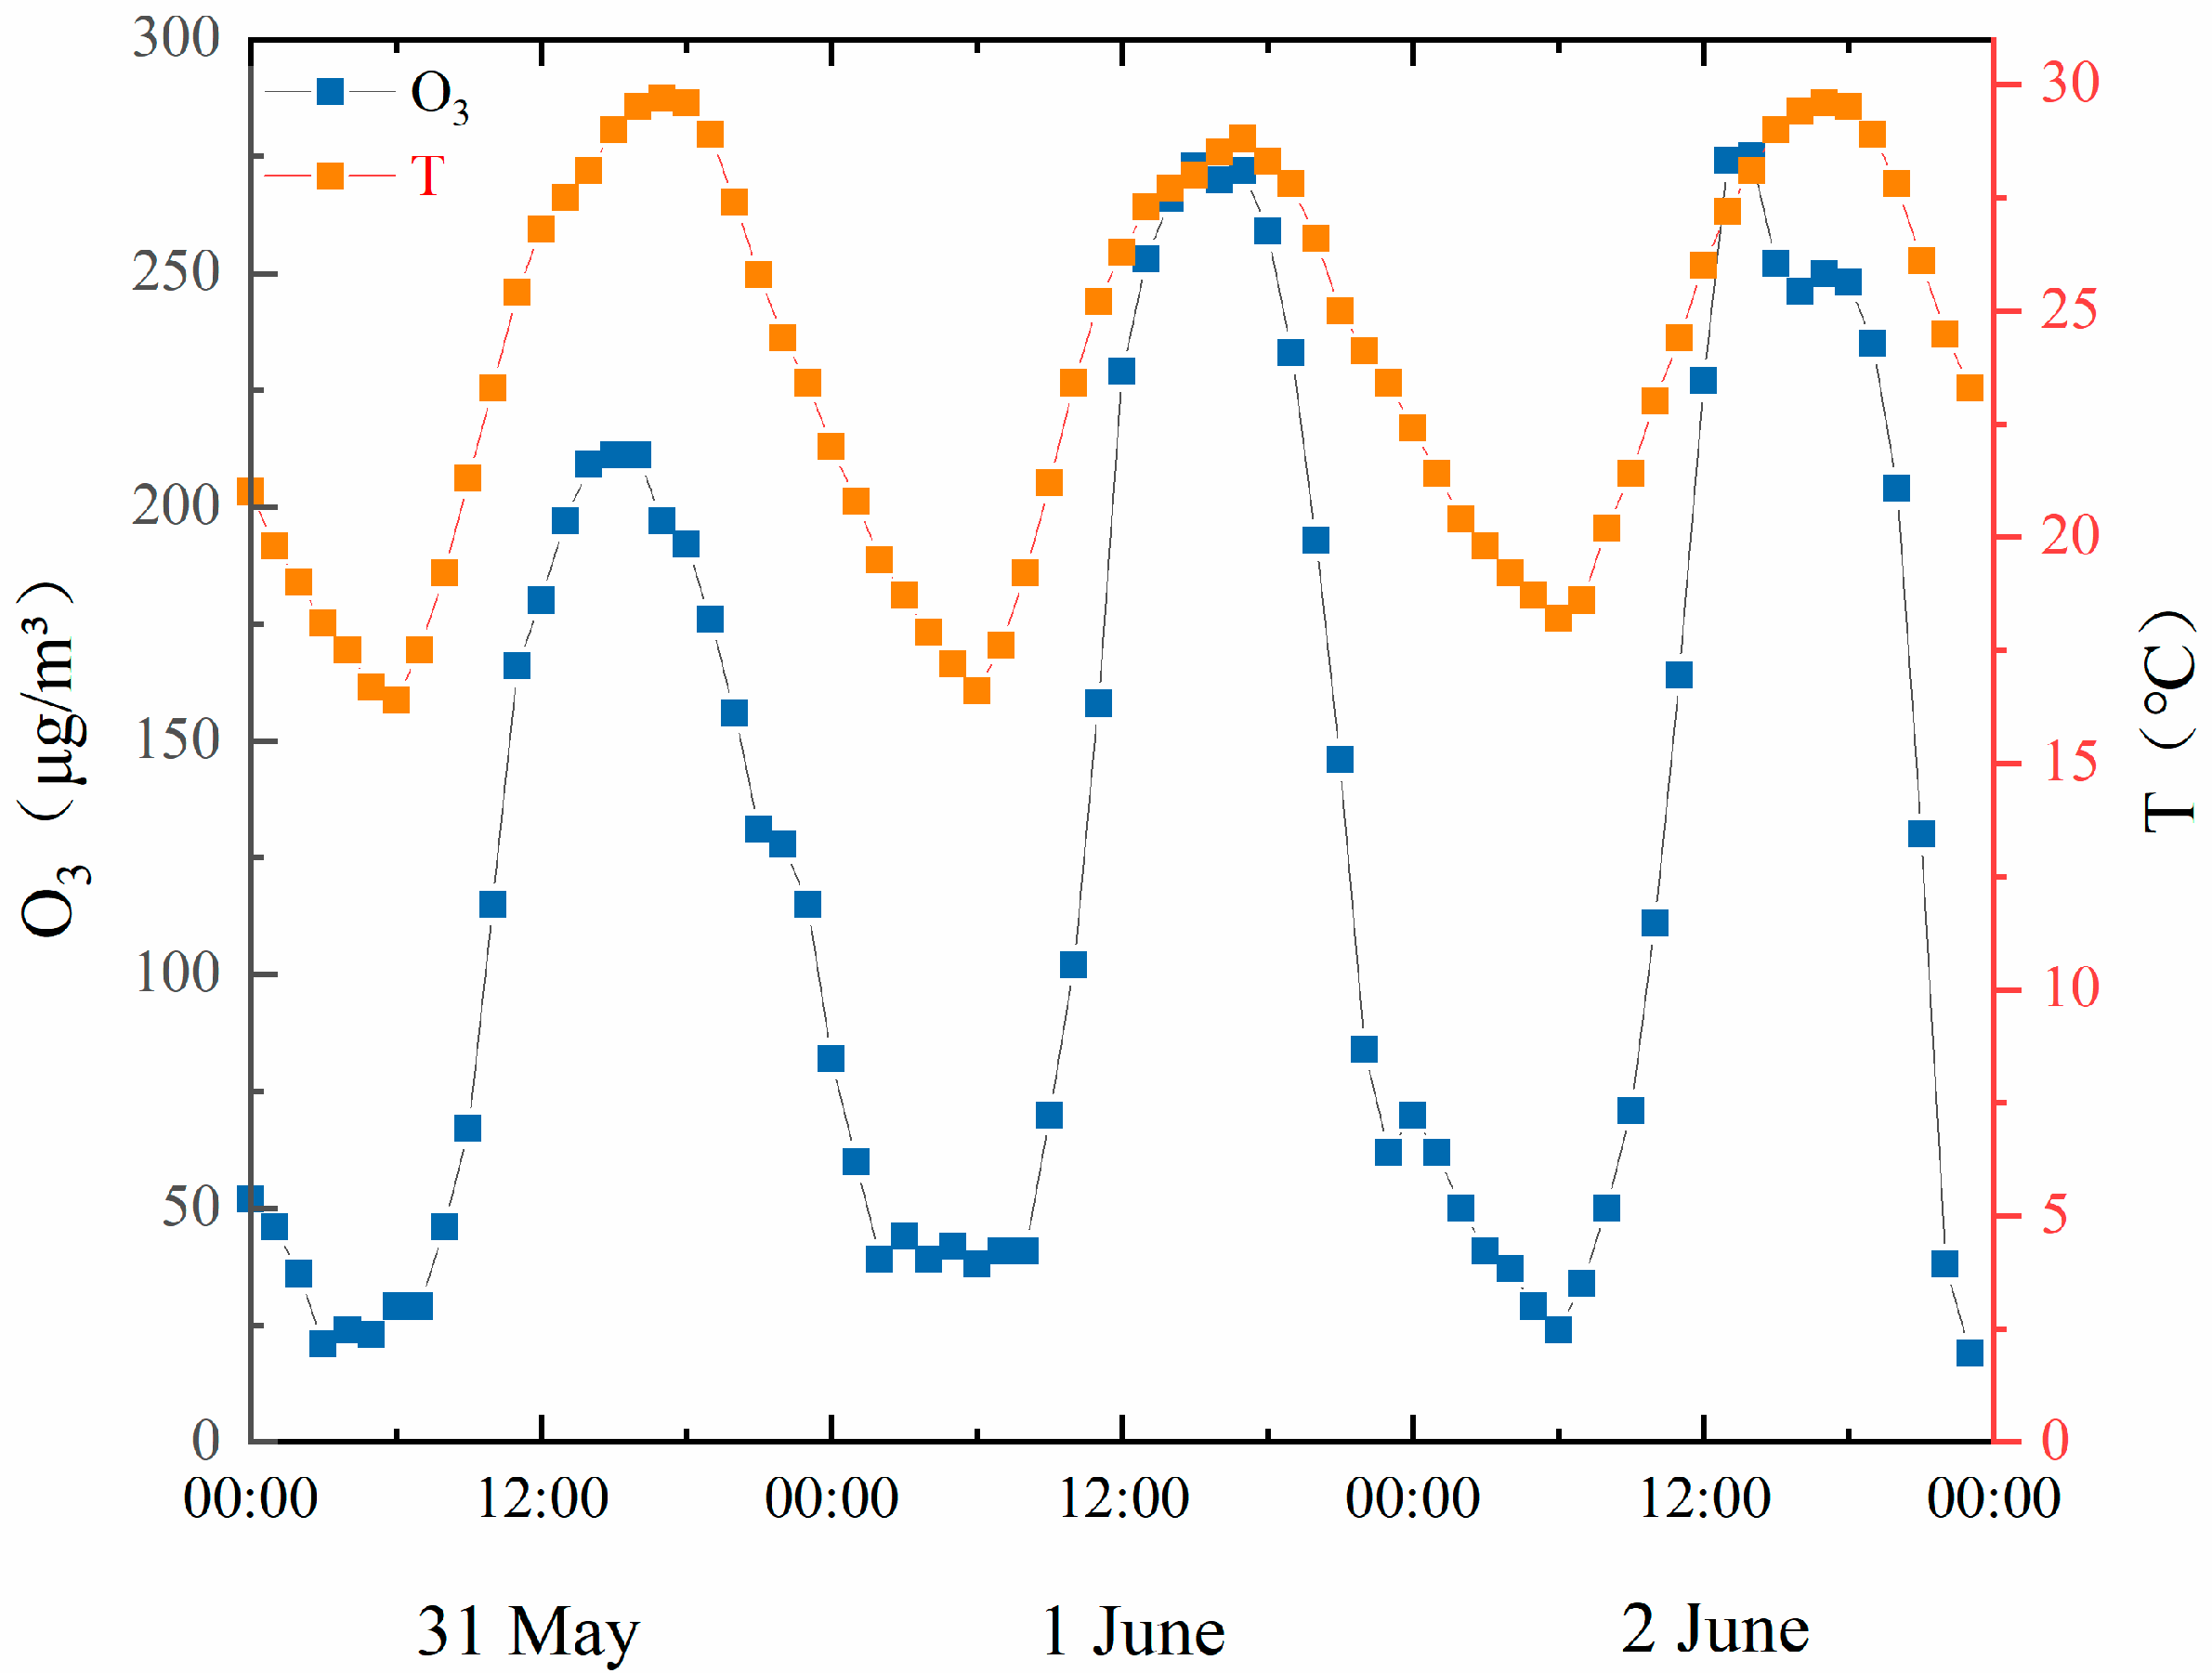
3.2.1. Temperature

Figure 8 shows the correlation between MDA8 and the 8-h temperature value (T-8h) in the same period. As can be seen from the scatter plot, there is a strong positive correlation between ozone concentration and temperature. Because ozone is the product of a photochemical reaction between precursors, such as NOx and VOCs in the atmosphere, an increase in temperature contributes toward accelerating the production of ozone, as well as promotes the emission of VOCs from plants, both of which contribute to the increase of O3 production. The red-dotted line in the figure indicates the concentrations standard value of MDA8 is 160 μg/m3.

3.2.2. Air Pressure

Normally, the O3 concentration increases with temperature, but sometimes the O3 concentration may be high when the temperature is relatively low (Figure 9). For example, between 31 May and 2 June 2018, the highest temperature was only 28.5 °C, but the O3 concentration showed a high value of 273 μg/m3. The same phenomenon also appeared during 8–10 May and 14–16 June in 2018.
The Taiyuan area began to be affected by high pressure from 31 May, and on 1 and 2 June the high-pressure air mass gradually moved southward. During this period, the city of Taiyuan was at the center of the high pressure, and the structure of the atmospheric boundary layer was rather stable. This was not conducive to the diffusion of O3; thus, causing gradual accumulation of O3, with the result that the O3 concentration turned out to be the highest on 1 and 2 June (Figure 9). Wang et al. [15] obtained similar results in a study conducted in Fuzhou from 2009 to 2010, and the phenomenon was observed during 8–10 May and 14–16 June in 2018.

3.2.3. Topography

The daily variation of overall O3 concentration at eight sites was basically consistent. However, it was found that the nighttime O3 concentration was sometimes high at Shanglan when the other 7 sites were low (Figure 10).
The Shanglan site (38°00′38.8″ N, 112°26′2.5″ E) is located on a building of Shanglan Village in Taiyuan. Just 150 m north of it is Erlong Mountain (about 960 m above sea level), and Shanglan is at the foot of the mountain. It is known that the weather in the mountains is quite different from that in the plains. The mountain areas are affected by valley winds during the day and by mountain winds at night [16,17]. This is because the air above the mountain slope is more affected by radiation cooling at night than at the bottom of the mountain, and its temperature drops faster. Therefore, the cool air above the mountain slope will flow down to the bottom. The warm air above the valley is lifted, creating mountain winds that blow from the slopes to the bottom [18]. Generally, mountain winds are formed when the wind speed at night is greater than 1.8 m/s [19,20].
The height of the boundary layer at night usually drops to about 900–1000 m [21]. The altitude of Erlong Mountain in the north of Shanglan site is near 1000 m, so its peak is sometimes in the boundary layer at night. In addition, the wind often blows from the north at night at Shanglan, with 55% of the wind speed over 2.0 m/s in April through August (Figure 11). As a result, atmospheric convection is more active at night and mountain winds are likely to occur. Since the O3 concentration increases with the height, the O3 concentration at the top of Erlong Mountain is higher than that at the foot of the mountain. Thus, the mountain wind can transport the high concentration O3 from the top of Erlong Mountain to Shanglan, resulting in an increase in O3 concentration there at night. In addition, the concentration of NO at Shanglan is very low at night, which is close to zero and far lower than that at the other monitoring sites (Figure 12). The low concentration of NO reduces the titration of O3, which leads to increased O3 concentration at Shanglan at night. Wang et al. [21] found that the O3 concentration at the top of Tai Mao Mountain (1000 m high) in Hong Kong was much higher than that at the foot of the mountain at night. This was thought to be caused by vertical diffusion bringing high O3 concentration in the middle of boundary layer to the top of Tai Mao Mountain, and the weak titration of low NO concentration at the top of the mountain on O3 [22]. Ren et al. [23] observed that the concentration of peroxides was higher at night than during the day on Mount Tai. They considered it to be the result of the reduction of boundary layer depth combined with the mountain wind at night.

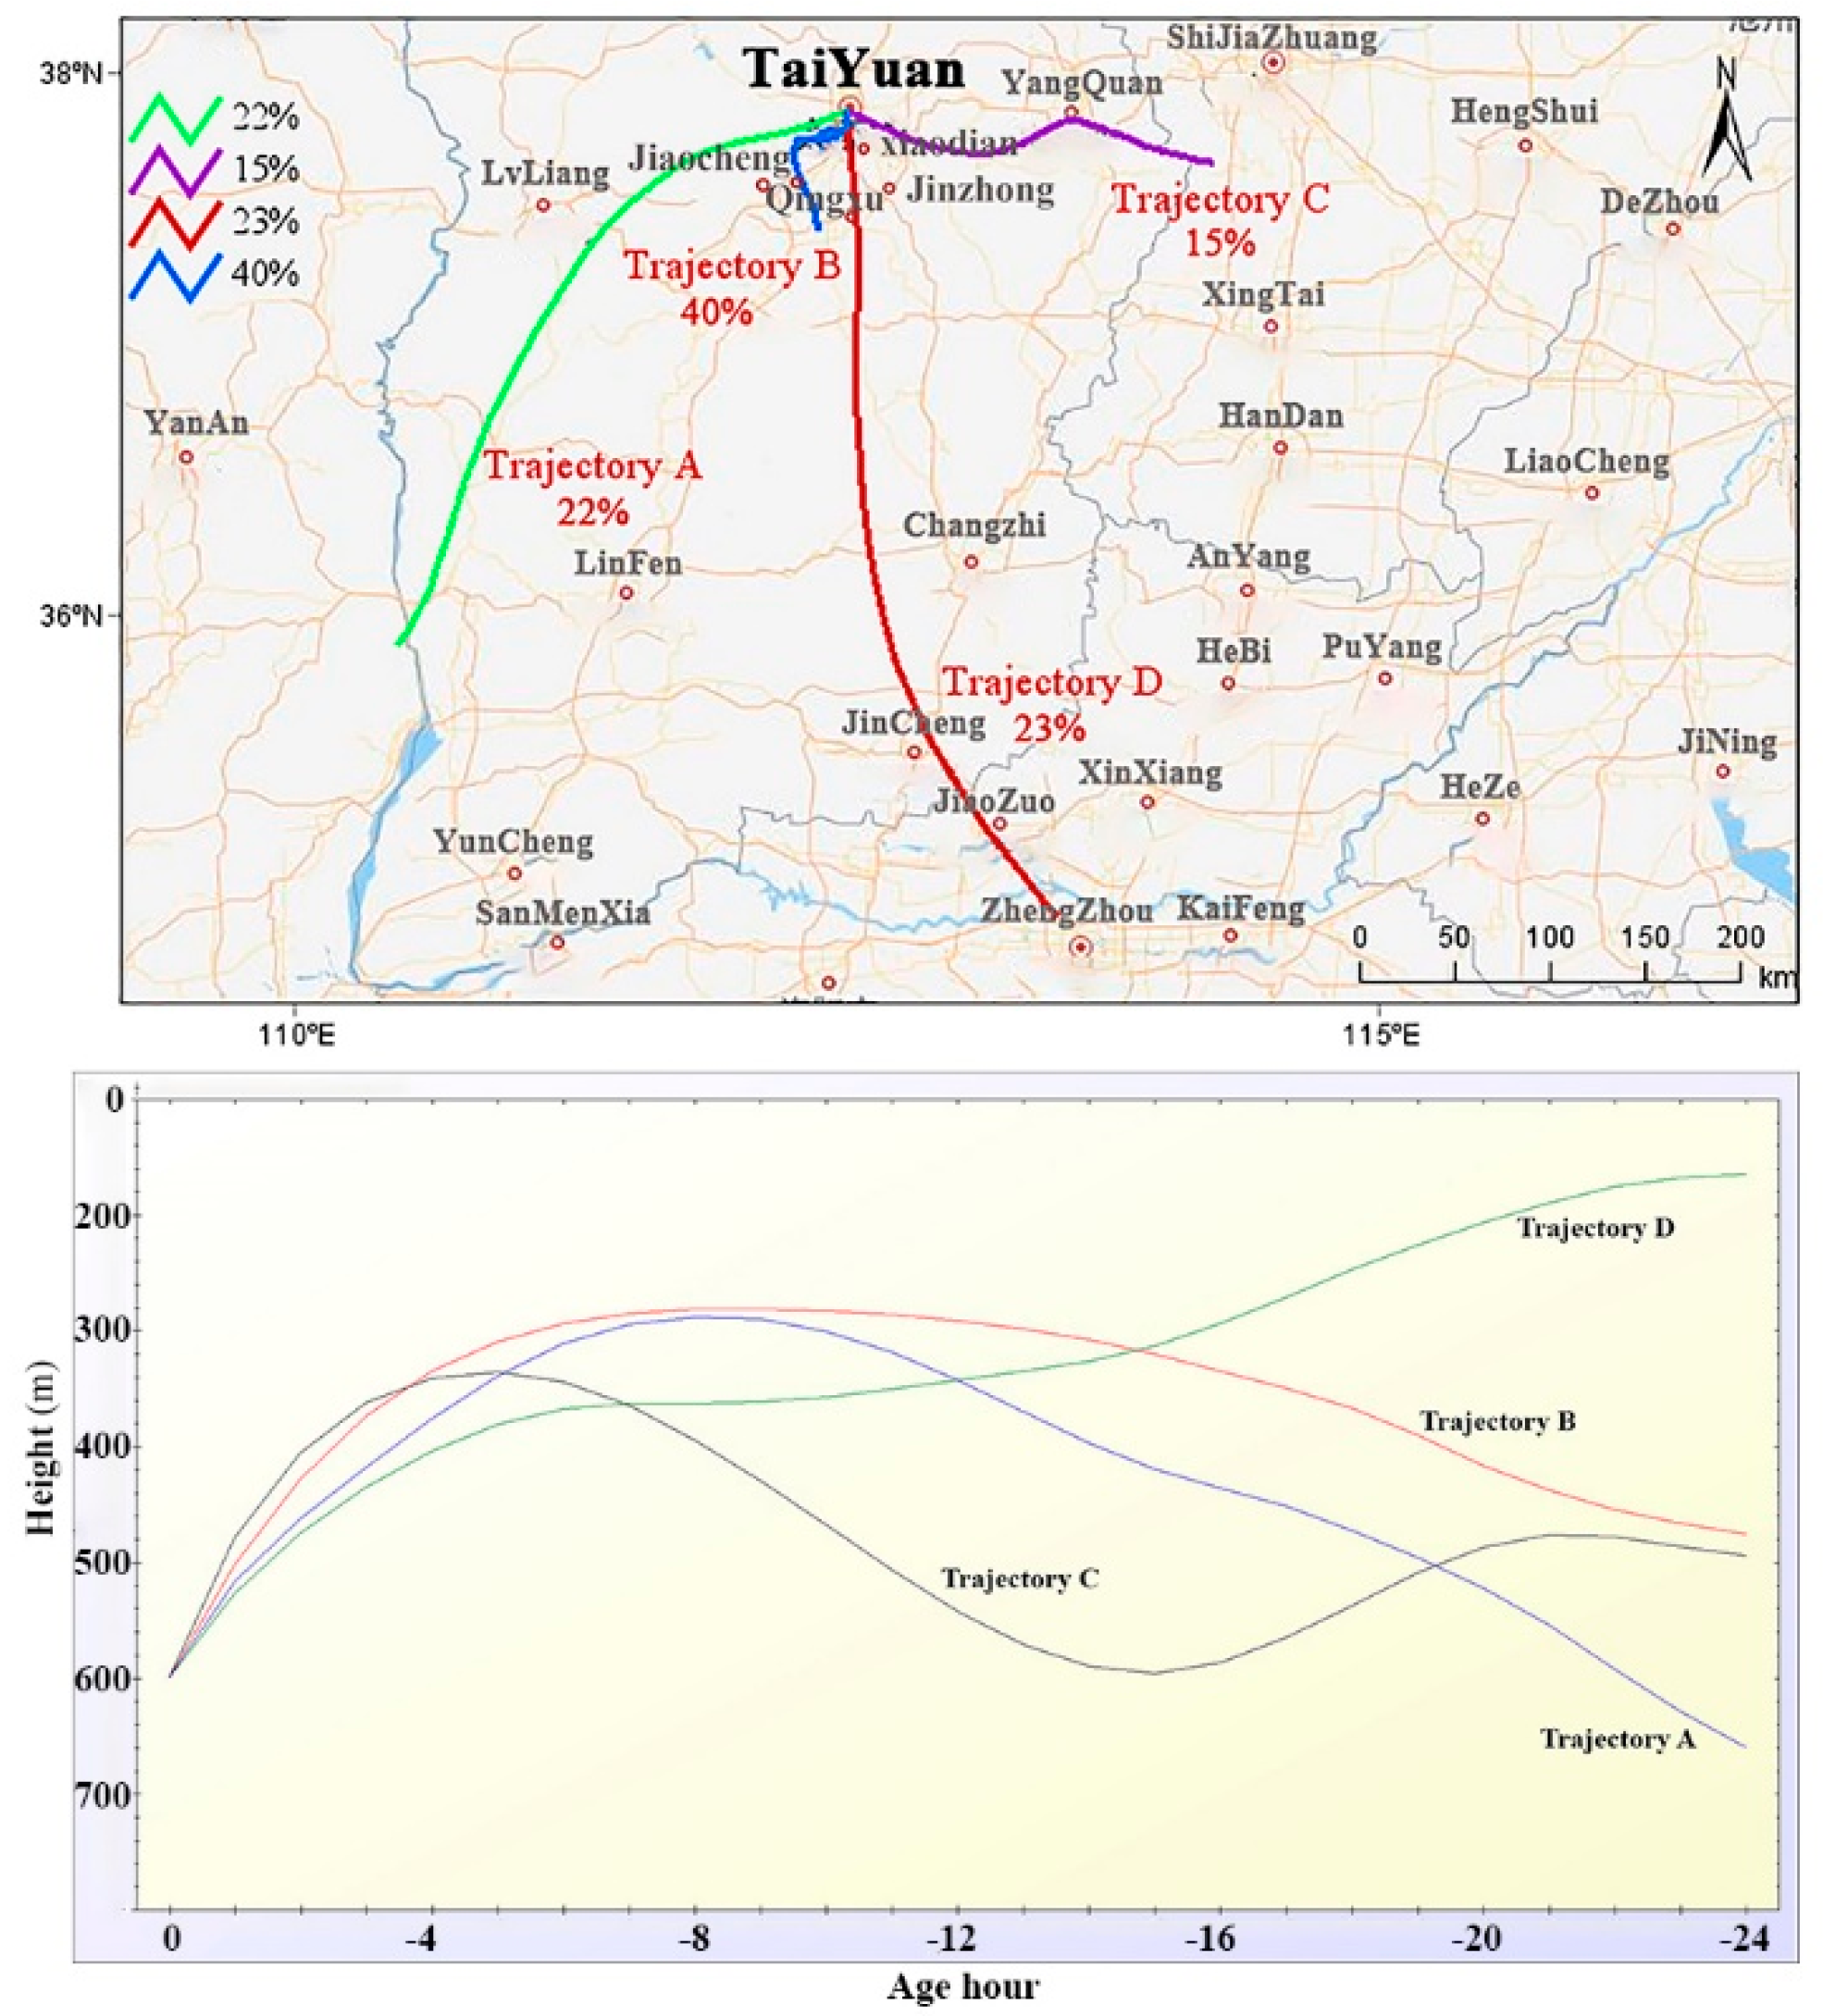
3.2.4. Wind Direction and Regional Transport

Figure 13 shows the relationship between hourly O3 concentrations and wind direction in Taiyuan from April to August in 2018 when the hourly O3 concentrations exceeded the 1-h standard (200 μg/m3), the hourly O3 concentrations value standard is 200 μg/m3 (Figure 13). As can be seen from the figure, when the O3 concentration exceeded the standard, only winds from the southeast to southwest by west were observed. In particular, for the south wind to the south by southwest wind, high concentrations of O3 appeared most frequently. The reason is that there are many coking and steel plants in Qingxu county and Lyuliang City in the southwest of Taiyuan and in Jinzhong City in the south of Taiyuan. Plenty of NOx and VOCs, the precursor of O3 emitted by these plants, can be transferred to Qingxu of Tiayuan (in the southwest of Taiyuan), then to the urban area of Taiyuan when the wind blows from the south to the southwest. These pollutants can generate large quantities of O3 through chemical reactions during the transmission process or after being transferred to Taiyuan, resulting in the increase of O3 concentration in the city.
In order to investigate the influence of regional transmission on ozone pollution in Taiyuan, the TrajStat software in HYSPLIT model, meteorological data and the hourly concentrations of ozone are used to analyze the transport path, potential sources and their contribution to O3 concentrations [24].
The city of Taiyuan (37°52′ N; 112°32′ E) was taken as the target site to simulate the trajectory of air mass (500 m above the ground) moving backward for 24 h when the O3 concentration exceeded the standard from April to August in 2018. A total of 3672 trajectories were simulated, and four types were obtained after cluster analysis, namely Trajectory A, Trajectory B, Trajectory C, and Trajectory D (Figure 14). The length of trajectories in Figure 14 represents the distance of transmission, and the proportions represent the ratios of the number of trajectories in this direction to the total number of trajectories. Among them, Trajectory B with the shortest length starts from Taigu County (Jinzhong City), passes through Yuci District and Qingxu County, and then enters the urban area of Taiyuan. It has the largest number of trajectories, accounting for 40%. The longer trajectories of cluster A and cluster D indicate that they come from a longer distance of transportation. Among them, Trajectory A from the southwest enters the urban area of Taiyuan after passing through Ji County (Linfen City) and Lyuliang City, accounting for 22%. Trajectory D from Jiaozuo City, Henan Province, passes by Jincheng City and Changzhi City, then goes through Taigu County and Yuci District of Jinzhong City and enters the urban area of Taiyuan, accounting for 23%. Cluster C from the east enters the urban area of Taiyuan after passing through Zanhuang County, Hebei Province and Pingding County (Yangquan City), accounting for 15%.
As shown in Figure 15, in order to study the source and transmission route of ozone in Taiyuan from April to August 2018. It is determined by the potential source contribution function (PSCF) method and concentration weighted trajectory (CWT) method based on backward trajectory analysis. PSCF is a simple and effective method of simulating the source of pollution. The simulated backward trajectory is appended with the corresponding ozone concentration value, and then the trajectory is meshed. The advantage of this method is that it has better resolution [25]. Subsequently, after optimization by Seibert et al. [26], an additional concentration method was obtained, that is, the ozone concentration value of each track in the grid was calculated, and then weighted according to the residence time. Hsu et al. [27] further refined the CWT method. Hao et al. [28] used backward trajectory cluster analysis, potential source contribution function (PSCF), and concentration weighted trajectory (CWT) methods to investigate the transport pathways and potential source regions of PM2.5 on the west coast of Bohai Bay from 2009 to 2018. As shown in Figure 15a, it is the ozone potential source contribution map of Taiyuan City from April to August 2018. The darker the color, the greater the contribution of this area to the ozone concentrations in Taiyuan City, and the greater the possibility of becoming a potential source of pollution. It can be seen from Figure 15a that the local emissions in Taiyuan City and Jinzhong City, Luliang, and Jiaocheng are the most likely sources of ozone pollution in Taiyuan City. Because the PSCF method can only reflect the contribution rate of the potential pollution source area, but not the pollution degree, the CWT method is used to reflect the pollution degree of the potential pollution source. As shown in Figure 15b, it is the trajectory map of ozone concentration weights during April–August 2018 in Taiyuan City. The darker the color, the greater the ozone pollution in this area. Figure 15b shows that in addition to the local emissions in Taiyuan, the emissions from Qingxu County, Jiaocheng County (Lyuliang city), and Taigu County and Yuci district of Jinzhong City also contribute to the O3 concentration in Taiyuan. This is because winds from the southwest and the south can transport the air masses containing NOx and VOCs emitted by factories, including coking and steel plants in the above counties and cities to Taiyuan. There are also many factories, such as coking and steel plants in some counties south of Jiaocheng County (Lyuliang City) and south of Taigu County (Jinzhong City). Large amounts of NOx and VOCs emitted by these plants will be transported to Qingxu County, Jiaocheng County and Taigu County before being transported to Taiyuan City when the southwest wind or south wind blows; thus, leading to the increase of O3 concentration in Taiyuan city.
In summary, the excessive hourly O3 concentration in Taiyuan City from April to August 2018 may be caused by its local generation and the transport of polluted air masses from the southwest (Qingxu County and some counties of Lyuliang City) and south (some counties of Jinzhong City) of Taiyuan.

3.3. Countermeasures and Suggestions for Control of O3 Pollution in Taiyuan

The O3 pollution in the urban area of Taiyuan is caused by its local generation and the transport of polluted air masses from the southwest and south. Therefore, a reduction of NOx and VOCs emissions in the city can reduce O3 generation and increase the compliance rate of air quality. Meanwhile, it is necessary to strengthen the joint prevention and control with Lyuliang City and Jinzhong City so as to reduce the transmission of polluted air masses from external areas.

4. Conclusions

The maximum hourly concentration of O3 was 316 μg/m3, with 253 h exceeding the standard value in total. The maximum and 90th percentile of the maximum 8-h running average was 257 μg/m3 and 192 μg/m3, respectively, in Taiyuan in 2018. The O3 concentration in Taiyuan increased from March, reached a high value during April and August, and decreased significantly from September. During the year, the O3 concentration of 72 days exceeded the standard, including 56 days of mild pollution and 16 days of moderate pollution, which were mainly from April to August. The O3 concentration in Taiyuan displayed a typical “single peak” diurnal variation, which was high during the day, with peak around 13:00–15:00, and low at night. The peak O3 concentration was far lower on cloudy days than on sunny days. When moderate O3 pollution occurred in Taiyuan, Jinyuan contributed the most to the O3 pollution, followed by Taoyuan. When there was slight O3 pollution, Taoyuan contributed the most, followed by Jinyuan and Xiaodian. High temperature, high pressure, south and southwest winds, can lead to an increase in O3 concentration. The O3 pollution in Taiyuan may be caused by its local generation, and the transport of polluted air mass containing NOx and VOCs emitted by factories, such as coking and steel plants in Jinzhong City to the south and Qingxu County and Lyuliang City to the southwest. In addition, mountain winds and low nitric oxide concentration are the main reasons for the increase of O3 concentration at Shanglan at night.

Author Contributions

Conceptualization, B.L., Z.X. and X.C.; methodology, Z.X. and X.C.; software, P.W.; validation, Z.X. and X.C.; formal analysis, Z.Z. and P.X.; investigation, X.F. and Q.Y.; resources, Z.Z.; data curation, L.C.; writing—original draft preparation, B.L. and Z.Z.; writing—review and editing, B.L. and Z.Z.; visualization, Y.R.; supervision, Z.Z.; project administration, J.M.; funding acquisition, Z.X. and X.C. All authors have read and agreed to the published version of the manuscript.

Funding

This research was founded by National Research Program for Key Issues on air pollution control, China (No. DQGG05110).

Acknowledgments

We would like to thank the Taiyuan ecological environment bureau of Shanxi Province and the Taiyuan Ecological Environment Monitoring Center of Shanxi Province for their support and assistance in this study.

Conflicts of Interest

The authors declare no conflict of interest.

References

  1. Castro, T.; Madronich, S.; Rivale, S.; Muhlia, A.; Mar, B. The influence of aerosols on photochemical smog in Mexico City. Atmos. Environ. 2001, 35, 1765–1772. [Google Scholar] [CrossRef]
  2. Kanda, I.; Wakamatsu, S. Small-scale variations in ozone concentration in low mountains. Atmos. Environ. 2018, 184, 98–109. [Google Scholar] [CrossRef]
  3. Quan, J.; Dou, Y.; Zhao, X.; Liu, Q.; Sun, Z.; Pan, Y.; Jia, X.; Cheng, Z.; Ma, P.; Su, J.; et al. Regional atmospheric pollutant transport mechanisms over the North China Plain driven by topography and planetary boundary layer processes. Atmos. Environ. 2020, 221. [Google Scholar] [CrossRef]
  4. Toh, Y.Y.; Lim, S.F.; Von Glasow, R. The influence of meteorological factors and biomass burning on surface ozone concentrations at Tanah Rata, Malaysia. Atmos. Environ. 2013, 70, 435–446. [Google Scholar] [CrossRef]
  5. Wang, X.; Lu, W.; Wang, W.; Leung, A.Y. A study of ozone variation trend within area of affecting human health in Hong Kong. Chemosphere 2003, 52, 1405–1410. [Google Scholar] [CrossRef]
  6. Musselman, R.C.; Minnick, T.J. Nocturnal stomatal conductance and ambient air quality standards for ozone. Atmos. Environ. 2000, 34, 719–733. [Google Scholar] [CrossRef]
  7. Ma, Z.; Xu, J.; Quan, W.; Zhang, Z.; Lin, W.; Xu, X. Significant increase of surface ozone at a rural site, north of eastern China. Atmos. Chem. Phys. 2016, 16, 3969–3977. [Google Scholar] [CrossRef] [Green Version]
  8. Wang, T.; Xue, L.; Brimblecombe, P.; Lam, Y.F.; Li, L.; Zhang, L. Ozone pollution in China: A review of concentrations, meteorological influences, chemical precursors, and effects. Sci. Total Environ. 2017, 575, 1582–1596. [Google Scholar] [CrossRef]
  9. Ministry of Ecology and Environment of the People’s Republic of China. Ambient Air Quality Standards; Ministry of Ecology and Environment of the People’s Republic of China: Beijing, China, 1996; Volume 3095, p. 12. [Google Scholar]
  10. Zhang, J.; Wang, C.; Qu, K.; Ding, J.; Shang, Y.; Liu, H.; Wei, M. Characteristics of ozone pollution, regional distribution and causes during 2014–2018 in Shandong Province, East China. Atmosphere 2019, 10, 501. [Google Scholar] [CrossRef] [Green Version]
  11. Yusoff, M.F.; Latif, M.T.; Juneng, L.; Khan, F.; Ahamad, F.; Chung, J.X.; Mohtar, A.A.A. Spatio-temporal assessment of nocturnal surface ozone in Malaysia. Atmos. Environ. 2019, 207, 105–116. [Google Scholar] [CrossRef]
  12. Li, Q.; Gabay, M.; Rubin, Y.; Ravehrubin, S.; Rohatyn, S.; Tatarinov, F.; Rotenberg, E.; Ramati, E.; Dicken, U.; Preisler, Y. Investigation of ozone deposition to vegetation under warm and dry conditions near the Eastern Mediterranean coast. Sci. Total Environ. 2019, 658, 1316–1333. [Google Scholar] [CrossRef]
  13. Brönnimann, S.; Neu, U. Weekend-weekday differences of near-surface ozone concentrations in Switzerland for different meteorological conditions. Atmos. Environ. 1997, 31, 1127–1135. [Google Scholar] [CrossRef]
  14. Geng, F.; Tie, X.; Xu, J.; Zhou, G.; Peng, L.; Gao, W.; Tang, X.; Zhao, C. Characterizations of ozone, NOx, and VOCs measured in Shanghai, China. Atmos. Environ. 2008, 42, 6873–6883. [Google Scholar] [CrossRef]
  15. Wang, H.; Ling, C.; Chen, X.; Yu, Y.; Bai, L. Effects of weather conditions on the distribution of near-surface ozone in Fuzhou. J. Ecol. Environ. 2011, 20, 1320–1325. [Google Scholar]
  16. Bao, J.W.; Michelson, S.A.; Persson, P.; Djalalova, I.; Wilczak, J. Observed and WRF-simulated low-level winds in a high-ozone episode during the Central California Ozone Study. J. Appl. Meteorol. Climatol. 2008, 47, 2372–2394. [Google Scholar] [CrossRef]
  17. Beaver, S.; Palazoglu, A. Influence of synoptic and mesoscale meteorology on ozone pollution potential for San Joaquin Valley of California. Atmos. Environ. 2009, 43, 1779–1788. [Google Scholar] [CrossRef]
  18. Serafin, S.; Zardi, D. Daytime heat transfer processes related to slope flows and turbulent convection in an idealized mountain valley. J. Atmos. Sci. 2010, 67, 3739–3756. [Google Scholar] [CrossRef] [Green Version]
  19. Fu, B. Valley wind. Meteorol. Sci. 1980, Z1, 1–14. [Google Scholar]
  20. Kitada, T.; Igarashi, K.; Owada, M. Numerical analysis of air pollution in a combined field of land/sea breeze and mountain/valley wind. J. Clim. Appl. Meteorol. 1986, 25, 767–784. [Google Scholar] [CrossRef] [Green Version]
  21. Wang, N.; Guo, H.; Jiang, F.; Ling, Z.H.; Wang, T. Simulation of ozone formation at different elevations in mountainous area of Hong Kong using WRF-CMAQ model. Sci Total Environ. 2015, 505, 939–951. [Google Scholar] [CrossRef]
  22. Pun, B.K.; Seigneur, C.; White, W. Day-of-week behavior of atmospheric ozone in three US cities. J. Air Waste Manag. Assoc. 2003, 53, 789–801. [Google Scholar] [CrossRef] [PubMed]
  23. Ren, Y.; Ding, A.; Wang, T.; Shen, X.; Guo, J.; Zhang, J.; Wang, Y.; Xu, P.; Wang, X.; Gao, J. Measurement of gas-phase total peroxides at the summit of Mount Tai in China. Atmos. Environ. 2009, 43, 1702–1711. [Google Scholar] [CrossRef]
  24. Camalier, L.; Cox, W.M.; Dolwick, P. The effects of meteorology on ozone in urban areas and their use in assessing ozone trends. Atmos. Environ. 2007, 41, 7127–7137. [Google Scholar] [CrossRef]
  25. Vasconcelos, L.A.d.P. Spatial resolution of a transport inversion technique. J. Geophys. Res. 1996, 101, 337–342. [Google Scholar] [CrossRef]
  26. Seibert, P.; Kromp-Kolb, H.; Baltensperger, U.; Jost, D.T.; Schwikowski, M. Trajectory analysis of high-alpine air pollution data. In Air Pollution Modeling and Its Application X; Gryning, S.-E., Millán, M.M., Eds.; Springer: Boston, MA, USA, 1994; pp. 595–596. [Google Scholar]
  27. Hsu, Y.-K.; Holsen, T.M.; Hopke, P.K. Comparison of hybrid receptor models to locate PCB sources in Chicago. Atmos. Environ. 2003, 37, 545–562. [Google Scholar] [CrossRef]
  28. Hao, T.; Cai, Z.; Chen, S.; Han, S.; Yao, Q.; Fan, W. Transport pathways and potential source regions of PM2.5 on the West Coast of Bohai Bay during 2009–2018. Atmosphere 2019, 10, 345. [Google Scholar] [CrossRef] [Green Version]
Figure 1. Topographic map of Taiyuan.
Atmosphere 11 00555 g001
Figure 2. The eight monitoring sites in Taiyuan.
Atmosphere 11 00555 g002
Figure 3. Monthly average of MAD8 in Taiyuan in 2018.
Atmosphere 11 00555 g003
Figure 4. Diurnal variations of O3 concentration in Taiyuan on a sunny day (6 June) and cloudy day (7 June and 8 June).
Atmosphere 11 00555 g004
Figure 5. Average MDA8 at each site in Taiyuan, from April to August 2018.
Atmosphere 11 00555 g005
Figure 6. The difference between the mean value of MDA8 of each site and that of Taiyuan at different O3 pollution levels (a,b) from April to August.
Atmosphere 11 00555 g006
Figure 7. Time difference of peak ozone concentrations at each site on 23 June 2018.
Atmosphere 11 00555 g007
Figure 8. Correlation between MDA8 and T-8h in the same period.
Atmosphere 11 00555 g008
Figure 9. Variations of O3 concentration and air temperature in Taiyuan from 31 May to 2 June.
Atmosphere 11 00555 g009
Figure 10. Variation of O3 concentration at the national monitoring sites in Taiyuan during 22–24 June.
Atmosphere 11 00555 g010
Figure 11. Correlation of wind direction and wind speed at Shanglan at night.
Atmosphere 11 00555 g011
Figure 12. The average concentration of NO at eight sites between 23:00 and 6:00 when the O3 concentration was high at Shanglan at night.
Atmosphere 11 00555 g012
Figure 13. Correlation between O3 concentration and wind direction in Taiyuan from April to August.
Atmosphere 11 00555 g013
Figure 14. Result of cluster analysis of backward trajectory of airflow when O3 exceeded standard in Taiyuan City from April to August 2018.
Atmosphere 11 00555 g014
Figure 15. The possibility of the backward trajectories as potential sources of ozone (a), and their contribution to the concentration of ozone (b) in Taiyuan from April to August, 2018.
Atmosphere 11 00555 g015
Table 1. The number of days that MDA8 exceeded the standard for each month in 2018. (Jan.: January, Feb.: February, Mar.: March, Apr: April, Jun.: June, Jul.: July, Aug.: August, Sep.: September, Oct.: October, Nov.: November, Dec.: December).
MonthJan.Feb.Mar.Apr.MayJun.Jul.Aug.Sep.Oct.Nov.Dec.
The number of days MDA8 exceeded standard0019142016111000

