Article

Impact of Climate Change on Olive Crop Production in Italy

1
Department of Civil and Environmental Engineering, University of Perugia, 06121 Perugia, Italy
2
Institute of Environmental Sciences (Botany), University of Castilla-La Mancha, 45071 Toledo, Spain
3
Department of Botany and Plant Physiology, University of Malaga, 29071 Malaga, Spain
4
Department of Botany, Ecology and Plant Physiology, University of Cordoba, 14071 Cordoba, Spain
*
Author to whom correspondence should be addressed.
Atmosphere 2020, 11(6), 595; https://doi.org/10.3390/atmos11060595
Submission received: 29 April 2020 / Revised: 28 May 2020 / Accepted: 1 June 2020 / Published: 4 June 2020
(This article belongs to the Special Issue GIS Applications for Airborne Pollen Monitoring and Prediction)

Abstract

:
The effects of climate change on agricultural systems raise important uncertainties about the future productivity and suitability of crops, especially in areas suffering from intense environmental changes. Olive groves occupy Mediterranean areas characterized by seasonal temporary droughts, which cause this cultivation to be highly dependent on local microclimatic conditions. Olive crop production can be reliably estimated using pollen intensity metrics together with post-pollination environmental conditions. In this study, we applied this kind of statistics-based models to identify the most relevant meteorological variables during the post-pollination periods for olive fruit production. Olive pollen time-series for the period of 1999–2012 was analyzed in 16 Italian provinces. Minimum and maximum temperature during spring and summer (March–August) showed a negative relationship with olive production, while precipitation always showed a positive correlation. The increase in aridity conditions observed in areas of Italy during the summer represents an important risk of decreasing olive crop production. The effect of climate change on the olive production trend is not clear because of the interactions between human and environmental factors, although some areas might show an increase in productivity in the near future under different climate change scenarios. However, as more drastic changes in temperature or precipitation take place, the risk to olive production will be considerably greater.

1. Introduction

The cultivation of olive crops has played, over the centuries, an important role in the economic development of rural areas in the Mediterranean region, providing large sources of income and employment opportunities for the population in rain-fed agricultural territories [1]. However, from ancient times, olive trees in the Mediterranean basin have represented much more just an economic resource. The traditional agrarian systems associated with olive groves provide environmental and sociocultural functionalities improving the sustainability of olive cultivations [2]. Olive groves represent an important resource from a cultural point of view as well, as they characterize the classical Mediterranean landscape [3].
From an economic point of view, olive crop forecasting is essential for optimizing both technical and human resources for harvesting (optimization of management, cultural practices, crop health care) and planning olive oil marketing and commercial distribution (stock management, activation of strategies, packing and distribution, movements in price markets). Anticipated crop estimates help to ensure better management planning of the olive production chain [4]. Each month of advance yield forecasting may represent precious information that can be used to take advantage over competitors. Following this objective, pollen monitoring, used as a measurement of flowering intensity, has allowed the implementation of precise olive crop forecasting models several months prior to olive harvest [5].
Numerous studies have pointed out the importance of olive yield forecasting of airborne pollen amounts and weather conditions during the months following olive pollination [4,6,7]. However, pollen monitoring of olive groves has other valuable purposes from an agronomic point of view besides predicting olive yield as it allows to study the olive reproductive cycle on large areas of olive orchards as well [8].
Olive trees are influenced by human factors (e.g., agronomic techniques), environmental conditions (water deficit, extreme temperature) and phyto-pathological problems [6,9] during both the pre-flowering and post-pollination periods.
Some of these events may have a negative impact on fruit quantity and quality, and thus increase the interannual variability of final fruit production. In this way, and according to several authors, the factors during the months prior to the flowering period, such as weather, management techniques or diseases, are reflected in the annual flower and pollen production [10]. Specifically, pollen emission is directly influenced by environmental variables from flower induction phases of the precedent year (late autumn—early winter) to reproductive structures maturation and anthesis [11]. Therefore, pollen production is the first evidence of trends in flowering intensity.
On the other hand, the biological cycle of the olive tree characterized by biennial productive patterns favors the interannual variability in fruit production, stressed by the alternation in pollen production [5]. This behavior is well-known and responds to a physiological balance for the olive tree, which takes two years to complete the entire biological life cycle [12]. This interannual alternation in fruit production is emphasized by unfavorable environmental conditions, which is a cause of great uncertainty for olive producers and the olive oil industry [4].
Therefore, climatic changes already observed on a global scale constitute a great source of uncertainty in the economic sector related to agricultural crops [13]. The Mediterranean basin is expected to experience dramatic changes in temperature and precipitation [14,15]. The most extreme emission scenarios forecast an increase of about 5 °C in late 21st century if mitigation targets are not met [16]. Furthermore, in Mediterranean areas, climate change will increase the frequency of heat waves, extreme droughts, and heavy precipitation events [17], inducing uncertainties about the potential adaptability of olive crops.
The aim of this study was to analyze the current olive production trends in Mediterranean areas and evaluate the factors affecting fruit production. Another important objective of this research was to predict the potential impacts of climate change, estimated by the most important future scenarios of olive fruit production.

2. Experiments

2.1. Olive Cultivation Areas

Several cultivation areas in Central-South Italy were studied for the period of 1999 to 2012: Perugia, Agrigento, Messina, Palermo, Trapani, Catanzaro, Cosenza, Reggio Calabria, Bari, Brindisi, Foggia, Lecce, Taranto, Salerno, Benevento, Avellino. The Ogliarola cv. was the most represented with some ecotypes adapted to local areas (Ogliarola Barese, Messinese, and Salentina). Other two cultivars, Frantoio and Coratina, are typical of three different areas each one. The other olive cultivars are present only in one area or at most in two (Biancolilla cv. in Agrigento and Palermo, Cassanese cv. in Cosenza and R. Calabria) [18] (Table 1).
In the present work, the most representative Italian areas for olive yields were included on the basis of data provided by the Italian National Institute of Statistics [19]. In addition, a spatial analysis of the variation of olive surface in the study area was carried out for each province in Italy from 1990 to 2012. In this case, the source of land-use mapping used was the CORINE Land Cover raster with 100 × 100 m of spatial resolution provided by the European Environment Agency [20].

2.2. Olive Flowering Monitoring

The quantitative biological parameter considered for monitoring of the intensity of olive flowering was olive pollen recorded in the atmosphere using aerobiological sampling [4,21]. Airborne pollen data in every monitoring area were collected continuously over different periods using volumetric pollen traps (VPPS 2000 Lanzoni model) based on the design of the Hirst model [22]. An aspirated constant air flow volume (10 L/min) transports airborne particles to a drum that revolves at a rate of 2 mm/h impacting the tape covered by adhesive substances [23]. The samples collected were analyzed, and olive pollen grains were identified and quantified to calculate the daily pollen concentrations by knowing the volume of sampled air. All the steps of this methodology from sampling to analysis were carried out as per the guidelines of the International Association for Aerobiology [24].
The aerobiological monitoring areas are representative of the olive production of the provinces where the sampling devices are located [6]. For each station, quantitative parameters were calculated, the most important of which is the annual pollen integral (APIn), intended as the sum of the average daily concentrations of pollen grains registered during the entire annual period [25].

2.3. Climate Change Diagnosis

Trends of meteorological variables (maximum and minimum temperatures and accumulated precipitation) were analyzed for the period of 1990–2012 using the slopes of linear regressions for gridded spatial datasets. Daily gridded climatic maps were obtained from the E-OBS dataset, the EU-FP6 project UERRA, the Copernicus Climate Change Service, and data providers in the ECA&D project [26].
Climate trends were calculated for seasonal periods in Italy: Winter (December-January-February), Spring (March-April-May), Summer (June-July-August), Autumn (September-October-November). Positive slopes represented an increase in the seasonal meteorological variable and negative slopes represented a decrease.

2.4. Statistical Analysis

Average data of annual olive cultivation area (ha), olive production (ton), and olive pollen amounts (APIn) (pollen * day/m3) together with measurements of dispersion (CV, Coefficient of Variation %) were calculated and presented for each studied Italian province. Furthermore, trend analyses were conducted based on the temporal changes of these features in the provinces (pollen, fruit production, and area). Trend analysis consisted of a linear regression analysis, where slopes and significance levels were highlighted. Positive slopes represented an increase in olive features, and negative slopes a decrease.
Regional statistical models were carried out to evaluate the influence of meteorological variables in olive production. With this purpose, multiple linear regressions were generated in each province, including olive production as a response variable and annual pollen integral and meteorological variables as predictors; a stepwise procedure was followed to reduce the number of independent variables as far as possible, preserving the reliability of the model. The pollen integral (APIn) included intrinsic information about the pre-flowering and flowering conditions [21], and the meteorological variables considered were the seasonal variables for spring (MAM) and summer (JJA), and the monthly variables from March to August, which covered the main post-pollination conditions influencing the olive production. Seasonal and monthly averages of maximum and minimum temperatures and accumulated precipitation were included as meteorological variables in the prediction models. The meteorological data were obtained from network stations of the National Council of Agricultural Research (CRA-Cma).
Since an increase of the temperature and a decrease of the precipitation are expected in most of the Mediterranean areas as a consequence of the climate change [15,27], we have evaluated the potential change in olive production (percentage) considering several levels of increase in temperature (+5%, +10%) and decrease in precipitation (−5%, −10%) based on our regressions models performed for each province.

2.5. Future Projections

The results of the regional models (linear regression models) were applied to the future following two different potential scenarios of emission, using 4.5 and 8.5 W/m2 as the potential radiative forcing as Representative Concentration Pathways (RCPs) [28]. In addition, the models of the potential changes in olive production were applied to the future for 2050 (average for 2041–2060) and 2070 (average for 2061–2080), using several General Circulation Models (GCMs) considered by the IPCC Fifth Assessment Report [17,29].
The percentage of variation of olive production between current and future conditions was calculated; the amount of Annual Pollen Integral was considered as a constant to evaluate the effect of climate variables in variations of olive fruit production. The current climatological data were provided by the WorldClim project released for the period 1970–2000 in raster format [30]. The average climatic value for all pixels within each province were considered to apply the regional models. Changes in percentage of the olive production for all provinces were displayed together using boxplot graphs to select the most optimistic and pessimistic General Circulation Model. The most optimistic model represented the GCM, which retrieved the lowest potential reduction in future production, while the most pessimistic model represented the GCM with the highest potential reduction of production in the future. The changes in percentage of olive production for these optimistic and pessimistic models were then spatially shown for each studied province in Italy.

3. Results

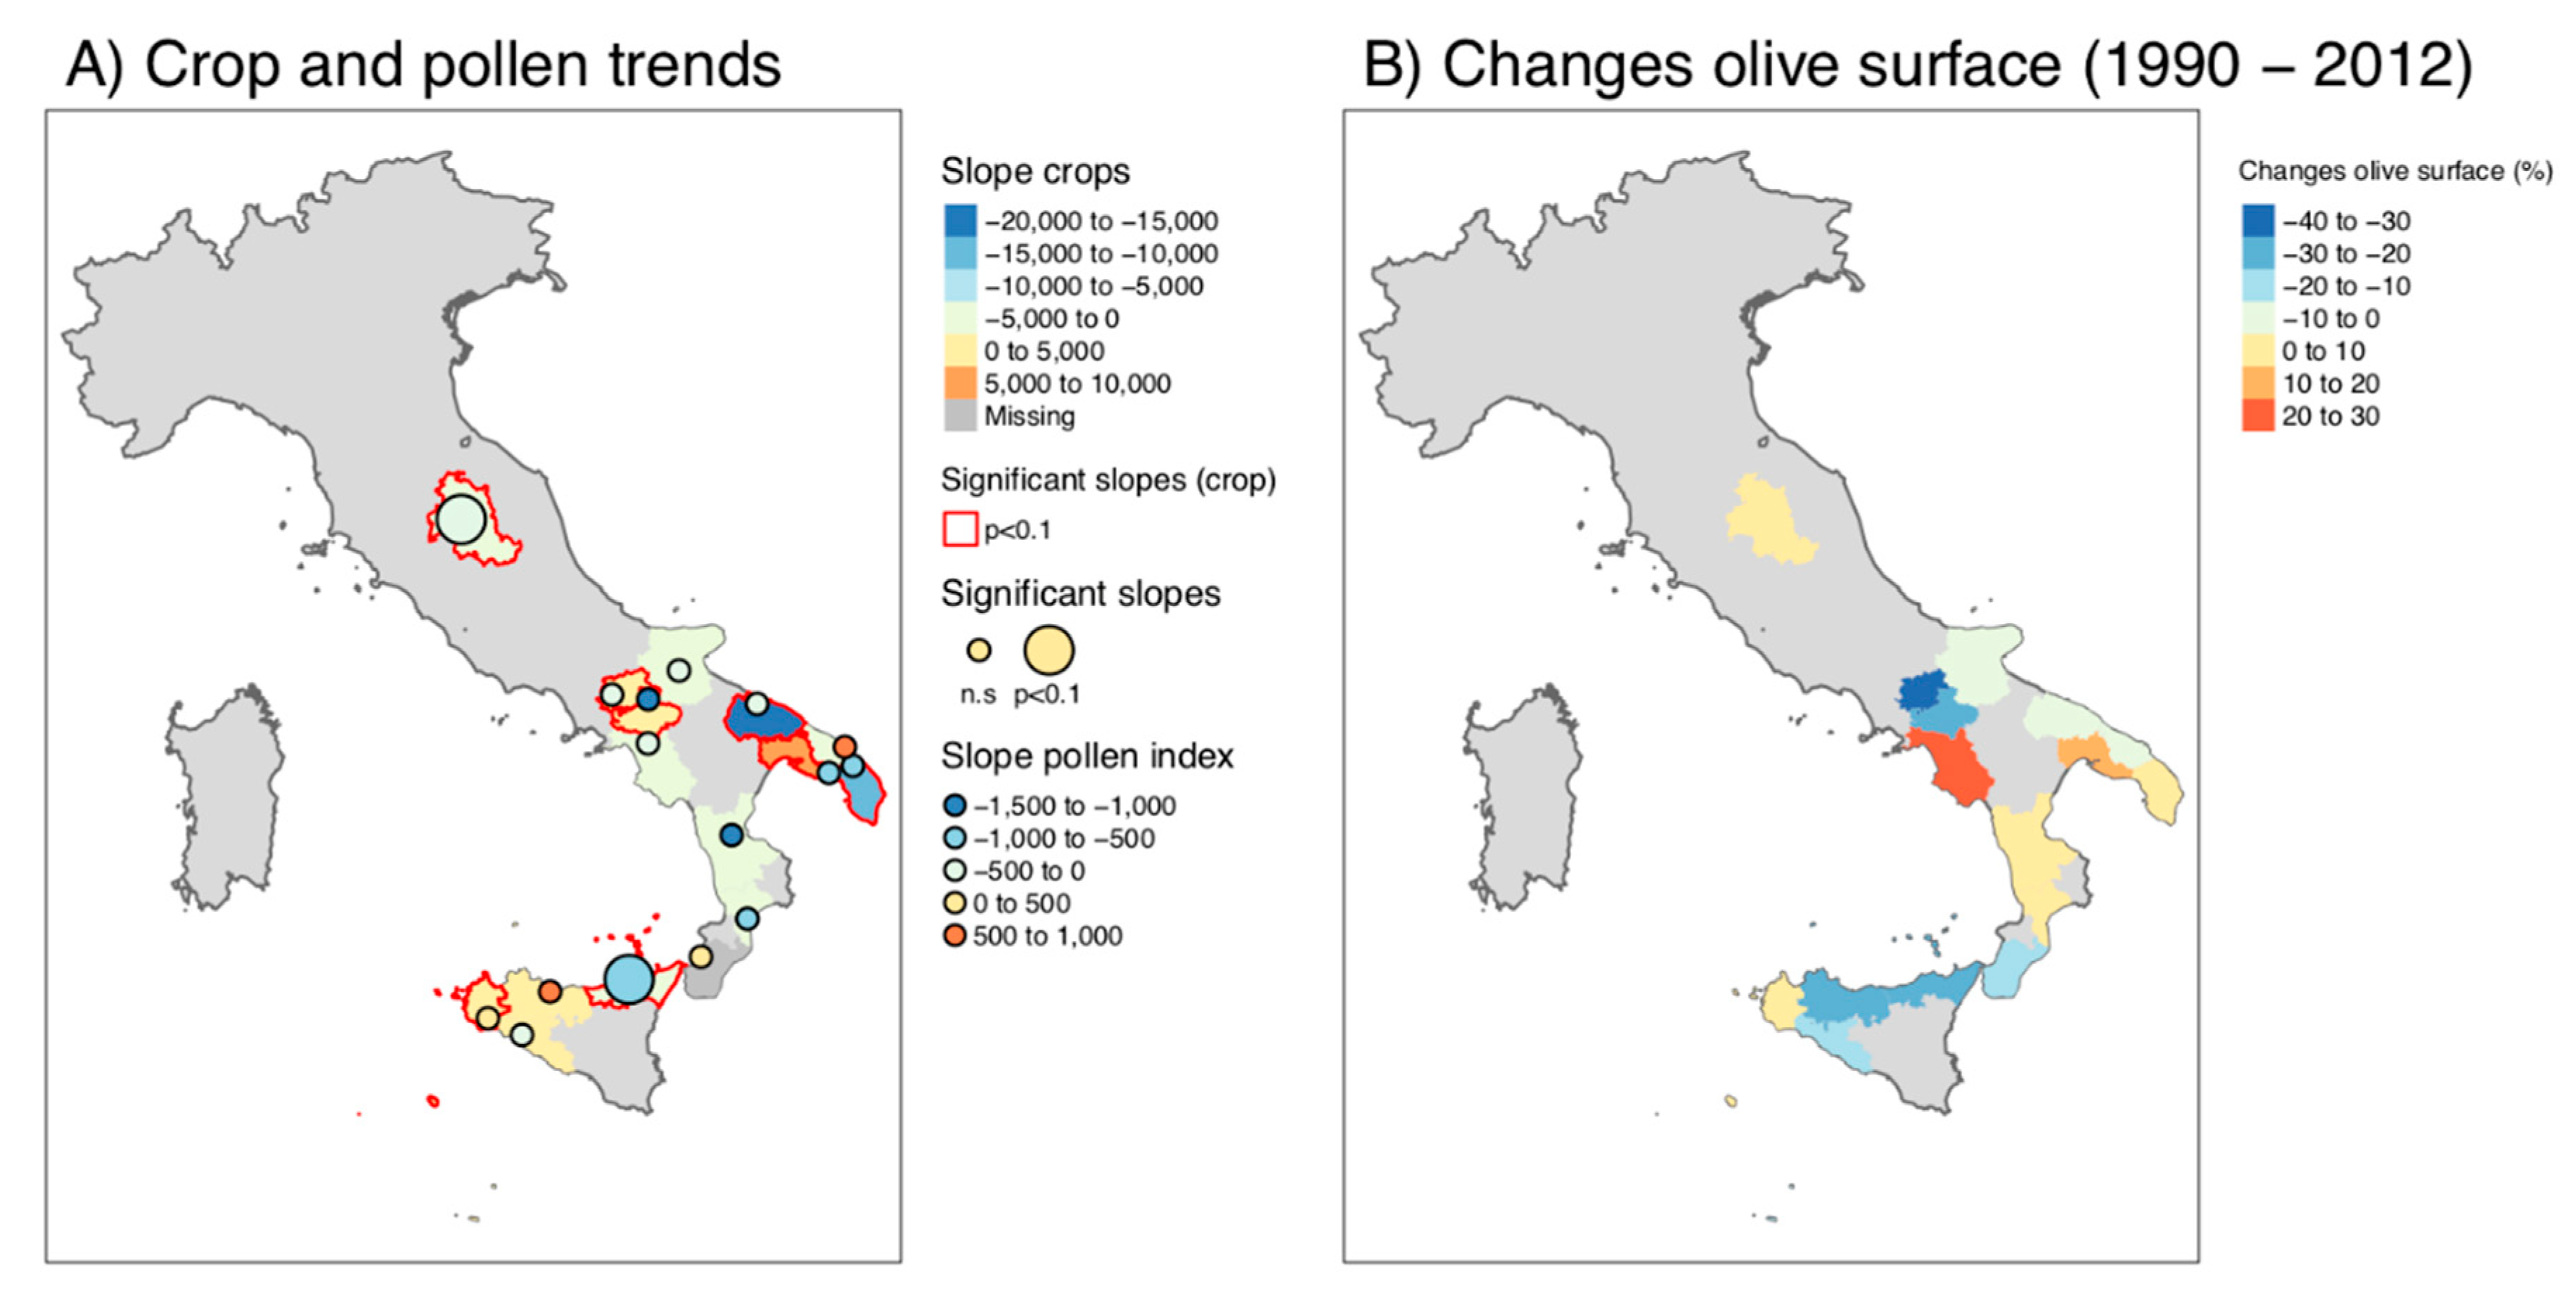
3.1. Olive Grove Surface, Olive Fruit Production, and Pollen Production in Italian Regions

The most important olive cultivation areas in Central-South Italy belong to the province of Bari, which stands out from the rest with almost 120,000 ha of olive groves on average. Bari is followed by other provinces in the Southeast of the country, such as Lecce, Brindisi, and Foggia, all of them belonging to the Apulia region. Another important region is Calabria in the Southern limits of the Italian Peninsula, where the province of Reggio Calabria accounts for more than 50,000 ha of olive groves (Table 1).
Olive production values showed high levels of variability over the years, but pollen emission values showed even higher coefficients of variation, which in most cases overcame 50% (Table 1). These results highlighted the great alternating behavior of pollen and fruit production in these Italian olive orchards.
The province of Reggio Calabria represents an area with the largest production of olive fruits on average in the period of 1999–2012 (Table 1). The largest amounts of total pollen were registered in the Southeastern area of Italy (Lecce, Brindisi), but these provinces were overpassed by Cosenza and Messina, located in Southwestern areas of the peninsula and the Eastern coast of Sicilia, respectively.
The trend analyses for pollen production and olive yield for the period 1999–2012 retrieved a few significant cases, which are shown in Figure 1A. The olive fruit production evidenced significant negative trends in Bari, Lecce, or Messina, where the olive surface decreased in the study period (Figure 1B). A significant reduction in pollen production was also observed in the case of Messina (Figure 1A).
On the other hand, the areas of Taranto, Trapani, and Benevento showed positive fruit production trends during the considered period (Figure 1A), but only olive surface increase was evidenced in Taranto and Trapani (Figure 1B). In the case of the province of Perugia in Central Italy, a significant negative trend in both pollen and olive fruit production coincided with an increase in olive surface (Figure 1). Therefore, not all observed trends in olive fruit production may be explained by land-use transformations.

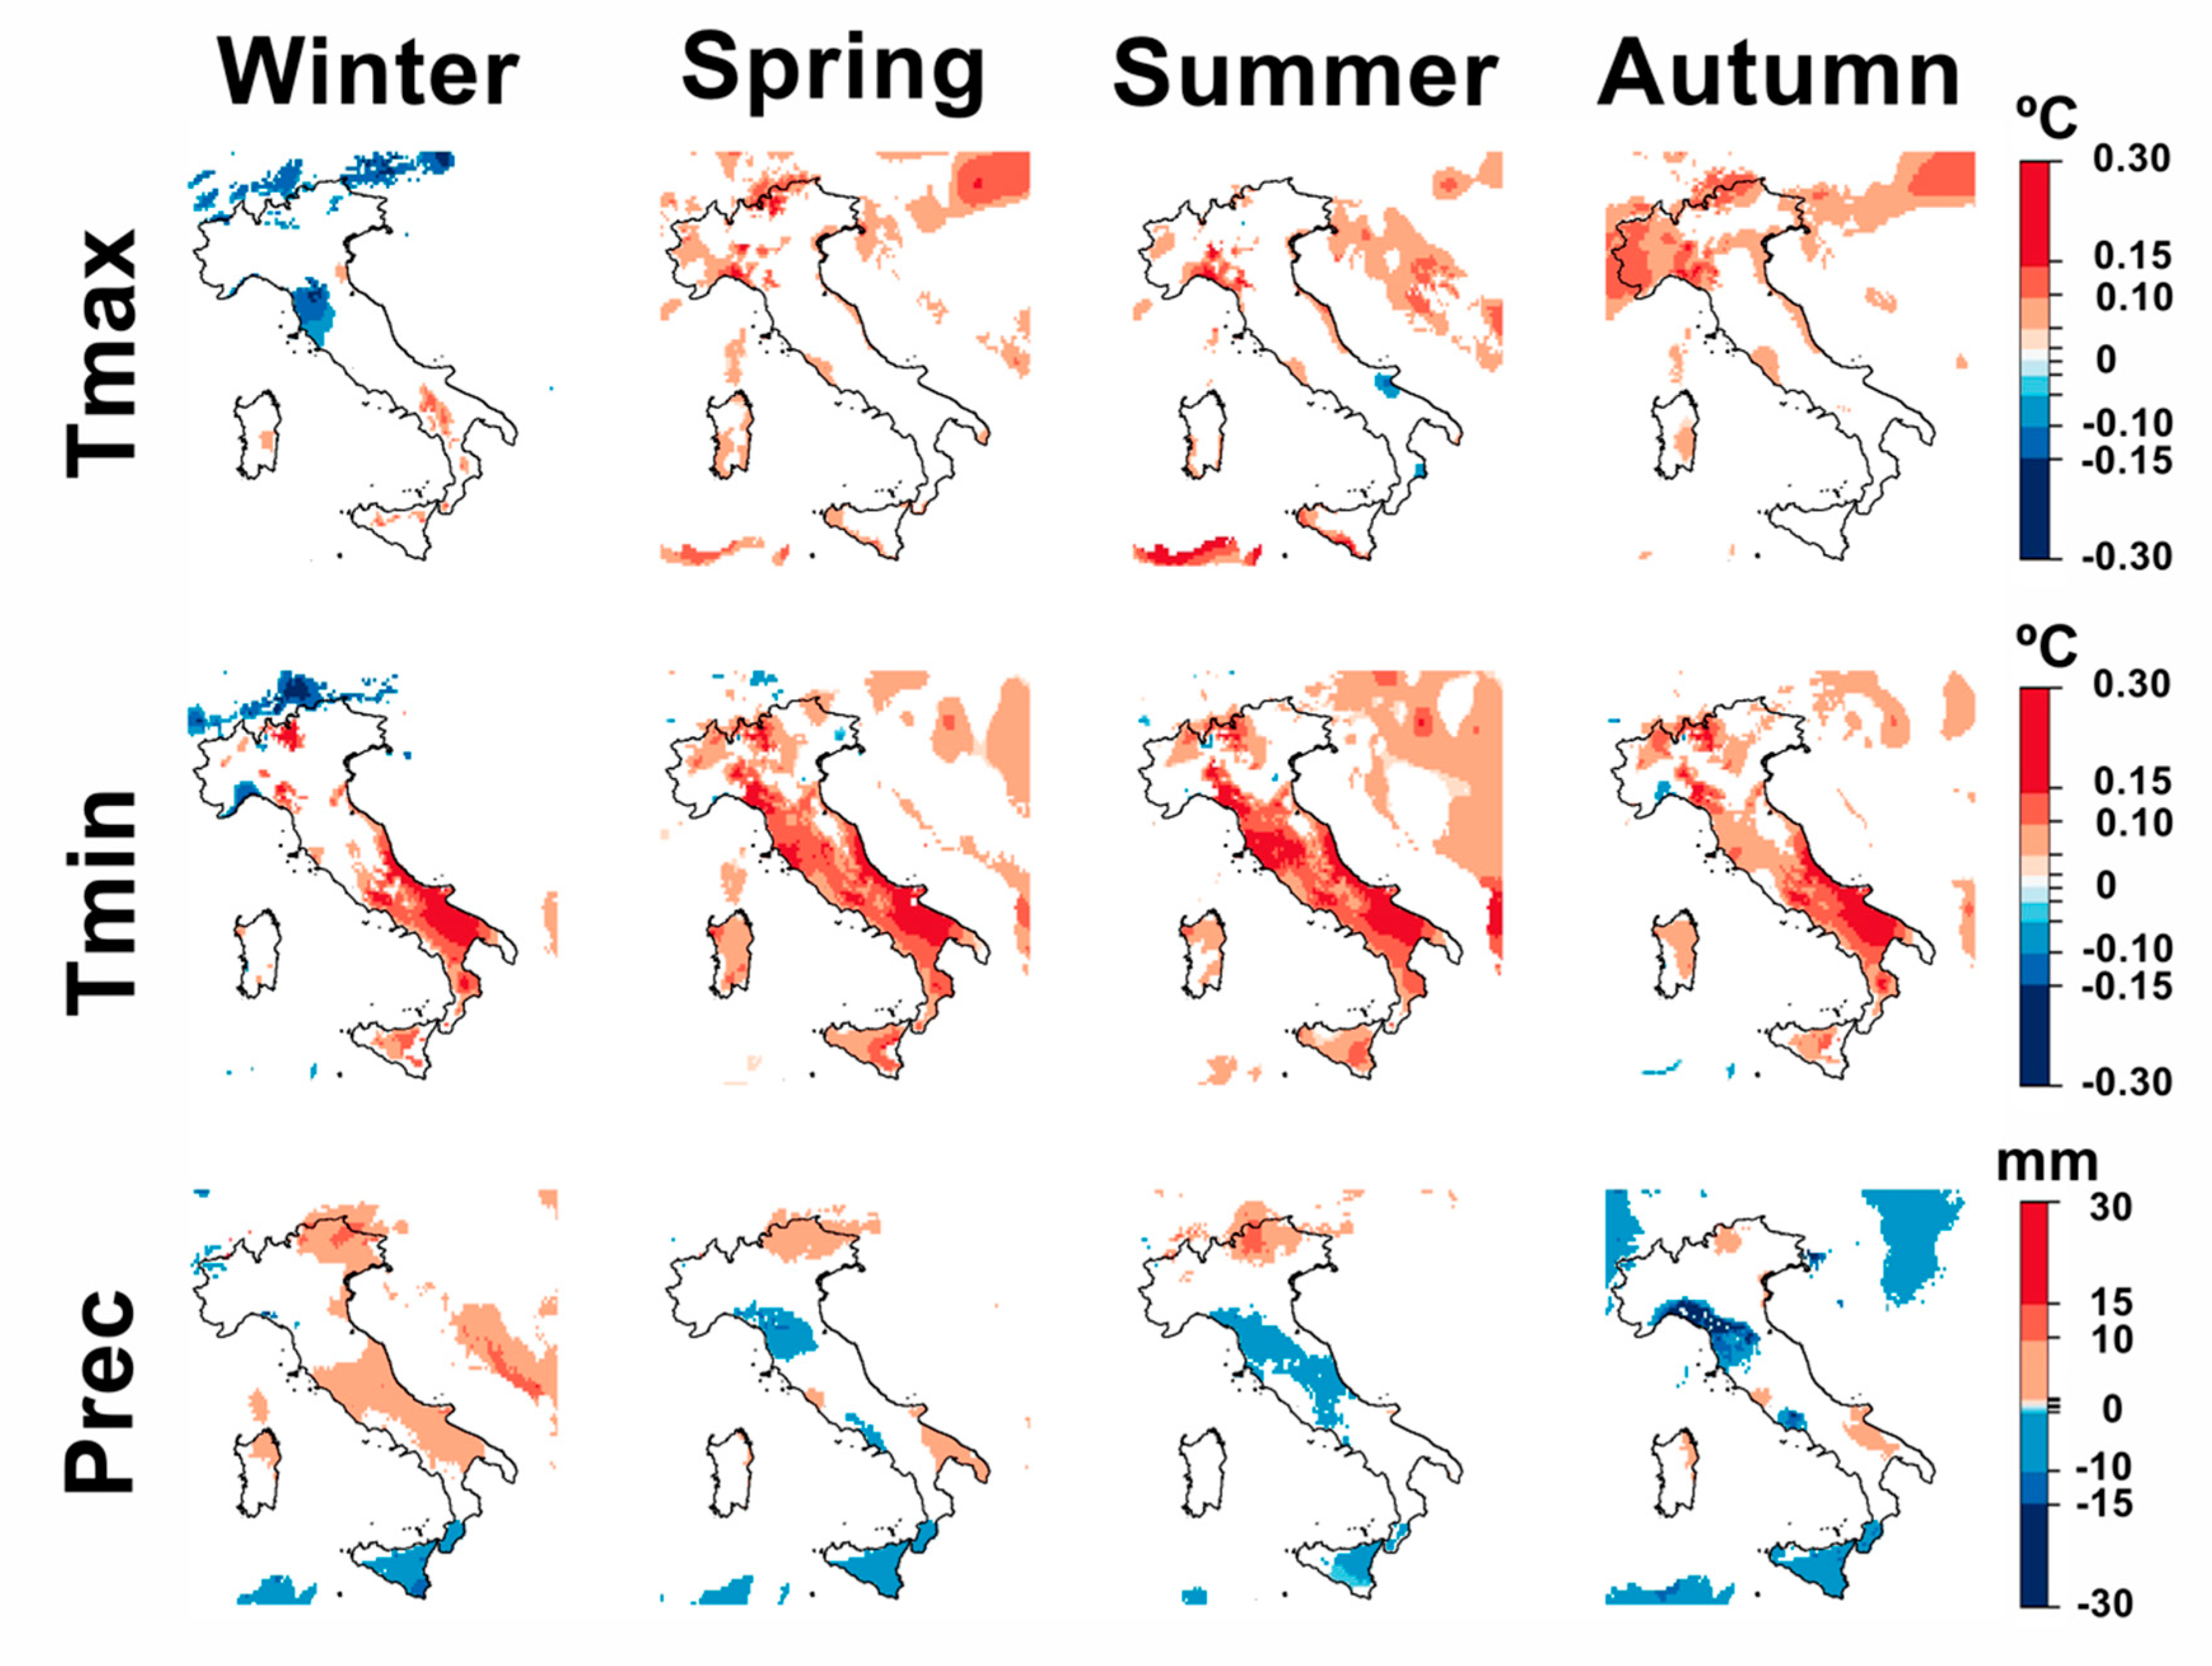
3.2. Climate Change in Italy

In general, temperatures increased during the 1990–2012 period in areas of Italy where the trends were significant (Figure 2). However, when trends were analyzed by season, it was clear that, during winter, temperatures decreased in the Alps in Northern Italy. Furthermore, some areas of Central Italy also showed a decrease in maximum temperature. Minimum temperatures registered the most intense rise mainly in Central and Southern Italy during spring, summer, and autumn. In these areas, the slope of minimum temperatures was between 0.15–0.30, meaning that temperature rose 0.15–0.30 °C per year (Figure 2).
In addition, Figure 2 shows the variation of accumulated precipitation for seasonal periods during 1990–2012. Precipitation showed irregular changes across the different geographical areas in Italy. In winter, precipitation increased in the north of the country, and in the center as well, while in the Southern Italian Peninsula (Calabria Region) and Sicily, it decreased. In the rest of the year, most areas of Central and Southern Italy showed a decrease in precipitation, except small areas in the Southeast of Italy (Apulia Region) that recorded a positive trend of precipitation in spring and autumn (Figure 2).

3.3. Regression Models with Environmental Variables

The regression models for olive production in all provinces incorporated Annual Pollen Integral as the main independent variable and meteorological variables (maximum, minimum temperatures and precipitation), reaching a good model significance. Specifically, the adjusted coefficient of determination (R2) of the models ranged from 0.65 to 0.88 (Table 2 only showed significant models).
Table 2 shows the regional models for each olive cultivation area in the Italian provinces. However, although the models are different, the influence of temperature and precipitation has the same sign for all of them. In six areas, precipitation was relevant, above all during the summer months, with a positive coefficient. In three areas, temperature in late summer (July–August) was significant in obtaining high interpretative results, while in all the other sites, the more important temperatures were recorded from March to July. However, in all the provinces, temperature had a negative relationship with production (Table 2).
A first indicative estimation of future olive production was carried out on the basis of the variation rates of temperature and precipitation that hypothetically would occur in the next decades. The combination of percentages of variation in meteorological variables furnished various olive yield percentage reductions. The worst combination, due to a contemporary 10% temperature increase and 10% precipitation decrease, determined the highest reduction in production in Cosenza and Messina. In three sites (Brindisi, Salerno, and Cosenza), precipitation decrease determined reduction in production comparable to temperature increase, while in the other sites, the precipitation impact was not comparable to the temperature effect (Table 3).

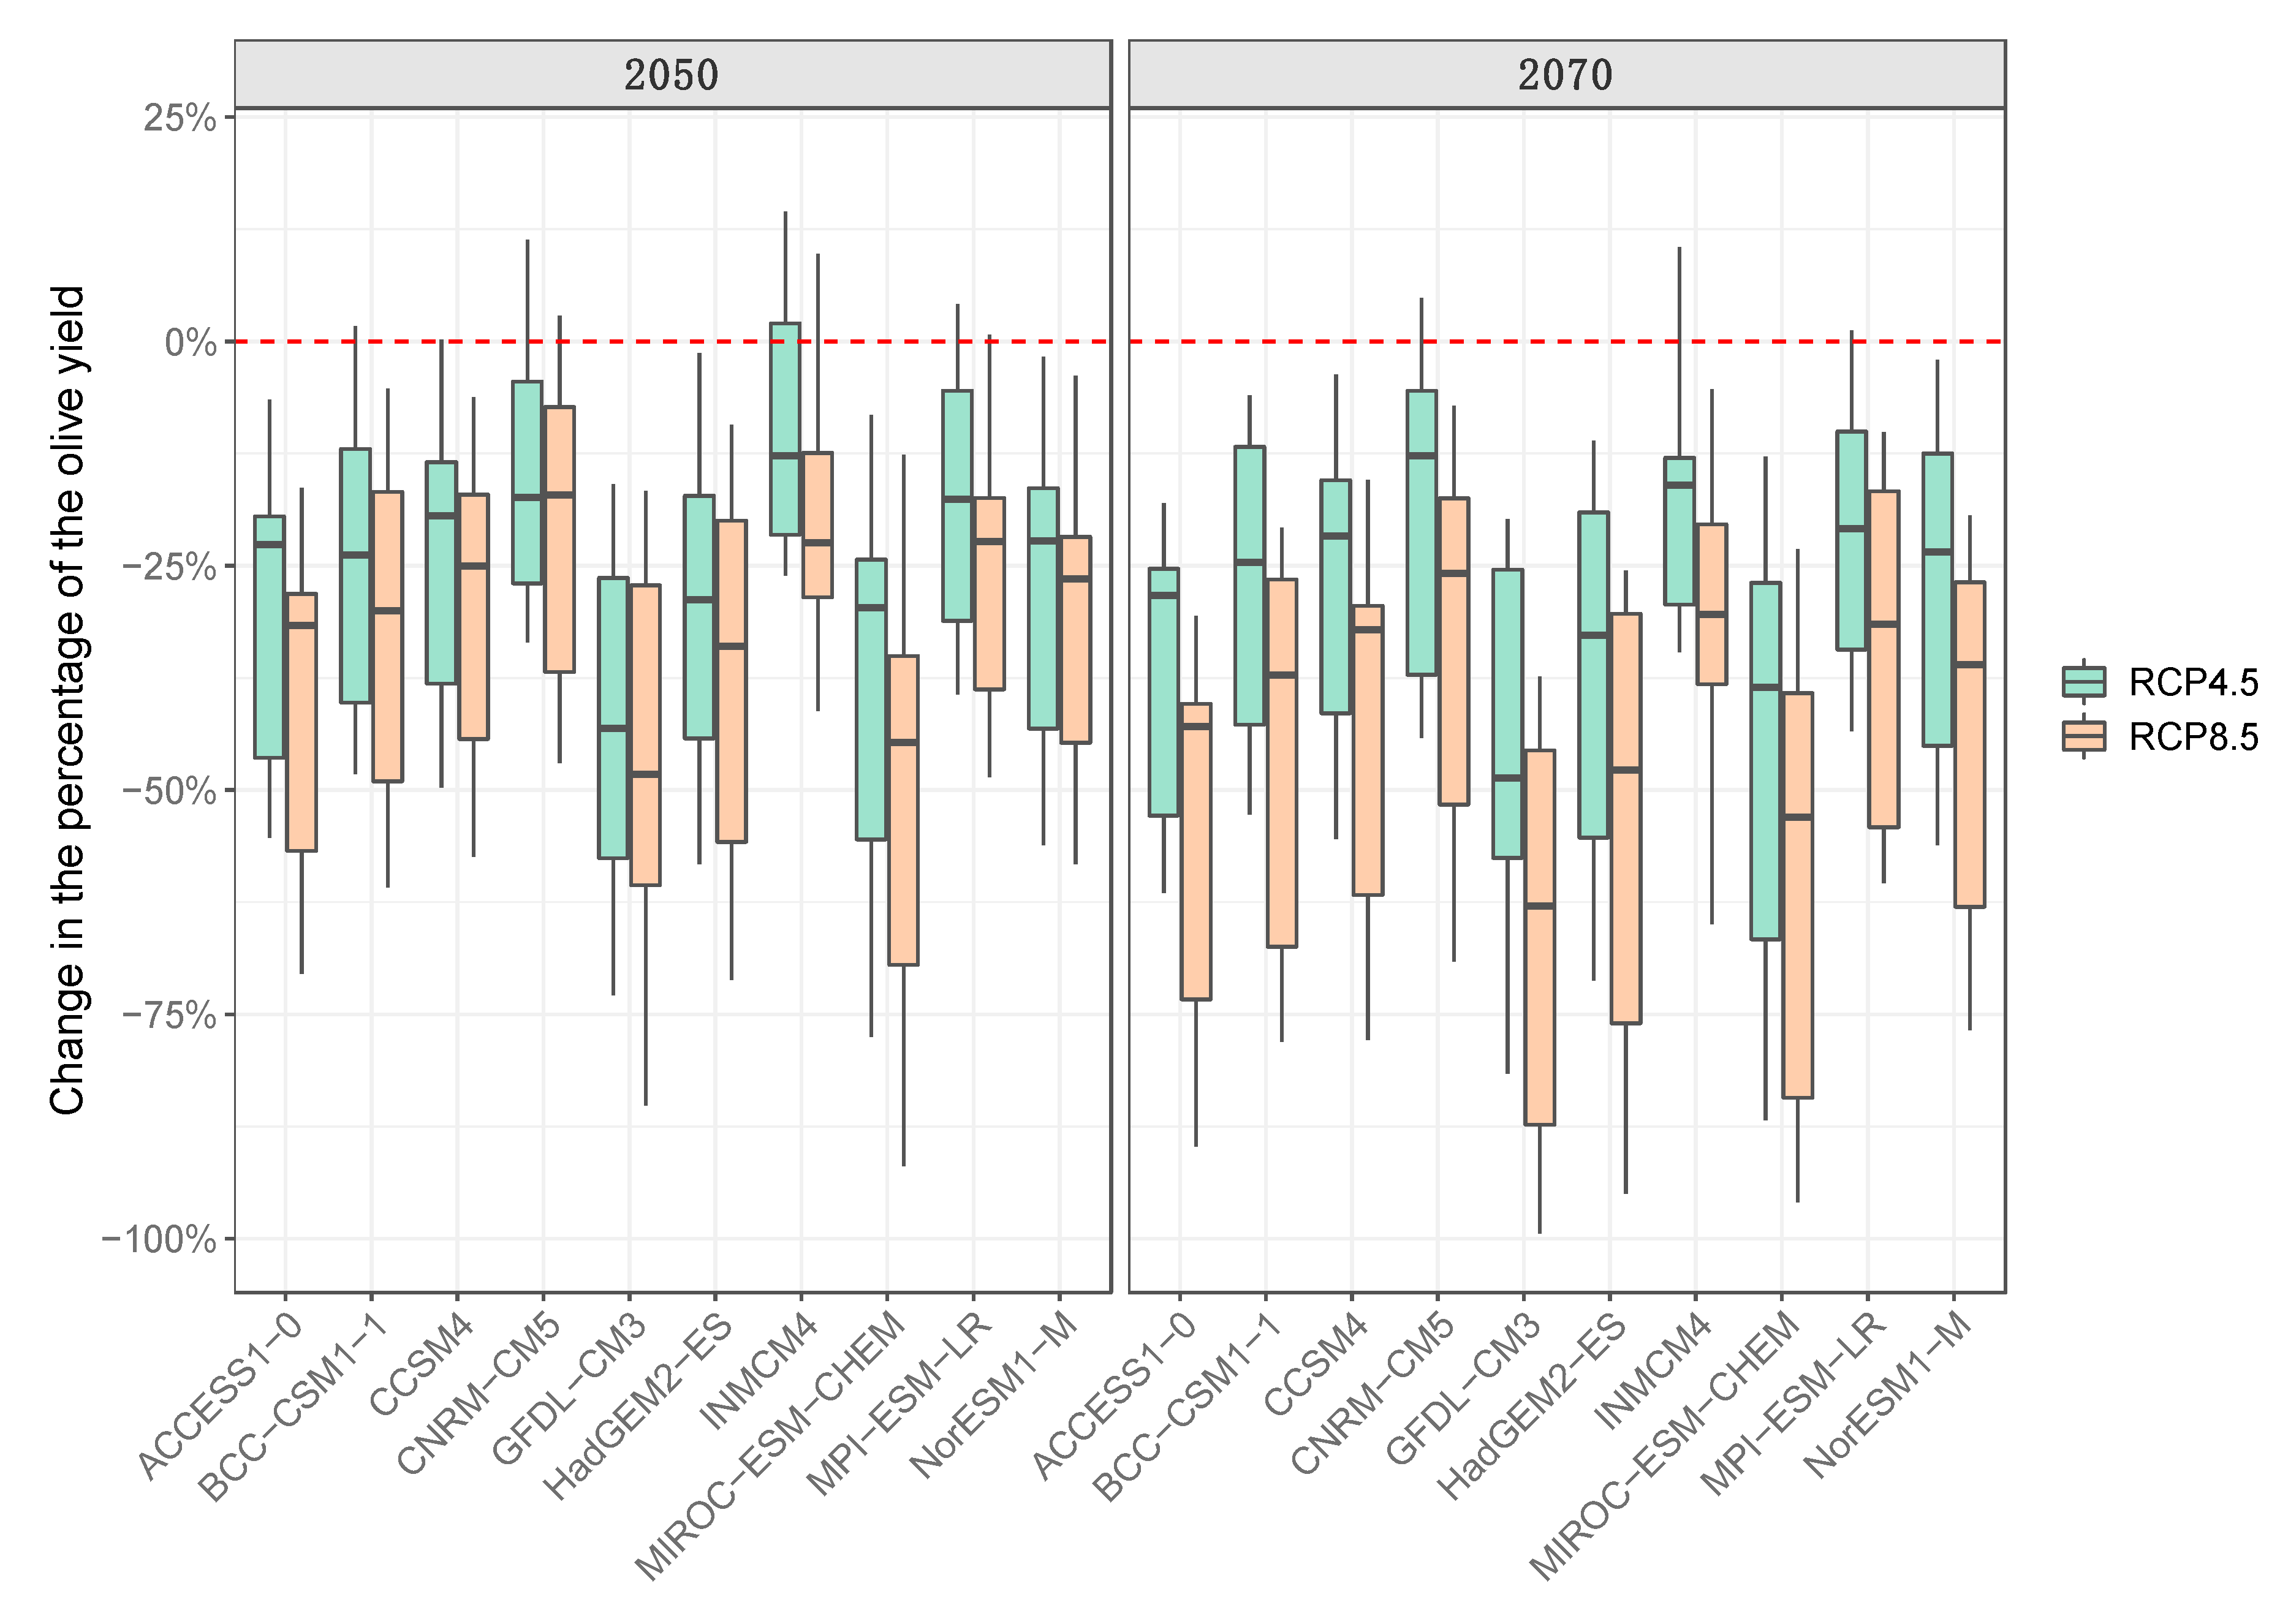
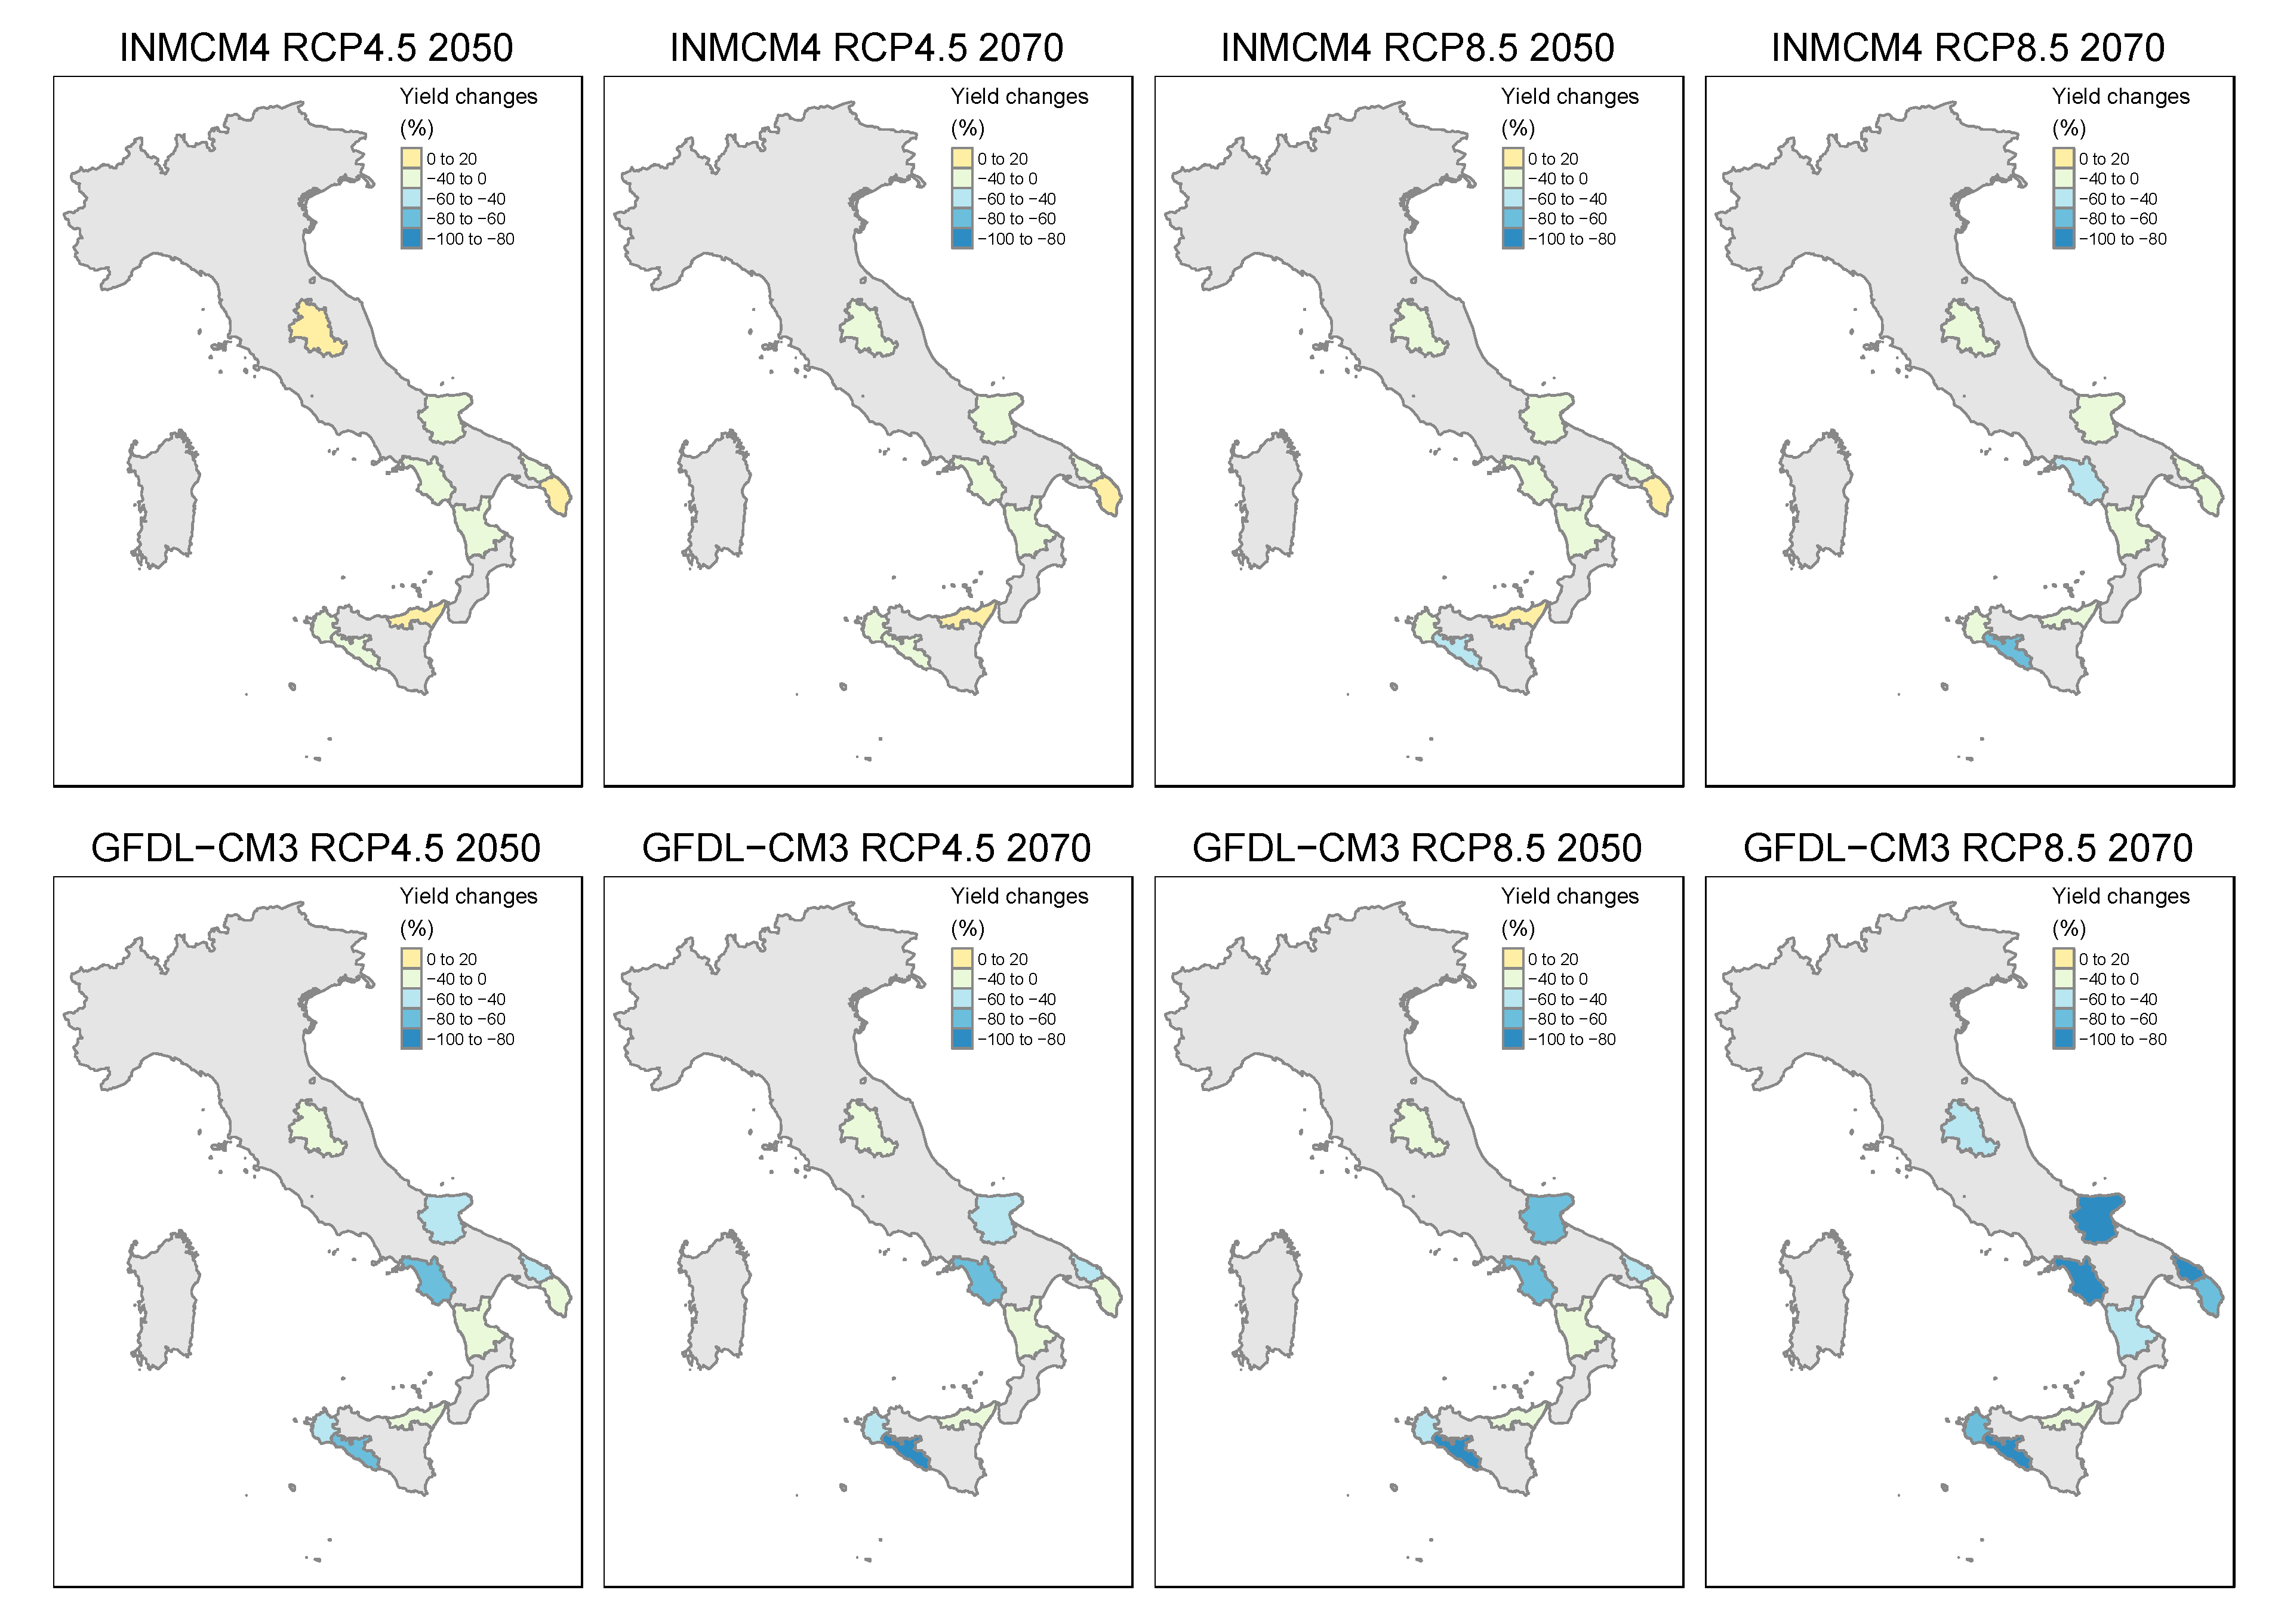
3.4. Future Olive Production Scenarios

Different olive production estimates were implemented in accordance with future climate change scenarios for two periods (2050, 2070). Figure 3 shows that the INM-CM4 and GFDL-CM3 models were the most optimistic and most pessimistic models according to change in percentage of olive production, respectively. Most of the olive areas (provinces) in the General Circulation Models (GCMs) evidenced a decrease in olive production based on changes in the meteorological variables of temperature and precipitation projected for the time periods of 2050 and 2070 (Figure 3).
A more detailed assessment may be observed in Figure 4, where a reduction between 0–40% in olive production, or even an increase depending on the province, would be found for the most optimistic model INM-CM4 under the Representative Concentration Pathway 4.5 W/m2. However, the reduction in olive production would be considerably higher for the most pessimistic model GFDL-CM3 (Figure 4).

4. Discussion

The olive cultivation areas in Central-South Italy regions showed a very low variability and most of the provinces registered a change of less than 20% for the period of 1990–2012 (increase or decrease depending on the province). However, over the last decades, olive cultivation systems experienced significant agronomic innovations such as higher tree density with more productive cultivars and the introduction of irrigation in most areas with high labor and material inputs [31]. Intensive orchards have been spread out along the Mediterranean basin since this type of agricultural system is characterized by higher productivity [31,32,33], but at the expense of crop sustainability regarding the use of natural resources [3,34].
The intensification of olive cultivation has also reached Southern Italy [32], although it is an area showing less intensification with respect to areas of Spain or Greece, as documented by Stroosnijder et al. [35]. In most areas of Central and Southern Italy, olive groves show a sloping plantation system, which is based on the traditional importance of this species as an economic supply, especially for disadvantageous hill farms along Italy mountain chains [31,36,37]. In this context, olive groves also represent an important presence from a cultural point of view characterizing the classic Mediterranean landscape [3].
Our results for the 1999–2012 period show that the trend of olive production is highly site-dependent, decreasing in some cases due to a significant decrease in cultivation surface such as in the provinces of Bari (Apulia region) and Messina (Sicilia region). In addition, the negative trend of fruit production in the province of Messina was also related to a negative trend in pollen production. However, other remarkable cases were represented by the provinces of Perugia (Umbria region) and Lecce (Apulia region) where no effect of human land-use was considered, since the negative trend of olive production (and pollen in Perugia) happened in parallel with an increase in olive surface. Furthermore, it must be considered that data were analyzed before the initial outbreak and spread of the infectious Xylella fastidiosa disease in the Apulia region [38,39]; therefore, no additional biotic effects of this disease were included in the study.
Therefore, environmental conditions alone may be responsible for the significant trends in olive production in some areas of Central-South Italy [9], or even in combination with human factors (changes in the olive cultivation surface) [40]. In the context of this study, different regional statistical models were generated because the olive cultivation in each province is characterized by the predominance of different olive cultivars adapted to specific local conditions in Italy [41,42]. Besides, spatial differences may be the result of variations in soil quality and soil moisture retention at a very local scale. Although the olive production in each province showed different relationships with meteorological variables, the most important findings are common in the entire area.
In accordance with this statement, both minimum and maximum temperatures during spring and summer (March–August) showed a negative correlation with olive production, while precipitation showed a positive relationship. In general, the signs of these variables with respect to olive yield were supported by previous research in Italy and other Mediterranean countries [6,7,9,10]. These results highlighted the crucial role of water availability in the agrarian systems of the Mediterranean basin, not only for olive crops but also for other Mediterranean crops like grapevine or cereals [9,43,44,45].
In a typical rainfed agricultural system, such as that of the traditional olive groves, water is an important limiting environmental factor for fruit production, even if the olive tree is a drought-tolerant species, adapted to strong water deficit during summers. The control of transpiration and reduction in photosynthesis rate under water deficit in olive trees have been widely studied [46,47,48,49], and this physiological behavior limits the olive yield during long water deficit events [50]. In addition, the increase in atmospheric CO2 concentration induces stomatal closure in the climate change context [51]. Rapoport et al. [52] demonstrated that water deficit during the inflorescence formation reduced the flowering parameters and subsequently limited fruit production. However, the most drastic effect on production happened during water deficit in the initial fruit set (often in early summer), stressing the relevance of post-pollination conditions in olive crop production.
Numerous researches point to temperature as the main meteorological factor involved in the regulation of the timing of the reproductive cycle of the olive tree [11,53,54,55]; however, our results also showed a strong effect on olive yield. Moriondo et al. [56] reported a negative relationship between summer temperatures summer and olive production, coinciding with our results. In the same way, Lionello et al. [9] found the same relationship for wine production in Southern Italy.
As commented above, olive trees are able to maintain an essential stomatal control and a photosynthetic regulation as adaptation mechanisms to survive unfavorable periods from an environmental point of view, however, limiting fruit production [49,50]. These unfavorable conditions during the post-pollination period may be related to strong drought periods as well as heat waves, or a combination of both extreme weather events [56].
On the other hand, the rise in temperature may induce an increase in evapotranspiration rate, not only influenced by water deficit [57]. Higher atmospheric evaporative demand, as a consequence of temperature rise, induces drought severity [58]. Zimmerman et al. [59] documented that evapotranspiration negatively affects plant growth even in geographical areas where water availability is not a limiting factor. For this reason, potential evapotranspiration has been documented as a very relevant factor in olive crop production in such a highly water-sensitive region as the Mediterranean basin, where, in addition, even an increase in evapotranspiration may cause a decrease in suitable areas for olive crops in the future [60,61]. A decrease in suitability and production is expected, especially in areas of central and southern Iberian Peninsula, where the highest increase in evapotranspiration is projected in the Mediterranean basin [13].
In Central-South Italy, very different results were found, depending on the General Circulation Model used in the simulation, but in general, the projections under all models showed a reduction in olive crop production (−26.6 ± 17.6% and −34.1 ± 19.1% as average values, respectively, for RCPs 4.5 and 8.5 for 2050 horizon). However, in the future, olive yield reduction is expected to be lower in Italy than in Iberian areas where the progressively drier climate, due to climate changes, will worsen the current already xeric bioclimatic condition [13]. According to our results, several Italian provinces have evidenced an increase in production under the most optimistic models in this time period—for instance, Perugia in Central Italy (Umbria region), Lecce in Southern Italy (Apulia region), and Messina in North-East Sicily (Sicily region). All cases of increase in production represented less than 20% increase with respect to current production. These findings are consistent with those reported by Fraga et al. [13] for RCP 4.5. Under RCP 8.5, our projections showed higher reductions of olive production, although the provinces of Lecce and Messina maintained positive values. However, the reduction was higher when the time period considered was prolonged until 2070.
Some GCMs displayed worse future scenarios regarding olive production, with the most pessimistic model showing a decrease in all studied Italian areas even if, again, the lower reductions were produced in Perugia, Lecce, and Messina. In most of the remaining areas, the yield decrease would be very intense, exceeding 40% of the current olive production. The increase in CO2 atmospheric levels could mitigate some negative effects of climate change, positively inducing photosynthesis rates. Because of this, other physiological based models did not obtain results as drastic as in the most pessimistic scenarios (RCP 8.5) [13,62]. Otherwise, CO2 atmospheric concentrations can induce stomatal closure, producing controversial results in crop production [51].
Woody species, such as olive trees and grapevines, located in specific climatic niches (above all in Italian olive cultivation areas), are subject to a great risk from temperature increases due to climate change [63]. Future works will be necessary to provide indications for olive adaptation to changing climate scenarios and to mitigate potential quantitative and qualitative olive yield reductions. In these terms, the quality of oil produced also has to be evaluated, considering the potential link between olive life cycle and growth cycles of pests such as olive fruit fly, as revealed by the European Environment Agency Report (climate change adaptation in the agriculture sector).
The increase in aridity conditions during summer observed in areas of Italy represents an important risk for rainfed traditional orchards. Traditional crops will suffer to a greater degree as per these future predictions, also reducing their capability to compete with intensive orchards that benefit from additional water supplies [37]. The survival of traditional olive growing requires the recognition of the functional role of the traditional groves as an additional value that will make up for the lower yield [2,35,64].
Future studies are necessary to provide indications on how to adapt to climate change and to mitigate the adverse impacts, keeping in mind that conflicting land-use demands will emerge in future and they may endanger traditional olive orchards by lacking in economic viability. Our results may be used in future research to evaluate different adaptations to warmer climate strategies, including changes in olive grove management (optimum timing of certain agricultural operations, selection of cultivars, and efficient use of water and resources) [65]. Environmental suitability for olive cultivation could also be extended northwards in the Mediterranean region as a result of climate change [61]. The strategies to achieve agricultural adaptability to current and future climate change must ensure a more efficient use of water, which, in Mediterranean areas, is a very limited resource [34,43,66,67].

5. Conclusions

The results of this research, agreeing with previous studies, revealed an increase in aridity conditions in south Europe. This evidence is based on observed changes in temperature and precipitation, particularly evident in spring and summer, coinciding with the reproductive phases of fruit set and fruit development in the olive life cycle in the study areas. These climatic changes represented negative consequences for olive crop yields. Although olive cultivation areas in Italy are not the most threatened areas in the whole Mediterranean region, even the most optimistic future scenarios displayed a decrease in fruit production in most of the considered olive orchards. The effects of climate change on olive production trends are not completely clear because of the interactions between human and environmental factors. Instead, when the human management factor is removed from the models (by removing the artificial changes in emission surfaces), several areas show an increase in production in the early stages of the main climate changes, but as more drastic changes in temperature or precipitation take place, the risk to olive production will be considerably greater.

Author Contributions

Conceptualization, F.O., J.R., R.P.-B. and J.O.; methodology, F.O., J.R., and J.O.; software, J.R. and A.P.; validation, F.O., J.R., A.P., and J.O.; formal analysis, F.O. and J.R.; investigation, F.O. and J.R.; resources, J.R.; data curation, F.O.; writing—original draft preparation, F.O., R.P.-B. and J.R.; writing—review and editing, F.O., J.R., A.P., J.O., R.P.-B., and M.F.; visualization, J.R. and A.P.; supervision, F.O., R.P.-B., and M.F.; project administration, R.P.-B. and M.F.; funding acquisition, R.P.-B. and M.F. All authors have read and agreed to the published version of the manuscript.

Funding

This research received no external funding.

Acknowledgments

Antonio Picornell was supported by a pre-doctoral grant financed by the Ministry of Education, Culture and Sport of Spain, Program for the Promotion of Talent and its Employability (FPU15/01668).

Conflicts of Interest

The authors declare no conflict of interest.

References

  1. de Graaff, J.; Eppink, L.A.A.J. Olive oil production and soil conservation in southern Spain, in relation to EU subsidy policies. Land Use Policy 1999, 16, 259–267. [Google Scholar] [CrossRef]
  2. Egea, P.; Pérez y Pérez, L. Sustainability and multifunctionality of protected designations of origin of olive oil in Spain. Land Use Policy 2016, 58, 264–275. [Google Scholar] [CrossRef]
  3. Loumou, A.; Giourga, C. Olive groves: “The life and identity of the Mediterranean”. Agric. Hum. Values 2003, 20, 87–95. [Google Scholar] [CrossRef]
  4. Orlandi, F.; Aguilera, F.; Galán, C.; Msallem, M.; Fornaciari, M. Olive yields forecasts and oil price trends in Mediterranean areas: A comprehensive analysis of the last two decades. Exp. Agric. 2017, 53, 71–83. [Google Scholar] [CrossRef]
  5. Rojo, J.; Salido, P.; Pérez-Badia, R. Flower and pollen production in the ’Cornicabra’ olive (Olea europaea L.) cultivar and the influence of environmental factors. Trees 2015, 29, 1235–1245. [Google Scholar] [CrossRef]
  6. Oteros, J.; Orlandi, F.; García-Mozo, H.; Aguilera, F.; Dhiab, A.B.; Bonofiglio, T.; Abichou, M.; Ruiz-Valenzuela, L.; del Trigo, M.M.; de La Guardia, C.D.; et al. Better prediction of Mediterranean olive production using pollen-based models. Agron. Sustain. Dev. 2014, 34, 685–694. [Google Scholar] [CrossRef] [Green Version]
  7. Dhiab, A.B.; Mimoun, M.B.; Oteros, J.; Garcia-Mozo, H.; Domínguez-Vilches, E.; Galán, C.; Abichou, M.; Msallem, M. Modeling olive-crop forecasting in Tunisia. Theor. Appl. Climatol. 2017, 128, 541–549. [Google Scholar] [CrossRef]
  8. Rojo, J.; Pérez-Badia, R. Spatiotemporal analysis of olive flowering using geostatistical techniques. Sci. Total Environ. 2015, 505, 860–869. [Google Scholar] [CrossRef]
  9. Lionello, P.; Congedi, L.; Reale, M.; Scarascia, L.; Tanzarella, A. Sensitivity of typical Mediterranean crops to past and future evolution of seasonal temperature and precipitation in Apulia. Reg. Environ. Change 2014, 14, 2025–2038. [Google Scholar] [CrossRef]
  10. Ribeiro, H.; Cunha, M.; Abreu, I. Quantitative forecasting of olive yield in Northern Portugal using a bioclimatic model. Aerobiologia 2008, 24, 141. [Google Scholar] [CrossRef]
  11. Aguilera, F.; Ruiz, L.; Fornaciari, M.; Romano, B.; Galán, C.; Oteros, J.; Dhiab, A.B.; Msallem, M.; Orlandi, F. Heat accumulation period in the Mediterranean region: Phenological response of the olive in different climate areas (Spain, Italy and Tunisia). Int. J. Biometeorol. 2014, 58, 867–876. [Google Scholar] [CrossRef] [PubMed]
  12. Rallo, L.; Martin, G.C. The role of chilling and releasing olive floral buds from dormancy. HortScience 1991, 26, 751. [Google Scholar] [CrossRef] [Green Version]
  13. Fraga, H.; Pinto, J.G.; Viola, F.; Santos, J.A. Climate change projections for olive yields in the Mediterranean Basin. Int. J. Climatol. 2020, 40, 769–781. [Google Scholar] [CrossRef] [Green Version]
  14. Norrant, C.; Douguédroit, A. Monthly and daily precipitation trends in the Mediterranean (1950–2000). Theor. Appl. Climatol. 2006, 83, 89–106. [Google Scholar] [CrossRef]
  15. Guiot, J.; Cramer, W. Climate change: The 2015 Paris Agreement thresholds and Mediterranean basin ecosystems. Science 2016, 354, 465–468. [Google Scholar] [CrossRef] [PubMed]
  16. Fawcett, A.A.; Iyer, G.C.; Clarke, L.E.; Edmonds, J.A.; Hultman, N.E.; McJeon, H.C.; Rogelj, J.; Schuler, R.; Alsalam, J.; Asrar, G.R.; et al. Can Paris pledges avert severe climate change? Science 2015, 350, 1168–1169. [Google Scholar] [CrossRef] [PubMed]
  17. IPCC. Climate Change 2014: Synthesis Report. Contribution of Working Groups I, II and III to the Fifth Assessment Report of the Intergovernmental Panel on Climate Change; Core Writing Team, Pachauri, R.K., Meyer, L.A., Eds.; IPCC: Geneva, Switzerland, 2014; ISBN 978-92-9169-143-2. [Google Scholar]
  18. Orlandi, F.; Sgromo, C.; Bonofiglio, T.; Ruga, L.; Romano, B.; Fornaciari, M. Spring Influences on Olive Flowering and Threshold Temperatures Related to Reproductive Structure Formation. HortScience 2010, 45, 1052–1057. [Google Scholar] [CrossRef]
  19. ISTAT Instituto Nazionale di Statistica. Available online: http://agri.istat.it/ (accessed on 12 December 2019).
  20. European Union, Copernicus Land Monitoring Service Corine Land Cover. European Environment Agency (EEA). 2018. Available online: https://land.copernicus.eu/ (accessed on 12 January 2020).
  21. Rojo, J.; Orlandi, F.; Pérez-Badia, R.; Aguilera, F.; Ben Dhiab, A.; Bouziane, H.; Díaz de la Guardia, C.; Galán, C.; Gutiérrez-Bustillo, A.M.; Moreno-Grau, S.; et al. Modeling olive pollen intensity in the Mediterranean region through analysis of emission sources. Sci. Total Environ. 2016, 551–552, 73–82. [Google Scholar] [CrossRef]
  22. Hirst, J.M. An automatic volumetric spore trap. Ann. Appl. Biol. 1952, 39, 257–265. [Google Scholar] [CrossRef]
  23. Rojo, J.; Núñez, A.; Lara, B.; Sánchez-Parra, B.; Moreno, D.A.; Pérez-Badia, R. Comprehensive analysis of different adhesives in aerobiological sampling using optical microscopy and high-throughput DNA sequencing. J. Environ. Manage. 2019, 240, 441–450. [Google Scholar] [CrossRef]
  24. Jäger, S.; Mandrioli, P.; Spieksma, F.; Emberlin, J.; Hjelmroos, M.; Rantio-Lehtimäki, A.; Domínguez-Vilches, E.; Ickovic, M.-R. Methodology for routinely performed monitoring of airborne pollen recommendations. Aerobiologia 1995, 11, 69. [Google Scholar] [CrossRef]
  25. Galán, C.; Ariatti, A.; Bonini, M.; Clot, B.; Crouzy, B.; Dahl, A.; Fernandez-González, D.; Frenguelli, G.; Gehrig, R.; Isard, S. Recommended terminology for aerobiological studies. Aerobiología 2017, 33, 293–295. [Google Scholar] [CrossRef]
  26. Cornes, R.C.; Van der Schrier, G.; Van den Besselaar, E.J.M.; Jones, P.D. An Ensemble Version of the E-OBS Temperature and Precipitation Data Sets. J. Geophys. Res. Atmospheres 2018, 123, 9391–9409. [Google Scholar] [CrossRef] [Green Version]
  27. Cramer, W.; Guiot, J.; Fader, M.; Garrabou, J.; Gattuso, J.-P.; Iglesias, A.; Lange, M.A.; Lionello, P.; Llasat, M.C.; Paz, S.; et al. Climate change and interconnected risks to sustainable development in the Mediterranean. Nat. Clim. Change 2018, 8, 972–980. [Google Scholar] [CrossRef] [Green Version]
  28. van Vuuren, D.P.; Edmonds, J.; Kainuma, M.; Riahi, K.; Thomson, A.; Hibbard, K.; Hurtt, G.C.; Kram, T.; Krey, V.; Lamarque, J.-F.; et al. The representative concentration pathways: An overview. Clim. Change 2011, 109, 5–31. [Google Scholar] [CrossRef]
  29. Hijmans, R.J.; Cameron, S.E.; Parra, J.L.; Jones, P.G.; Jarvis, A. Very high resolution interpolated climate surfaces for global land areas. Int. J. Climatol. 2005, 25, 1965–1978. [Google Scholar] [CrossRef]
  30. Fick, S.E.; Hijmans, R.J. WorldClim 2: New 1-km spatial resolution climate surfaces for global land areas. Int. J. Climatol. 2017, 37, 4302–4315. [Google Scholar] [CrossRef]
  31. Fleskens, L. A typology of sloping and mountainous olive plantation systems to address natural resources management. Ann. Appl. Biol. 2008, 153, 283–297. [Google Scholar] [CrossRef]
  32. Stillitano, T.; De Luca, A.I.; Iofrida, N.; Falcone, G.; Spada, E.; Gulisano, G. Economic analysis of olive oil production systems in southern Italy. Calitatea 2017, 18, 107. [Google Scholar]
  33. Melgar, J.C.; Mohamed, Y.; Navarro, C.; Parra, M.A.; Benlloch, M.; Fernández-Escobar, R. Long-term growth and yield responses of olive trees to different irrigation regimes. Agric. Water Manag. 2008, 95, 968–972. [Google Scholar] [CrossRef]
  34. Pellegrini, G.; Ingrao, C.; Camposeo, S.; Tricase, C.; Contò, F.; Huisingh, D. Application of water footprint to olive growing systems in the Apulia region: A comparative assessment. J. Clean. Prod. 2016, 112, 2407–2418. [Google Scholar] [CrossRef]
  35. Stroosnijder, L.; Mansinho, M.I.; Palese, A.M. OLIVERO: The project analysing the future of olive production systems on sloping land in the Mediterranean basin. J. Environ. Manage. 2008, 89, 75–85. [Google Scholar] [CrossRef]
  36. de Graaff, J.; Duran Zuazo, V.-H.; Jones, N.; Fleskens, L. Olive production systems on sloping land: Prospects and scenarios. J. Environ. Manage. 2008, 89, 129–139. [Google Scholar] [CrossRef]
  37. Duarte, F.; Jones, N.; Fleskens, L. Traditional olive orchards on sloping land: Sustainability or abandonment? J. Environ. Manage. 2008, 89, 86–98. [Google Scholar] [CrossRef]
  38. White, S.M.; Bullock, J.M.; Hooftman, D.A.P.; Chapman, D.S. Modelling the spread and control of Xylella fastidiosa in the early stages of invasion in Apulia, Italy. Biol. Invasions 2017, 19, 1825–1837. [Google Scholar] [CrossRef] [Green Version]
  39. Martelli, G.P.; Boscia, D.; Porcelli, F.; Saponari, M. The olive quick decline syndrome in south-east Italy: A threatening phytosanitary emergency. Eur. J. Plant Pathol. 2016, 144, 235–243. [Google Scholar] [CrossRef]
  40. Ribeiro, H.; Abreu, I.; Cunha, M. Olive crop-yield forecasting based on airborne pollen in a region where the olive groves acreage and crop system changed drastically. Aerobiologia 2017, 33, 473–480. [Google Scholar] [CrossRef]
  41. Sarri, V.; Baldoni, L.; Porceddu, A.; Cultrera, N.G.M.; Contento, A.; Frediani, M.; Belaj, A.; Trujillo, I.; Cionini, P.G. Microsatellite markers are powerful tools for discriminating among olive cultivars and assigning them to geographically defined populations. Genome 2006, 49, 1606–1615. [Google Scholar] [CrossRef] [PubMed] [Green Version]
  42. Rotondi, A.; Magli, M.; Ricciolini, C.; Baldoni, L. Morphological and molecular analyses for the characterization of a group of Italian olive cultivars. Euphytica 2003, 132, 129–137. [Google Scholar] [CrossRef]
  43. Iglesias, A.; Mougou, R.; Moneo, M.; Quiroga, S. Towards adaptation of agriculture to climate change in the Mediterranean. Reg. Environ. Change 2011, 11, 159–166. [Google Scholar] [CrossRef]
  44. van Leeuwen, C.; Destrac-Irvine, A.; Dubernet, M.; Duchêne, E.; Gowdy, M.; Marguerit, E.; Pieri, P.; Parker, A.; de Rességuier, L.; Ollat, N. An Update on the Impact of Climate Change in Viticulture and Potential Adaptations. Agronomy 2019, 9, 514. [Google Scholar] [CrossRef] [Green Version]
  45. Quiroga, S.; Iglesias, A. A comparison of the climate risks of cereal, citrus, grapevine and olive production in Spain. Agric. Syst. 2009, 101, 91–100. [Google Scholar] [CrossRef]
  46. Connor, D.J.; Fereres, E. The Physiology of Adaptation and Yield Expression in Olive. In Horticultural Reviews; Janick, J., Ed.; John Wiley & Sons, Inc.: Oxford, UK, 2010; pp. 155–229. ISBN 978-0-470-65088-2. [Google Scholar]
  47. Angelopoulos, K.; Dichio, B.; Xiloyannis, C. Inhibition of photosynthesis in olive trees (Olea europaea L.) during water stress and rewatering. J. Exp. Bot. 1996, 47, 1093–1100. [Google Scholar] [CrossRef] [Green Version]
  48. Connor, D.J. Adaptation of olive (Olea europaea L.) to water-limited environments. Aust. J. Agric. Res. 2005, 56, 1181–1189. [Google Scholar] [CrossRef]
  49. Moriana, A.; Villalobos, F.J.; Fereres, E. Stomatal and photosynthetic responses of olive (Olea europaea L.) leaves to water deficits. Plant Cell Environ. 2002, 25, 395–405. [Google Scholar] [CrossRef]
  50. Giorio, P.; Sorrentino, G.; d’Andria, R. Stomatal behaviour, leaf water status and photosynthetic response in field-grown olive trees under water deficit. Environ. Exp. Bot. 1999, 42, 95–104. [Google Scholar] [CrossRef]
  51. Manning, W.J.; Tiedemann, A.V. Climate change: Potential effects of increased atmospheric Carbon dioxide (CO2), ozone (O3), and ultraviolet-B (UV-B) radiation on plant diseases. Environ. Pollut. 1995, 88, 219–245. [Google Scholar] [CrossRef]
  52. Rapoport, H.F.; Hammami, S.B.M.; Martins, P.; Pérez-Priego, O.; Orgaz, F. Influence of water deficits at different times during olive tree inflorescence and flower development. Environ. Exp. Bot. 2012, 77, 227–233. [Google Scholar] [CrossRef] [Green Version]
  53. Rojo, J.; Pérez-Badia, R. Effects of topography and crown-exposure on olive tree phenology. Trees 2014, 28, 449–459. [Google Scholar] [CrossRef]
  54. Orlandi, F.; Garcia-Mozo, H.; Dhiab, A.B.; Galán, C.; Msallem, M.; Romano, B.; Abichou, M.; Dominguez-Vilches, E.; Fornaciari, M. Climatic indices in the interpretation of the phenological phases of the olive in mediterranean areas during its biological cycle. Clim. Change 2013, 116, 263–284. [Google Scholar] [CrossRef]
  55. Oteros, J.; García-Mozo, H.; Vázquez, L.; Mestre, A.; Domínguez-Vilches, E.; Galán, C. Modelling olive phenological response to weather and topography. Agric. Ecosyst. Environ. 2013, 179, 62–68. [Google Scholar] [CrossRef]
  56. Moriondo, M.; Ferrise, R.; Trombi, G.; Brilli, L.; Dibari, C.; Bindi, M. Modelling olive trees and grapevines in a changing climate. Environ. Model. Softw. 2015, 72, 387–401. [Google Scholar] [CrossRef]
  57. Valdes-Abellan, J.; Pardo, M.A.; Tenza-Abril, A.J. Observed precipitation trend changes in the western Mediterranean region. Int. J. Climatol. 2017, 37, 1285–1296. [Google Scholar] [CrossRef]
  58. Vicente-Serrano, S.M.; Lopez-Moreno, J.-I.; Beguería, S.; Lorenzo-Lacruz, J.; Sanchez-Lorenzo, A.; García-Ruiz, J.M.; Azorin-Molina, C.; Morán-Tejeda, E.; Revuelto, J.; Trigo, R.; et al. Evidence of increasing drought severity caused by temperature rise in southern Europe. Environ. Res. Lett. 2014, 9, 044001. [Google Scholar] [CrossRef]
  59. Zimmermann, J.; Hauck, M.; Dulamsuren, C.; Leuschner, C. Climate Warming-Related Growth Decline Affects Fagus sylvatica, But Not Other Broad-Leaved Tree Species in Central European Mixed Forests. Ecosystems 2015, 18, 560–572. [Google Scholar] [CrossRef]
  60. Arenas-Castro, S.; Gonçalves, J.; Moreno, M.; Villar, R. Projected climate changes are expected to decrease the suitability and production of olive varieties in southern Spain. Sci. Total Environ. 2019, 136161. [Google Scholar] [CrossRef]
  61. Tanasijevic, L.; Todorovic, M.; Pereira, L.S.; Pizzigalli, C.; Lionello, P. Impacts of climate change on olive crop evapotranspiration and irrigation requirements in the Mediterranean region. Agric. Water Manag. 2014, 144, 54–68. [Google Scholar] [CrossRef]
  62. Viola, F.; Caracciolo, D.; Pumo, D.; Noto, L.V.; Loggia, G.L. Future Climate Forcings and Olive Yield in a Mediterranean Orchard. Water 2014, 6, 1562–1580. [Google Scholar] [CrossRef] [Green Version]
  63. Jacobs, C.; Berglund, M.; Kurnik, B.; Dworak, T.; Marras, S.; Mereu, V.; Michetti, M. Climate Change Adaptation in the Agriculture Sector in Europe (No. 4/2019); European Environment Agency (EEA): Luxembourg, 2019.
  64. Palese, A.M.; Pergola, M.; Favia, M.; Xiloyannis, C.; Celano, G. A sustainable model for the management of olive orchards located in semi-arid marginal areas: Some remarks and indications for policy makers. Environ. Sci. Policy 2013, 27, 81–90. [Google Scholar] [CrossRef]
  65. Moriondo, M.; Bindi, M.; Kundzewicz, Z.W.; Szwed, M.; Chorynski, A.; Matczak, P.; Radziejewski, M.; McEvoy, D.; Wreford, A. Impact and adaptation opportunities for European agriculture in response to climatic change and variability. Mitig Adapt Strateg Glob Change 2010, 15, 657–679. [Google Scholar] [CrossRef]
  66. De Luca, A.I.; Falcone, G.; Stillitano, T.; Iofrida, N.; Strano, A.; Gulisano, G. Evaluation of sustainable innovations in olive growing systems: A Life Cycle Sustainability Assessment case study in southern Italy. J. Clean. Prod. 2018, 171, 1187–1202. [Google Scholar] [CrossRef]
  67. Ronchail, J.; Cohen, M.; Alonso-Roldán, M.; Garcin, H.; Sultan, B.; Angles, S. Adaptability of Mediterranean Agricultural Systems to Climate Change: The Example of the Sierra Mágina Olive-Growing Region (Andalusia, Spain). Part II: The Future. Weather Clim. Soc. 2014, 6, 451–467. [Google Scholar] [CrossRef] [Green Version]
Figure 1. Trend analysis of pollen and fruit crop production at a significance level of 90% (A); and changes in olive surface (%) based on the raster data for the CORINE Land Cover project (1990–2012) (B).
Atmosphere 11 00595 g001
Figure 2. Trends of climatic variables in Italy (Tmax, maximum temperature; Tmin, minimum temperature; Prec, accumulated precipitation). The colors represent significant slopes of regression for the trends (significance level 95%). Trends were calculated using seasonal periods: Winter, December-January-February; Spring, March-April-May; Summer, June-July-August; Autumn, September-October-November.
Atmosphere 11 00595 g002
Figure 3. Changes in the percentage of olive production according to 10 future General Circulation Models (GCMs) under two scenarios of emission (Representative Concentration Pathways, 4.5 and 8.5 W/m2) for two time periods (2050 and 2070).
Atmosphere 11 00595 g003
Figure 4. Changes of olive production (percentage) in the most pessimistic (GFDL-CM3) and optimistic (INM-CM4) General Circulation Model under two scenarios of emission (Representative Concentration Pathways, 4.5 and 8.5 W/m2) for two time periods (2050 and 2070).
Atmosphere 11 00595 g004
Table 1. Provinces, mean olive cultivation area, olive fruit production, and Annual Pollen Integral (APIn) for the period of 1999–2012. Olive surface data are only available for 2007 onwards.
ProvinceOlive Cultivation Area (Ha)Olive Production (ton)Annual Pollen Integral (pollen*day/m3)Main Olive Cultivars
MeanCV (%)MeanCV (%)MeanCV (%)
AGRIGENTO25,5510.00857,6930.23058210.555Biancolilla, Cerasuola
MESSINA35,1220.00028,1310.42721,4910.233Minuta, Verdello
PALERMO22,8700.00142,3530.47510,5380.508Ogliarola messinese, Biancolilla
TRAPANI19,5000.05139,1890.24610,6730.460Nocellara del Belice, Giarraffa
CATANZARO44,6270.071150,7830.20115,7450.839Carolea, Frantoio, Ottobratica
COSENZA49,7550.000205,5820.19028,0320.669Cassanese, Carolea
R.CALABRIA57,7050.000440,5280.20414,3030.745Ottobratica, Cassanese
BARI119,5670.143399,4130.26419,5350.550Coratina, Ogliarola Barese
BRINDISI63,6000.000173,8080.20122,5710.585Ogliarola salentina, Coratina
FOGGIA54,1670.027160,0570.17912,9660.866Peranzana, Ogliarola
LECCE90,9740.010342,3510.22124,0940.378Cellina di Nardo, Ogliarola salentina
TARANTO37,3670.032102,4010.31316,6830.583Cellina di Nardo, Coratina
AVELLINO83760.01218,7180.26112,8891.091Ravece, Olivella
BENEVENTO13,7980.00233,6500.26866950.793Ortolana, Ortice
SALERNO39,8920.032127,4060.25210,5390.887Rotondella, Carpellese, Frantoio
PERUGIA18,2040.00042,8600.32828680.683Leccino, Frantoio, Moraiolo, D.Agogia
Table 2. Regression analysis for olive fruit production (dependent variable), with Annual Pollen Integral (Pollen) and environmental variables as independent variables. Only significant models.
ParametersValuesVariablesCoefficientsSEt-Value
AGRIGENTO
Number variables3Intercept96,870.60478,103.916411.9536 ***
R20.9081Pollen2.03210.43184.7058 ***
Adj R20.8805TminMay−6,524.3502973.6561−6.7009 ***
Square Root of MSE4,588.5720PrecJul1,331.2963214.51466.2061 ***
TRAPANI
Number variables3Intercept137,190.268346,517.66982.9492 *
R20.8554Pollen0.79540.29192.7244 *
Adj R20.8120TmaxAug−3,582.50201,495.3202−2.3958 *
Square Root of MSE4,175.5278PrecJul2,738.50261,014.37132.6997 *
MESSINA
Number variables3Intercept125,813.427331,010.31474.0571 **
R20.8316Pollen1.34110.33424.0134 **
Adj R20.7811TmaxMar−7,546.75481,653.5233−4.5640 **
Square Root of MSE5,624.5244PrecJun154.981759.09292.6227 *
BRINDISI
Number variables3Intercept439,816.218279,471.32845.5343 ***
R20.7310Pollen0.79750.43981.8134
Adj R20.6503TminApr−15,897.98114,415.8283−3.6002 **
Square Root of MSE20,653.1753TminJun−10,028.81675,467.5199−1.8343
FOGGIA
Number variables3Intercept425,863.904442,372.855010.0504 ***
R20.9029Pollen0.99890.26313.7973 **
Adj R20.8738TminMAM−34,377.14524,853.2473−7.0833 ***
Square Root of MSE10,163.0282PrecJJA534.2408216.89152.4632 *
LECCE
Number variables3Intercept715,385.564321,195.15993.3758 **
R20.8262Pollen3.63771.16853.1131 *
Adj R20.7741TminAug−24,996.681110,270.8654−2.4337 *
Square Root of MSE35,927.5585PrecAug1,279.8089490.25932.6105 *
COSENZA
Number variables3Intercept1272,059.85716,494.74787.7122 ***
R20.8417Pollen0.95650.34182.7986 *
Adj R20.7942TmaxApr−32,195.13177,281.8865−4.4213 **
Square Root of MSE17,692.3170TmaxMay−17,237.88636,159.7210−2.7985 *
SALERNO
Number variables3Intercept598,829.7079132,125.9714.5323 **
R20.7337Pollen1.57390.57352.7444 *
Adj R20.6538TmaxMay−10,671.30714,236.2426−2.5191 *
Square Root of MSE18,891.0535TminMAM−28,199.90109,266.5209−3.0432 *
PERUGIA
Number variables3Intercept119,825.985246,966.57172.5513 *
R20.8589Pollen2.94911.20062.4563 *
Adj R20.8165TmaxJul−3381.52861,402.7783−2.4106 *
Square Root of MSE6,022.4721PrecMAM372.3352153.07632.4323 *
Abbreviations: R2, coefficient of determination; Adj R2, adjusted coefficient of determination; MSE, mean standard error; SE, standard error; t-value, statistics; Tmax, maximum temperature; Tmin, minimum temperature; Prec, accumulated precipitation; Mar, March; Apr; April; May, May; Jun, June; Jul, July; Aug, August; MAM, spring March-April-May; JJA, summer June-July-August. Significance levels: * p < 0.05; ** p < 0.01; *** p < 0.001.
Table 3. Reduction of olive fruit production based on hypothetical changes in predictive variables of the models showed in Table 2. Abbreviations: Tmax, maximum temperature; Tmin, minimum temperature; Prec, accumulated precipitation; Mar, March; Apr; April; May, May; Jun, June; Jul, July; Aug, August; MAM, spring March-April-May; JJA, summer June-July-August.
AGRIGENTOMESSINATRAPANI
ProductionVariable1Variable2ProductionVariable1Variable2ProductionVariable1Variable2
TminMayPrecJul TmaxMarPrecJun TmaxAugPrecJul
−0.55%0%−5%−0.77%0%−5%−0.56%0%−5%
−0.99%0%−10%−1.39%0%−10%−1.02%0%−10%
−4.97%5%0%−23.26%5%0%−14.15%5%0%
−10.94%10%0%−51.17%10%0%−31.13%10%0%
−5.53%5%−5%−24.03%5%−5%−14.72%5%−5%
−5.97%5%−10%−24.65%5%−10%−15.17%5%−10%
−11.49%10%−5%−51.94%10%−5%−31.70%10%−5%
−11.94%10%−10%−52.56%10%−10%−32.15%10%−10%
BRINDISIFOGGIALECCE
ProductionVariable1Variable2ProductionVariable1Variable2ProductionVariable1Variable2
TminAprTminJun TminMAMPrecJJA TminAugPrecAug
−4.51%0%5%−0.27%0%−5%−0.30%0%−5%
−9.93%0%10%−0.49%0%−10%−0.53%0%−10%
−3.66%5%0%−8.98%5%0%−7.03%5%0%
−8.05%10%0%−19.75%10%0%−15.46%10%0%
−8.17%5%5%−9.25%5%−5%−7.32%5%−5%
−13.58%5%10%−9.47%5%−10%−7.56%5%−10%
−12.56%10%5%−20.03%10%−5%−15.75%10%−5%
−17.97%10%10%−20.24%10%−10%−15.99%10%−10%
COSENZASALERNOPERUGIA
ProductionVariable1Variable2ProductionVariable1Variable2ProductionVariable1Variable2
TmaxAprTmaxMay TmaxMayTminMAM TmaxJulPrecMAM
−10.77%0%5%−9.03%0%5%−2.53%0%−5%
−23.68%0%10%−19.86%0%10%−4.55%0%−10%
−15.82%5%0%−10.12%5%0%−12.81%5%0%
−34.81%10%0%−22.27%10%0%−28.18%10%0%
−26.59%5%5%−19.15%5%5%−15.34%5%−5%
−39.51%5%10%−29.99%5%10%−17.36%5%−10%
−45.58%10%5%−31.30%10%5%−30.71%10%−5%
−58.50%10%10%−42.13%10%10%−32.73%10%−10%

