Article

Indication of the Two Linear Correlation Methods Between Vegetation Index and Climatic Factors: An Example in the Three River-Headwater Region of China During 2000–2016

1
State Key Laboratory of Severe Weather, Chinese Academy of Meteorological Sciences, Beijing 100081, China
2
Institute of Remote Sensing Application, Sichuan Academy of Agricultural Sciences, Chengdu 610066, China
3
Collaborative Innovation Centre on Forecast and Evaluation of Meteorological Disasters, Nanjing University of Information Science & Technology, Nanjing 210044, China
*
Author to whom correspondence should be addressed.
Atmosphere 2020, 11(6), 606; https://doi.org/10.3390/atmos11060606
Submission received: 11 May 2020 / Revised: 2 June 2020 / Accepted: 5 June 2020 / Published: 9 June 2020

Abstract

:
The within-growing-season correlations (WGSC) and the inter-growing-season correlations (IGSC) are widely used linear correlation analysis methods between vegetation index and climatic factors (such as temperature, precipitation, and so on). The WGSC method usually calculates the linear correlation coefficient between vegetation index and climatic factors of each month in all the growing seasons, for instance, whether vegetation index or temperature had data of 204 months (12 months × 17 years) during 2000–2016 to get the WGSC. The IGSC calculates the linear correlation coefficient between the vegetation index and climatic factors in the same month of each growing season among all the years, for example, only 17 couples’ data of vegetation index and temperature during 2000–2016 were used to get the linear correlation of IGSC. What is the difference between the results of the two methods and why do the results show that difference? Which is the more suitable method for the analysis of the relationship between the vegetation index and climatic conditions? To clarify the difference of the two methods and to explore more about the relationship between the vegetation index and climatic factors, we collected the data of 2000–2016 moderate resolution imaging spectroradiometer (MODIS) 13A1 normalized difference vegetation index (NDVI) and the meteorological data-temperature and precipitation, then calculated WGSC and IGSC between NDVI and the climatic factor in three river-headwater regions of China. The results showed that: (1) As for WGSC, the more of the years included, the higher the correlation coefficient between NDVI and the temperature/precipitation. The correlation coefficient of WGSC is dependent on how many years’ the data were included, and it was increased with the more year’s data included, while the correlation coefficients of IGSC are relatively independent on the amount of the data; (2) the WGSC showed a pseudo linear correlation between NDVI and climatic conditions caused by the accumulation of data amount, while the IGSC can more accurately indicate the impact of climatic factors on vegetation since it did not rely on the data amount.

1. Introduction

As an important part of terrestrial ecosystems, the vegetation is not only an indicator of global and regional environmental changes, but also plays an important role in regulating regional and global climate [1,2,3,4]. The comprehensive understanding of the changes of the vegetation growth and its responses to climate change is significant for researchers in predicting the trend of vegetation growth in the future, regional changes of environmental conditions and ecosystem evolution [5,6,7]. Normalized difference vegetation index (NDVI) can reflect the optimal state of vegetation growth and is closely related to ground biomass [8,9,10]. It has been widely used in the study of vegetation activities/growth [11,12,13,14]. It also was used to analysis the relationship between vegetation and climate change in many researches [15,16,17,18,19,20,21].
The within-growing-season correlations (WGSC) and the inter-growing-season correlations (IGSC) are two widely used methods to explore the relationship between the vegetation index and climatic factors [16,17,21,22,23,24,25,26]. The WGSC is used to calculate the correlation coefficients between the vegetation index and climatic factor in all growing seasons, while the IGSC is used to calculate the correlation coefficients in the same month of each growing season. For instance, for the entire year, both NDVI and temperature, which had data of 204 months (12 months × 17 years) during 2000–2016, were used to get the linear correlation of IGSC in season. However, only 17 couples’ data of NDVI and temperature during 2000–2016 were used to get the linear correlation of IGSC. What is the difference between the results of the two methods and why does this difference happen? Which is the more suitable method (WGSC or IGSC) to explore the relationship between NDVI and climatic conditions? This requires further analysis.
To answer the above questions, we took the three river-headwater region as a case study and collected the data of 2000–2016 moderate resolution imaging spectroradiometer (MODIS)13A1 NDVI and the meteorological data, and calculated WGSC and IGSC between NDVI and climatic factor (temperature and precipitation). The main aims are: (1) to explore and compare the difference in relationship between NDVI and climatic factors by linear correlation coefficient (R) at various monthly time scales and (2) to select the method that is more suitable for analyzing the NDVI–climate relationship.

2. Materials and Methods
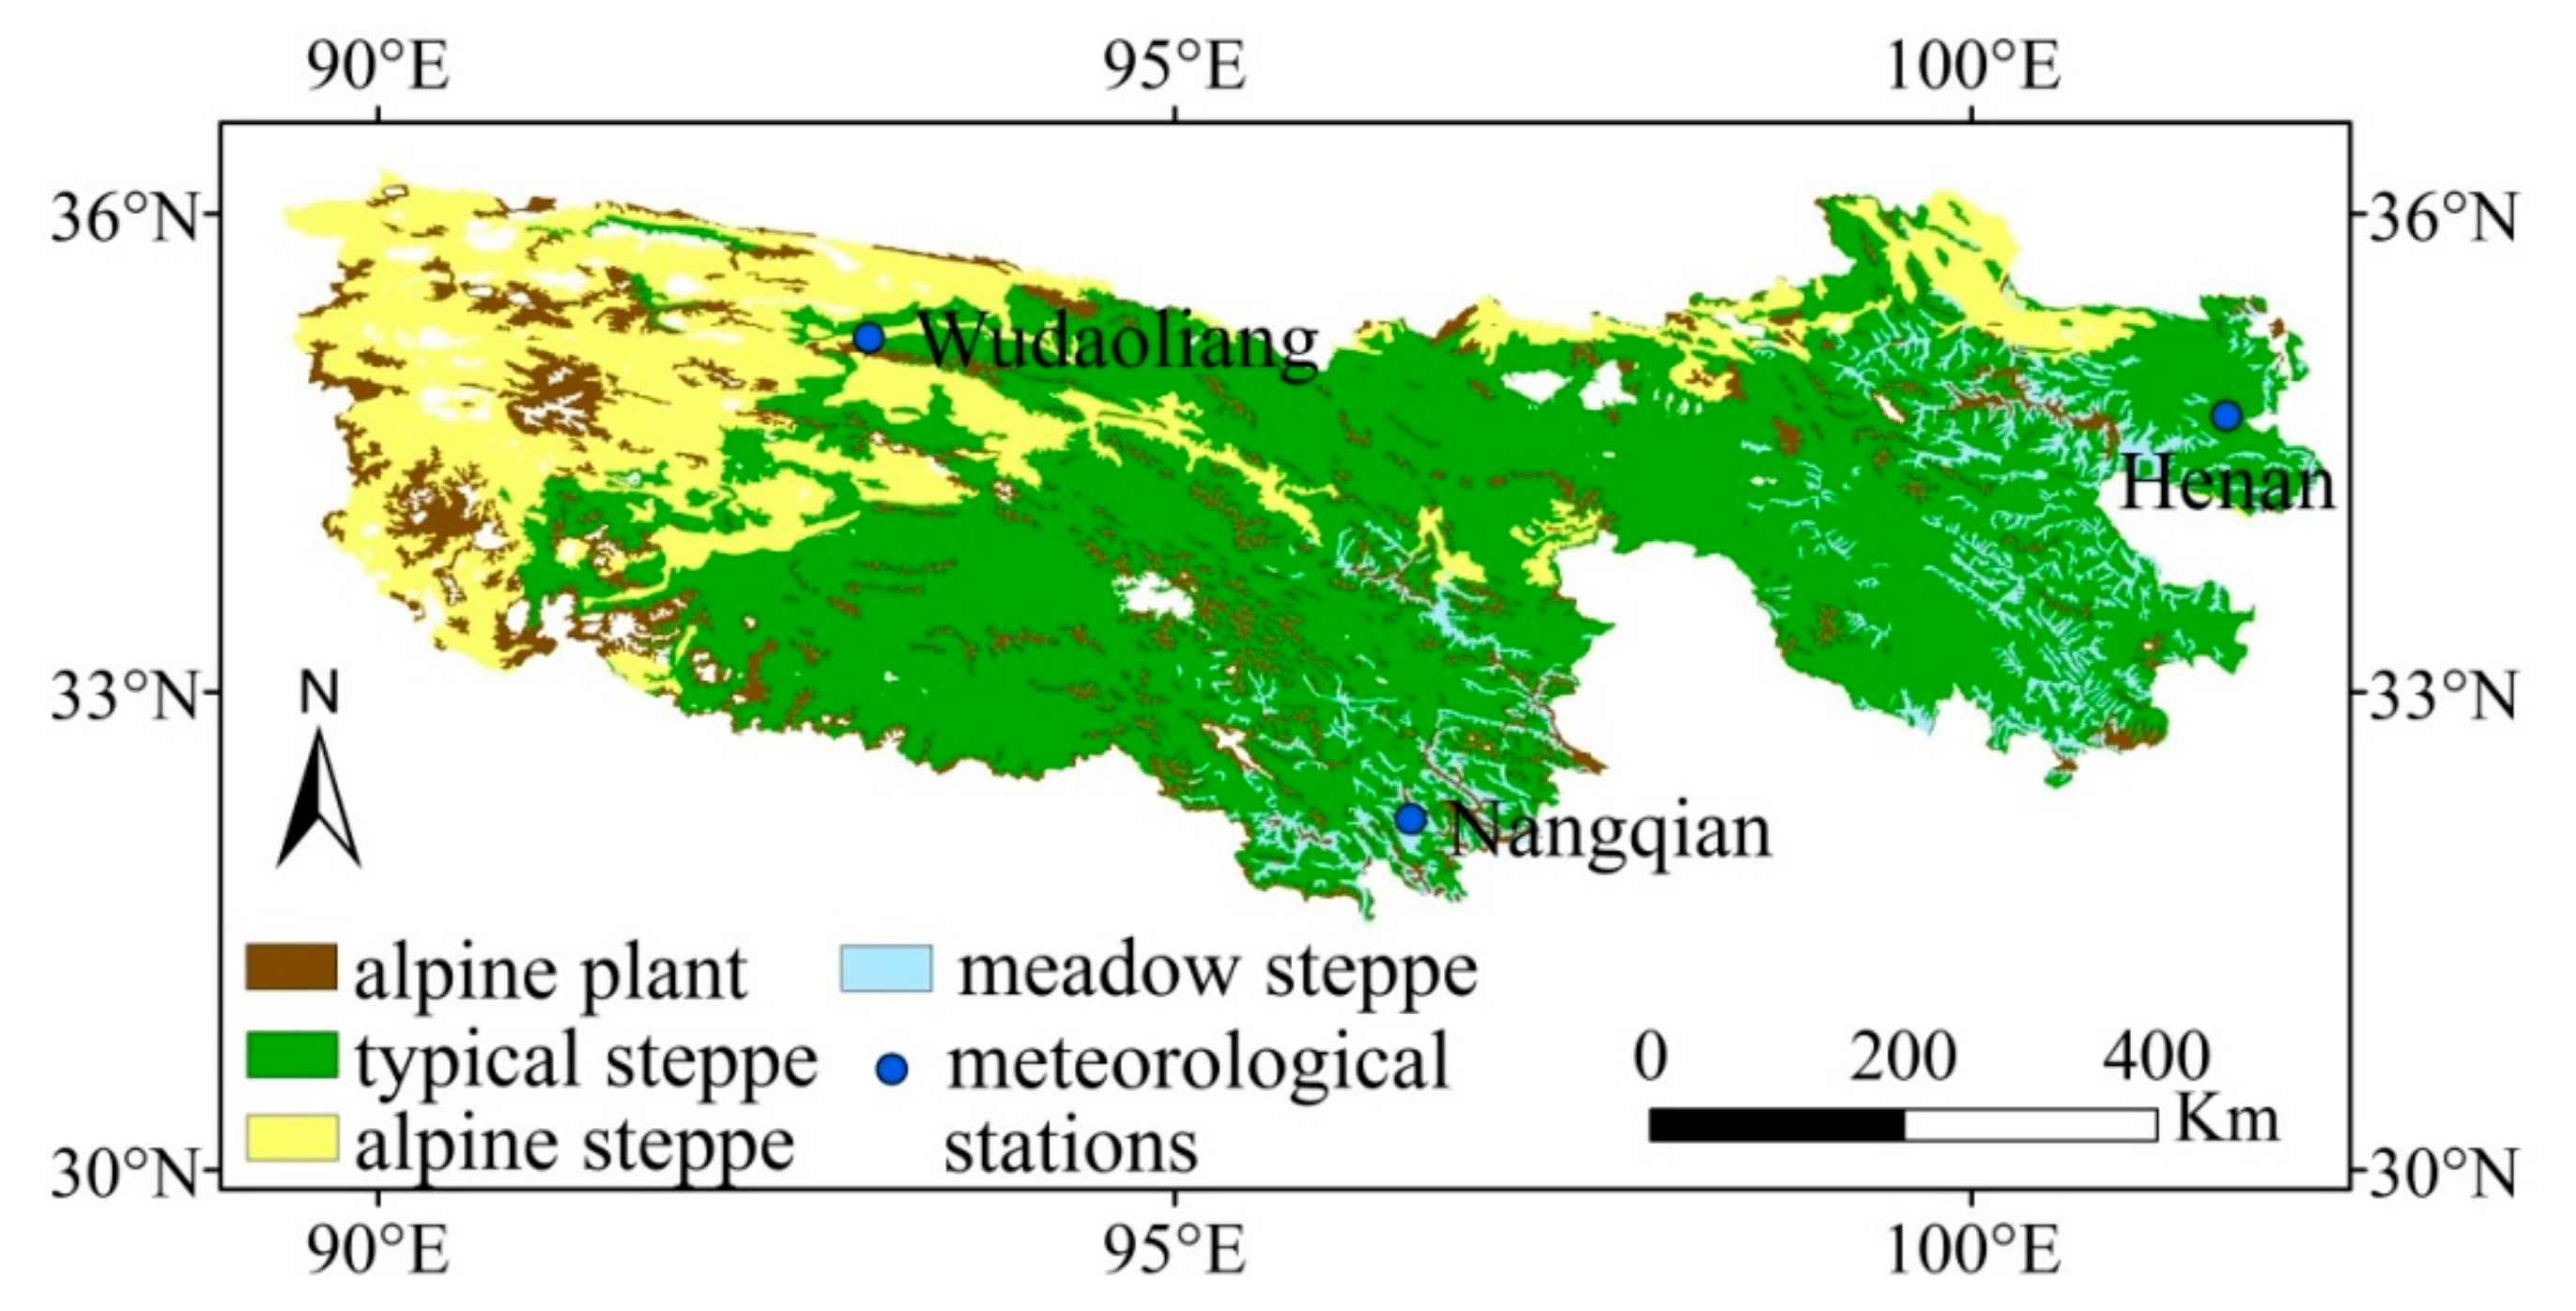
2.1. Study Area

The Three River-headwater Region (31°39’–36°12’ N, 89°45’–102°23’ E) is located along the south of the Qinghai–Tibet plateau, Three River-headwater Region is the birthplace of the Yangtze river, the Yellow River, and the Lancang river. The annual average temperature ranges from−5.6 to 3.8 °C, and the annual precipitation ranges from 262.2 to 772.8 mm. The climate of the region is dominated of the continental climate of the plateau, with obvious characteristics of the alpine climate. Precipitation is unevenly distributed within the year and concentrated in summer, with the same period of rain and heat, and precipitation gradually decreases from southeast to northwest in general. The source area of the Yellow River is located in the east with an elevation of about 4000 m; the central and western parts are the source area of the Yangtze River with an elevation of more than 4500 m; the central and southern parts are the source area of the Lancang River with an average elevation of about 4400 m.

2.2. Data Sources

The MODIS13A1 (moderate resolution imaging spectroradiometer) data were used in the study. MODIS13A1 data with every 16 days at 500-m spatial resolution as a gridded level-3 product in the Sinusoidal projection from 2000 to 2016 was downloaded from NASA (www.earthdata.nasa.gov). The radiometric correction, geometric correction and image enhancement was conducted in the dataset. Then we used the MRT (MODIS reprojection tools) to deal with the NDVI data format and projection transformation. The maximum value composite method was applied in this study to synthesize the monthly scale data in order to minimize the effects of the cloud and monthly phenology [27]. Finally we completed the remote sensing image mosaic and tailoring batch image boundaries by using ArcGIS-Python. At last the growing season of the NDVI image time-sequence in the study area was generated. Since most of three river-headwater region is located in the high altitude, most of the region’s NDVI value begins to increase when the daily average temperature rises to more than 0 °C in early May, and it reaches the maximum in July, then the NDVI value gradually reduces. The vegetation withers and stops growing at the end of September. So the area of the growing season is May to September [28,29].
The vegetation type and distribution map (1:4000,000) was get from the National Cryosphere Desert Data Center [30]. The vegetation types in the region were classed as alpine plant, typical steppe, alpine steppe, and meadow steppe, as shown in Figure 1. Since alpine plant covers only a very small area in the whole study area and no meteorological data were obtained in alpine plant area, this study only analyzed typical steppe, alpine steppe, and meadow steppe (Figure 1). The alpine steppe is mainly distributed in the northwest and southeast of the source region and consists of clumps of hardy grasses. The alpine steppe covers almost two thirds of the source area and is composed of cold-tolerant herbaceous plants. The typical steppe is scattered in the south of the Lancang river source area and the east of the Yellow River source area, mainly composed of cold-tolerant mesophilic or mesophilic herbaceous plants.
The monthly average temperature (T) and monthly precipitation (P) during 2000–2016 in the vegetation growth season were get from three meteorological stations in and around Wudaoliang, Nangqian and Henan in three river-headwater region, which were collected from the Meteorological Information Center of China Meteorological Administration.

2.3. Methods

2.3.1. Calculation of NDVI Around the Weather Station

To avoid interference of urban buildings and human factors to the vegetation in the vicinity of the site, the averaged NDVI were calculated in the area with a radius of 25 km around the weather station [31,32]. According to the vegetation type map, the vegetation types near the meteorological stations in Wudaoliang, Nangqian, and Henan in the study area are mainly alpine steppe, meadow steppe, and typical steppe.

2.3.2. Pearson Correlation Analysis

Pearson correlation analysis was applied to get the linear correlation coefficient between variables Formula (1). The range of R is from −1 to 1. If R > 0, there is a positive correlation, while if R < 0, there is a negative one. If R = 0 or about, there is no linear correlation between two variables. In the formula, n is the number of samples; xi is NDVI in the ith month; yi is the climatic factors in the I th month; and x - and y - represent the means of x and y.
R = i = 1 n x i x y i y i = 1 n x i x 2 i = 1 n y i y 2
The significance test of R is conducted by a t test, and the formula is as follows:
t = R xy , z 1 R xy , z n - m - 1
In this study, we analyzed R between NDVI and climate factor (temperature and precipitation) using two method, WGSC and IGSC. Both of them were calculated in different time scales (difference in how many years’ data included), which is shown in Table 1.
The WGSC method calculates the linear correlation coefficient between NDVIs and climatic factors in each month of all growing seasons. In the WGSC method, the NDVI monthly series (May to September, 5 months) from 2000 to 2016 (17 years) was taken as one group of variables (85 samples, 5 × 17), and the monthly climatic factor series (May to September) was another group (85 samples). R was calculated using Formula (1). Similarly, R in 2006–2016 (55 samples), 2010–2016 (35 samples), 2014–2016 (15 samples), and in only 2016 (5 samples) were calculated Table 1. In contrast, IGSC calculates the linear correlation coefficient between NDVI and the climatic conditions in the same month of each growing season among all the years. The NDVI in May from 2000 to 2016 was taken as one group of variables (17 samples) and the climatic factors in May from 2000 to 2016 as another group (17 samples), then R was calculated Table 1. Similarly, R of NDVI and climatic factors in May/June/July/August/ September in 2003–2016 (14 samples), 2006–2016 (11 samples), 2009–2016 (8 samples), and 2012–2016 (5 samples) were calculated respectively Table 1.
Lilliefors test for normality of meteorological data was conducted in MATLAB, and the results are shown in Table 2. The precipitation and temperature data were normally distributed.

3. Results

3.1. WGSC Between NDVI and Climatic Factors

The R of NDVI and monthly mean temperature in different time scales was calculated (Table 3), and R of NDVI and monthly precipitation in different time scales was shown as well (Table 4).
Table 3 shows that NDVI of both meadow steppe and typical steppe had a significant positively correlation with monthly mean temperature in periods of 2000–2016, 2006–2016, 2010–2016, and 2014–2016, while alpine steppe NDVI and monthly mean temperature were significantly positively correlated in periods of 2000–2016, 2006–2016, and 2010–2016. With the accumulation of time length (years), R of NDVI and monthly mean temperature generally presents an increasing trend, this is to say, the longer the time series is, the higher the correlation coefficient is. When the time series was short (2016 and 2014–2016), R of the alpine steppe NDVI and the monthly mean temperature was lower than that of the other two types of grassland.
Table 4 shows that meadow steppe NDVI and monthly precipitation were significantly positively correlated in periods of 2000–2016, 2006–2016, and 2010–2016. The alpine steppe NDVI and monthly precipitation were significantly positively correlated in periods of 2000–2016. R of typical steppe NDVI and monthly precipitation was not higher than that of the other two types of steppe and precipitation. All the three different types of grassland showed a trend of increase in R with the increase of duration length, which was similar to the results in Table 3.
Comparing the two R s between NDVI and the climatic factors, R between NDVI and monthly precipitation was lower than it between NDVI and monthly mean temperature. This shows that the vegetation is more sensitive to temperature than it is to precipitation. The reason is that the three river-headwater region is located in the hinterland with high altitude, and the climate is cold all year. The vegetation growth in the region is more sensitive to temperature than precipitation [33].
Table 3 and Table 4 both showed that with the accumulation of years, the correlation coefficients between the two factors were also increased gradually as the time interval longer. Figure 2 and Figure 3 show the fitting lines of three different types of steppe NDVI in different time scales in WGSC. It shows that with the lengthening of time series, the number of samples included in calculation increased, and R values kept increasing and gradually approached 1.

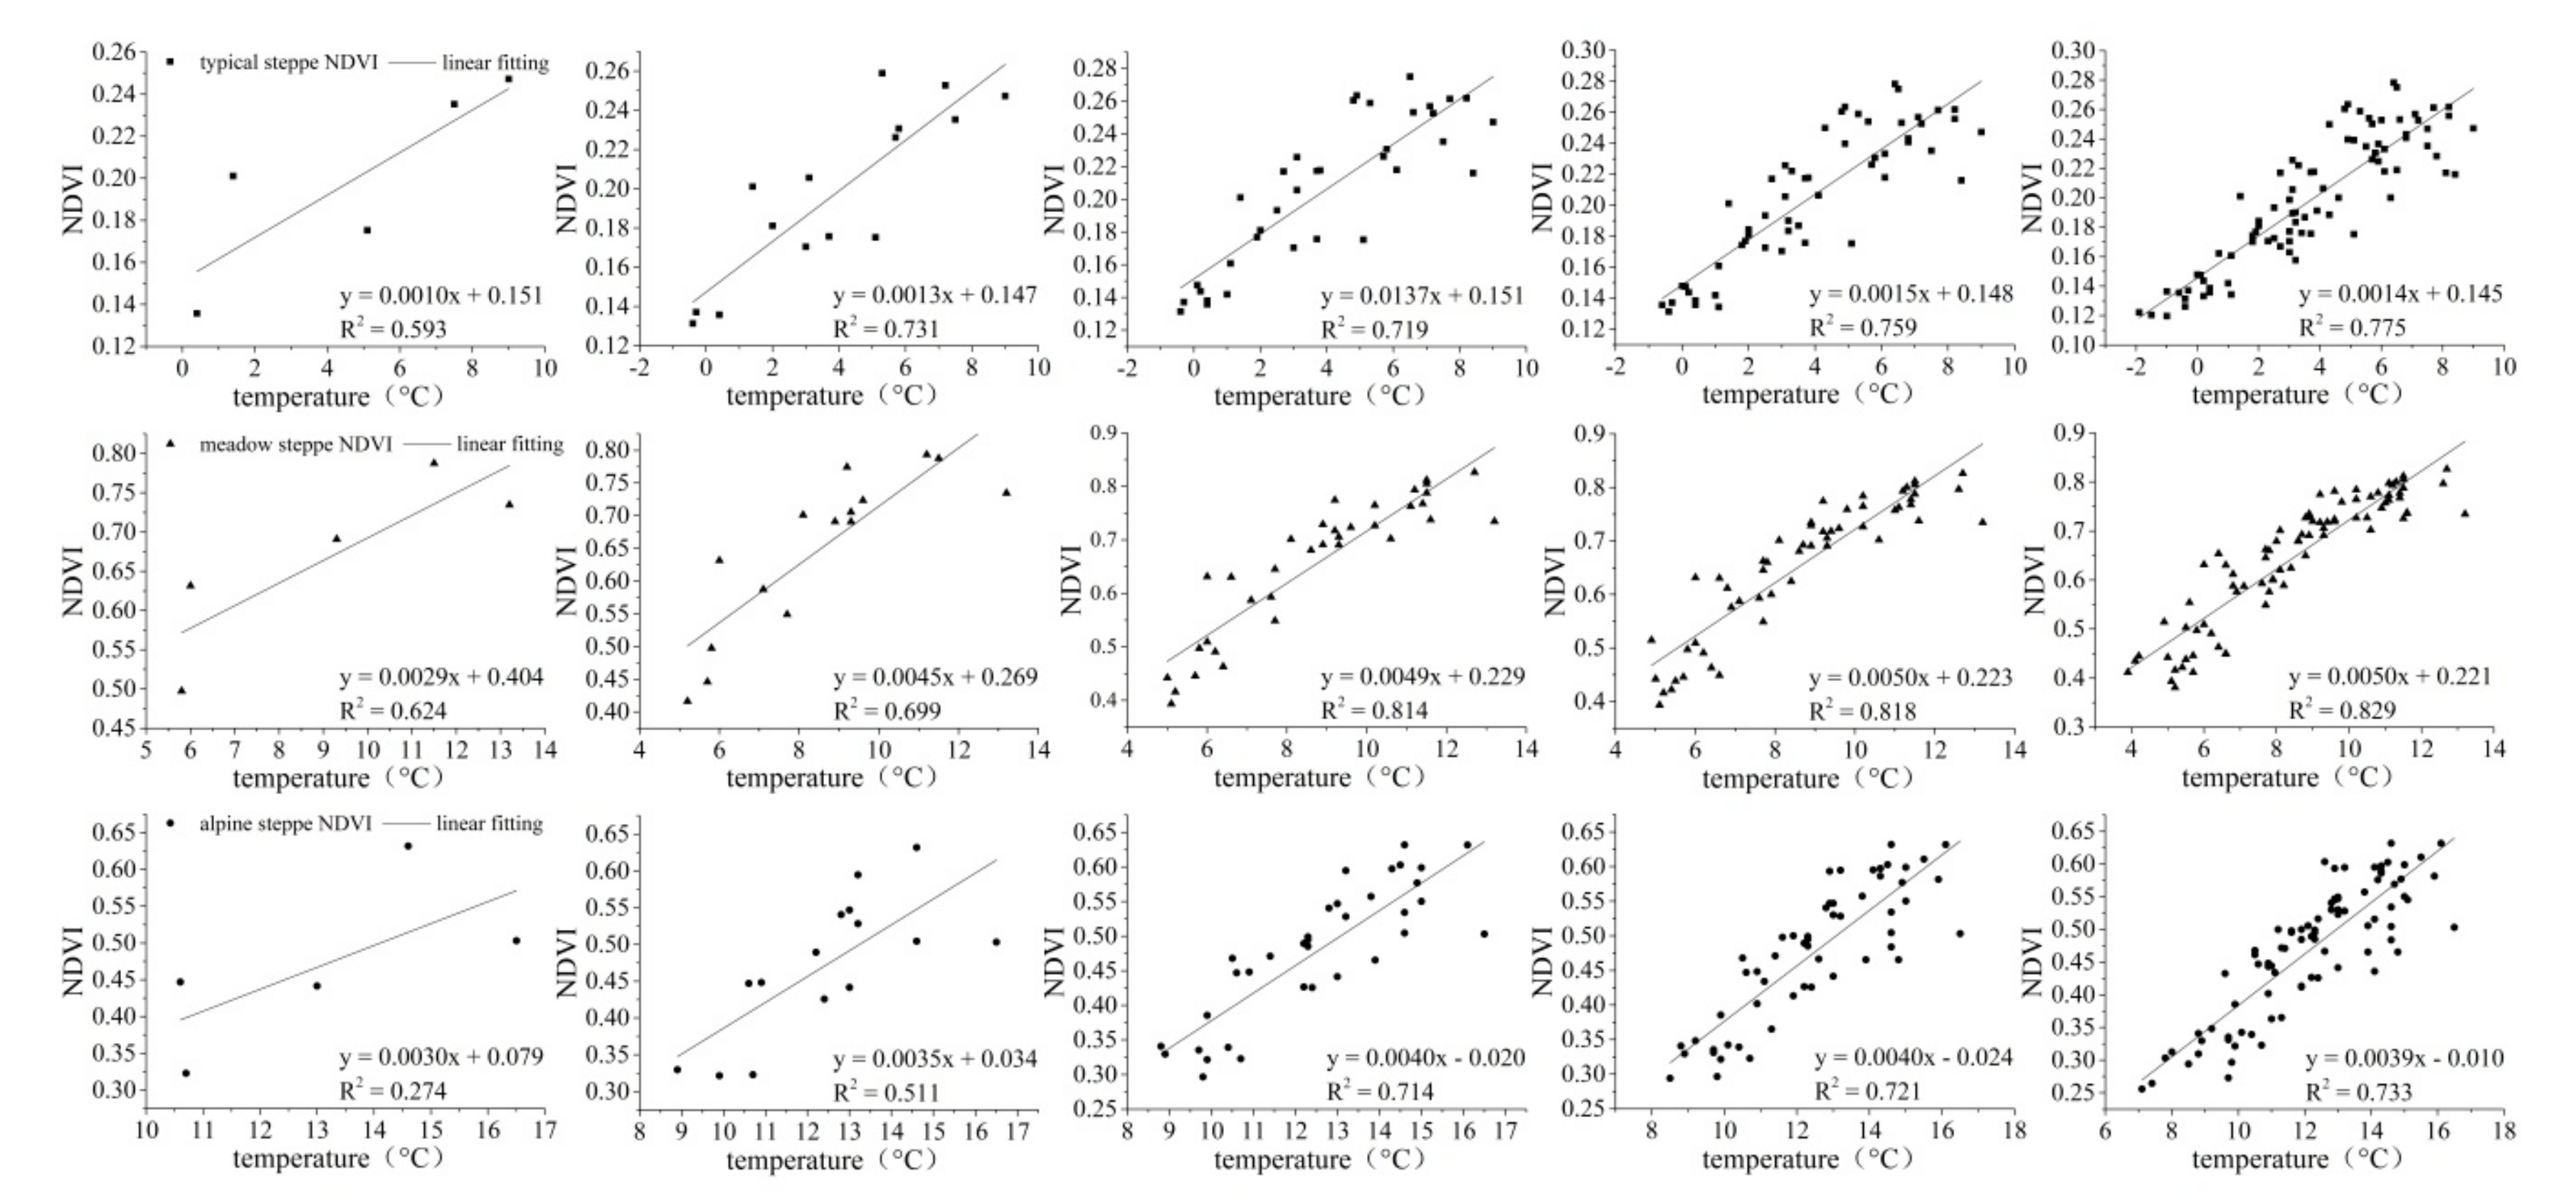
3.2. IGSC Between NDVI and Climatic Factors

Table 5 shows R between NDVI and each month mean temperature (May, June, July, August, and September) in the inter-grown-seasons during 2000–2016. Compared to R between NDVI and climatic factors in WGSC during 2000–2016 (Table 3), R in IGSC was smaller. There were significant correlations between the temperature and meadow steppe, alpine steppe in May, and typical steppe in June. The results indicated that the temperature in May could promote the growth of meadow steppe and alpine steppe, and in June it could benefit the growth of the typical steppe. In the early stage of vegetation growth (May) in the three river-headwater region, the temperature had a significant impact on NDVI, while had little impact at the end of the growing season.
Table 6 shows the R between NDVI and monthly precipitation in the inter-grown-seasons during 2000–2016.
In July, there were significantly positive correlations between precipitation and the meadow steppes, and the typical steppe, while the relationship between precipitation and the alpine steppe was not significant in the whole growing season. It showed the meadow steppes and typical steppe was sensitive to precipitation in the middle of the growing season (July and August for meadow steppe only), this is because the precipitation absorbed by the vegetation root would promote the growth of grass, which could increase the NDVI value.

3.3. IGSC Between NDVI and Climate at Different Time Scales

The changes in R between NDVI and climatic conditions (temperature and precipitation) were analyzed at various time scales Figure 4. With the length of duration increased, R between NDVI and precipitation fluctuated slightly for all the types of the vegetation in IGSC, while R between NDVI and temperature had no accordant trends.

4. Discussion

The growth of vegetation is mainly driven by water and heat conditions. Moderate temperature and adequate precipitation usually lead to a high vegetation index. However, this repetition over the years will bring out a high correlation [31]. From the linear fitting degree of NDVI in the within-growing-season, it is found that with the increase of duration length, the number of samples in the linear relation calculation also increases, and R will increase continuously and gradually approach to 1. However, most of the former studies have not considered the phenomenon of synchronization of precipitation and temperature when analyzing the NDVI–climate relationship, so there needs more verification [31,32,34,35]. The purpose of a linear correlation analysis between NDVI and climatic conditions is to use a month of meteorological data to predict crop biomass or vegetation index. For example, if the correlation coefficient is 0.8, which means a climatic factor such as temperature or precipitation can be used to predict the vegetation index with 80% probability. Theoretically, the correlation coefficient does not change with the change of the sample amount. So, the WGSC may indicate a pseudo correlation between NDVI and climatic factors, which may not reasonably explain the correlation between NDVI and climatic conditions.
The IGSC between NDVI and climatic conditions was analyzed separately at different time scales. This method can reduce the influence of synchronization of precipitation and temperature, avoid to producing highly repetitive results, and eliminate the false correlation.

5. Conclusions

In this study, we took the Three River-Headwater region as a study area and analyzed the linear correlations between NDVI and climatic conditions (such as monthly mean temperature and monthly precipitation) used two different methods (WGSC and IGSC). We explored the variation and trends of both WGSC and IGSC between NDVI and climatic conditions at various monthly time scales. The main conclusions are as follows:
(1)
The relationship between NDVI and climate was different when comparing WGSC and IGSC. As for WGSC, the R between NDVI and the temperature or precipitation increased with the lengthening of durations.
(2)
The correlation coefficients of WGSC are more dependent on the duration length. It would increase with the accumulation of growing seasons used in the calculation. However, the correlation coefficients of IGSC are relatively independent of data included.
(3)
Since the synchronization of rainfall and temperature in a year, it indicate that WGSC was a pseudo linear correlation between NDVI and climatic conditions caused by the accumulation of the sample amount, which may not truly indicate the influence of precipitation and temperature on vegetation growth. It is found after separate analyses at different time scales that the IGSC can eliminate the impact of synchronization of precipitation and temperature. Thus, the results obtained by this method may be more reasonable to explain the relation between NDVI and climatic factors.
There are many challenges in the exploration of the relationship between vegetation and climate due to the complexity of the vegetation response to the environment. These findings may be helpful on how to choose a more reasonable linear correlation method to study the relationship of NDVI–climate. The purpose of the study was to clarify the difference of the two widely used linear correlation analysis methods between the vegetation index and climatic factors. Therefore, we considered the single-factor linear correlation between precipitation and temperature temporarily, and further research about multiple factors and the interaction between each factor is necessary.

Author Contributions

Conceptualization, S.F.; data collection and process, J.X.; writing and editing, S.F., J.X., X.L. and Z.J.; supervision, S.F.; project administration, S.F. and X.L.; data quality control, J.X. and Z.J. All authors have read and agreed to the published version of the manuscript.

Funding

This research was funded by National Key Research and Development Program of China, grant number 2019YFC1510205 and 2018YFC1506500, Fundamental Research Funds, grant number 2019Z010.

Acknowledgments

This research was funded by National Key Research and Development Program of China, (2019YFC1510205 and 2018YFC1506500) and Fundamental Research Funds (2019Z010). The meteorological data were obtained from the Meteorological Information Center of China Meteorological Administration. We express our heartfelt thanks to all of them here!

Conflicts of Interest

The authors declare no conflict of interest.

References

  1. Sun, H.Y.; Wang, C.Y.; Niu, Z. Analysis of the vegetation cover change and the relationship between NDVI and Environment Factors by using NOAA time Series data. J. Remote Sens. 1998, 2, 204–210. [Google Scholar] [CrossRef]
  2. Bounoua, L.; Collatz, G.J.; Los, S.O.; Sellers, P.J.; Dazlich, D.A.; Tucker, C.J.; Randall, D.A. Sensitivity of climate to changes in NDVI. J. Clim. 2000, 13, 2277–2292. [Google Scholar] [CrossRef] [Green Version]
  3. Chen, H.L.; Xu, X.D.; Du, Z.X.; Zou, C.H. Vegetation activity responses to climate change in the Huang-Huai-Hai area based on GIMMS NDVI dataset. J. Appl. Meteorol. Sci. 2009, 20, 513–520. [Google Scholar]
  4. Xiao, J.; Moody, A. Geographical distribution of global greening trends and their climatic correlates: 1982–1998. Int. J. Remote Sens. 2005, 26, 2371–2390. [Google Scholar] [CrossRef]
  5. Fang, S.B.; Cammarano, D.; Petropoulos, G. Recent advances in earth observation technologies for agrometeorology and agroclimatology. J. Appl. Remote Sens. 2018, 12, 022201. [Google Scholar] [CrossRef]
  6. Neigh, C.S.R.; Tucker, C.J.; Townshend, J.R.G. North American vegetation dynamics observed with multi-resolution satellite data. Remote Sens. Environ. 2008, 112, 1749–1772. [Google Scholar] [CrossRef] [Green Version]
  7. Wen, Z.; Wu, S.; Chen, J.; Lü, M. NDVI indicated long-term interannual changes in vegetation activities and their responses to climatic and anthropogenic factors in the Three Gorges Reservoir Region, China. Sci. Total. Environ. 2017, 574, 947–959. [Google Scholar] [CrossRef]
  8. Li, X.; Li, X.B.; Chen, Y.H.; Ying, G. Temporal responses of vegetation to climate variables in temperate steppe of northern China. J. Plant Ecol. 2007, 31, 1054–1062. (In Chinese) [Google Scholar]
  9. Lin, Z.; Dai, A.; Dong, B. Changes in global vegetation activity and its driving factors during 1982–2013. Agric. For. Meteorol. 2018, 249, 198–209. [Google Scholar] [CrossRef]
  10. Gang, F.; Wei, S.; Shaowei, L.; Jing, Z.; Chengqun, Y.; Zhenxi, S. Modeling aboveground biomass using MODIS images and climatic data in grasslands on the Tibetan plateau. J. Resour. Ecol. 2017, 8, 42–49. [Google Scholar] [CrossRef]
  11. Fang, S.B.; Yu, W.G.; Qi, Y. Spectra and vegetation index variations in moss soil crust in different seasons, and in wet and dry conditions. Int. J. Appl. Earth Obs. Geoinf. 2015, 38, 261–266. [Google Scholar] [CrossRef]
  12. Wang, L.; Wang, P.X.; Liang, S.L.; Zhu, Y.C.; Khan, J.; Fang, S.B. Monitoring maize growth on the North China Plain using a hybrid genetic algorithm-based back-propagation neural network model. Comput. Electron. Agric. 2020. [Google Scholar] [CrossRef]
  13. Zhou, L.; Tucker, C.J.; Kaufmann, R.K.; Slayback, D.; Shabanov, N.V.; Myneni, R.B. Variations in northern vegetation activity inferred from satellite data of vegetation index during 1981–1999. J. Geo. Res. 2001, 106, 20069–20083. [Google Scholar] [CrossRef]
  14. Pettorelli, N.; Vik, J.O.; Mysterud, A.; Gaillard, J.M.; Tucker, C.J.; Stenseth, N.C. Using the satellite-derived NDVI to assess ecological responses to environmental change. Trends Ecol. Evol. 2005, 20, 503–510. [Google Scholar] [CrossRef] [PubMed]
  15. Braswell, B.H.; Schimel, D.S.; Linder, E.; Moore, B.I. The response of global terrestrial ecosystems to interannual temperature variability. Science 1997, 238, 870–872. [Google Scholar] [CrossRef]
  16. Wang, J.; Price, K.; Rich, P. Spatial patterns of NDVI in response to precipitation and temperature in the central Great Plains. Int. J. Remote Sens. 2001, 22, 3827–3844. [Google Scholar] [CrossRef]
  17. Yang, L.; Wylie, B.K.; Tieszen, L.L.; Reed, B.C. An analysis of relationships among climate forcing and time-integrated NDVI of grasslands over the US northern and central great plains. Remote Sens. Environ. 1998, 65, 25–37. [Google Scholar] [CrossRef]
  18. Chen, Y.H.; Li, X.B.; Shi, P.J. Variation in NDVI driven by climate factors across China, 1983–1992. Acta Phytoecol. Sin. 2001, 25, 716–720. [Google Scholar] [CrossRef]
  19. Chu, D.; Dejiyangzong, P. The response of typical vegetation growth to climate conditions in North Tibetan Plateau. J. Appl. Meteorol. Sci. 2007, 18, 832–839. [Google Scholar] [CrossRef]
  20. Cui, L.; Shi, J. Temporal and spatial response of vegetation NDVI to temperature and precipitation in eastern China. J. Geogr. Sci. 2010, 20, 163–176. [Google Scholar] [CrossRef]
  21. Muradyan, V.; Tepanosyan, G.; Asmaryan, S.; Saghatelyan, A.; Dell’Acqua, F. Relationships between NDVI and climatic factors in mountain ecosystems: A case study of Armenia. Remote Sensing. Appl. Soc. Environ. 2019, 14, 158–169. [Google Scholar] [CrossRef]
  22. Zhang, J.H.; Feng, Z.M.; Jiang, L.G.; Yang, Y.Z. Analysis of the Correlation between NDVI and Climate Factors in the Lancang River Basin. J. Nat. Resour. 2015, 30, 1425–1435. [Google Scholar] [CrossRef]
  23. Liu, S.H.; Yan, D.H.; Shi, X.L.; Yuan, Z. Inter-annual variability of vegetation NDVI, accumulated temperature and precipitation and their correlationsin China. Arid Land Geogr. 2014, 37, 480–489. [Google Scholar]
  24. Han, H.B.; Ma, M.G.; Yan, P. Periodicity analysis of NDVI time series and its relationship with climatic factors in the Heihe River Basin in China. Remote Sens. Technol. Appl. 2011, 26, 554–560. [Google Scholar] [CrossRef]
  25. Zhao, Y.P.; Zhang, X.Z.; Wang, J.S.; Shen, Z.X. Correlation analysis between NDVI and climatic factors of grassland ecosystems in the Northern Tibetan Plateau from 1982 to 2003. Resour. Sci. 2009, 31, 1988–1998. [Google Scholar] [CrossRef]
  26. Zhang, J.; Ge, J.P.; Guo, Q.X. The relation between the change of NDVI of the main vegetational types and the clim′atic factors in the northeast of China. Acta Ecol. Sin. 2001, 21, 522–527. [Google Scholar]
  27. Holben, B.N. Characteristics of maximum-value composite images from temporal AVHRR data. Int. J. Remote Sens. 2007, 7, 1417–1434. [Google Scholar] [CrossRef]
  28. Fan, W.W. Analysis of NDVI changes and its climate driving factors in the Three River-Headwater region during 2000-2014. Master’s Dissertation, Dept. of Science, University of Technology, Chengdu, China, 2017. [Google Scholar]
  29. Chen, Q.; Zhou, Q.; Zhang, H.F.; Liu, F.G. Spatial disparity of NDVI response in vegetation growing season to climate change in the Three-River Headwaters Region. Ecol. Environ. Sci. 2010, 26, 1284–1289. [Google Scholar]
  30. Hou, X.Y.; Sun, S.Z.; Zhang, J.W.; He, M.G.; Wang, Y.Z.; Kong, D.Z.; Wang, S.Q. The vegetation type and distribution map (1:4000,000). Available online: http://www.crensed.ac.cn/portal/metadata/6c319edb-bb30-4add-be6e-c27448ad7c6c (accessed on 8 June 2020).
  31. Shen, B.; Fang, S.B.; Li, G. Vegetation coverage changes and their response to meteorological variables from 2000 to 2009 in Naqu, Tibet, China. Can. J. Remote Sens. 2014, 40, 67–74. [Google Scholar] [CrossRef]
  32. Piao, S.; Mohammat, A.; Fang, J.; Cai, Q.; Feng, J. NDVI-based increase in growth of temperate grasslands and its responses to climate changes in China. Glob. Environ. Chang. 2006, 16, 340–348. [Google Scholar] [CrossRef]
  33. Zhang, M.T.; Zhai, Y.H.; Zhang, Z.J.; Tang, W.J.; Ma, Y.; Nie, X.M.; Ding, L.L. Quality and dynamic changes of grassland ecosystems in the Three-River Headwater Region. Res. Environ. 2017, 30, 75–81. [Google Scholar]
  34. Xu, J.X.; Fang, S.B.; Zhang, T.B.; Zhu, Y.C.; Wu, D.; Yi, G.H. NDVI changes and its correlation with climate factors of the Three River-Headwater region in growing seasons during 2000–2016. Remote Sens. Land. Res. 2020, 32, 237–246. [Google Scholar] [CrossRef]
  35. Liu, X.; Zhang, J.; Zhu, X.; Pan, Y.; Liu, Y.; Zhang, D.; Lin, Z. Spatiotemporal changes in vegetation coverage and its driving factors in the Three-River Headwaters Region during 2000–2011. J. Geogr. Sci. 2014, 24, 288–302. [Google Scholar] [CrossRef]
Figure 1. Distribution of different vegetation types in the Three River-Headwater region.
Atmosphere 11 00606 g001
Figure 2. The linear fitting degree of NDVI and temperature in the growing season of different types of steppe.
Atmosphere 11 00606 g002
Figure 3. The linear fitting degree of NDVI and precipitation in the growing season of different types of steppe. Note: All R were significant at p < 0.05.
Atmosphere 11 00606 g003
Figure 4. Changes in R between NDVI and climatic factors at various time scales in inter-growing-season correlations (IGSC). Precipitation: (a) alpine steppe, (b) typical steppe, (c) meadow steppe. Temperature: (d) alpine steppe, (e) typical steppe, and (f) meadow steppe.
Atmosphere 11 00606 g004
Table 1. Sample size.
WGSC Sample SizeIGSC Sample Size
NDVI
Monthly Series
Climate Factor
Monthly Series
Sample SizeNDVI
Monthly Series
Climate Factor
Monthly Series
Sample Size
2000–2016
May–September
2000–2016
May–September
852000–2016
May/June/July/August/September
2000–2016
May/June/July/August/September
17
2006–2016
May–September
2006–2016
May–September
552003–2016
May/June/July/August/September
2003–2016
May/June/July/August/September
14
2010– 2016
May–September
2010–2016
May–September
352006–2016
May/June/July/August/September
2006–2016
May/June/July/August/September
11
2014–2016
May–September
2014–2016
May–September
152009–2016
May/June/July/August/September
2009–2016
May/June/July/August/September
8
2016
May–September
2016
May–September
52012–2016
May/Jun/Jul/Aug/September
2012–2016
May/June/July/August/September
5
Table 2. Lilliefors test for normality.
Grassland TypeClimatic FactorsPeriodsTest StatisticCritical Value
typical steppeprecipitation20160.33240.3431
2014–20160.20300.2189
2010–20160.13780.1476
2006–20160.10180.1189
2000–20160.07410.0963
temperature20160.20990.3431
2014–20160.12580.2189
2010–20160.08010.1476
2006–20160.07050.1189
2000–20160.07140.0963
meadow steppeprecipitation20160.29120.3431
2014–20160.21400.2189
2010–20160.12570.1476
2006–20160.11600.1189
2000–20160.07620.0963
temperature20160.23220.3431
2014–20160.12610.2189
2010–20160.10270.1476
2006–20160.08210.1189
2000–20160.07540.0963
alpine steppeprecipitation20160.28200.3431
2014–20160.10430.2189
2010–20160.12770.1476
2006–20160.09640.1189
2000–20160.06440.0963
temperature20160.22550.3431
2014–20160.15020.2189
2010–20160.09610.1476
2006–20160.08610.1189
2000–20160.07400.0963
Note: the test statistic k is less than the critical value, which indicates that Lilliefors test does not reject the null hypothesis that data is normally distributed at the 5% significance level.
Table 3. Within-growing-season R between normalized difference vegetation index (NDVI) and monthly mean temperature in different periods from 2000 to 2016.
Grassland TypePeriods
20162014–20162010–20162006–20162000–2016
meadow steppe0.770 *0.855 ***0.848 ***0.871 ***0.880 ***
typical steppe0.790 *0.836 ***0.902 ***0.904 ***0.910 ***
alpine steppe0.5230.715 **0.845 ***0.849 ***0.856 ***
Note: *, ** and *** were significant at p < 0.1, p < 0.05 and p < 0.001, respectively.
Table 4. Within-growing-season R between NDVI and monthly precipitation in different periods from 2000 to 2016.
Grassland TypePeriods
20162014–20162010–20162006–20162000–2016
meadow steppe0.4560.5260.683 ***0.718 ***0.708 ***
typical steppe−0.576−0.2340.1840.286 *0.328 **
alpine steppe−0.4510.0030.302 *−0.105 **0.361 ***
Note: *, ** and *** were significant at p < 0.1, p < 0.05 and p < 0.001, respectively.
Table 5. Inter-grown-seasons R between NDVI and monthly mean temperature during 2000–2016.
Grassland TypeMayJuneJulyAugustSeptember
meadow steppe0.636 **−0.182−0.241−0.2590.316
typical steppe0.4540.595 **0.2020.533 *−0.063
alpine steppe0.566 **−0.114−0.130−0.219−0.226
Note: * and ** were significant at p < 0.1 and p < 0.05, respectively.
Table 6. Inter-grown-season R between NDVI and monthly precipitation during 2000–2016.
Grassland TypeMayJuneJulyAugustSeptember
meadow steppe0.1700.3300.620**0.496*0.214
typical steppe0.418−0.2300.528**0.2390.259
alpine steppe−0.251−0.2300.1870.2550.105
Note: * and ** were significant at p < 0.1 and p < 0.05, respectively.

