Article

Projected Future Temporal Trends of Two Different Urban Heat Islands in Athens (Greece) under Three Climate Change Scenarios: A Statistical Approach

by
Tim van der Schriek
*,
Konstantinos V. Varotsos
,
Christos Giannakopoulos
and
Dimitra Founda
Institute for Environmental Research and Sustainable Development, National Observatory of Athens, I. Metaxa & Vas. Pavlou, P. Pendeli, GR15236 Athens, Greece
*
Author to whom correspondence should be addressed.
Atmosphere 2020, 11(6), 637; https://doi.org/10.3390/atmos11060637
Submission received: 30 April 2020 / Revised: 12 June 2020 / Accepted: 15 June 2020 / Published: 16 June 2020

Abstract

:
This is the first study to look at future temporal urban heath island (UHI) trends of Athens (Greece) under different UHI intensity regimes. Historical changes in the Athens UHI, spanning 1971–2016, were assessed by contrasting two air temperature records from stable meteorological stations in contrasting urban and rural settings. Subsequently, we used a five-member regional climate model (RCM) sub-ensemble from EURO-CORDEX with a horizontal resolution of 0.11° (~12 × 12 km) to simulate air temperature data, spanning the period 1976–2100, for the two station sites. Three future emissions scenarios (RCP2.6, RCP4.5, and RCP8.5) were implanted in the simulations after 2005 covering the period 2006–2100. Two 20-year historical reference periods (1976–1995 and 1996–2015) were selected with contrasting UHI regimes; the second period had a stronger intensity. The daily maximum and minimum air temperature data (Tmax and Tmin) for the two reference periods were perturbed to two future periods, 2046–2065 and 2076–2095, under the three RCPs, by applying the empirical quantile mapping (eqm) bias-adjusting method. This novel approach allows us to assess future temperature developments in Athens under two UHI intensity regimes that are mainly forced by differences in air pollution and heat input. We found that the future frequency of days with Tmax > 37 °C in Athens was only different from rural background values under the intense UHI regime. Thus, the impact of heatwaves on the urban environment of Athens is dependent on UHI intensity. There is a large increase in the future frequency of nights with Tmin > 26 °C in Athens under all UHI regimes and climate scenarios; these events remain comparatively rare at the rural site. This large urban amplification of the frequency of extremely hot nights is likely caused by air pollution. Consequently, local mitigation policies aimed at decreasing urban atmospheric pollution are expected to be highly effective in reducing urban temperatures and extreme heat events in Athens under future climate change scenarios. Such policies directly have multiple benefits, including reduced electricity (energy) needs, improved living quality and strong health advantages (heat- and pollution-related illness/deaths).

1. Introduction

More than 65% of the world’s population is projected to live in urban areas by 2050, up from 50% at present [1]. This strong growth requires addressing serious environmental problems associated with (the expansion of) cities in order to keep them livable. One key environmental concern associated with cities is the amplification of ambient air temperatures relative to surrounding non-urban areas, thus creating a urban heat island (UHI). Its intensity is commonly quantified as the temperature difference between urban and adjacent non-urban sites [2]. Most attention has been paid to the biophysical processes that drive the UHI [3]. The main factors contributing to the UHI are (i) surface energy budget changes (artificial surfaces increase heat storage capacity compared to natural ones), (ii) reduction of evaporative cooling, (iii) differences in convective and advective flows (decreasing cooling through ventilation), and (iv) increased anthropogenic heat release in urban areas [4,5]. Daytime and nighttime UHIs are controlled by distinct processes and have markedly different intensities. Urban environments absorb efficiently short wave radiation during the daytime but impede cooling through long wave radiative processes, thus favoring warming. High heat capacities of urban surfaces result in the release of stored heat during nighttime. Anthropogenic heat emissions (e.g., exhaust gases from traffic, heating and cooling of buildings, human metabolism) are considered a major contributing factor to UHIs in developed countries [6]. Recent studies indicate that atmospheric pollution (e.g., aerosols) is also an important factor contributing to UHIs through reducing radiative cooling [7,8] and its effect on nighttime temperature is particularly large [9].
The UHI effect is city-specific and particularly dependent on urban form (including surface cover, fabric, and structure) and urban function (waste heat from human activities, atmospheric pollution), location (latitude/longitude, topography, geography, nearby water bodies), and regional climate [10,11]. Furthermore, UHIs vary on a seasonal, annual, and (multi-)decadal basis. This variability is caused by changes in meteorological conditions and urban function on seasonal and annual timescales, whereas climate and urban form/function change over (multi-)decadal timespans. This long-term UHI variability makes it difficult to incorporate the impact of future UHIs on urban temperatures in climate model simulations.
The UHI effect causes particular problems in the summer as it increases high regional temperatures, leading to increased energy consumption for cooling [12,13], exacerbation of air pollution [14], and heat-stress related illness/mortality [15,16,17]. Particularly, extreme heat events (heat waves) in urban environments cause severe environmental, economic, and public health impacts [18,19,20,21]. There is a positive feedback between heatwaves and UHIs, as diurnal UHI intensities increase with higher absolute temperatures, thus intensifying thermal risk in cities and the vulnerability of urban populations [22,23]. Global warming forcing has resulted in more frequent, severe, and longer lasting excessive heat events worldwide, while there is strong evidence that the frequency and severity of such extreme events will further increase in the future [24,25,26]. The UHI effect amplifies the impact of these excessive heat events in urban environments [11,22,27,28].
The Mediterranean region is a global climate change hot-spot and projections show significant temperature increases under most climate scenarios, with a strong increase in heatwave events up to the end of the 21st century [29,30,31,32]. Future warming in the Mediterranean region is expected to exceed global rates by 25%, with the summer warming (at a pace) 40% larger than the global mean [33]. There are temperature increases during the period 2071–2100 compared to 1990–2019, across the Mediterranean for all months of the year [34]. Projections show a statistically significant future warming trend for the Eastern Mediterranean (EM) region over the final 30 years of the 21st century [35], with annual minimum and maximum temperatures warming at rates of ~0.4–0.6 °C/decade [36]. Heat stress is projected to increase drastically in the future [37,38]. Hot summer conditions that rarely occurred in the reference period may become the norm by the middle and the end of the 21st century in the southeastern Mediterranean [39,40,41,42]. In Greece, simulations indicate further lengthening of the hot extremes’ season by approximately one month in the near future (2021–2050) and by more than two months in the distant future (2071–2100) with respect to the 1971–2000 reference period [43].
The UHI effect will likely lead to strong amplification of regional future temperature increases in urban centers across the Mediterranean. Reliable urban temperature projections are urgently required for the development of city-specific climate change mitigation policies but the non-stationary nature of UHIs over time complicates such studies. Initiatives for UHI mitigation/adaptation strategies are being interlinked with climate change policies, and cities are gaining a central role in current global agreements [44]. Climate simulations show that existing UHIs strongly amplify future regional warming rates [45,46,47,48,49,50]. Problematic with urban temperature projections is their build-in assumption that UHI intensity is stable and comparable to the reference period. However, this assumption is never true as key factors influencing the UHI effect (e.g., wind speed/direction, cloudiness, the build environment, air pollution/heat input) change over time. Creating future urban climate change projections under different UHI regimes, that are clearly linked to specific UHI variables, is important in order to assess the full range of possible temperature scenarios and the effectiveness of mitigation strategies.
This paper uses state-of-the-art regional climate models for a first-time assessment of future summer temperature trends in Athens (Greece) under two different urban heath island (UHI) intensity regimes, linked to changes in air pollution, and three climate change scenarios (Representative Common Pathways—hereafter RCP—2.6, 4.5, and 8.5). The study concentrates on the summer season as negative consequences associated with the UHI are more severe while meteorological conditions during this season are stable. The Athens summer UHI increases high regional temperatures that negatively affect energy demand, air pollution, and heat-stress related illness/mortality. The results aim to direct research, and to steer city-specific climate change mitigation strategies and policies.

1.1. Description of the Study Area

The present study focuses on the city of Athens, a large urban agglomeration containing 3.7 million people in the Eastern Mediterranean, which experiences regional warming but also urbanization effects [22]. The greater urban area of Athens (greater Athens area; GAA) is characterized by a densely build-up center bordered by widespread suburban areas. The central urban area occupies a basin surrounded by > 1000 m high mountains at three sides (NW, NE, and SE) and opening to the Saronikos Gulf in the SW (Figure 1). The center of the basin is divided by a topographic NE-SW trending topographic ridge; the meteorological station of Thissio is located on this ridge in the city center (Section 2). Most large industrial complexes are in the Thriassion plain, several kilometers to the west of the GAA. They are separated from the Athens basin by Mount Aigaleo (up to 450 m) that acts as a physical barrier preventing most of the exchange of air pollutants between the industrialized area and the city [51]. Accordingly, the UHI associated with the central urban area of Athens (Thissio) is predominantly affected by building cover/characteristics, heat emissions (exhaust gases from traffic, heating and cooling of buildings, human metabolism), and atmospheric pollution (from traffic, heating and cooling of buildings, minor industrial activity).
Athens experiences a typical Mediterranean climate with wet, mild winters and hot, dry summers. There is a well-developed UHI, with higher nighttime than daytime intensities for all seasons [22]. For summer, nighttime mean UHI intensity is ~4.5 °C and daytime mean intensity ~1.1 °C between the center of Athens at Thissio and the rural site of Tanagra. A dominant feature of the Athens UHI is its local character and pronounced spatio-temporal variability of its intensity [52,53,54,55,56]. Spatial analyses of the UHI over summer indicate that the highest temperatures are found in two areas of the city center, directly to the NW and SE of the Thissio station, that occupy the lowest-central parts of the basin [57].
Regional weather systems during the summer season over the study area are quite stable over the historical period, thus helping to isolate the possible factors affecting UHI intensity changes. Summer weather is dominated by anticyclonic circulation enhancing air temperature. Wind direction has a large influence on temperatures and atmospheric pollution levels in Athens. NE winds (out of the basin, towards the sea) cool the city, whereas southerly winds (sea breeze, into the enclosed basin) increase temperatures [23]. Sea breezes are frequent in late spring to early summer, while strong NE winds known as ‘Etesians’ are frequent in late summer and decrease air temperature/pollution levels [22].
Local warming rates in the order of 1 °C/decade since the mid-1970s are reported for the summer daily maximum air temperature (Tmax) [58]. Similar trends are observed in the summer mean air temperature (Tmean); summer daily minimum air temperature (Tmin) was found to increase at similar rates after the mid-1980s. Warming in winter is not statistically significant. Over the same period, the annual amplitude of urban heat island (UHImean) in Athens showed a progressive increase at an almost constant rate of +0.2 °C/decade, while the increase of the daytime heat island intensity in summer stood at +0.8 °C/decade.
There is a simultaneous increase in the frequency of hot days, as well as in the frequency, duration, and intensity of heat waves in the region [22,59]. Heat waves are driven by synoptic scale atmospheric processes and cause exceptionally hot urban conditions. Heat waves in Greece are usually associated with strong anticyclonic conditions and largescale subsidence (which induces adiabatic heating in the middle atmosphere) and with horizontal warm advection from northern Africa in the lower atmosphere [60]. The interaction between heat waves and the Athens UHI resulted in pronounced amplification of nocturnal UHI intensity in the inner city; daytime UHI intensity remained constant [22]. This amplification of the nocturnal heat island during heat waves has a particularly serious effect on the population of large cities. Under such extreme conditions, the human body lacks the ability to recover from the daily heat stress and this results in increased heat strokes and excess deaths [28,59].
The increasingly higher rates in the daily summer UHI intensity in Athens since 1971 are likely mainly associated with increasing anthropogenic heat emission from air cooling systems and transportation, and rising levels of air pollution [22]. Car ownership grew by 7% yearly over the past decades to 440/1000 habitants in 2008, while sales of air conditioning equipment in Greece increased tenfold between 1990 and 1996 [61]. Meanwhile, electricity use rose significantly, and peak use shifted from winter to summer by the year 2000 [62]. Long-term continuous air pollution records covering 1971–present are not available for Athens. Visibility records that are linked to atmospheric pollution suggest air pollution increased at a constant rate from 1970 until 2003, after which levels stabilized [63]. Air quality significantly decreases during heatwaves and atmospheric pollution is entrapped between the mountains that surround the city [64]. Air pollution is strengthening the UHI effect and its impact on nighttime temperature is particularly large [9].

1.2. Meteorological Stations

Bias correction of the climate change simulation results requires long-term uninterrupted meteorological records (Section 2) from stations used for calculating the Athens UHI. UHI estimations are strongly influenced by the application of different monitoring protocols and the selection of reference stations as estimations from standard fixed stations can be very different from those derived from nonstandard fixed stations or mobile traverses [65]. Accordingly, to assess the long-term trends of the UHI magnitude in Athens, we selected two permanent meteorological stations with uninterrupted measurements, lack of relocations, and minor changes in the surrounding environment. The urban station of Thissio (center of Athens) and (semi-)rural station of Tanagra fulfilled those requirements; both stations were considered suitable for establishing historical long-term UHI intensity variability [22]. There are no other urban (rural) meteorological stations with long records available in the city center (rural settings closer by).
The meteorological station of Thissio, the historical meteorological station of the National Observatory of Athens (NOA), is located on the top of a small wooded hill (107 m a.s.l.) in the center of Athens near the Acropolis [66]. The direct surroundings of the station are almost unchanged over the years, thus eliminating biases related to changes on the microscale, making it an ideal urban station that registers anthropogenic “background” heat generated in the urban Athens basin. Tanagra meteorological station (140 m a.s.l.) is located approximately 50 km NW of the city of Athens and belongs to the network of the Hellenic National Meteorological Service (HNMS). The nearby surroundings have not experienced major changes since 1975; this station was selected to represent rural conditions. There are no rural stations with long uninterrupted records within the Athens basin, while Tanagra data-series were found to be consistent with findings at the suburban Tatoi station (no uninterrupted record available) located inside the Athens basin [22].

1.3. Study Approach

We used an ensemble of high-resolution, bias-adjusted regional climate models (RCMs) from EURO-CORDEX to investigate temporal changes in the trends of two different UHIs in Athens under three climate change scenarios. The observational temperature records are split into two reference periods (respectively, 1976–1995 and 1996–2015) which are used to bias-adjust the RCM temperature results (see Section 2). These two reference periods are characterized by distinct UHI regimes (Section 3), most likely related to changes in air pollution and heat input. Urban conditions did not change between the two reference periods at the site of the Thissio meteorological station: therefore, UHI differences are assumed to represent different air pollution/heat input scenarios. Our bias-adjustment approach allows us, for the first time, to assess the impact of air pollution/heat input on the future UHI variability (Section 5).
This study uses no urban-surface parameterization and does not address spatially complex urban heat patterns. Its focus is exclusively on long-term temporal trends in the UHI as defined between meteorological stations with extensive data-series that are essential for calibrating RCM output (Section 2). We use one single pair of urban-rural grid points to define the UHI, as these are the only stations that fulfill our requirements for long uninterrupted data-series in relatively stable land-cover settings. Our UHI definition is in accordance with other studies looking at long-term temporal changes in the UHI ([22] and references herein). Further (future) urbanization in the greater Athens area will likely not affect the UHI in the city center at Thissio, as the surrounding area is already intensely urbanized. Any potential city expansion is projected to take place outside the basin where it does not affect the UHI as defined at Thissio [22,23,58].
This study selected a simple and transparent statistical method to summarize multi-model ensemble projections, with different reference periods and under different RCP scenarios, which clearly distinguish between (i) lack of climate change signal and (ii) lack of model agreement (Section 2). We employed indices describing extremely hot conditions; future projections of such indices may not be reliable when models’ output is used without prior bias-adjustment [67]. We specifically assess the robustness of the change of the indices: this can help to quantify the potential benefit of limiting pollution-linked UHI intensities to levels corresponding to period 1976–1995 or 1996–2015. To our knowledge, this is the first study quantifying explicitly different UHI intensities under future projections.
Statistical modeling approaches can complement dynamical models for the assessment of future UHI intensities (e.g., [46,47]) and could provide tools for policymakers because they are less computationally intensive and thus faster than dynamical modeling. Statistical approaches are subject to various limitations associated with the basic assumption that the relationship between air pollution/heat generation and UHI intensities will be unchanged in the future. These models provide useful baseline estimates, but do not take future changes in urban form or function into account. Results presented in this study are also dependent on the ability of each RCM to provide realistic projections for the changes in temperature under future climate change. Nevertheless, different uncertainties also exist in dynamical models related to differences in physical parameterization and to input data. Combining results from both statistical and dynamical models, with different weaknesses and strengths, will progress our understanding of climate change impacts on UHI variability.

2. Methodology

This study uses daily maximum and minimum air temperature records from one urban (Thissio, Athens, hereafter NOA) and one rural (Tanagra, hereafter TAN) meteorological station with the data covering the period 1976–2015 (see Figure 1 for location) for model adjustment. Daytime UHI intensity (UHImax) was defined as the difference in Tmax between the urban and rural station, namely ΔTmax = Tmax (NOA) − Tmax (TAN). Likewise, nocturnal UHI intensity (UHImin) was defined as the difference in Tmin between the two stations, namely ΔTmin = Tmin (NOA) − Tmin (TAN).
To determine future variability in the UHI of Athens we simulated daily maximum and minimum temperatures for the closest grid point to the station locations from a five member regional climate model (RCM) sub-ensemble from EURO-CORDEX [68] with a horizontal resolution of 0.11° (~12 × 12 km; Table 1). The simulated data cover the period 1976–2100. Three future emissions scenarios, namely RCP2.6, RCP4.5, and RCP8.5, were implanted in the simulations after 2005 covering the period 2006–2100.
These scenarios specify greenhouse gas (GHG) concentrations and corresponding emission pathways for different radiative forcing targets [69]. RCP2.6, RCP4.5, and RCP8.5 represent respectively scenarios where most, various, and no climate policies, aimed at the reduction of GHG emissions, are implemented [70,71]. However, policy recommendations should not necessarily be based on the worst-case scenario for climate warming (i.e., RCP8.5), as more-realistic baselines (i.e., RCP4.5) make for better policy guidelines [72].
Analysis of the observational temperature records covering the period 1976–2015 reveals two distinct UHI regimes, one for the period 1976–1995 (UHI_1) and one for the period 1996–2015 (UHI_2; see Section 3). The period covering 1976–1995 is characterized by a lower UHI intensity (especially lower ΔTmax and frequencies of extremely hot days/nights) compared to the subsequent period spanning 1996–2015.
Consequently, the daily maximum and minimum air temperature data for the two UHI periods are applied to the future periods examined in this study, 2046–2065 and 2076–2095, under the three RCPs, by applying the empirical quantile mapping (eqm) bias-adjusting method to model simulations [73,74]. More specifically, eqm works by calibrating the simulated cumulative distribution function by adding to the observed quantiles both the mean delta change and the individual delta changes in the corresponding quantiles (for more details on the eqm method and its implementation see [73,74]).
There are two simulated future temperature records for NOA and TAN under each of the three RCP scenarios tested in this study, reflecting UHI regime UHI_1 and UHI_2, respectively. The results presented in the following sections focus on the summer season, given: (1) the strong causal relationships between UHI intensity and summer temperatures, (2) the stable weather conditions over this season, and (3) the direct impact of high summer temperatures on health and energy use. Specifically, we analyze Tmax and Tmin recorded at NOA and TAN, ΔTmax and ΔTmin between these sites (the daytime and nighttime UHI intensity), and two temperature indicators representing extremely hot conditions (no. of days with Tmax > 37 °C and no. of days with Tmin > 26 °C). The threshold for an ‘extremely hot day’ (Tmax > 37 °C) represents approximately the 95th percentile of summer Tmax at NOA over a reference period spanning 1971–2000, whereas an ‘extremely hot night’ (Tmin > 26 °C) represents the 95th percentile of the summer Tmin distribution [22,43].
The sub-ensemble used in this study is a part of EURO-CORDEX [68]; uncertainties associated with selected individual models are discussed by Ito and co-workers [75]. We assess the significance of a change in an index, based on the RCM’s ensemble, with the methodology proposed by Tebaldo and colleagues [76] and used by, for example, Dosio and Fischer [76]. This simple and transparent method summarizes multi-model projections and clearly separates lack of climate change signal from lack of model agreement by assessing the degree of consensus on the significance of the change as well as the sign of the change. The main idea is that if multiple models agree on a result, there is a higher confidence than if the result is based on a single model, or if models disagree on the result. This methodology does not address issues of dependency among models, model evaluation or weighting, or more sophisticated approaches to characterizing significant change at the grid point.
Whenever changes between the future period and the two UHI reference periods are discussed, the robustness of these changes is examined as follows: the change between the future and the reference period is considered robust when the changes in at least three out of five models are found statistically significant and the change in these models is of the same sign. The first criterion is examined by using the 95th percentile confidence intervals as derived by bootstrap [77,78]. If only one of the criteria is met, the change is not considered statistically significant.
We also quantified the uncertainty of the robust changes by bootstrapping the 20-year differences of each parameter between the two periods [77] as well as the uncertainty of the actual future values. In our study, each sample consists of 20 values which are resampled 1000 times with replacement. For each resample, the method calculates the mean; the 95th percentile confidence intervals are subsequently computed from the resulting series. Thus, in the analysis performed, each mean parameter change (or actual value) is presented with a value (±α) which represents the confidence range. This measure evaluates confidence in our results.

3. Long-Term Athens UHI: Observational Data

To assess the impact of different UHI regimes on future climate change projections, two 20-year reference periods (1976–1995 and 1996–2015) with different UHI regimes were selected for the bias correction of the model results (Section 2). Below, selected temperature variables of the two historical reference periods are compared.
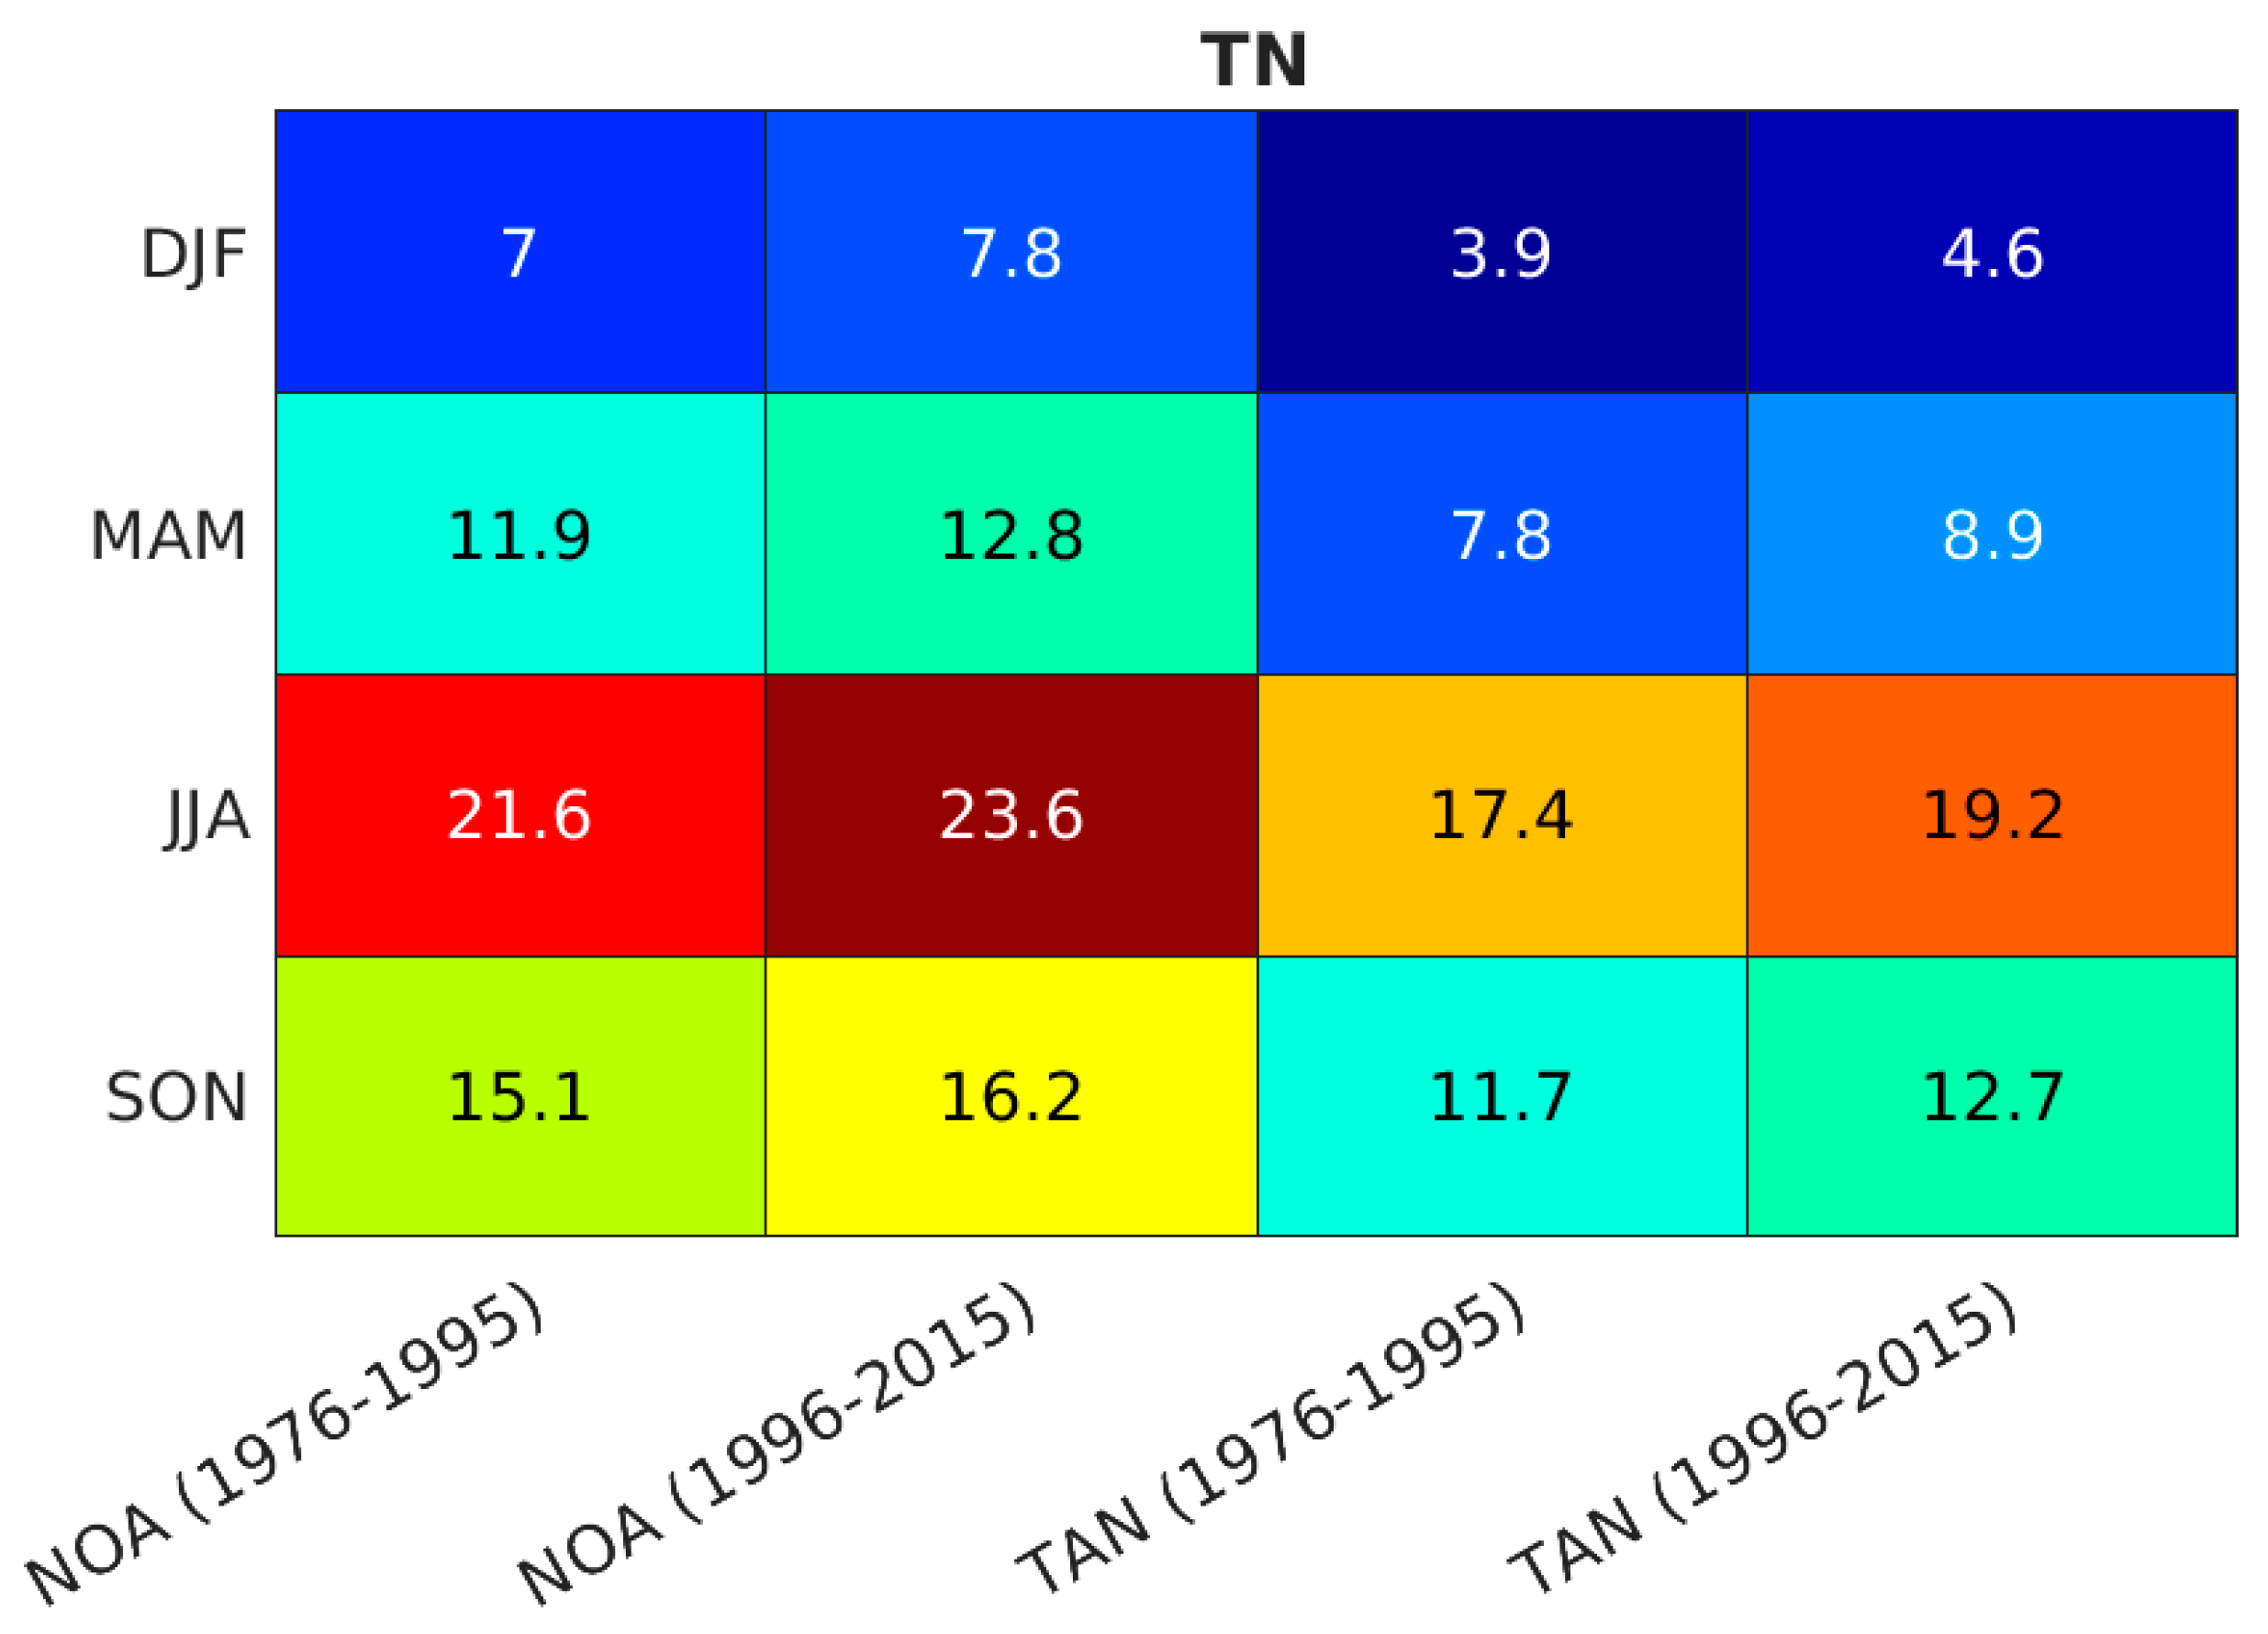
Maximum temperatures (Tmax) increase across all seasons, for both meteorological stations, over 1996–2015 when compared to the preceding period 1976–1995 (Figure 2). However, this increase is only statistically significant for the summer months (JJA) at NOA and TAN. Minimum temperatures (Tmin) also show increases across all seasons, for both meteorological stations, when comparing the two 20-year periods (Figure 3). This increase is statistically significant for all months—except for winter (DJF)—at both meteorological stations.
The Athens UHI intensity increased mainly for maximum temperatures (across all seasons) when comparing the two reference periods (Table 2). The increase in ΔTmax is caused by the large rise in urban maximum temperatures (NOA), which is about double the increase registered at the rural site of TAN (Figure 2). Changes in UHI intensity for Tmin are minor across all seasons when comparing the two reference periods. In absolute terms, ΔTmin is much larger than ΔTmax across all seasons of both reference periods, showing that the nighttime UHI is more intense. The increasingly higher rates in the daily summer UHI intensity in Athens since 1971 are mainly associated with increasing anthropogenic heat emission from transportation and air cooling systems [22].
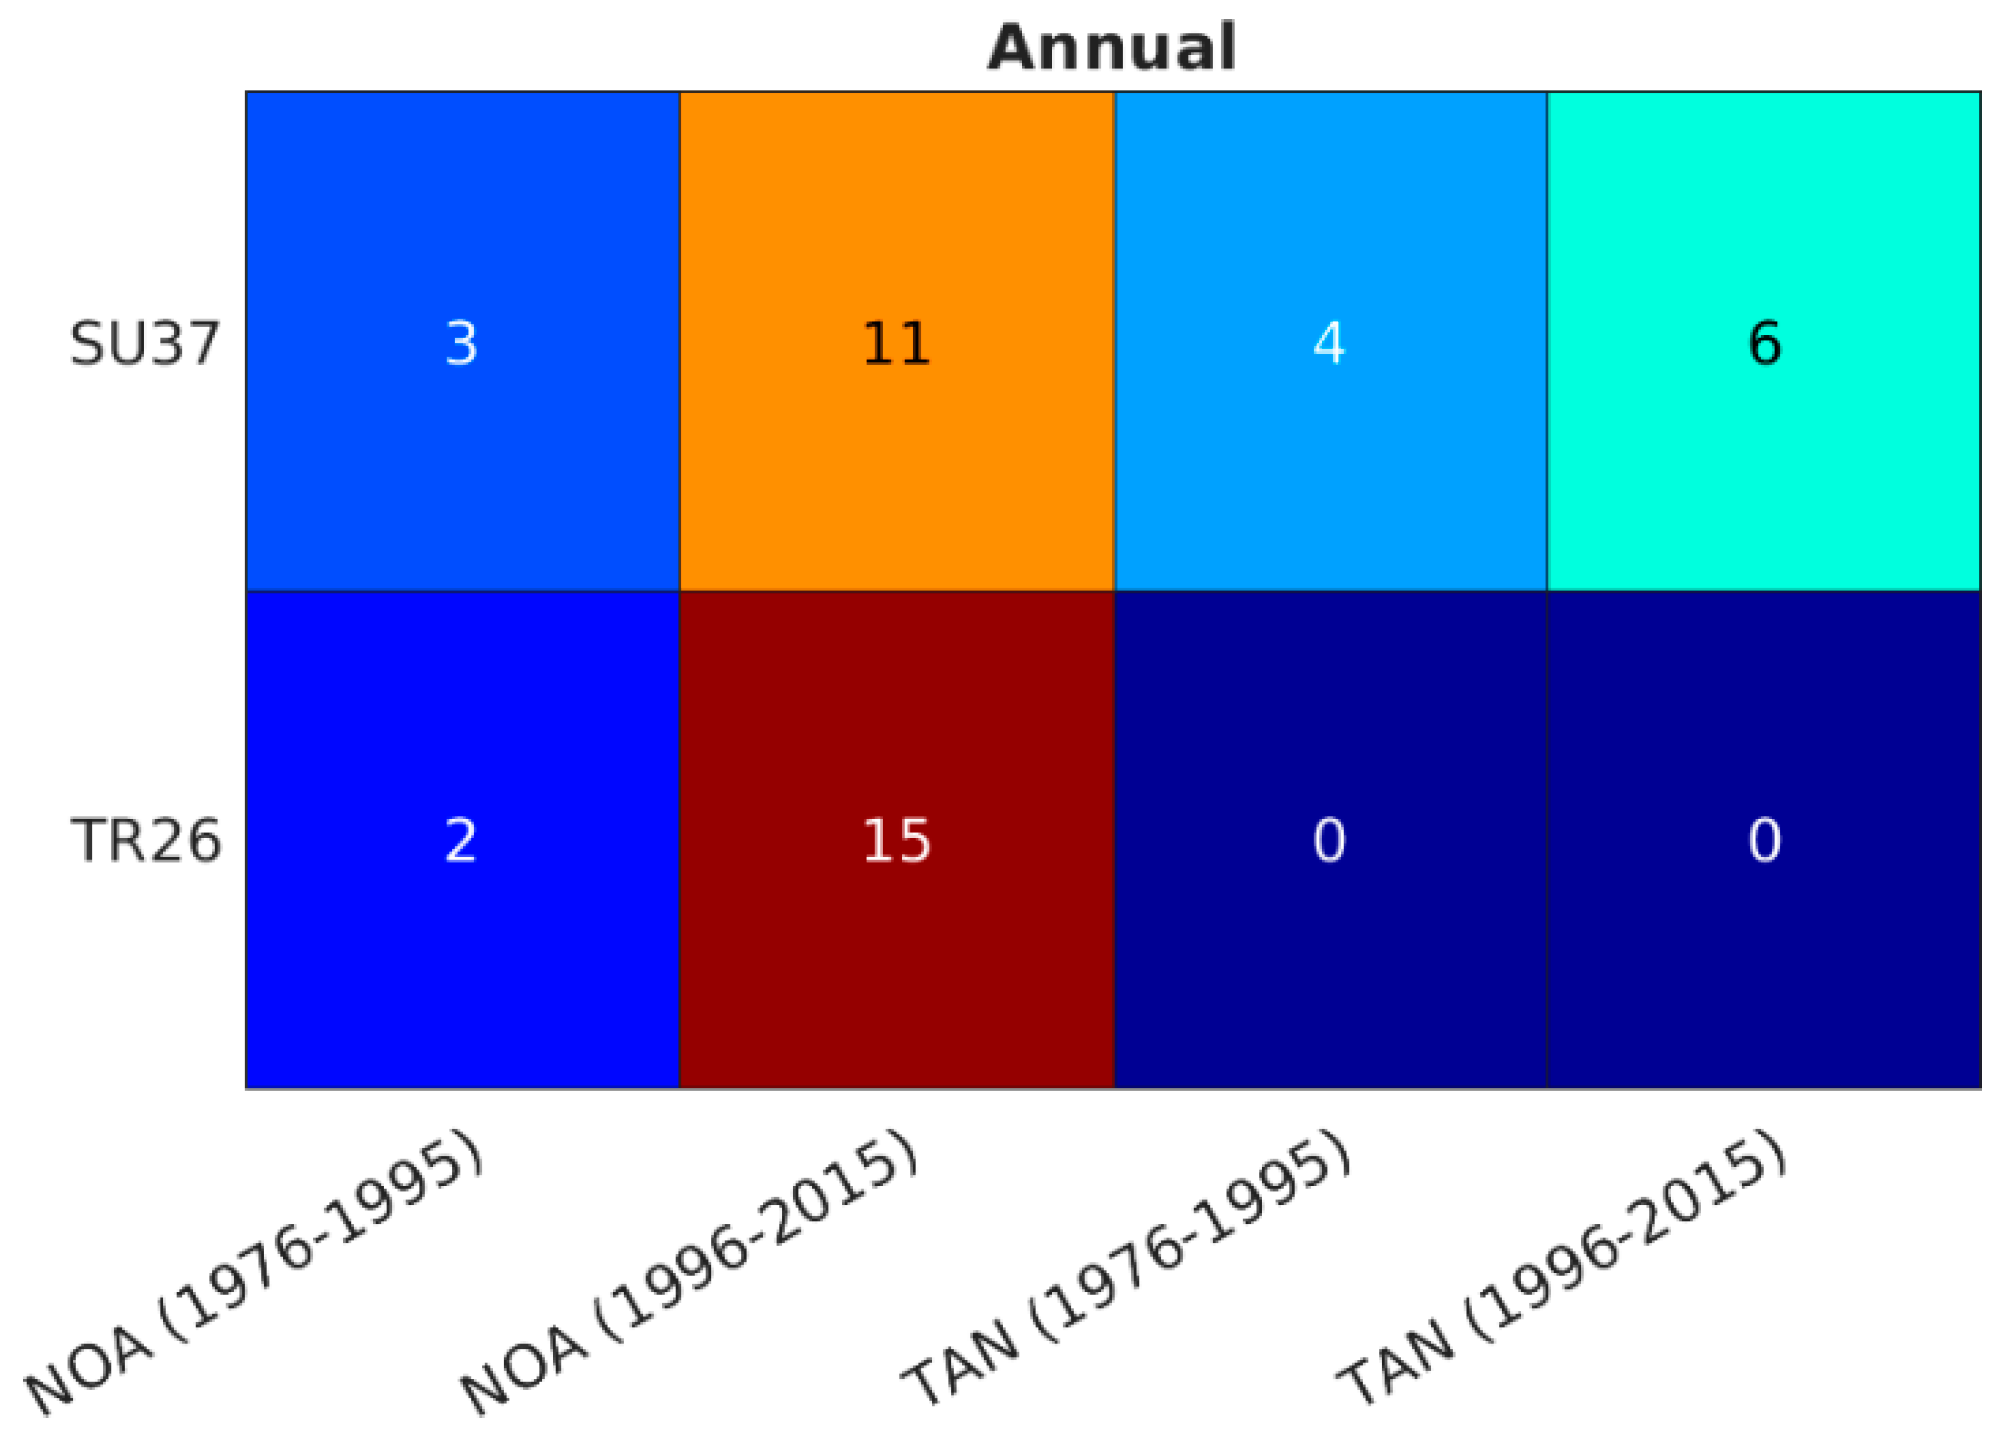
The two temperature indicators representing extremely hot conditions (number of days with Tmax > 37 °C and Tmin > 26 °C) show contrasting trends at the sites of NOA (urban) and TAN (rural) between the two reference periods (Figure 4). At NOA, in the center of Athens, there is a large increase in the annual frequency of both extremely hot days and nights. While there is a minor increase in the annual number of extremely hot days at TAN, the averaged frequency of extremely hot nights at this rural site remains zero over both time periods. Extremely hot nights have been linked to the effect of the urban pollution island (UPI) on the UHI [9], which might explain their high frequency in Athens center given the higher levels of air pollution over the second reference period [61,63].
To conclude, the difference in the UHI regime of Athens between the two 20-year reference periods (1976–1995 and 1996–2015) mainly affects the daytime UHI intensity (ΔTmax) and the frequency of extremely hot daytime/nighttime conditions (Figure 4). Increasing urban temperature amplification rates spanning 1976–2015 are likely caused by increasing anthropogenic heat emission and air pollution, mainly from transportation and air cooling systems.
Statistically significant temperature increases between the two reference periods do not affect the simulation results if the difference between the absolute temperature values of the observations and their simulated countervalues remain similar. However, if the urban temperature amplification rates change between reference periods, due to changes in the local UHI regime, then future model projections are different depending on the reference period used.

4. Temperature Projections: Results

Future temperature simulations were created under three RCP scenarios (2.6, 4.5, and 8.5) and bias corrected against reference periods 1976–1995 (UHI_1) and 1996–2015 (UHI_2). Accordingly, two distinct temperature series were simulated for each RCP scenario. Projected minimum and maximum temperature changes are discussed in Section 4.1. We focus on future UHI changes during the summer season in Section 4.2 and Section 4.3, as negative consequences associated with the UHI are more severe while meteorological conditions during this season are stable (see Section 1).

4.1. Future Changes in Maximum and Minimum Temperature

Bias-corrected simulated temperature data for the sites of NOA (urban) and TAN (rural), spanning the near and distant future periods (respectively, 2046–2065 and 2076–2095), are compared to the two reference periods (respectively, 1976–1995 and 1996–2015) to assess statistically significant changes. Projected changes in future maximum and minimum temperatures are also evaluated in this section.

4.1.1. Future Maximum Temperatures

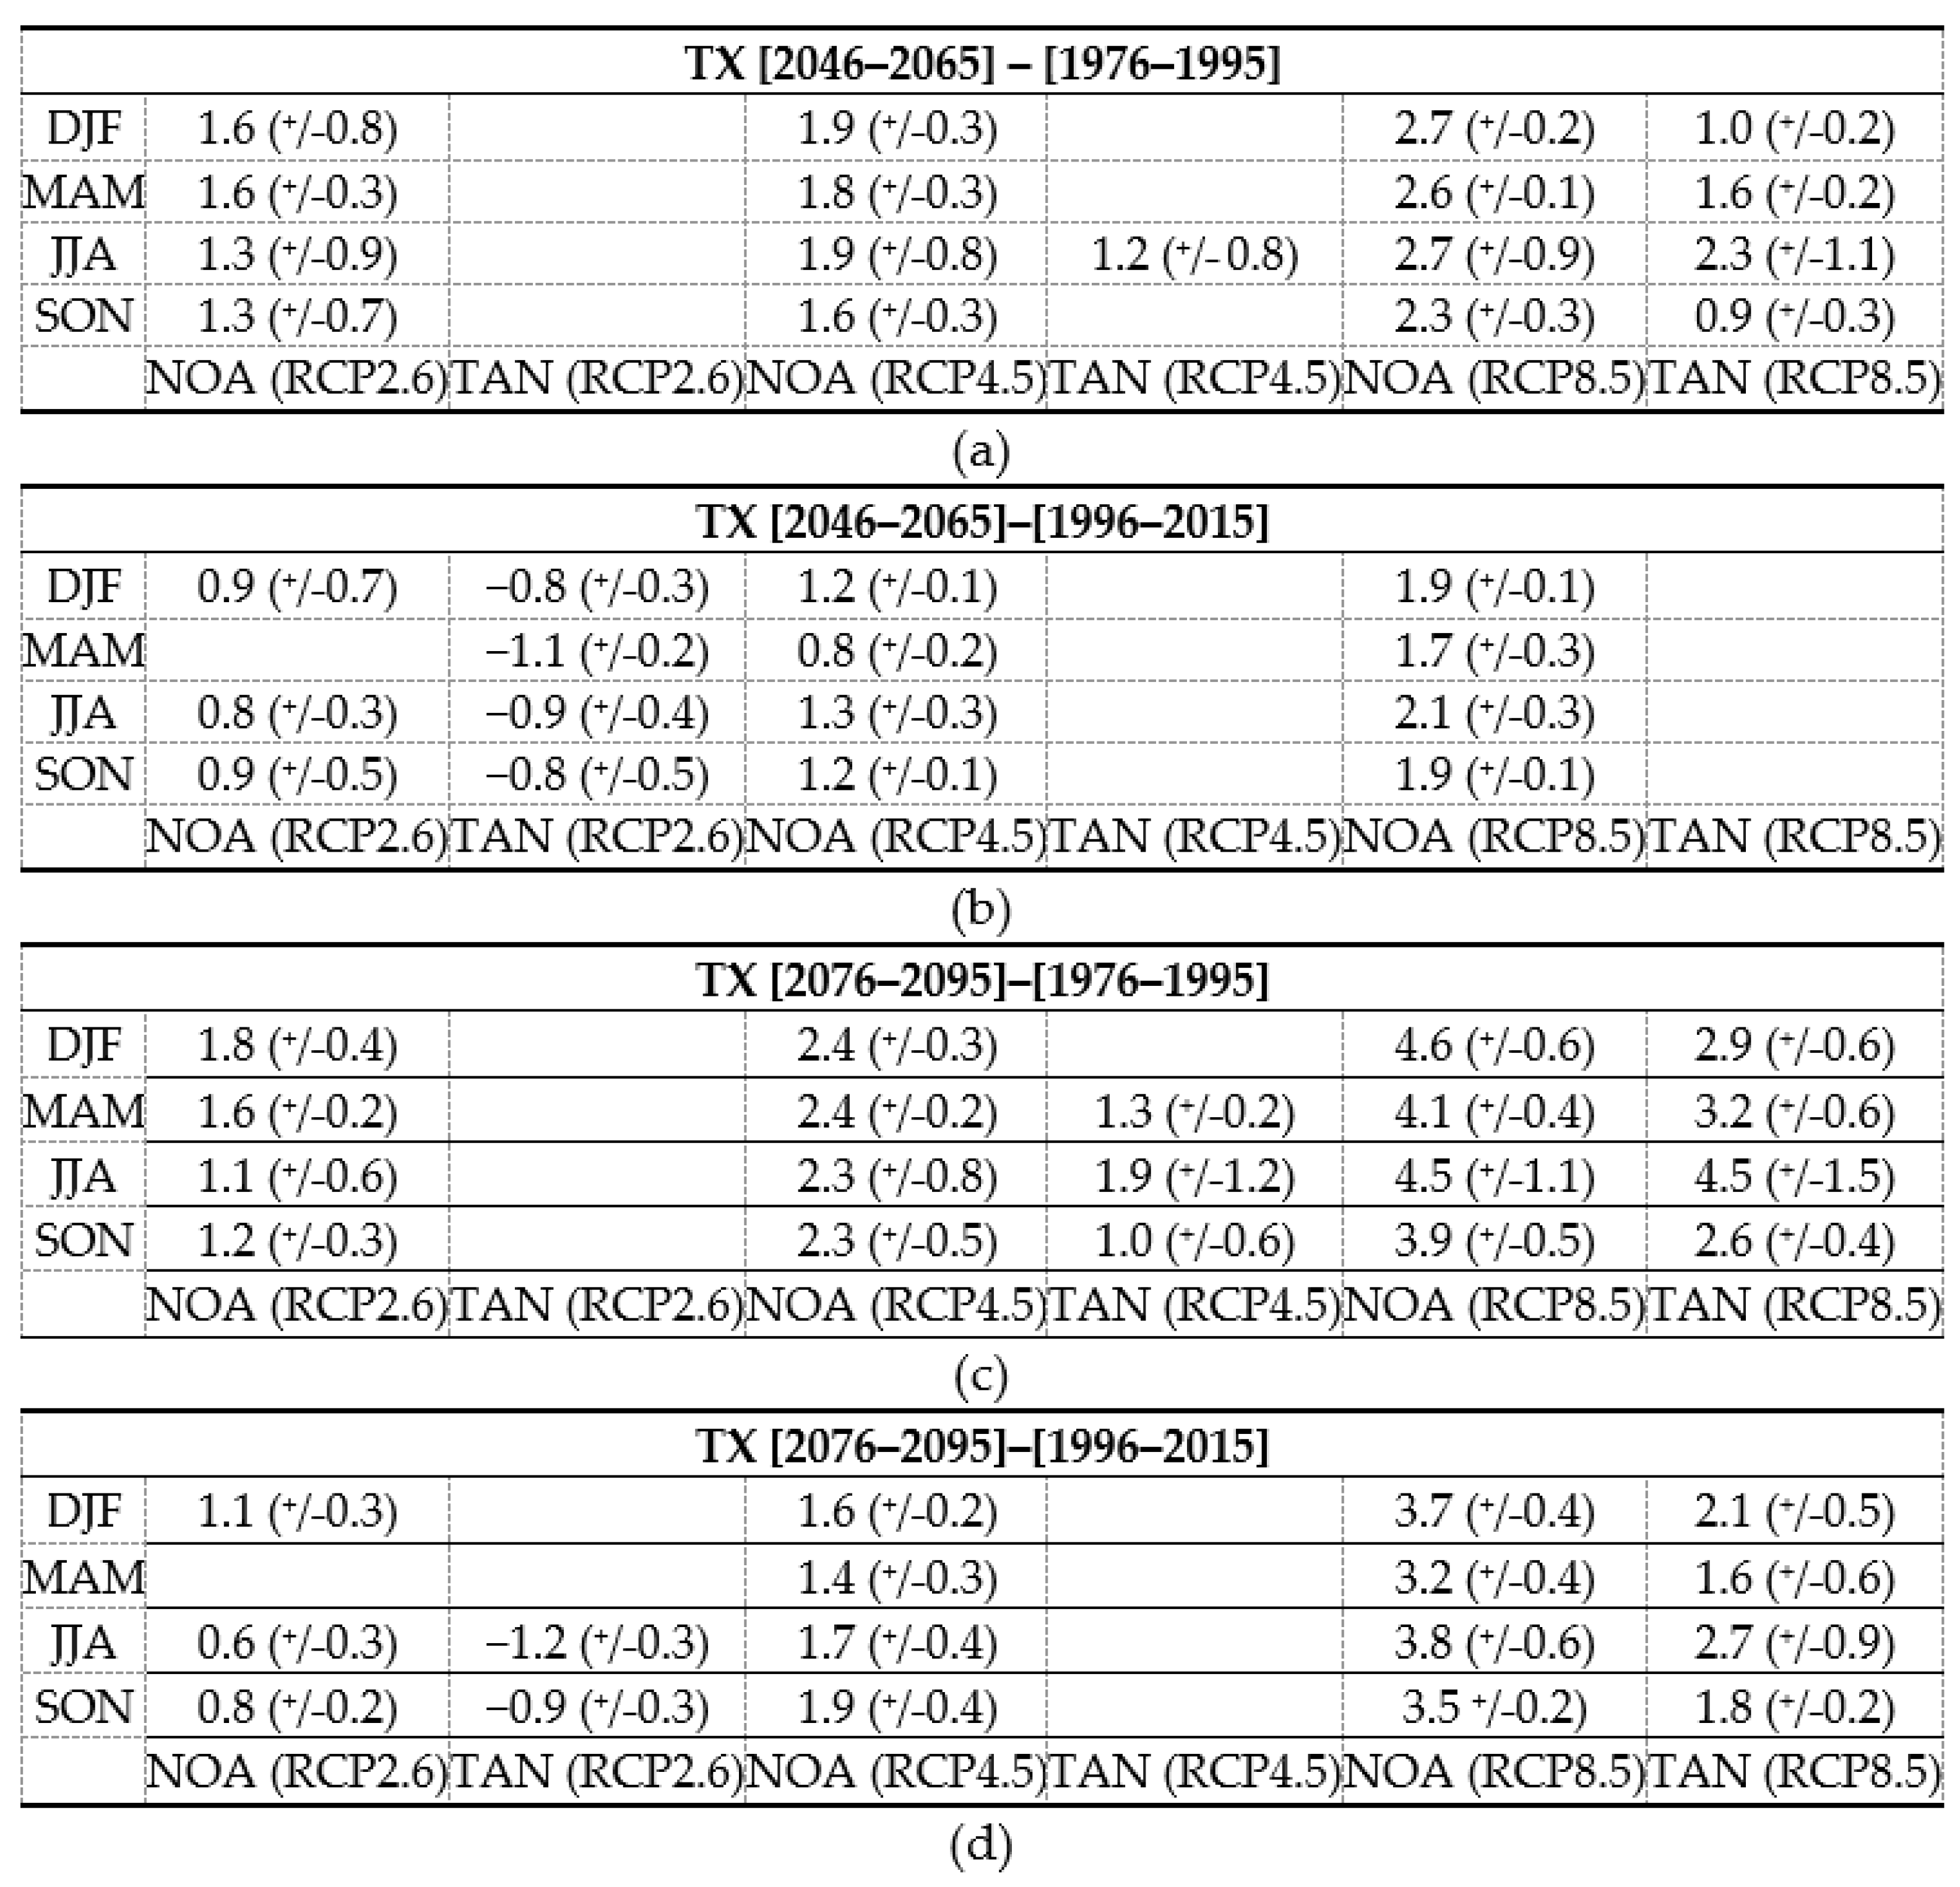
Maximum temperatures (Tmax) at NOA are projected to increase statistically significantly across almost all seasons over future periods 2046–2065 and 2076–2095 compared to both reference periods (Figure 5a–d). Stronger warming takes place when simulations are compared to period UHI_1 (1976–1995), which is expected as this reference period is characterized by lower Tmax values (Section 3). RCP2.6 shows no increase in average Tmax from the near to distant future; the other scenarios show increases in average seasonal Tmax up to the end of the century.
Comparing the near future (2046–2065) at TAN to period UHI_1 (1976–1995) shows statistically significant increases in Tmax occurring under RCP4.5 during summer (JJA) and across all seasons for RCP8.5. However, when compared to reference period UHI_2 (1996–2015), Tmax decreases statistically significantly under RCP2.6, whereas there is no statistically significant change under RCP4.5 and 8.5 (Figure 5a,b). In the distant future (2076–2095), statistically significant increases in Tmax occur under RCP4.5 (spring (MAM), JJA, autumn (SON)) and RCP8.5 (all seasons) when compared to period UHI_1. Comparing the distant future to reference period UHI_2 shows statistically significant Tmax decreases for summer and autumn under RCP2.6, and statistically significant increases in Tmax under RCP8.5 for all seasons (Figure 5c,d).
This range of projections indicates that future maximum temperatures are strongly amplified at the urban site of NOA, as statistically significant increases are projected under all scenarios and against all reference periods. At the rural site of TAN, future Tmax under RCP2.6 is similar to average seasonal maximum temperatures over period UHI_1 (1976–1995). Future Tmax under RCP4.5 is similar to average maximum temperatures over reference period UHI_2 (1996–2015). Only future Tmax under RCP8.5 exceeds any average maximum temperatures previously experienced.

4.1.2. Future Minimum Temperatures

Minimum temperatures (Tmin) at NOA are projected to increase statistically significantly across all seasons over future periods 2046–2065 and 2076–2095 compared to both reference periods (Figure 6a–d). Stronger warming takes place when simulation results are compared to reference period UHI_1 (1976–1995), which is characterized by lower Tmin values (Section 3). Average seasonal Tmin is approximately stable under RCP2.6 over the near and distant future, while it increases up to the end of the century under the other scenarios.
At TAN, all scenarios show decreases in Tmin (mostly statistically significant) across all seasons in the near future (2046–2065) compared to both reference periods (Figure 6a,b). In the distant future (2076–2095), Tmin decreases (statistically) significantly under RCP2.6 and 4.5, whereas there are minor increases in values under RCP8.5 that are sometimes statistically significant, against both reference periods (Figure 6c,d).
This range of projections indicates that future minimum temperatures are strongly amplified in the urban NOA site, as statistically significant increases are projected under all scenarios and against all reference periods. Future Tmin at the rural TAN site is, however, set to fall under all scenarios and compared to all reference periods in the near future. In the distant future, minimum temperatures are projected to decrease compared to both reference periods for scenarios RCP2.6 and 4.5, only to show minor increases under RCP8.5. These widely divergent projections of minimum temperature in nearby urban and rural sites illustrate the strong nocturnal UHI effect during summer in Athens.

4.2. Projections of the Athens UHI Intensity over Summer

At the rural TAN site, the use of different bias correction periods (UHI_1 or UHI_2) hardly makes a difference in the outcomes of projected future averaged summer maximum and minimum temperatures. For future projections under each RCP scenario, there is an overlap of simulated Tmax and Tmin curves corrected with, respectively, UHI_1 and UHI_2 (Figure 7 and Figure 8). This indicates that the relation between modeled and observed temperature is stable for the two reference periods.
However, at the urban NOA site (Athens), there are significant differences in the projected future temperature outcomes depending on the period used for bias correction. Simulated Tmax and Tmin curves corrected with, respectively, UHI_1 and UHI_2, do not overlap (Figure 7 and Figure 8). This indicates that the relation between modeled and observed temperature is not stable for the contrasting reference periods. This is related to the observed increase in UHI intensity over period UHI_2 (Section 3) which is associated with a greater urban amplification rate of regional temperatures.

4.2.1. Summer ΔTmax

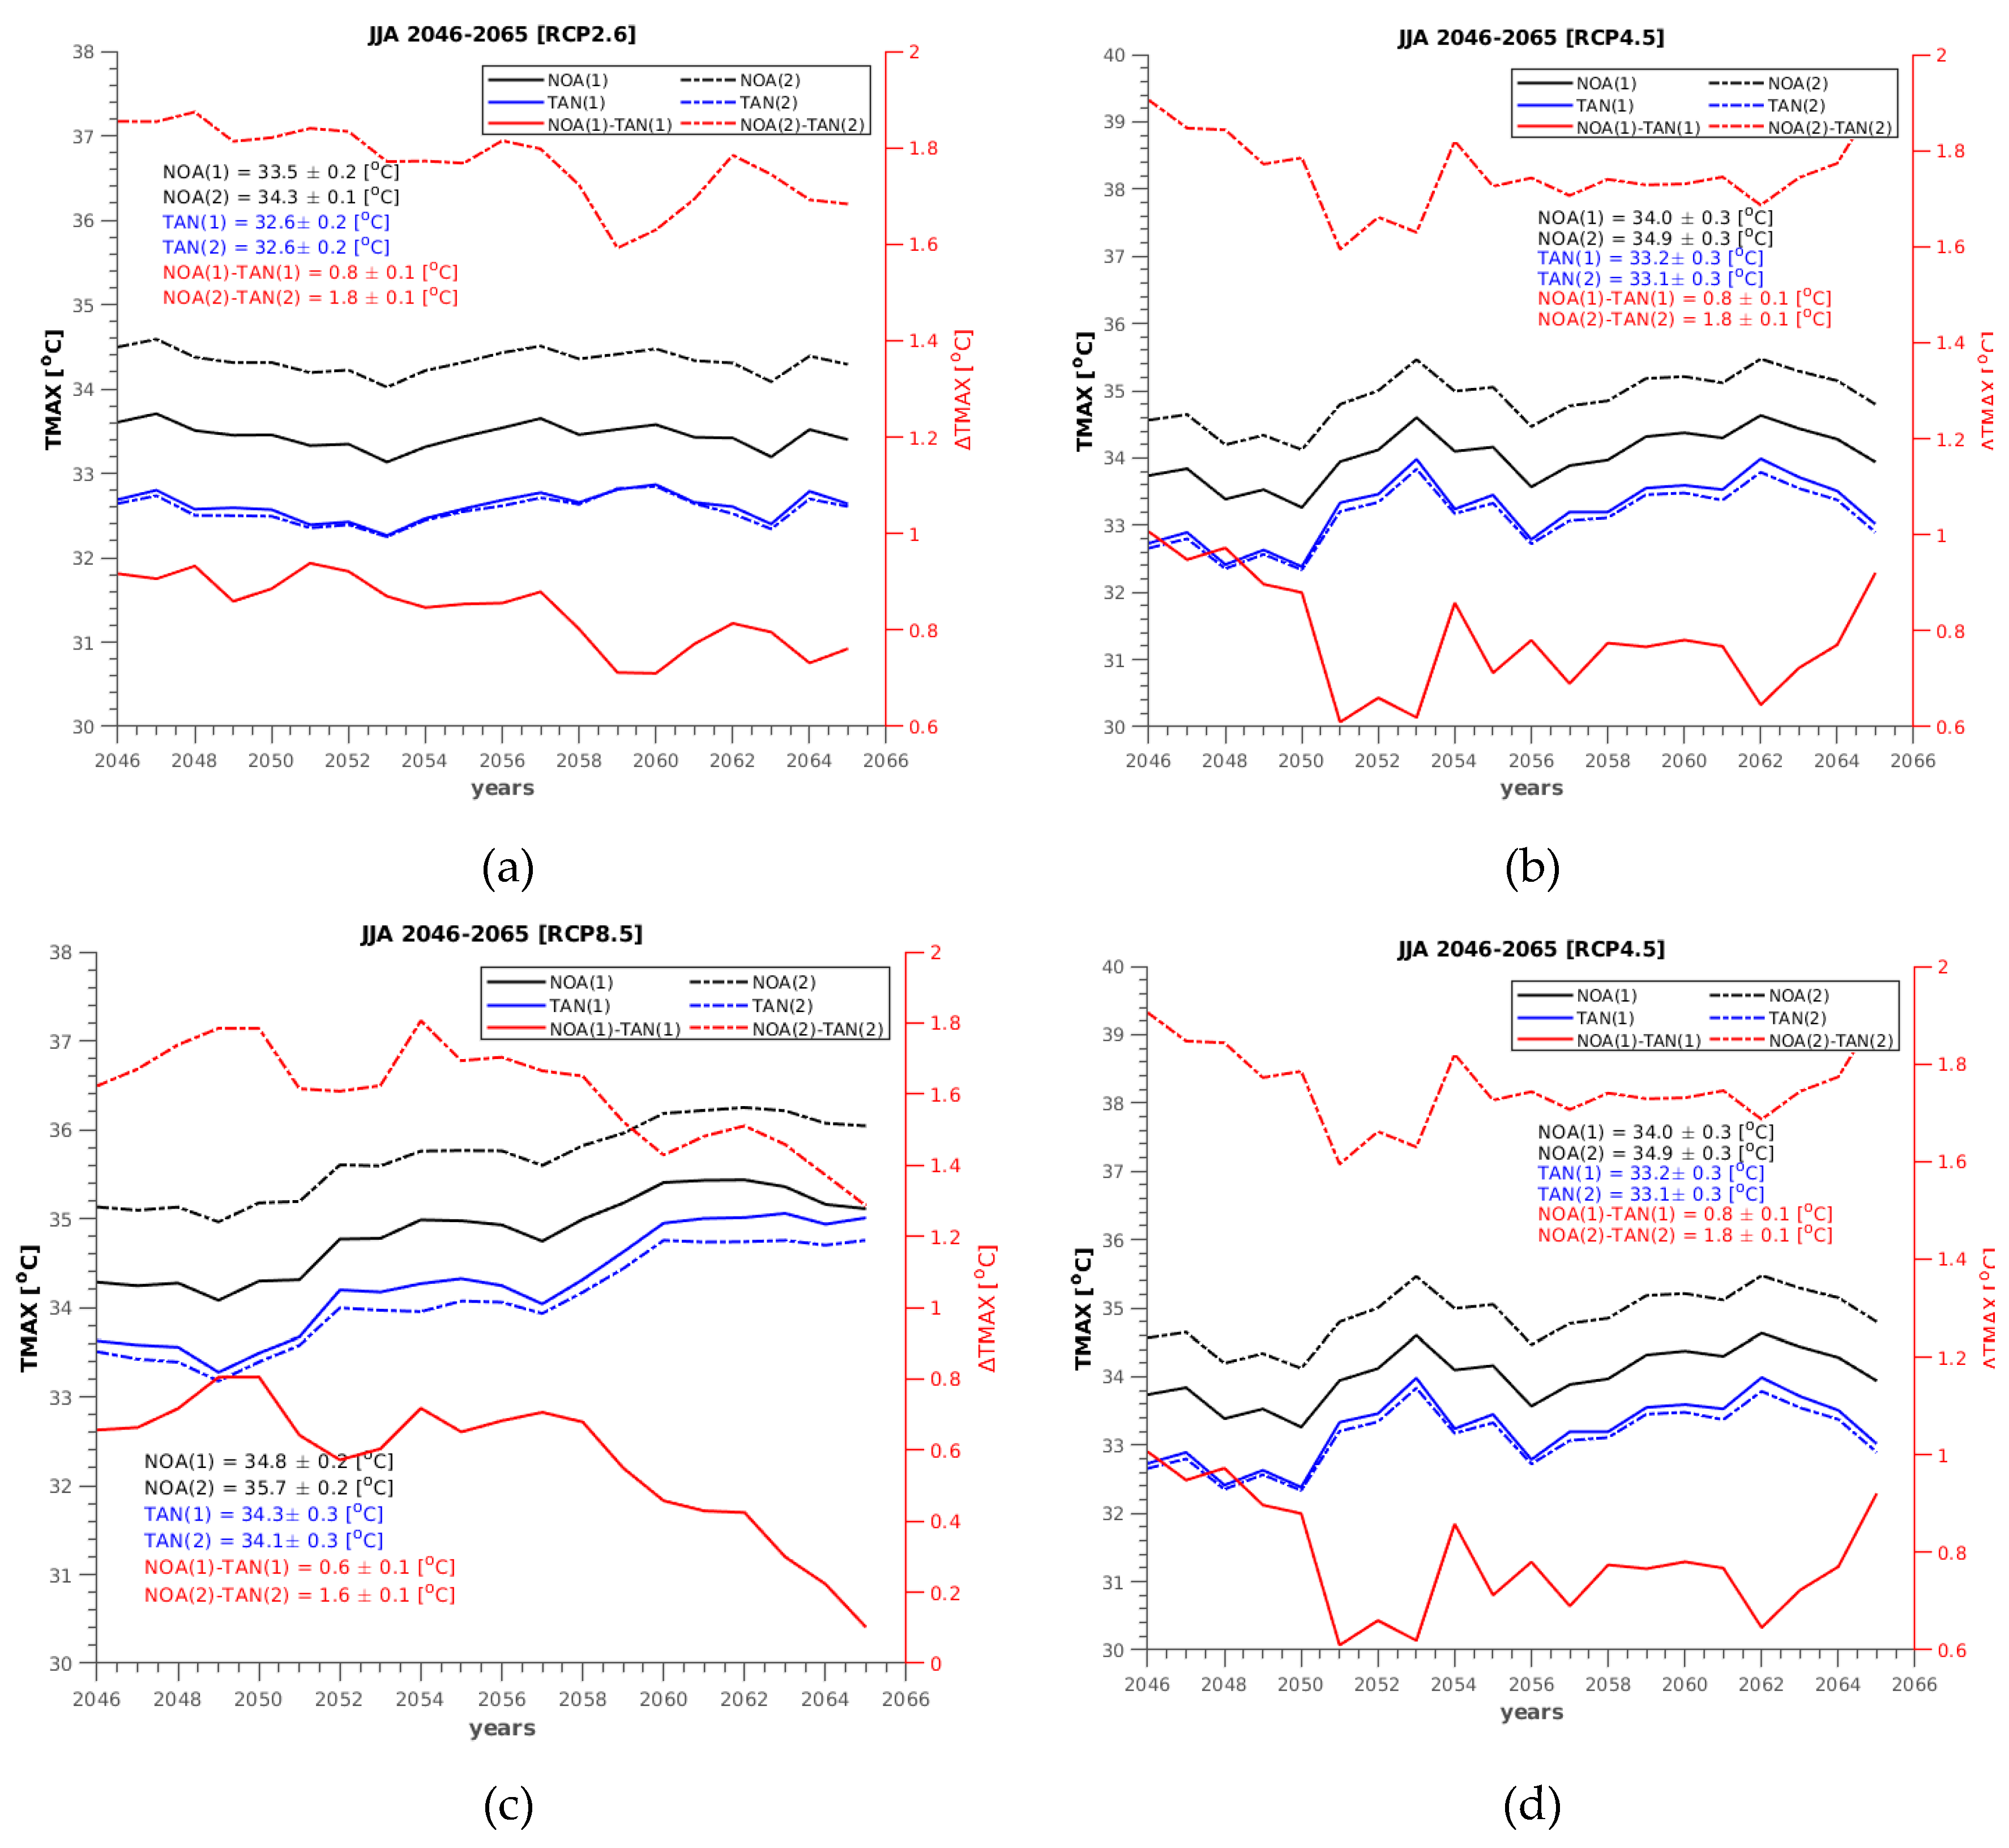
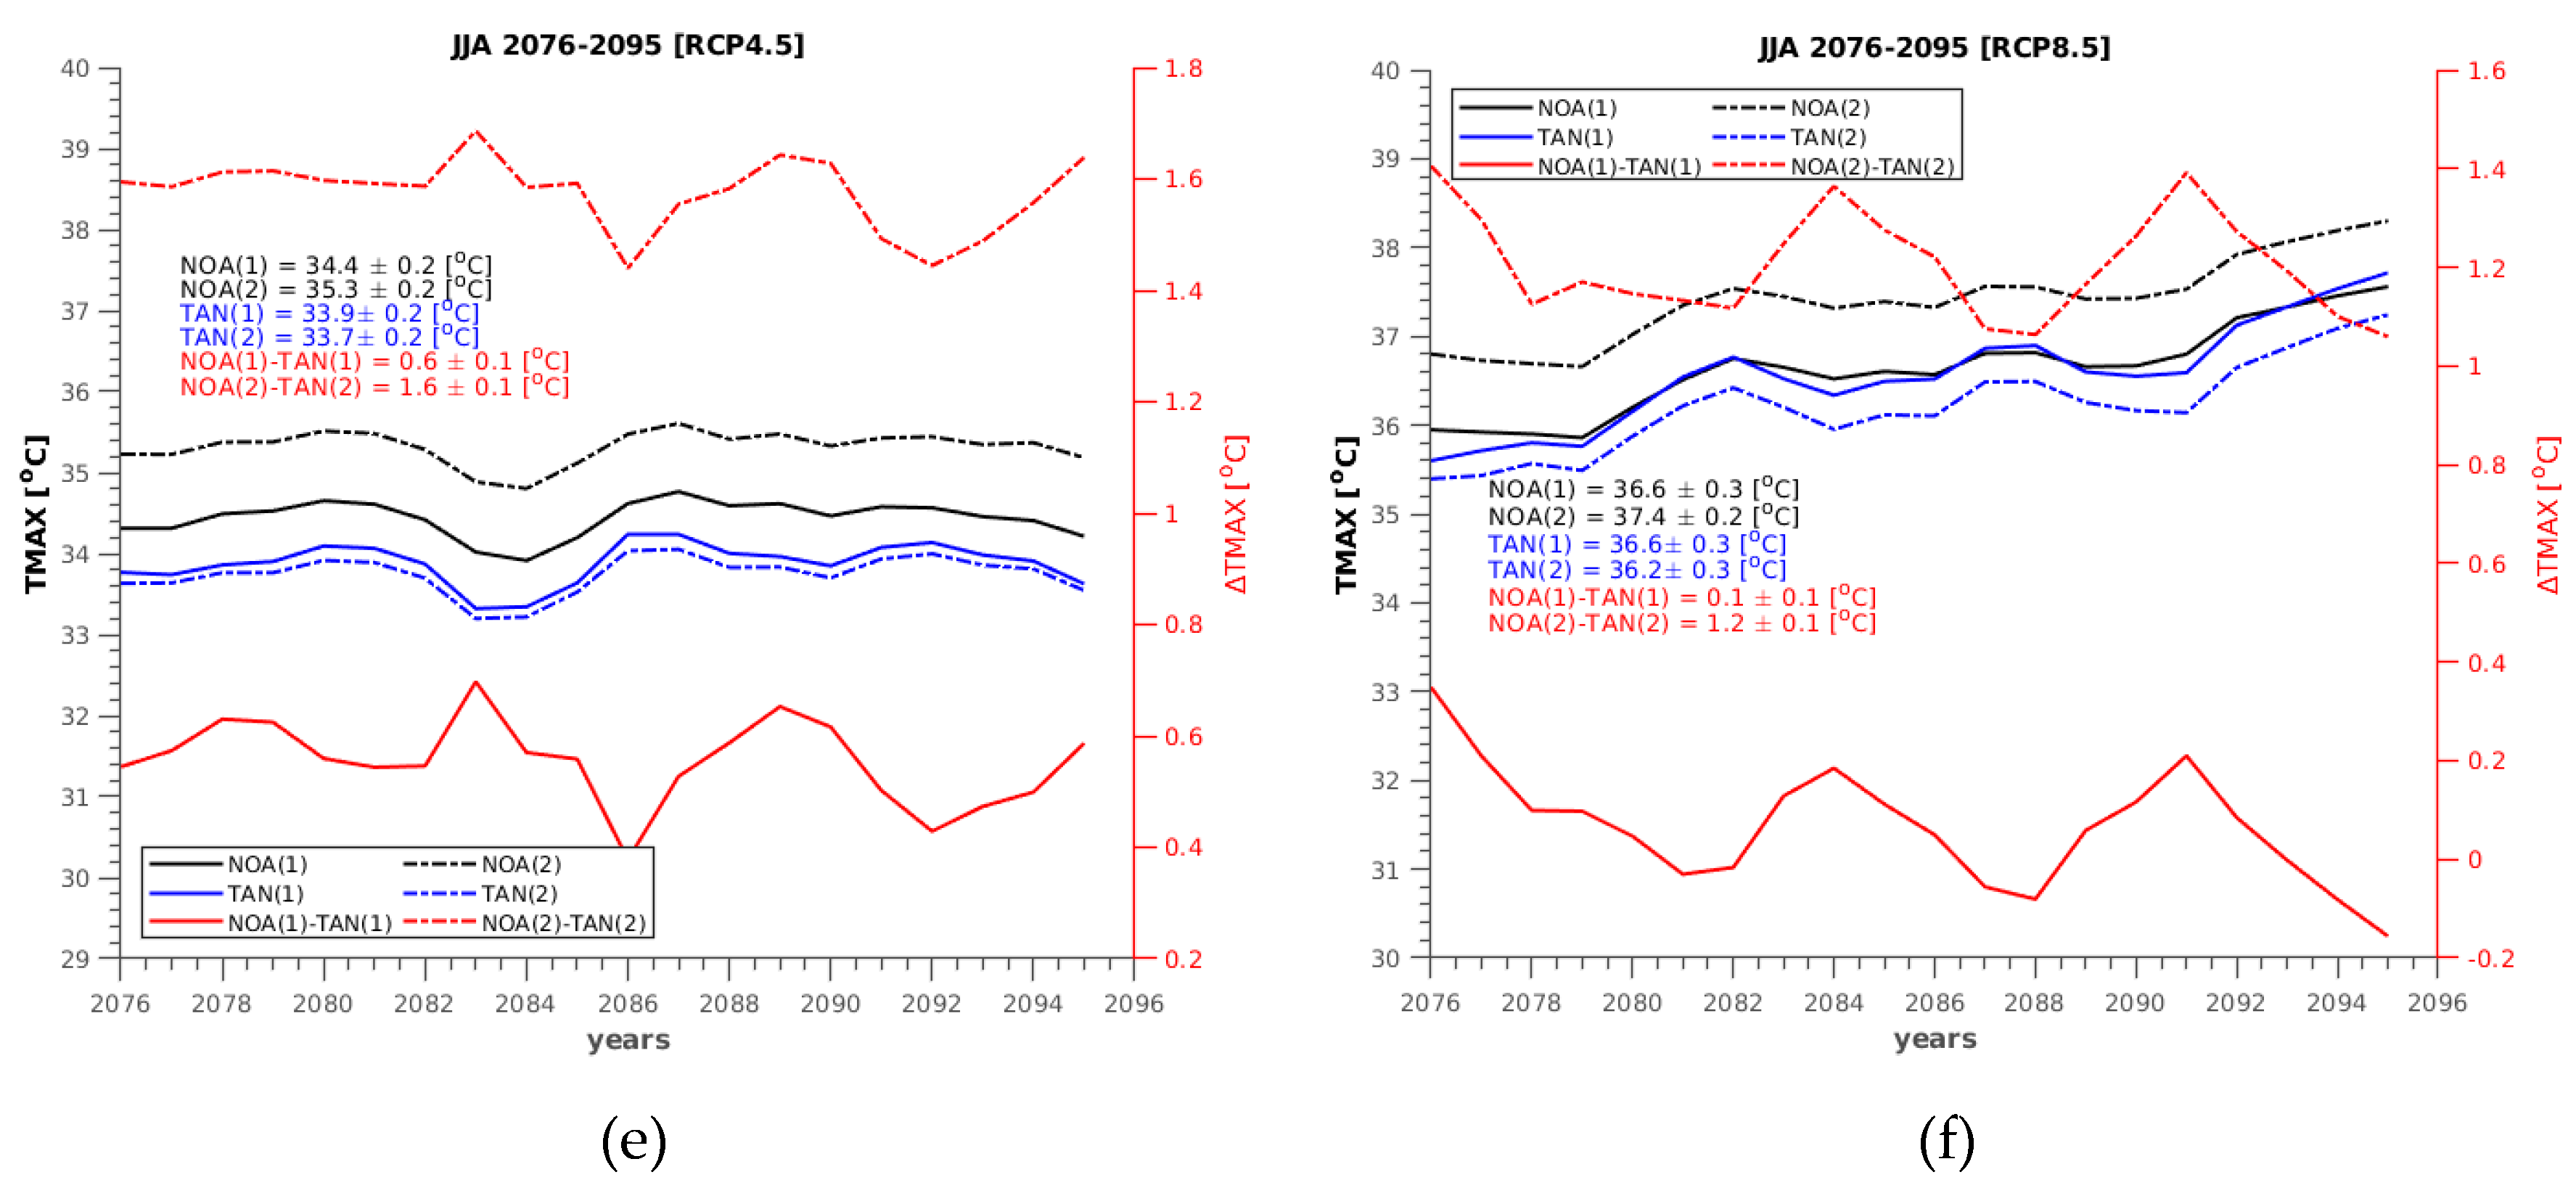
Summer maximum temperatures over the observational period 1996–2015 were at ~31.8 °C in TAN and ~33.7 °C in NOA (Figure 2). Averaged future summer maximum temperatures are given in Figure 7.
Under RCP2.6, maximum temperatures remain approximately stable in the near future (2046–2065), at ~32.6 °C in TAN, while temperature in NOA is +0.8 °C (ΔTmax UHI_1) to +1.8 °C (ΔTmax UHI_2) higher (Figure 7a). In the distant future (2076–2095) maximum temperatures decrease. Average summer maximum temperatures show large variability with a seasonal average of ~32.3 °C in TAN; NOA temperatures are +0.9 °C (ΔTmax UHI_1) to +1.8 °C (ΔTmax UHI_2) higher (Figure 7d).
Scenario RCP4.5 reveals fluctuating but approximately stable maximum temperatures in the near future (Figure 7b). In TAN, Tmax is at ~33.2 °C, while ΔTmax (NOA-TAN) is +0.8 °C (UHI_1) to +1.8 °C (UHI_2). In the distant future, average summer maximum temperatures increase by ~0.6 °C and reach ~33.8 °C in TAN. The ΔTmax (NOA-TAN) declines and is +0.6 °C (UHI_1) to +1.6 °C (UHI_2) (Figure 7e).
Maximum temperatures in the near future rapidly increase under scenario RCP8.5, from ~33.5 °C to ~34.6 °C (period average: ~34.2 °C) in TAN (Figure 7c). The ΔTmax (NOA-TAN) decreases over the same period, from +0.7 to +0.1 °C (UHI_1; average +0.6 °C), and +1.7 to +1.3 °C (UHI_2; average +1.6 °C). Maximum temperatures at the start of the near future period are similar to those of scenario RCP4.5, though subsequently rapidly increasing. Maximum temperatures continue to increase rapidly in the distant future, from ~35.5 °C to ~37.3 °C (period average: ~36.4 °C) in TAN (Figure 7f). The ΔTmax (NOA-TAN) decreases slightly over time from +0.2 to 0 °C (UHI_1; average +0.1 °C) and +1.3 to +1.1 °C (UHI_2; average +1.2 °C).
Simulations indicate that if average summer maximum temperatures rise above 33 °C at TAN, then the UHImax intensity starts to decrease. Once temperatures rise to 37 °C at TAN, then there is no longer an UHI effect under bias correction UHI_1. This decrease in UHI intensity with increasing regional background temperatures is also observed over the recent historical period (1971–2000) [22]. This effect is associated with the blanketing effect of regional heatwaves. Such heatwaves may override the UHI of Athens; however, higher UHI intensities require more extreme heatwaves to be overridden.

4.2.2. Summer ΔTmin

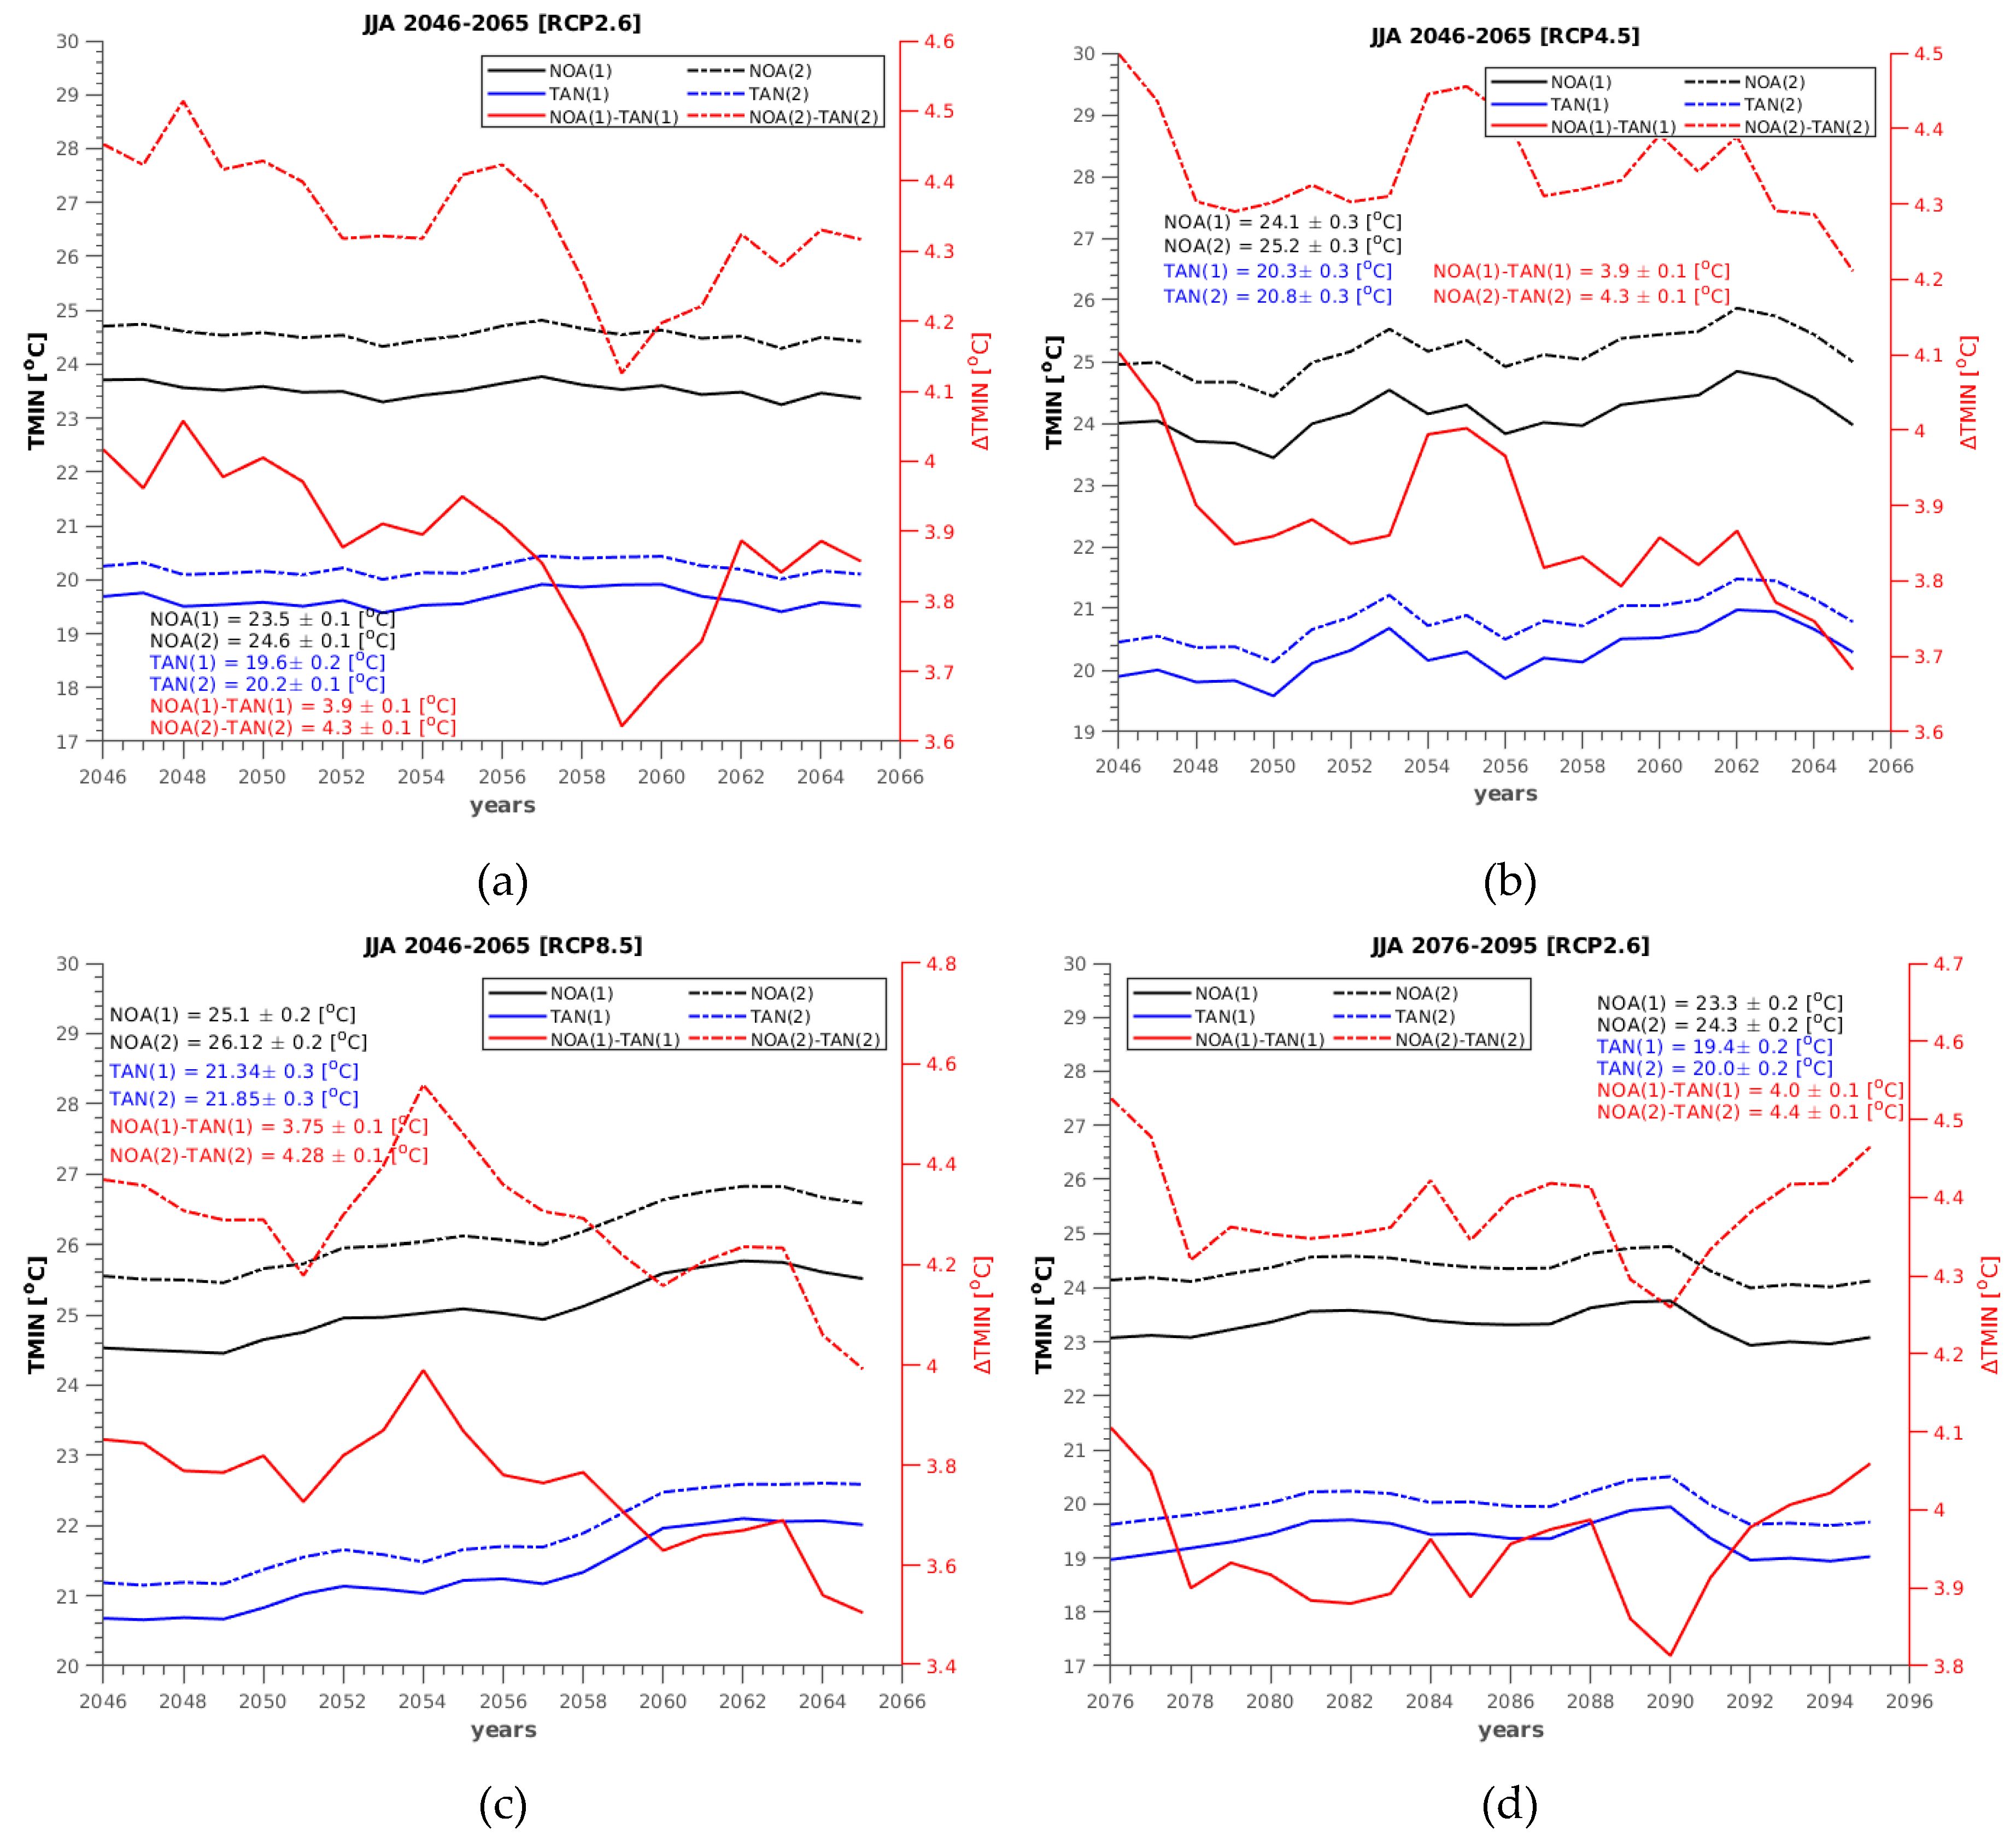
Average summer minimum temperatures for the observational period 1996–2015 stood at ~19.2 °C in TAN and ~23.6 °C in NOA. Averaged future summer minimum temperatures are given in Figure 8.
Minimum temperatures remain approximately stable in the near future (2046–2065) under RCP2.6 at ~19.7–20.2 °C in TAN, while they are +3.9 °C (UHI_1) to +4.3 °C (UHI_2) higher in NOA (Figure 8a). In the distant future (2076–2095) there is a minor temperature decrease. Minimum temperatures remain approximately stable at ~19.4–20.0 °C in TAN and remain +4.0 °C (UHI_1) to +4.4 °C (UHI_2) higher in NOA (Figure 8d).
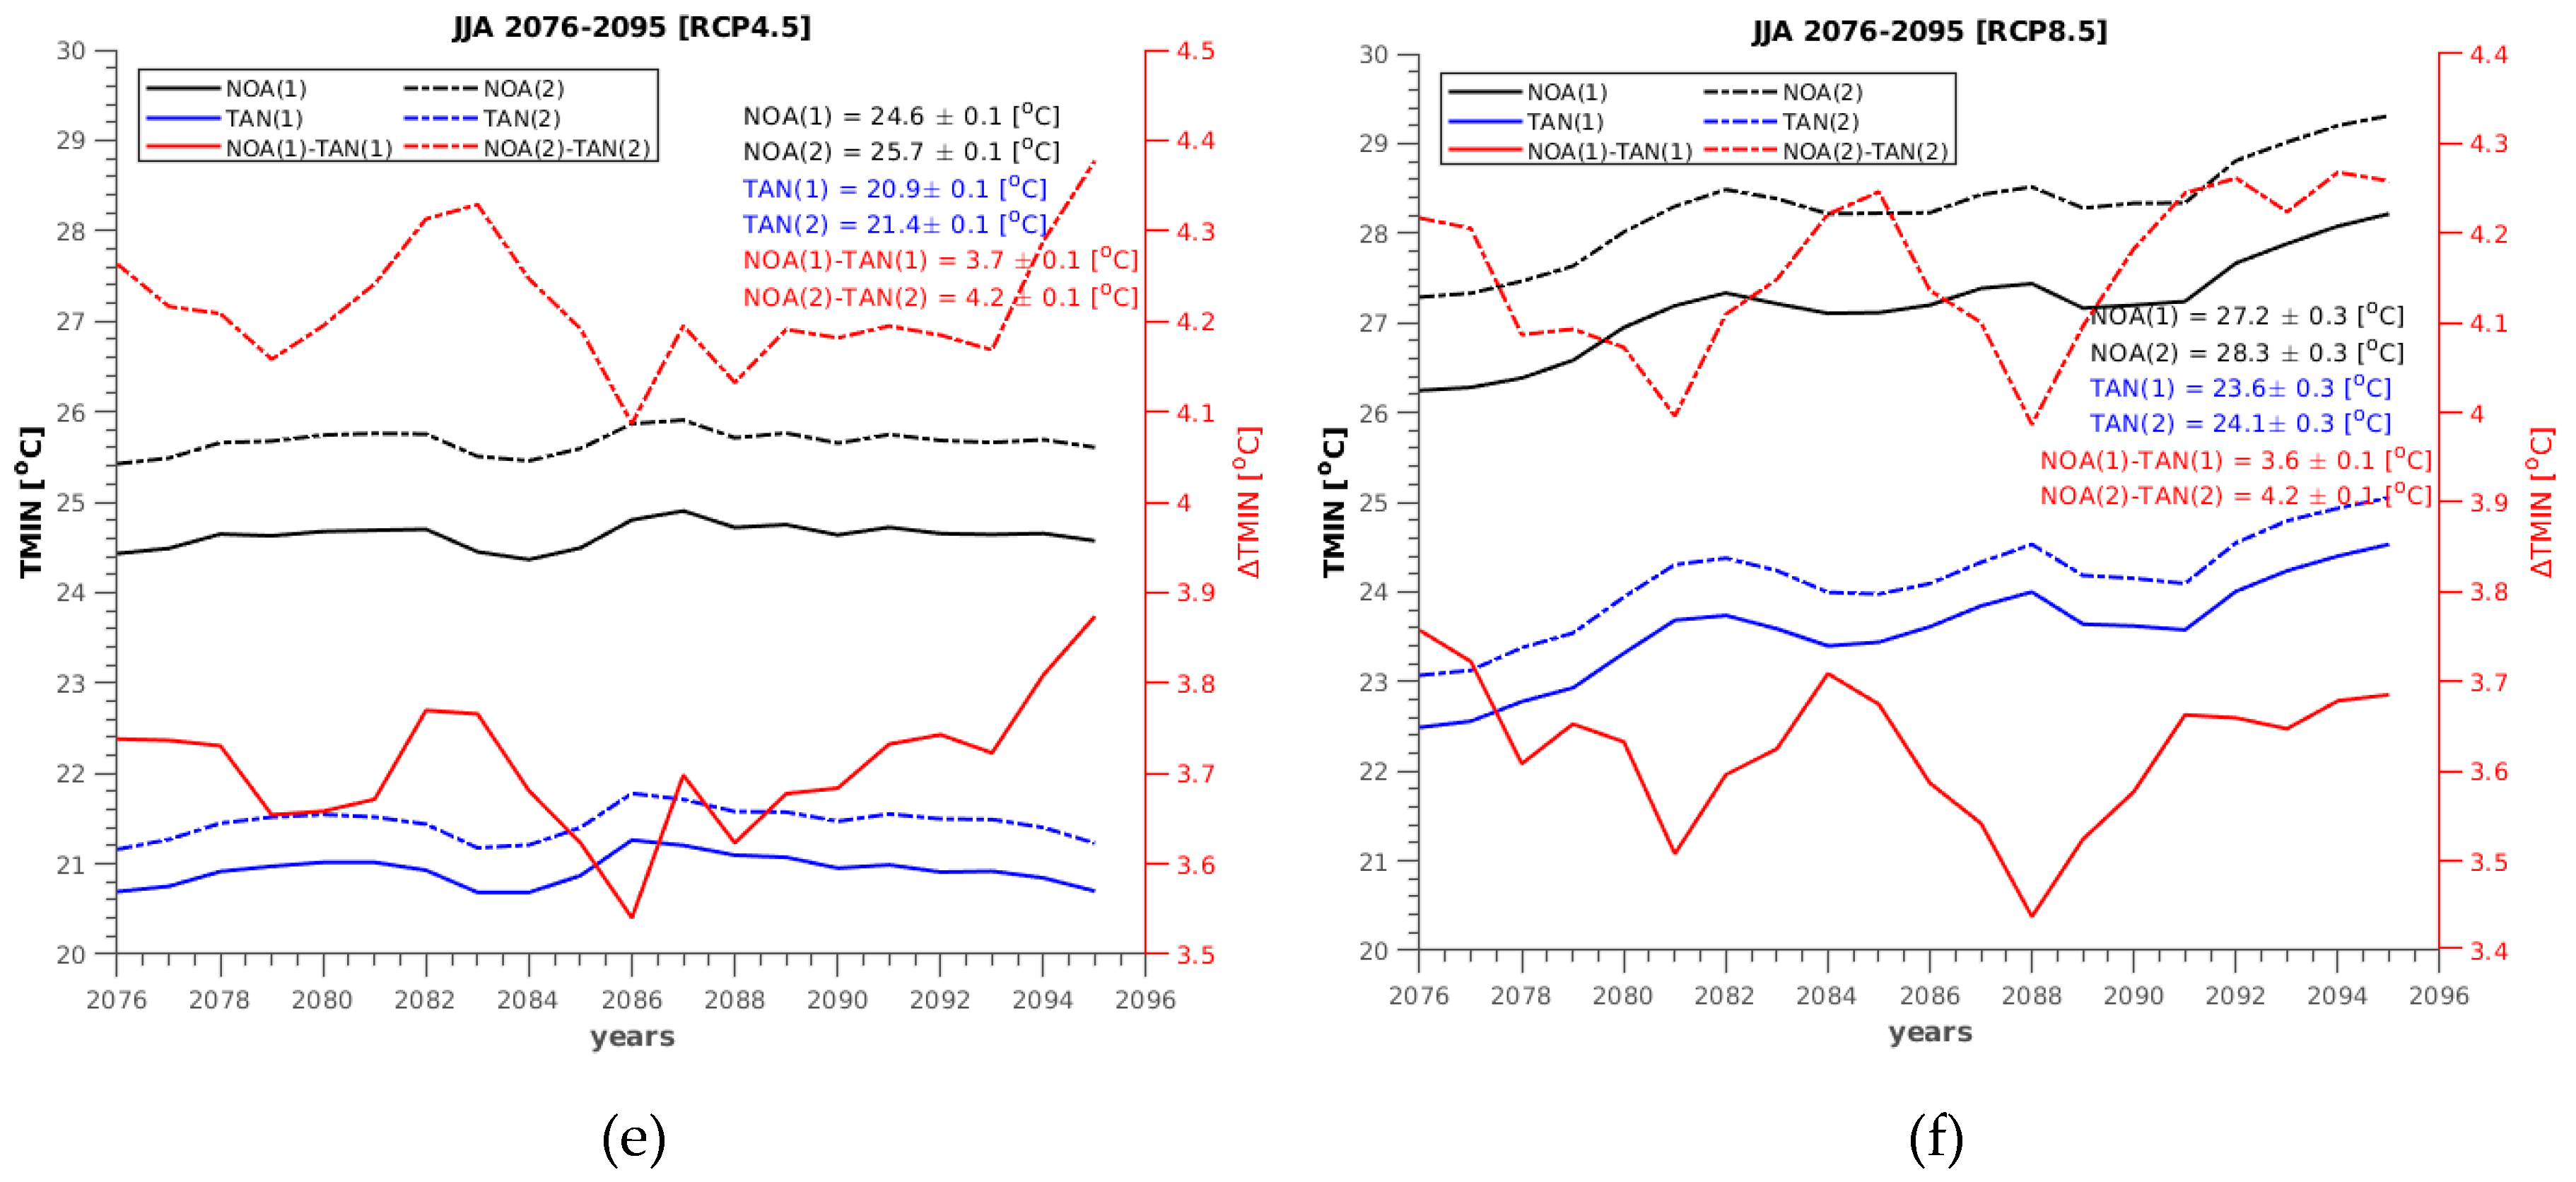
Scenario RCP4.5 reveals approximately stable minimum temperatures in the near future. In TAN, Tmin is ~20.3–20.8 °C, while it is higher in NOA by +3.9 °C (UHI_1) to +4.4 °C (UHI_2) (Figure 8b). Minimum temperatures increase in the distant future. Over the period 2076–2095, average summer minimum temperatures are approximately stable at ~20.9–21.5 °C in TAN, being +3.7 °C (UHI_1) to +4.2 °C (UHI_2) higher in NOA (Figure 8e).
Minimum temperatures in the near future show a rising trendline under scenario RCP8.5, increasing from ~20.7–21.2 °C to ~21.9–22.4 °C (period average: ~21.3–21.9 °C) in TAN. The ΔTmin with NOA amounts from +3.8 °C (UHI_1) to +4.3 °C (UHI_2) (Figure 8c). These increases continue into the distant future, rising from ~22.5–23.0 °C to ~24.4–24.8 °C (period average: ~23.6–24.1 °C) in TAN. The ΔTmin with NOA remains stable over this time period at +3.6 °C (UHI_1) to +4.2 °C (UHI_2) (Figure 8f).
There is a minor difference in average summer ΔTmin of ~0.2 °C between the two historical reference periods (Table 2). The future difference in average summer ΔTmin between the two bias correction scenarios of UHI_1 and UHI_2 is ~0.4–0.6 °C. This reflects the temperature dependency of UHI intensities: the higher the average summer minimum temperatures, the greater the urban amplification rate.

4.3. Extreme Summer Temperatures

The two temperature indicators representing extremely hot conditions (annual frequency of days with Tmax > 37 °C and Tmin > 26 °C) are increasing under all future climate change scenarios and bias correction periods.
At TAN, the use of different bias correction periods (UHI_1 or UHI_2) hardly makes a difference in the outcomes of projected future averaged number of extremely hot nights/days per year. For each RCP scenario there is an overlap of simulated frequency curves corrected with, respectively, UHI_1 and UHI_2 (Figure 9 and Figure 10). This indicates that the relation between modeled and observed temperature is stable for the two reference periods.
There are substantial differences at NOA (Athens), depending on the correction period used, in the projected outcomes of future averaged number of extremely hot nights/days per year. Simulated frequency curves of annual number of extremely hot days/nights corrected with, respectively, UHI_1 and UHI_2 do not overlap (Figure 9 and Figure 10); this indicates that the relation between modeled and observed temperature indices is not stable for the contrasting reference periods. This is related to the observed increase in UHI intensity over period UHI_2 (Section 3) causing a greater urban amplification rate of regional temperatures.

4.3.1. Frequency of Extremely Hot Nights

The annual number of extremely hot nights (Tmin > 26 °C) over the period 1996–2015 (UHI_2) was on average 0 in TAN and 15 in NOA (Figure 4).
Under scenario RCP2.6, extremely hot nights are stable in TAN at ~1/year under both UHI regimes (UHI_1 and UHI_2) for the near future (2046–2065) (Figure 9a). Over the same period, the frequency in extremely hot nights is variable with a decreasing trendline in NOA, with an average of 26 nights/year (UHI_2) and 15 nights/year (UHI_1), respectively (Figure 9a). In the distant future (2076–2095) the frequency of extremely hot nights decreases slightly under RCP2.6 (Figure 9d). In TAN their frequency remains stable at ~1/year under both bias corrections. The frequency of extremely hot nights in NOA is subject to large variations, with an average of 24 nights/year (UHI_2) and 13 nights/year (UHI_1), respectively (Figure 9a).
Scenario RCP4.5 projects that extremely hot nights are stable in TAN at ~2/year under both bias corrections (UHI_1 and UHI_2) for the near future (2046–2065) (Figure 9b). Meanwhile, the frequency of extremely hot nights is variable in NOA, with an average of 37 nights/year (UHI_2) and 22 nights/year (UHI_1), respectively (Figure 9b). In the distant future (2076–2095) the frequency of extremely hot nights in TAN is stable at ~4–5/year under both bias corrections (Figure 9e). The frequency of extremely hot nights in NOA is fluctuating around ~45 nights/year (UHI_2) and ~27 nights/year (UHI_1).
Scenario RCP8.5 shows large frequency increases over both future periods. Extremely hot nights are variable with an upward trendline in TAN, rising from ~3 to ~10 events/year (average: ~6 events/year) under both bias corrections (UHI_1 and UHI_2) in the near future (2046–2065) (Figure 9c). The frequency of extremely hot nights strongly increases in NOA, from ~42 to ~62 nights/year (UHI_2; average ~52 nights/year) and from ~27 to ~38 nights/year (UHI_1; average ~33 nights/year), respectively (Figure 9c). The upward trend in the frequency of extremely hot nights continues in the distant future (2076–2095). In TAN, the frequency increases from ~12–18 to ~28–34 events/year (average ~24–29 nights/year) under both bias corrections (Figure 9f). The frequency of extremely hot nights in NOA escalates from ~72 to ~92 nights/year (UHI_2; average ~84 nights/year) and from ~50 to ~74 nights/year (UHI_1; average ~63 nights/year).
There are no large increases in the average annual number of hot nights in TAN, the rural reference site for Athens, under scenarios RCP2.6 and 4.5 in the near and distant future. Only under scenario RCP8.5 is there a large increase in extremely hot nights from the near to distant future. Projections indicate that the urban NOA site will experience many more extremely hot nights under UHI intensities associated with bias correction period UHI_2 compared to UHI_1. The difference amounts (on average) to: ~11 nights/year under RCP2.6, ~15–18 nights/year under RCP4.5, and ~19–21 nights/year under RCP8.5 (respectively, in the near and distant future). This suggests that air pollution (higher under the UHI_2 regime) greatly amplifies the frequency of extremely hot nights in response to increases in average summer minimum temperatures.

4.3.2. Frequency of Extremely Hot Days

The average annual number of extremely hot days (Tmax > 37 °C) observed during the period 1996–2015 (UHI_2) amounted to six in TAN and 11 in NOA (Figure 4).
Scenario RCP2.6 (Figure 10a) shows a relatively stable amount of extremely hot days in TAN at ~12–9 days/year under bias corrections UHI_1 and UHI_2, respectively, for the near future (2046–2065). For the same period, the frequency of very hot days is relatively stable in NOA, although variable, at ~10 days/year (UHI_1) and ~16 days/year (UHI_2). In the distant future (2076–2095) the frequency of extremely hot days does not change significantly but is highly variable (Figure 10d). In TAN the frequency fluctuates between ~11–9 days/year under bias corrections UHI_1 and UHI_2, respectively. The frequency of extremely hot days in NOA stands at ~9 days/year (UHI_1) and ~16 days/year (UHI_2).
Intermediate scenario RCP4.5 (Figure 10b) shows a highly variable amount of extremely hot days in TAN at ~17–14 days/year under bias corrections UHI_1 and UHI_2, respectively, in the near future (2046–2065). The frequency of very hot days is also highly variable in NOA in the near future, at ~15 days/year (UHI_1) and ~23 days/year (UHI_2). In the distant future (2076–2095) the frequency of extremely hot days increases and is subject to large inter-annual variability (Figure 10e). In TAN, frequency fluctuates between ~23–18 days/year under bias corrections UHI_1 and UHI_2, respectively. The frequency of extremely hot days in NOA fluctuates around ~18 days/year (UHI_1) and ~27 days/year (UHI_2).
The most extreme scenario, RCP8.5, shows a variable but increasing amount of extremely hot days in the near and distant future periods (Figure 10c–f). The frequency rises in TAN from ~17–15 to ~32–24 days/year (average: ~25–20 days/year) under bias corrections UHI_1 and UHI_2, respectively, in the near future (2046–2065). The frequency of very hot days also steeply increases in NOA in the near future, from ~16–24 days/year (UHI_1; average: ~21) and ~25–37 days/year (UHI_2; average: ~32). In the distant future (2076–2095) the frequency of extremely hot days continues its amplification, while being subjected to large inter-annual variability (Figure 10f). In TAN, the extremely hot days increase from ~37–34 to ~58–52 days/year (average: ~47–41 days/year) under bias corrections UHI_1 and UHI_2, respectively. The frequency of extremely hot days in NOA amplifies from ~33–54 days/year (UHI_1; average ~42) and ~45–68 days/year (UHI_2; average ~55).
There is an overlap in the frequency of hot days between TAN (UHI_1 and UHI_2) and NOA (UHI_1). The UHI effect only influences the frequency of extremely hot days under the most intense UHI regime (UHI_2; see also Section 4.2.1). This is likely linked to the finding that regional heatwaves have a blanketing effect on daytime temperatures and may override the UHI of Athens [22]. However, higher UHI intensities require more extreme heatwaves to be overridden. Projections indicate that the urban NOA site will experience more extremely hot days under UHI intensities associated with bias correction period UHI_2 compared to UHI_1. The difference amounts (on average) to: ~6–7 days/year under RCP2.6, ~8–9 days/year under RCP4.5, and ~11–13 days/year under RCP8.5 (respectively, in the near and distant future).

5. Discussion

This study assesses the impact of two different UHI regimes on future summer temperature projections for the city of Athens (Greece). To date, future UHI projections have incorporated stable averaged UHI values based on the respective reference period of the study (e.g., [45,46,48,49]). However, long-term (city-specific) UHI values are not stable over time. Accordingly, projections may considerably under- or overestimate future urban temperatures. For the development of effective mitigation strategies, it is essential to find ways to incorporate different UHI regimes in future urban temperature projections for specific cities.
Our novel method used two different reference periods (1976–1995 and 1996–2015) for bias correction of model simulation results. UHI intensities are “locked” under each of our scenarios, based on the UHI regimes of the two reference periods. The observed differences in the Athens summer UHI regime between the two reference periods are likely predominantly caused by changes in air pollution (traffic) and heat input (traffic and air-cooling units). The difference in daytime (nighttime) heat island intensity in summer is stable at +0.9–1.1 (+0.5–0.6) °C between the two UHI regimes in all model simulation results (Figure 7 and Figure 8, respectively).
A 20-year period is the minimum amount of years required for bias correction; therefore, any UHI regime is necessarily based on a 20-year average. Long observational records are required to capture contrasting UHI regimes. Studies could contrast two consecutive 20-year periods, as done in this paper, or use overlapping 20-year periods that have different averaged UHI regimes. This means that there is a limit to the number of scenarios that can be tested depending on the length of the observational records.
Our simulations show that changes in the summer UHI regime strongly impact on future temperature projections for NOA. Summer nighttime UHI intensity (ΔTmin) is (much) greater than daytime UHI intensity (ΔTmax). However, the stronger UHI regime (UHI_2) amplifies daytime UHI intensity to a larger extent than nighttime UHI intensity. Average summer minimum temperatures have a high UHI intensity (ΔTmin). The ΔTmin is similar for scenarios RCP2.6, 4.5, and 8.5, amounting to 3.6–3.9 °C under bias correction UHI_1 and 4.2–4.4 °C under UHI_2 (Figure 8). Average summer maximum temperatures have a lower UHI intensity (ΔTmax). The ΔTmax is approximately stable between scenarios RCP2.6, 4.5, and 8.5, amounting to 0.8–0.9 °C under bias correction UHI_1 and to 1.8 °C under UHI_2 (Figure 7). However, the ΔTmax decreases progressively when averaged summer maximum temperatures in rural TAN increase above 33 °C. This behavior has also been observed over the historical period and is linked to the blanketing regional effect of heatwave events on temperatures [22].
The future frequency of extremely hot days at NOA is only different from background values, as measured at TAN, under bias correction scenario UHI_2. This suggests that only very high UHI intensities amplify frequencies of extremely hot days, thus strengthening the impact of heatwaves on the urban environment. Under an UHI regime similar to the period 1996–2015, there will be ~16 (RCP2.6), ~23 (RCP4.5) or ~32 (RCP8.5) extremely hot days in NOA up to the end of the century.
The future frequency of extremely hot nights is much higher at NOA than at TAN under all bias corrections and all climate scenarios. Until the end of the century, the frequency of events in NOA is ~14 (RCP2.6), ~22–27 (RCP4.5), and ~33–63 (RCP8.5) nights/year under UHI_1. These numbers increase by, respectively, ~11 (RCP2.6), ~17 (RCP4.5), and ~20 (RCP8.5) nights/year under UHI_2. Findings suggest that air pollution (higher under the UHI_2 regime) greatly amplifies the frequency of extremely hot nights in response to increases in average summer minimum temperatures, in line with recent findings [9]. Therefore, the “extremely hot night” index (Tmin > 26 °C) is very useful for assessing the impact of climate mitigation policies in the greater Athens area, that focus on reducing air pollution.

Urban Climate Change Mitigation: The Greater Athens Area

Future temperature projections under the two UHI regimes used in this study must be considered as low future estimates, given the long-term upward trajectory of air pollution and heat input over the reference periods. Continuation of this upward trajectory at the same rates may add 4.8 °C to average summer Tmax and 1.2 °C to average summer Tmin in NOA based on extrapolation of UHI amplification over the period 1976–2015 (Section 3) in the distant future (2075–2095).
Future urban temperatures, as modeled under the UHI_2 regime, are only likely if levels of air pollution and heat input in Athens are stabilized at levels recorded over the period 1996–2015. Stabilization of UHI intensities at their recent level (UHI_2; 1996–2015) will lead to significantly higher urban temperatures under all future climate change scenarios. Future urban temperatures under the UHI_1 regime may only be achieved if air pollution and heat input are reduced to their 1976–1995 levels. Such reduction would significantly decrease the negative impacts, associated with projected climate change, on the urban environment of Athens.
This study indicates that the negative consequences of projected future regional temperature increases may be successfully limited through the development of mitigation strategies for the city of Athens. Such strategies are likely very effective and rapid if they address the UHI component that is determined by air pollution and heat input from transportation and cooling-units. Mitigation measures that help decrease the summer UHI intensity by ~0.9–1.1 °C (Tmax) and ~0.5–0.6 °C (Tmin) (i.e., to the UHI regime of 1976–1995) may provide large future health and economic benefits. Most significant is the reduction in extremely hot days/nights when returning to UHI regime UHI_1.
Policies aimed at decreasing urban atmospheric pollution and heat input (e.g., decreasing car traffic and use of air-cooling units, improving public transport and “cool” buildings) could be rapidly implemented. They would have an immediate positive health effect [79] and mitigate against local impacts of future climate change. Specifically, these policies will lower future urban temperatures and decrease the frequency of extreme daytime/nighttime heat events. In turn, this delivers additional health benefits (e.g., decreasing illness and mortality rates during heat events) and decreases energy needs for (extreme) cooling during the summer [13,16,17,22,64].

6. Conclusions

This modeling exercise showed that (1) future temperature projections may incorporate different UHI regimes based on long-term historical records, (2) different UHI regimes strongly affect future urban temperature projections, and (3) city-specific mitigation measures may significantly decrease negative impacts on urban temperatures associated with future climate change. Urban temperature projections under the two UHI regimes used in this study must be considered as low future estimates, given the long-term upward trajectory of air pollution and heat input. Stabilization of UHI intensities at their recent level (UHI_2; 1996–2015) will lead to significantly higher urban temperatures under all future climate change scenarios. Only when air pollution and heat input are reduced to their 1976–1995 levels, did we observe no or limited future urban temperature increases under most scenarios.
This paper presents a novel method that allows, for the first time, to assess future variability in summer temperatures under different UHI intensity regimes. We used climate models to simulate future temperatures for the center of Athens (urban) and nearby Tanagra (rural), Greece, under three scenarios (RCP2.6, 4.5, and 8.5) and two different UHI regimes. The latter was achieved by bias correcting simulation results against separate 20-year observational records, respectively covering 1976–1995 and 1996–2015, from an urban and rural meteorological station. The observed differences in the Athens summer UHI regime between the two reference periods are likely caused by changes in air pollution (traffic) and heat input (traffic and air-cooling units).
Projected maximum and minimum temperatures in Athens are, respectively, ~0.9–1.1 °C (Tmax) and ~0.5–0.6 °C (Tmin) higher under all climate change scenarios when the more intense UHI regime is used. The UHI intensity (ΔTNOA_TAN) is stable under all scenarios at ~1.8 °C (UHI_2)/~0.8 °C (UHI_1) for ΔTmax up to a temperature of 33 °C, and ~4.2–4.4 °C (UHI_2)/~3.7–3.9 °C (UHI_1) for ΔTmin. The progressive decrease in maximum UHI intensity (ΔTmax) above 33 °C is also observed in the historical record and likely linked to the blanketing temperature effect of regional heatwaves that largely eliminate urban–rural temperature differences.
The future frequency of extremely hot days in NOA is only different from rural background values under the intense UHI regime (UHI_2) that shows an increase in extremely hot days by one to two weeks under different climate scenarios. This suggests that only very high UHI intensities amplify the annual frequency of extremely hot days and the impact of heatwaves on the urban environment.
There is a large increase in the future frequency of extremely hot nights in NOA under all UHI regimes and climate scenarios. There will be one to five of such nights in rural settings under climate scenarios RCP2.6 and RCP4.5, while RCP8.5 shows a progressive increase from six to 29 nights. However, their frequency in Athens is about 14 (25) nights/year (RCP2.6), 22–27 (39–44) nights/year (RCP4.5), and 33–63 (53–63) nights/year (RCP8.5) under UHI regime UHI_1 (UHI_2). The most probable factor causing this large amplification in the annual frequency of extremely hot nights is air pollution. Therefore, the “extremely hot night” index (Tmin > 26 °C) may be very useful for assessing the impact of climate mitigation policies in the greater Athens area, that focus on reducing air pollution.
Local mitigation measures are likely highly effective in reducing urban temperatures and extreme heat events in Athens under future climate change scenarios. Specifically, policies aimed at decreasing urban atmospheric pollution and heat input should be rapidly implemented and have multiple benefits, including reduced electricity (energy) needs, improved living quality, and strong health advantages (heat- and pollution-related illness/deaths).

Author Contributions

Conceptualization, T.v.d.S.; Methodology, K.V.V. and T.v.d.S.; Software, K.V.V. and C.G.; Validation, T.v.d.S., K.V.V., C.G. and D.F.; Formal Analysis, T.v.d.S. and K.V.V.; Investigation, T.v.d.S. and K.V.V.; Resources, C.G. and D.F.; Data Curation, K.V.V., C.G. and D.F.; Writing—Original Draft Preparation, T.v.d.S.; Writing—Review & Editing, T.v.d.S., K.V.V., C.G. and D.F.; Visualization, T.v.d.S. and K.V.V.; Supervision, C.G.; Project Administration, C.G.; Funding Acquisition, C.G. All authors have read and agreed to the published version of the manuscript.

Funding

This work funded by the Horizon 2020 Framework Programme under grant LIFE15 CCA/CY/000086 for the project LIFE URBANPROOF.

Acknowledgments

The authors are also grateful to the Hellenic National Meteorological Service (HNMS) for providing air temperature data from Tanagra meteorological station. Two anonymous referees helped to improve this manuscript.

Conflicts of Interest

The authors declare no conflicts of interest.

References

  1. United Nations. Press Release of the World Urbanization Prospects 2018; United Nations: New York, NY, USA, 2018. [Google Scholar]
  2. Oke, T.R. City size and the urban heat island. Atmos. Environ. 1973, 7, 769–779. [Google Scholar] [CrossRef]
  3. Agathangelidis, I.; Cartalis, C.; Santamouris, M. Integrating Urban Form, Function, and Energy Fluxes in a Heat Exposure Indicator in View of Intra-Urban Heat Island Assessment and Climate Change Adaptation. Climate 2019, 7, 75. [Google Scholar] [CrossRef] [Green Version]
  4. Oke, T.R. The energetic basis of the urban heat island. Quart. J. Roy. Meteor. Soc. 1982, 108, 1–24. [Google Scholar] [CrossRef]
  5. Roth, M. Urban Heat Islands. Handbook of Environmental Fluid Dynamics, Volume Two; Fernando, H.J.S., Ed.; CRC Press/Taylor & Francis Group, LLC: Boca Raton, FL, USA, 2013; pp. 144–151. ISBN 978-1-4665-5601-0. [Google Scholar]
  6. Ohashi, Y.; Genchi, Y.; Kondo, H.; Kikegawa, Y.; Yoshikado, H.; Hirano, Y. Influence of air-conditioning waste heat on air temperature in Tokyo during summer: Numerical experiments using an urban canopy model coupled with a building energy model. J. Appl. Meteorol. Climatol. 2007, 46, 66–81. [Google Scholar] [CrossRef]
  7. Blake, R.; Grimm, A.; Ichinose, T.; Horton, R.; Gaffin, S.; Jiong, S.; Bader, D.; Cecil, L.D. Urban climate: Processes, trends, and projections. In Climate Change and Cities: First Assessment Report of the Urban Climate Change Research Network; Rosenzweig, C., Solecki, W.D., Hammer, S.A., Mehrotra, S., Eds.; Cambridge University Press: Cambridge, UK, 2011; pp. 43–81. [Google Scholar]
  8. Cao, C.; Lee, X.; Liu, S.; Schultz, N.; Xiao, W.; Zhang, M.; Zhao, L. Urban heat islands in China enhanced by haze pollution. Nat. Commun. 2016, 7, 12509. [Google Scholar] [CrossRef]
  9. Li, H.; Meier, F.; Lee, X.; Chakraborty, T.; Liu, J.; Schaap, M.; Sodoudi, S. Interaction between urban heat island and urban pollution island during summer in Berlin. Sci. Total Environ. 2018, 636, 818–828. [Google Scholar] [CrossRef]
  10. Chow, W.T.L.; Roth, M. Temporal dynamics of the urban heat island of Singapore. Int. J. Climatol. 2006, 26, 2243–2260. [Google Scholar] [CrossRef]
  11. Camilloni, I.; Barrucand, M. Temporal variability of the Buenos Aires, Argentina, urban heat island. Theor. Appl. Climatol. 2012, 107, 47–58. [Google Scholar] [CrossRef]
  12. Magli, S.; Lodi, C.; Lombroso, L.; Muscio, A.; Teggi, S. Analysis of the urban heat island effects on building energy consumption. Int. J. Energy Environ. Eng. 2015, 6, 91–99. [Google Scholar] [CrossRef] [Green Version]
  13. Santamouris, M.; Cartalis, C.; Synnefa, A.; Kolokotsa, D. On the impact of urban heat island and global warming on the power demand and electricity consumption of buildings—A review. Energy Build. 2015, 98, 119–124. [Google Scholar] [CrossRef]
  14. Santamouris, M. Analyzing the heat island magnitude and characteristics in one hundred Asian and Australian cities and regions. Sci. Total Environ. 2015, 512–513, 582–598. [Google Scholar] [CrossRef] [PubMed]
  15. Zanobetti, A.; Schwartz, J. Temperature and mortality in nine US cities. Epidemiology 2008, 19, 563–570. [Google Scholar] [CrossRef] [PubMed] [Green Version]
  16. Nastos, P.T.; Matzarakis, A. The effect of air temperature and human thermal indices on mortality in Athens, Greece. Theor. Appl. Climatol. 2012, 108, 591–599. [Google Scholar] [CrossRef]
  17. Pyrgou, A.; Santamouris, M. Increasing probability of heat-related mortality in a Mediterranean city due to urban warming. Int. J. Environ. Res. Public Health 2018, 15, 1571. [Google Scholar] [CrossRef] [PubMed] [Green Version]
  18. Changnon, S.A. Measures of economic impacts of weather extremes. Bull. Am. Meteorol. Soc. 2003, 84, 1231–1235. [Google Scholar] [CrossRef] [Green Version]
  19. Fouillet, A.; Rey, G.; Laurent, F.; Pavillon, G.; Bellec, S.; Guihenneuc-Jouyaux, C.; Clavel, J.; Jougla, E.; Hémon, D. Excess mortality related to the August 2003 heat wave in France. Int. Arch. Occup. Environ. Health 2006, 80, 16–24. [Google Scholar] [CrossRef] [Green Version]
  20. Gasparrini, A.; Armstrong, B. The impact of heat waves on mortality. Epidemiology 2011, 22, 68–73. [Google Scholar] [CrossRef] [Green Version]
  21. Kosatsky, T.; Henderson, S.B.; Pollock, S.L. Shifts in Mortality during a Hot Weather Event in Vancouver, British Columbia: Rapid Assessment with Case-Only Analysis. Am. J. Public Health 2012, 102, 2367–2371. [Google Scholar] [CrossRef]
  22. Founda, D.; Pierros, F.; Petrakis, M.; Zerefos, C. Interdecadal variations and trends of the Urban Heat Island in Athens (Greece) and its response to heat waves. Atmos. Res. 2015, 161–162, 1–13. [Google Scholar] [CrossRef]
  23. Founda, D.; Santamouris, M. Synergies between Urban Heat Island and Heat Waves in Athens (Greece), during an extremely hot summer (2012). Sci. Rep. 2017, 7, 10973. [Google Scholar] [CrossRef] [Green Version]
  24. Meehl, G.A.; Tebaldi, C. More intense, more frequent, and longer lasting heat waves in the 21st century. Science 2004, 305, 994–997. [Google Scholar] [CrossRef] [PubMed] [Green Version]
  25. Coumou, D.; Rahmstorf, S. A decade of weather extremes. Nat. Clim. Chang. 2012, 2, 491–496. [Google Scholar] [CrossRef]
  26. Coumou, D.; Robinson, A. Historic and future increase in the global land area affected by monthly heat extremes. Environ. Res. Lett. 2013, 8, 034018. [Google Scholar] [CrossRef]
  27. Stone, B.J. Urban and rural temperature trends in proximity to large US cities: 1951–2000. Int. J. Climatol. 2007, 27, 1801–1807. [Google Scholar] [CrossRef]
  28. Tan, J.; Zheng, Y.; Tang, X.; Guo, C.; Li, L.; Song, G.; Zhen, X.; Yuan, D.; Kalkstein, A.J.; Li, F.; et al. The urban heat island and its impact on heat waves and human health in Shanghai. Int. J. Biometeorol. 2010, 54, 75–84. [Google Scholar] [CrossRef]
  29. Giorgi, F.; Bi, X. Updated regional precipitation and temperature changes for the 21st century from ensembles of recent AOGCM simulations. Geophys. Res. Lett. 2005, 32. [Google Scholar] [CrossRef]
  30. Giorgi, F. Climate change hot-spots. Geophys. Res. Lett. 2006, 33. [Google Scholar] [CrossRef]
  31. Giorgi, F.; Lionello, P. Climate change projections for the Mediterranean region. Glob. Planet. Chang. 2008, 63, 90–104. [Google Scholar] [CrossRef]
  32. Zanis, P.; Kapsomenakis, I.; Philandras, C.; Douvis, K.C.; NIkolakis, D.; Kanellopoulou, E.; Zerefos, C.; Repapis, C.C. Analysis of an ensemble of present day and future regional climate simulations for Greece. Int. J. Climatol. 2009, 29, 1614–1633. [Google Scholar] [CrossRef]
  33. Lionello, P.; Scarascia, L. The relation between climate change in the Mediterranean region and global warming. Reg. Environ. Chang. 2018, 18, 1481–1493. [Google Scholar] [CrossRef]
  34. Hertig, E.; Jacobeit, J. Downscaling future climate change: Temperature scenarios for the Mediterranean area. Glob. Planet. Chang. 2008, 63, 127–131. [Google Scholar] [CrossRef]
  35. Lelieveld, J.; Hadjinicolaou, P.; Kostopoulou, E.J.; Chenoweth, M.; El Maayar, C.; Giannakopoulos, C.; Hannides, M.A.; Lange, M.; Tanarhte, E.; Tyrlis, A.; et al. Climate change and impacts in the Eastern Mediterranean and the Middle East. Clim. Chang. 2012, 114, 667–687. [Google Scholar] [CrossRef] [PubMed] [Green Version]
  36. Kostopoulou, E.; Giannakopoulos, C.; Hatzaki, M.; Karali, A.; Hadjinicolaou, P.; Lelieveld, J.; Lange, M.A. Spatio-temporal patterns of recent and future climate extremes in the eastern Mediterranean and Middle East region. Nat. Hazards Earth Syst. Sci. 2014, 14, 1565–1577. [Google Scholar] [CrossRef] [Green Version]
  37. Diffenbaugh, N.S.; Pal, J.S.; Giorgi, F.; Gao, X. Heat stress intensification in the Mediterranean climate change hotspot. Geophys. Res. Lett. 2007, 34. [Google Scholar] [CrossRef] [Green Version]
  38. Kuglitsch, F.G.; Toreti, A.; Xoplaki, E.; Della-Marta, P.M.; Zerefos, C.S.; Türkeş, M.; Luterbacher, J. Heat wave changes in the eastern Mediterranean since 1960. Geophys. Res. Lett. 2010, 37, L04802. [Google Scholar] [CrossRef] [Green Version]
  39. Founda, D.; Giannakopoulos, C. The exceptionally hot summer of 2007 in Athens, Greece—A typical summer in the future climate? Glob. Planet. Chang. 2009, 67, 227–236. [Google Scholar] [CrossRef]
  40. Giannakopoulos, C.; Le Sager, P.; Bindi, M.; Moriondo, M.; Kostopoulou, E.; Goodess, C.M. Climatic changes and associated impacts in the Mediterranean resulting from a 2 C global warming. Glob. Planet. Chang. 2009, 68, 209–224. [Google Scholar] [CrossRef]
  41. Tolika, K.; Maheras, P.; Tegoulias, I. Extreme temperatures in Greece during 2007: Could this be a ‘return to the future’? Geophys Res. Lett. 2009, 36, L10813. [Google Scholar] [CrossRef]
  42. Lelieveld, J.; Hadjinicolaou, P.; Kostopoulou, E.; Giannakopoulos, C.; Pozzer, A.; Tanarhte, M.; Tyrlis, E. Model projected heat extremes and air pollution in the eastern Mediterranean and Middle East in the twenty-first century. Reg. Environ. Chang. 2014, 14, 1937–1949. [Google Scholar] [CrossRef] [Green Version]
  43. Founda, D.; Varotsos, K.V.; Pierros, F.; Giannakopoulos, C. Observed and projected shifts in hot extremes’ season in the Eastern Mediterranean. Glob. Planet. Chang. 2019, 175, 190–200. [Google Scholar] [CrossRef]
  44. Rosenzweig, C.; Solecki, W.D.; Hammer, S.A.; Mehrotra, S. Climate Change and Cities: First Assessment Report of the Urban Climate Change Research Network; Cambridge University Press: Cambridge, UK, 2011. [Google Scholar]
  45. Wilby, R.L. Constructing climate change scenarios of urban heat island intensity and air quality. Environ. Plan. B Plan. Des. 2008, 35, 902–919. [Google Scholar] [CrossRef] [Green Version]
  46. Adachi, S.A.; Kimura, F.; Kusaka, H.; Inoue, T.; Ueda, H. Comparison of the impact of global climate changes and urbanization on summertime future climate in the Tokyo Metropolitan Area. J. Appl. Meteorol. Climatol. 2012, 51, 1441–1454. [Google Scholar] [CrossRef]
  47. McCarthy, M.P.; Harpham, C.; Goodess, C.M.; Jones, P.D. Simulating climate change in UK cities using a regional climate model, HadRM3. Int. J. Climatol. 2012, 32, 1875–1888. [Google Scholar] [CrossRef]
  48. Georgescu, M.; Moustaoui, M.; Mahalov, A.; Dudhia, J. Summer-time climate impacts of projected megapolitan expansion in Arizona. Nat. Clim. Chang. 2013, 3, 37–41. [Google Scholar] [CrossRef]
  49. Argueso, D.; Evans, J.P.; Fita, L.; Bormann, K.J. Temperature response to future urbanization and climate change. Clim. Dyn. 2014, 42, 2183–2199. [Google Scholar] [CrossRef]
  50. Hamdi, R.; de Vyver, H.V.; de Troch, R.; Termonia, P. Assessment of three dynamical urban climate downscaling methods: Brussels’s future urban heat island under an A1B emission scenario. Int. J. Climatol. 2014, 34, 978–999. [Google Scholar] [CrossRef]
  51. Melas, D.; Ziomas, I.; Klemm, O.; Zerefos, C. Anatomy of sea breeze circulation in Greater Athens under weak large-scale ambient winds. Atmos. Environ. 1998, 32, 2223–2237. [Google Scholar] [CrossRef]
  52. Santamouris, M.; Mihalakakou, G.; Papanikolaou, N.; Assimakopoulos, D.N. A neural network approach for modeling the heat island phenomenon in urban areas during the summer period. Geophys. Res. Lett. 1999, 26, 337–340. [Google Scholar] [CrossRef]
  53. Santamouris, M.; Papanikolaou, N.; Livada, I.; Koronakis, I.; Georgakis, C.; Argiriou, A.; Assimakopoulos, D.N. On the impact of urban climate to the energy consumption of buildings. Sol. Energy 2001, 70, 201–216. [Google Scholar] [CrossRef]
  54. Livada, I.; Santamouris, M.; Niachou, K.; Papanikolaou, N.; Mihalakakou, G. Determination of places in the great Athens area where the heat island effect is observed. Theor. Appl. Climatol. 2002, 71, 219–230. [Google Scholar] [CrossRef]
  55. Mihalakakou, G.; Flokas, H.; Santamouris, M.; Helmis, C. Application of neural networks to the simulation of the heat island over Athens, Greece, using synoptic types as a predictor. J. Appl. Meteorol. 2002, 41, 519–527. [Google Scholar] [CrossRef]
  56. Kassomenos, P.A.; Katsoulis, B.D. Mesoscale and macroscale aspects of the morning Urban Heat Island around Athens, Greece. Meteorog. Atmos. Phys. 2006, 94, 209–218. [Google Scholar] [CrossRef]
  57. Giannopoulou, K.; Livada, I.; Santamouris, M.; Saliari, M.; Assimakopoulos, M.; Caouris, Y.G. On the characteristics of the summer urban heat island in Athens, Greece. Sust. Cities Soc. 2011, 1, 16–28. [Google Scholar] [CrossRef]
  58. Founda, D. Evolution of the air temperature in Athens and evidence of climatic change: A review. Adv. Build. Energy Res. 2011, 5, 7–41. [Google Scholar] [CrossRef]
  59. Theoharatos, G.; Pantavou, K.; Mavrakis, A.; Spanou, A.; Katavoutas, G.; Efstathiou, P.; Mpekas, P.; Asimakopoulos, D.N. Heat waves observed in 2007 in Athens, Greece: Synoptic conditions, bioclimatological assessment, air quality levels and health effects. Environ. Res. 2010, 110, 152–161. [Google Scholar] [CrossRef]
  60. Xoplaki, E.; Gonzalez-Rouco, F.J.; Gyalistras, D.; Luterbacher, J.; Rickli, R.; Wanner, H. Interannual summer air temperature variability over Greece and its connection to the large-scale atmospheric circulation and Mediterranean SSTs 1950–1999. Clim. Dyn. 2003, 20, 537–554. [Google Scholar] [CrossRef]
  61. Kanakidou, M.; Mihalopoulos, N.; Kindap, T.; Im, U.; Vrekoussis, M.; Gerasopoulos, E.; Dermitzaki, E.; Unal, A.; Koçak, M.; Markakis, K.; et al. Megacities as hot spots of air pollution in the East Mediterranean. Atmos. Environ. 2011, 45, 1223–1235. [Google Scholar] [CrossRef]
  62. Giannakopoulos, C.; Psiloglou, B.E. Trends in energy load demand for Athens, Greece: Weather and non-weather related factors. Clim. Res. 2006, 31, 97–108. [Google Scholar] [CrossRef] [Green Version]
  63. Founda, D.; Kazadzis, S.; Mihalopoulos, N.; Gerasopoulos, E.; Lianou, M.; Raptis, P.I. Long-term visibility variation in Athens (1931–2013): A proxy for local and regional atmospheric aerosol loads. Atmos. Chem. Phys. 2016, 16, 11219–11236. [Google Scholar] [CrossRef] [Green Version]
  64. Papanastasiou, D.K.; Melas, D.; Kambezidis, H.D. Air quality and thermal comfort levels under extreme hot weather. Atmos. Res. 2015, 152, 4–13. [Google Scholar] [CrossRef]
  65. Oke, T.R. The Need to Establish Protocols in Urban Heat Island Work. Urban. Scales, Urban Systems and the Urban Heat Island. In Proceedings of the 8th Symposium of the urban Environment, Vancouver, BC, Canada, 10–15 January 2009; Available online: https://ams.confex.com/ams/89annual/techprogram/paper_150552.htm (accessed on 4 February 2020).
  66. Founda, D.; Papadopoulos, K.H.; Petrakis, M.; Giannakopoulos, C.; Good, P. Analysis of mean, maximum, and minimum temperature in Athens from 1897 to 2001 with emphasis on the last decade: Trends, warm events, and cold events. Glob. Planet Chang. 2004, 44, 27–38. [Google Scholar] [CrossRef]
  67. Dosio, A.; Fischer, E.M. Will Half a Degree Make a Difference? Robust Projections of Indices of Mean and Extreme Climate in Europe under 1.5 °C, 2 °C, and 3 °C Global Warming. Geophys. Res. Lett. 2018, 45, 935–944. [Google Scholar] [CrossRef] [Green Version]
  68. Jacob, D.; Petersen, J.; Eggert, B.; Alias, A.; Christensen, O.B.; Bouwer, L.M.; Braun, A.; Colette, A.; Déqué, M.; Georgievski, G.; et al. EURO-CORDEX: New high-resolution climate change projections for European impact research. Reg. Environ. Chang. 2014, 14, 563–578. [Google Scholar] [CrossRef]
  69. IPCC. Climate Change 2013: The Physical Science Basis. In Contribution of Working Group I to the Fifth Assessment Report of the Intergovernmental Panel on Climate Change; Cambridge University Press: Cambridge, UK; New York, NY, USA, 2013; p. 1535. [Google Scholar]
  70. Thomson, A.M.; Calvin, K.V.; Smith, S.J.; Kyle, G.P.; Volke, A.C.; Patel, P.; Delgado-Arias, S.; Bond-Lamberty, B.; Wise, M.A.; Clarke, L.E.; et al. RCP4.5: A pathway for stabilization of radiative forcing by 2100. Clim. Chang. 2011, 109, 77. [Google Scholar] [CrossRef] [Green Version]
  71. van Vuuren, D.P.; Edmonds, J.; Kainuma, M.; Riahi, K.; Thomson, A.; Hibbard, K.; Hurtt, G.C.; Kram, T.; Krey, V.; Lamarque, J.-F.; et al. The representative concentration pathways: An overview. Clim. Chang. 2011, 109, 5–31. [Google Scholar] [CrossRef]
  72. Hausfather, Z.; Peters, G.P. Emissions—The ‘business as usual’ story is misleading. Nature 2020, 577, 618–620. [Google Scholar] [CrossRef] [PubMed]
  73. Gutiérrez, J.M.; Maraun, D.; Widmann, M.; Huth, R.; Hertig, E.; Benestad, R.; Rössler, O.; Wibig, J.; Wilcke, R.; Kotlarski, S.; et al. An intercomparison of a large ensemble of statistical downscaling methods over Europe: Results from the VALUE perfect predictor cross-validation experiment. Int. J. Climatol. 2019, 39, 3750–3785. [Google Scholar] [CrossRef]
  74. Iturbide, M.; Bedia, J.; Herrera, S.; Baño-Medina, J.; Fernández, J.; Frías, M.D.; Manzanas, R.; San-Martín, D.; Cimadevilla, E.; Cofiño, A.S.; et al. The R-based climate4R open framework for reproducible climate data access and post-processing. Environ. Model. Softw. 2019, 111, 42–54. [Google Scholar] [CrossRef]
  75. Ito, R.; Shiogama, H.; Nakaegawa, T.; Takayabu, I. Uncertainties in climate change projections covered by the ISIMIP and CORDEX model subsets from CMIP5. Geosci. Model. Dev. 2020, 13, 859–872. [Google Scholar] [CrossRef] [Green Version]
  76. Tebaldi, C.; Arblaster, J.M.; Knutti, R. Mapping model agreement on future climate projections. Geophys. Res. Lett. 2011, 38, L23701. [Google Scholar] [CrossRef]
  77. Giannakopoulos, C.; Kostopoulou, E.; Varotsos, K.V.; Tziotziou, K.; Plitharas, A. An integrated assessment of climate change impacts for Greece in the near future. Reg. Environ. Chang. 2011, 11, 829–843. [Google Scholar] [CrossRef] [Green Version]
  78. Varotsos, K.V.; Giannakopoulos, C.; Tombrou, M. Ozone-temperature relationship during the 2003 and 2014 heatwaves in Europe. Reg. Environ. Chang. 2019, 19, 1653–1665. [Google Scholar] [CrossRef]
  79. Lelieveld, J.; Klingmueller, K.; Pozzer, A.; Pöschl, U.; Fnais, M.; Daiber, A.; Münzel, T. Cardiovascular disease burden from ambient air pollution in Europe reassessed using novel hazard ratio functions. Eur. Heart J. 2019, 40, 1590–1596. [Google Scholar] [CrossRef] [PubMed] [Green Version]
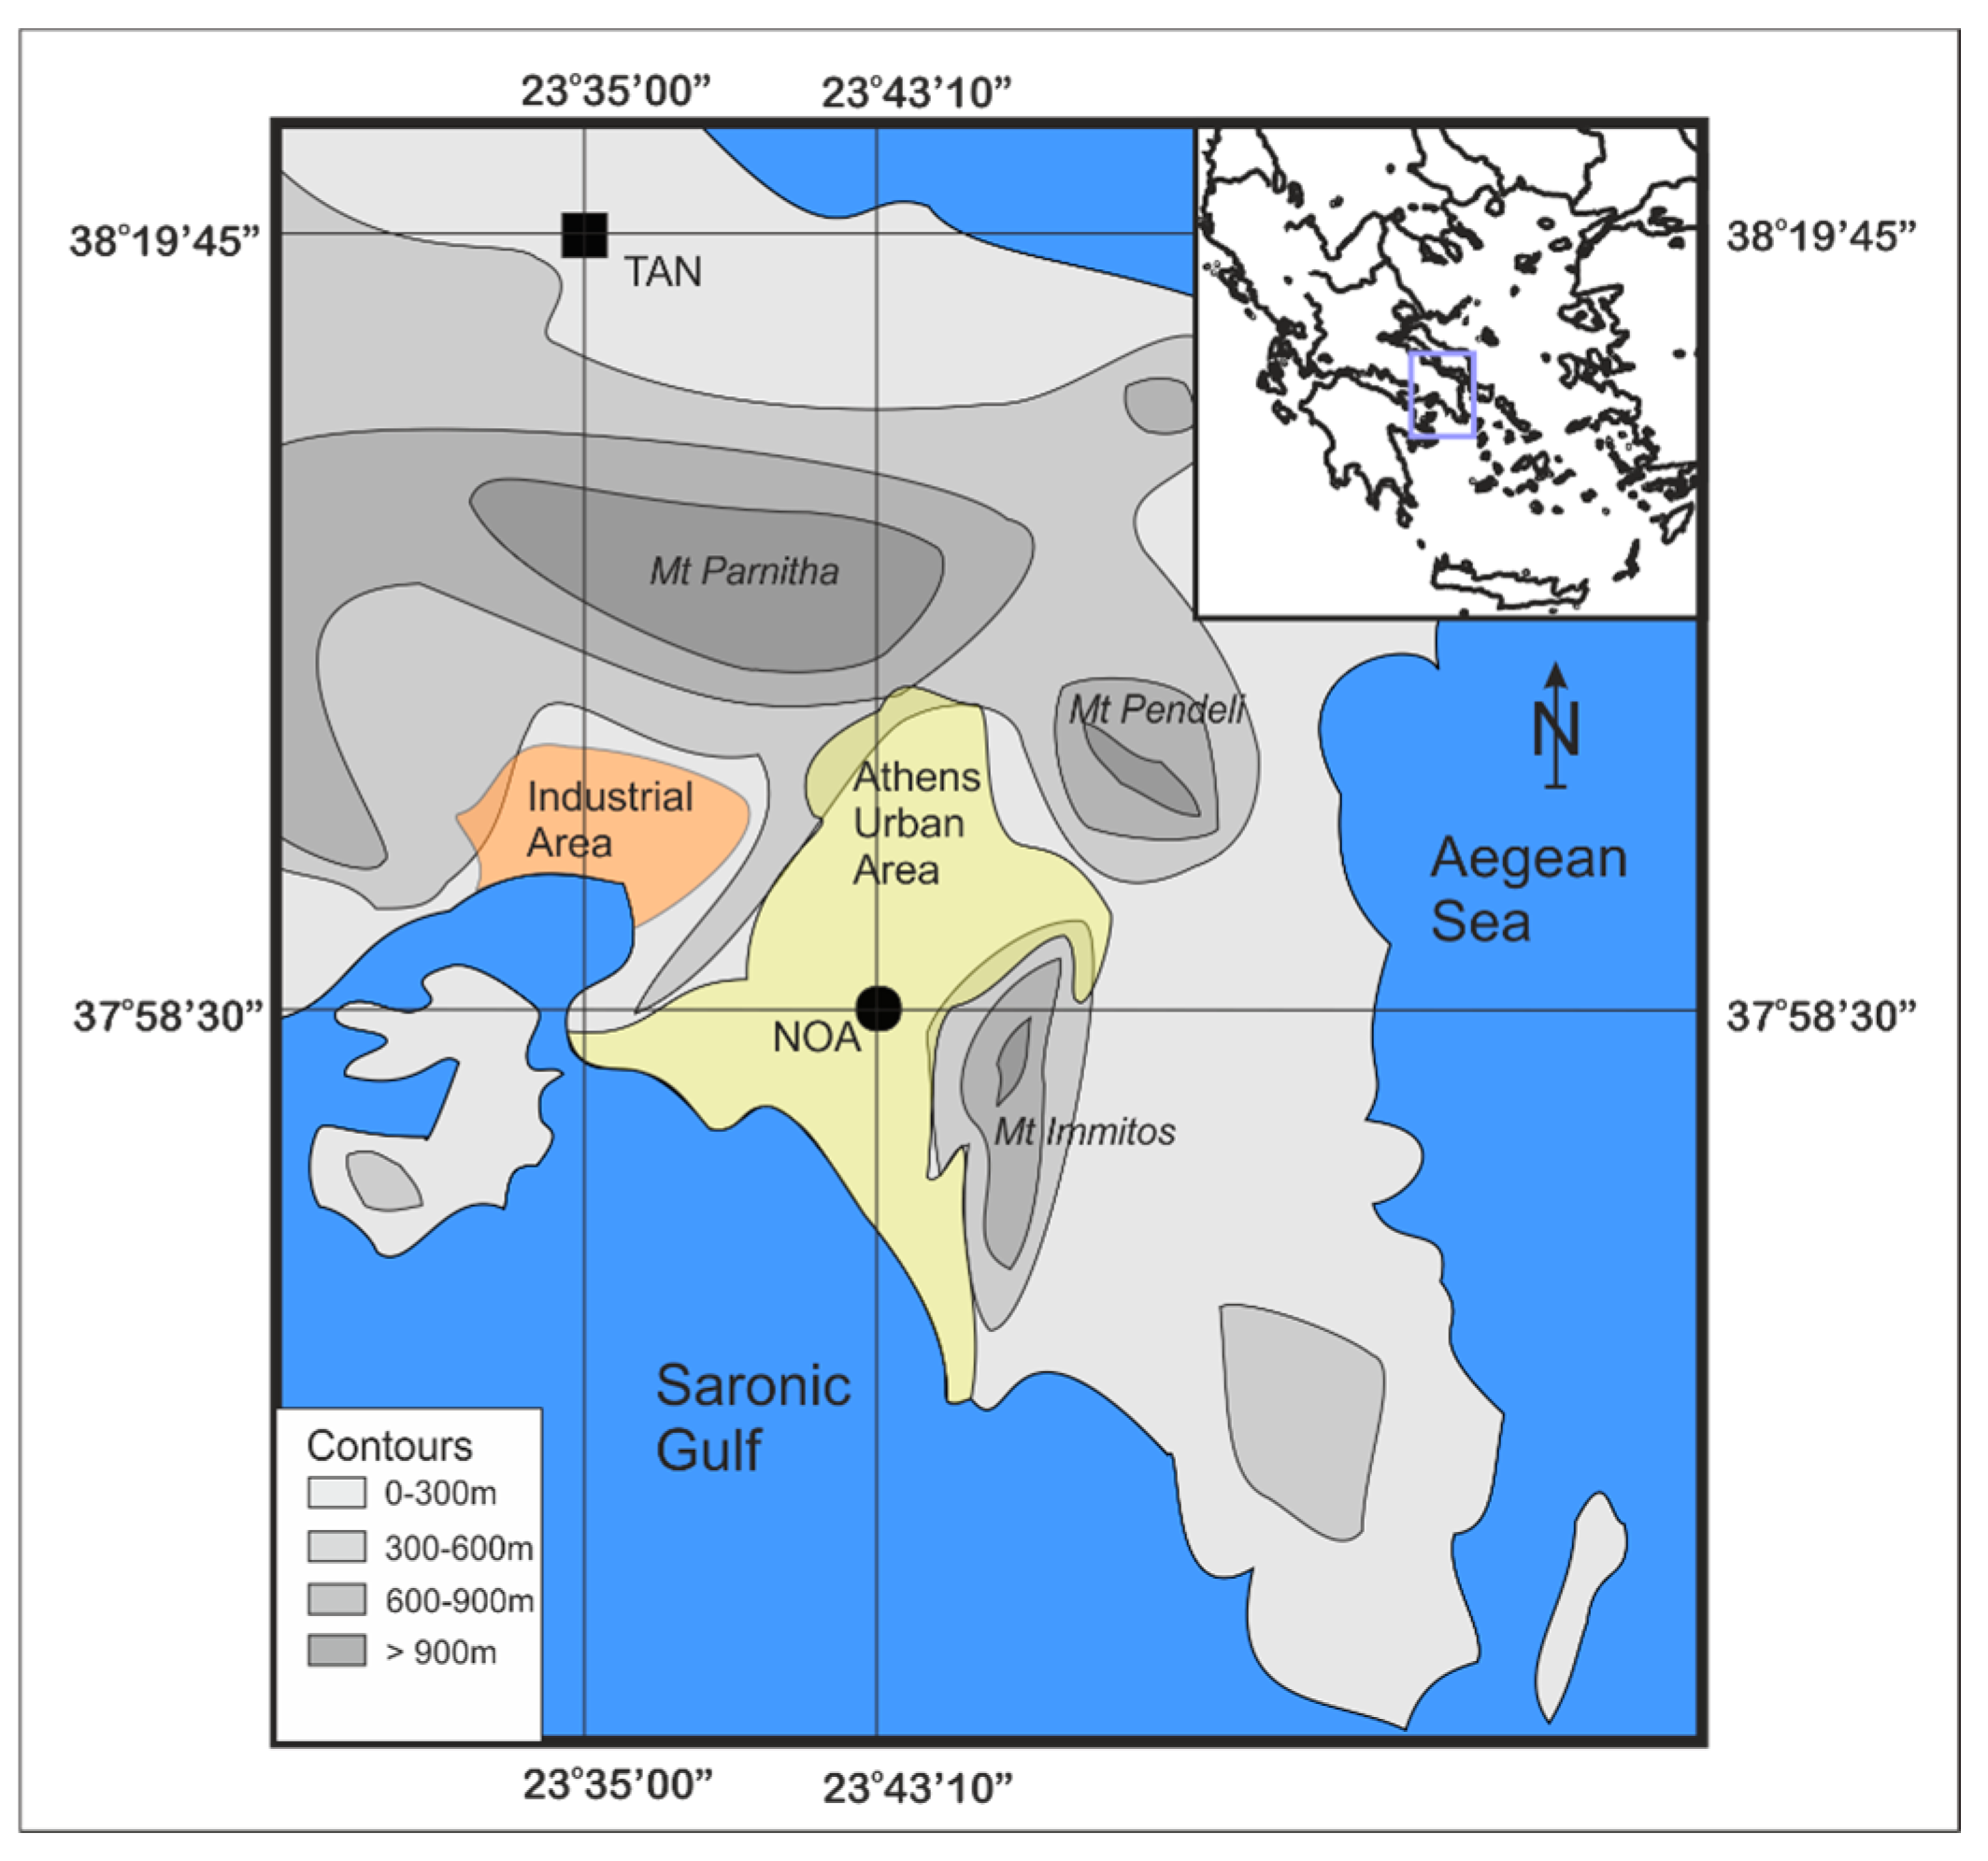
Figure 1. Location map of the greater Athens area. The urban meteorological station of Athens (NOA; operated by the National Observatory of Athens) and rural station of Tanagra (TAN; operated by the National Hellenic Meteorological Service) are indicated.
Atmosphere 11 00637 g001
Figure 2. Seasonally averaged maximum temperatures (Tmax) for the two reference periods (1976–1995 and 1996–2015) at the meteorological stations of NOA (urban) and TAN (rural). Bootstrap analyses show that only summer (JJA) Tmax values are statistically significantly different between the reference periods at the respective stations. Abbreviations: winter (DJF), spring (MAM), summer (JJA), autumn (SON).
Atmosphere 11 00637 g002
Figure 3. Seasonally averaged minimum temperatures (Tmin) for the two reference periods (1976–1995 and 1996–2015) at the meteorological stations of NOA (urban) and TAN (rural). Bootstrap analyses show that spring (MAM), summer (JJA), and autumn (SON) Tmin values are statistically significantly different between the reference periods at the respective stations.
Atmosphere 11 00637 g003
Figure 4. Annual frequency of extremely hot conditions, respectively number of days with Tmax > 37 °C (SU37) and number of days with Tmin > 26 °C (TR26), for the two reference periods (1976–1995 and 1996–2015) at the meteorological stations of NOA (urban) and TAN (rural).
Atmosphere 11 00637 g004
Figure 5. (ad): Statistically significant changes in future seasonal maximum temperatures, compared to the respective reference periods (see Figure 2), at the sites of NOA (urban) and TAN (rural). Values represent the mean change with the respective confidence range. Squares left blank indicate no statistically significant difference. The near and distant future periods (2046–2065 and 2076–2095) have each been compared to the first and second reference periods (1976–1995 and 1996–2015).
Atmosphere 11 00637 g005
Figure 6. (ad): Statistically significant changes in future seasonal minimum temperatures, compared to the respective reference periods (see Figure 3), at the sites of NOA (urban) and TAN (rural). Values represent the mean change with the respective confidence range. Squares left blank indicate no statistically significant difference. The near and distant future periods (2046–2065 and 2076–2095) are each compared to the first and second reference periods (1976–1995 and 1996–2015).
Atmosphere 11 00637 g006
Figure 7. (af): Summer averaged maximum temperatures (Tmax) and UHImax (ΔTmax) for the near and distant future periods (2046–2065 and 2076–2095) under climate scenarios RCP2.6, RCP4.5, and RCP8.5. For each period and scenario, simulations NOA (1)/TAN (1) are calibrated against the first reference period (1976–1995) under UHI regime UHI_1 and simulations NOA (2)/TAN (2) are calibrated against the second reference period (1996–2015) under UHI regime UHI_2. Averaged mean change with respective confidence interval is given in the figures for each projection.
Atmosphere 11 00637 g007aAtmosphere 11 00637 g007b
Figure 8. (af): Summer averaged minimum temperatures (Tmin) and UHImin (ΔTmin) for the near and distant future periods (2046–2065 and 2076–2095) under climate scenarios RCP2.6, RCP4.5, and RCP8.5. For each period and scenario, simulations NOA (1)/TAN (1) are calibrated against the first reference period (1976–1995) under UHI regime UHI_1 and simulations NOA (2)/TAN (2) are calibrated against the second reference period (1996–2015) under UHI regime UHI_2. Averaged mean change with respective confidence interval is given in the figures for each projection.
Atmosphere 11 00637 g008aAtmosphere 11 00637 g008b
Figure 9. (af): Annual frequency of extremely hot nights (Tmin > 26 °C) for the near and distant future periods (2046–2065 and 2076–2095) under climate scenarios RCP2.6, RCP4.5, and RCP8.5. For each period and scenario, simulations NOA (1)/TAN (1) are calibrated against the first reference period (1976–1995) under UHI regime UHI_1 and simulations NOA (2)/TAN (2) are calibrated against the second reference period (1996–2015) under UHI regime UHI_2. Averaged mean change in the frequency with respective confidence interval is given in the figures for each projection.
Atmosphere 11 00637 g009
Figure 10. (af): Annual frequency of extremely hot days (Tmax > 37 °C) for the near and distant future periods (2046–2065 and 2076–2095) under climate scenarios RCP2.6, RCP4.5, and RCP8.5. For each period and scenario, simulations NOA (1)/TAN (1) are calibrated against the first reference period (1976–1995) under UHI regime UHI_1 and simulations NOA (2)/TAN (2) are calibrated against the second reference period (1996–2015) under UHI regime UHI_2. Averaged mean change in the frequency with respective confidence interval is given in the figures for each projection.
Atmosphere 11 00637 g010
Table 1. List of regional climate models (RCMs) and global climate models (GCMs) used in this study. The five simulations of this paper use the KNMI (SMHI) regional climate model with boundary conditions from two (three) different global models, which make the combined modeling systems substantially diverse so as to be considered as different models.
InstituteRCMGCM
KNMIRACMO22EICHEC-EC-EARTH HadGEM2-ES
SMHIRCA4ICHEC-EC-EARTH HadGEM2-ES MPI-M-MPI-ESM-LR
Table 2. Athens seasonally averaged urban heat island (UHI) intensity for Tmax and Tmin, calculated from the difference in temperature (ΔT) between the meteorological stations of NOA (urban) and TAN (rural), for the periods 1976–1995 and 1996–2015. See Figure 2 and Figure 3 for the seasonally averaged maximum and minimum temperatures of the two reference periods.
ΔTmax (1976–1995)ΔTmax (1996–2015)ΔTmin (1976–1995)ΔTmin (1996–2015)
DJF1.51.73.13.2
MAM1.41.84.13.9
JJA1.11.94.24.4
SON1.51.73.43.5