Investigation of Aerosol Climatology, Optical Characteristics and Variability over Egypt Based on Satellite Observations and In-Situ Measurements

 ,
,
Abstract
:1. Introduction
2. Study Area, Materials and Methods
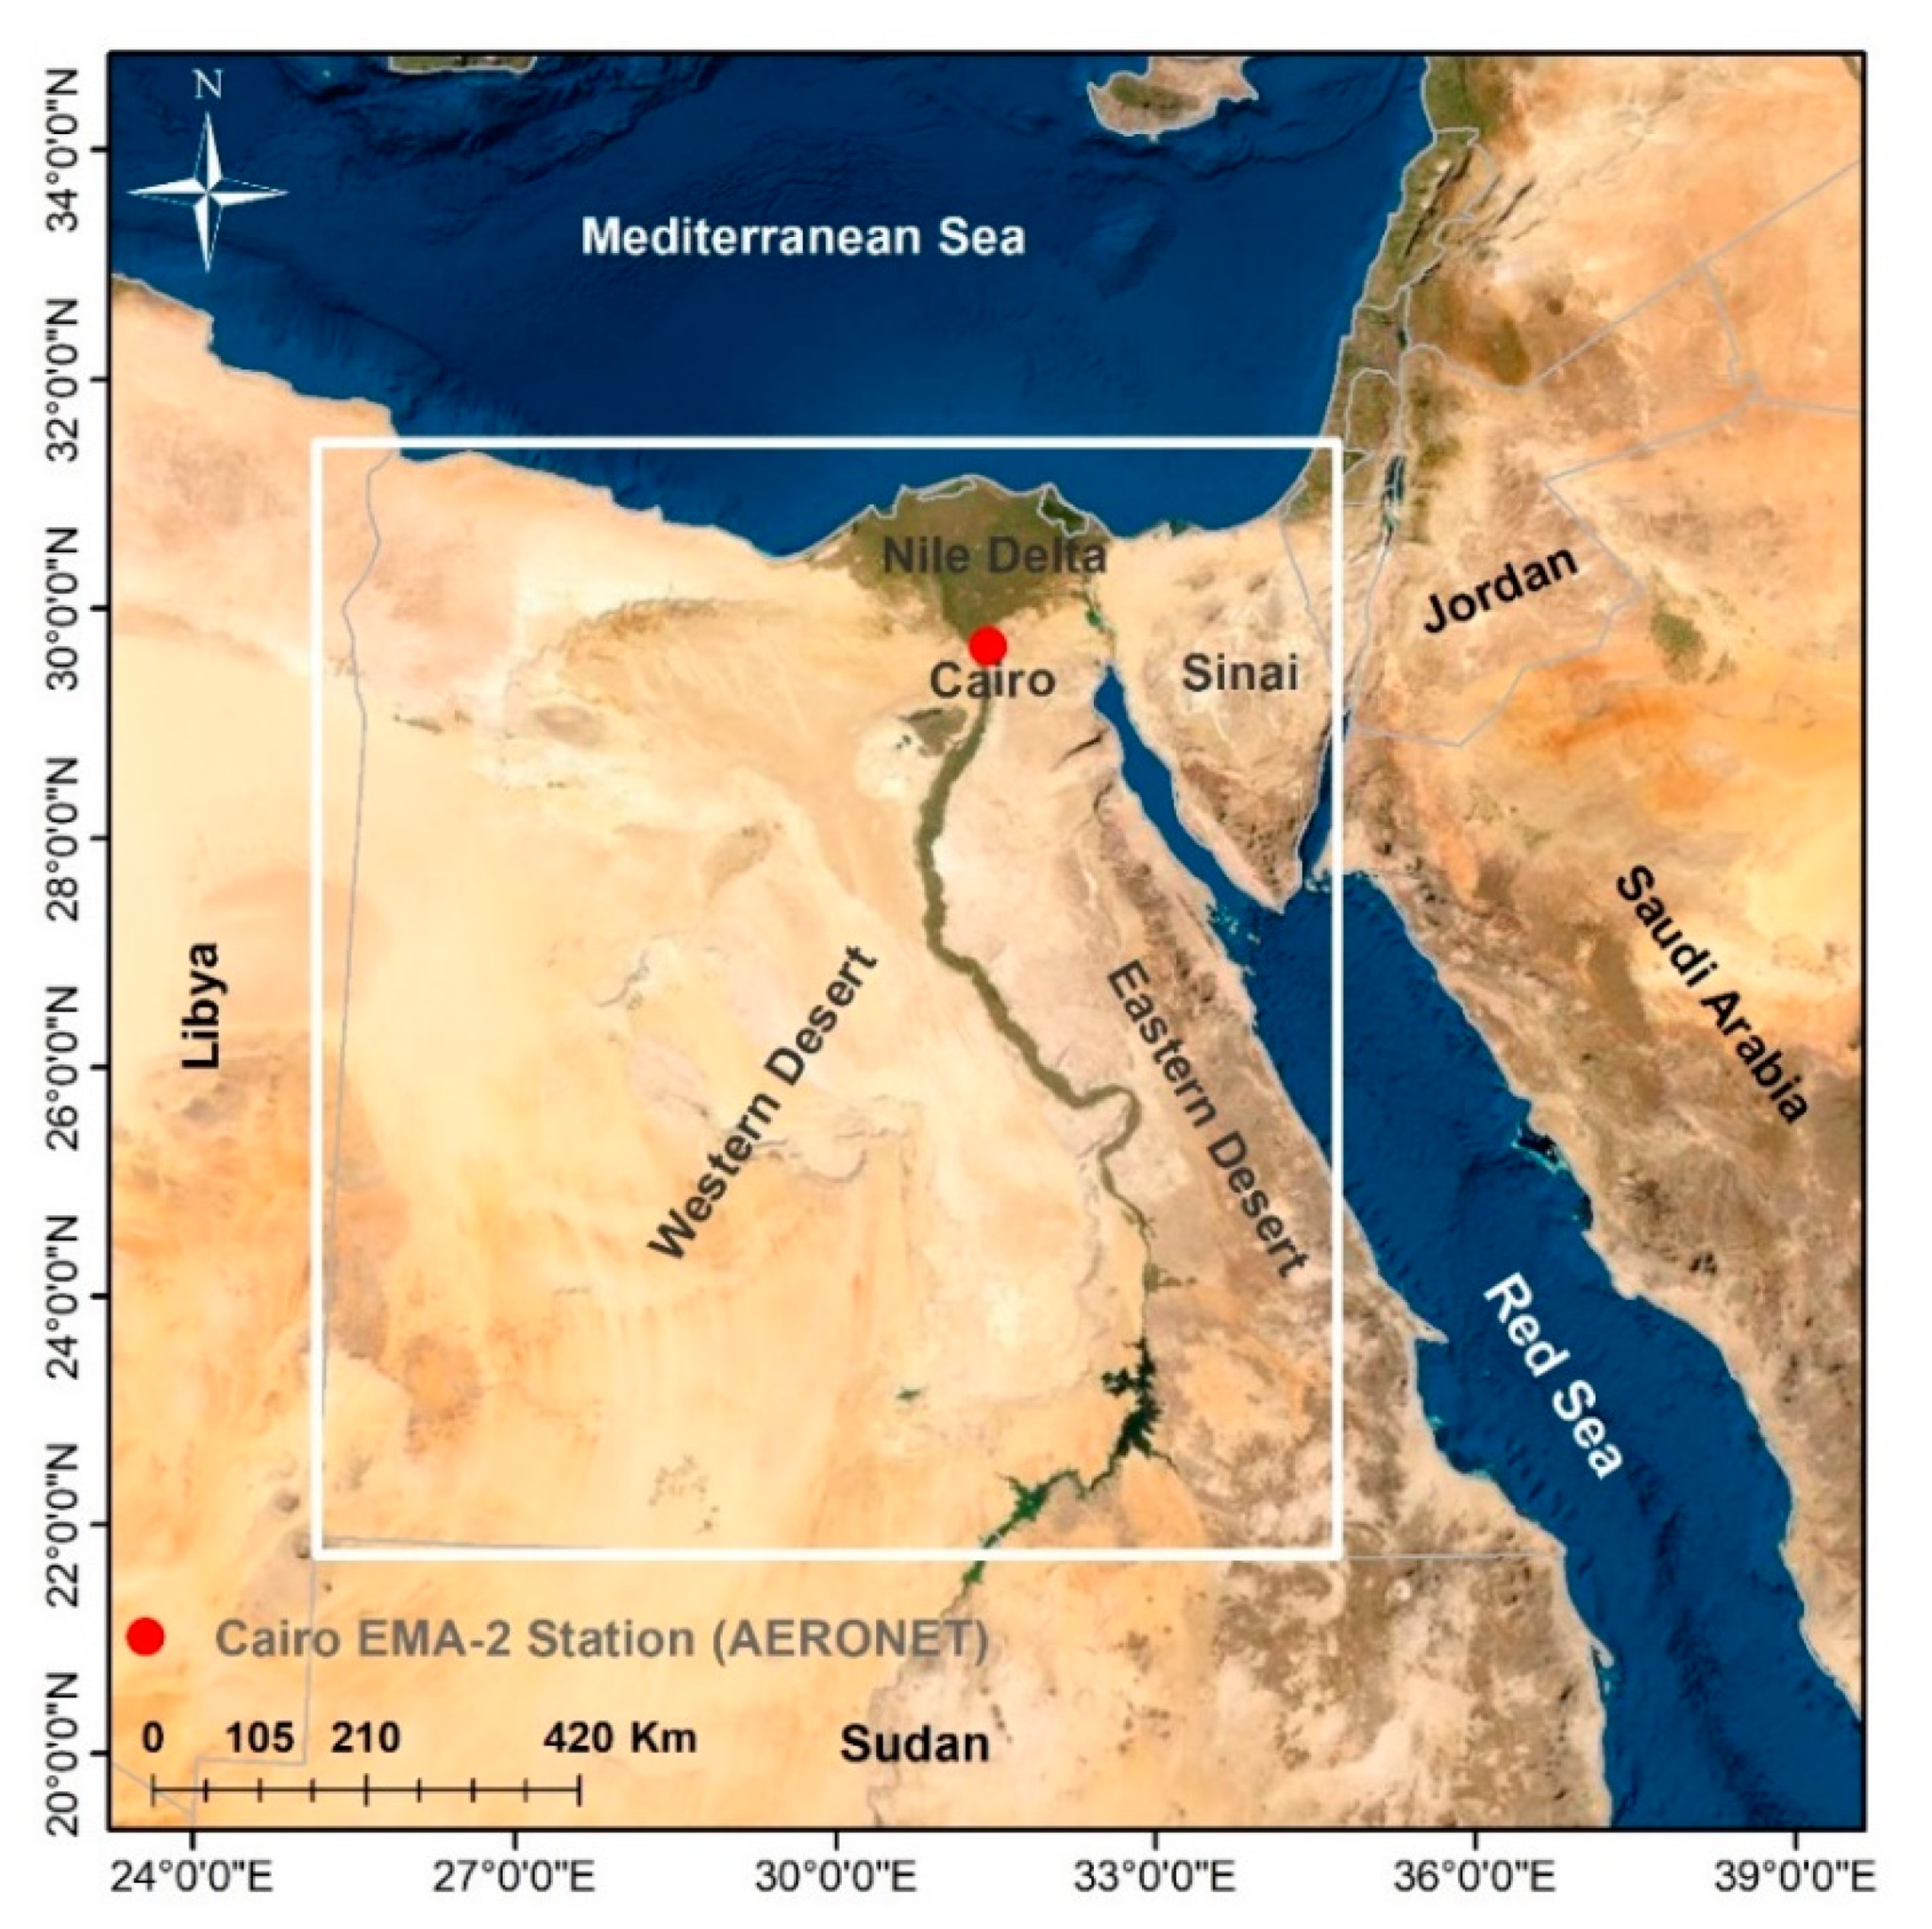
2.1. Study Area Description
2.2. Data Set and Analysis Methods
3. Results
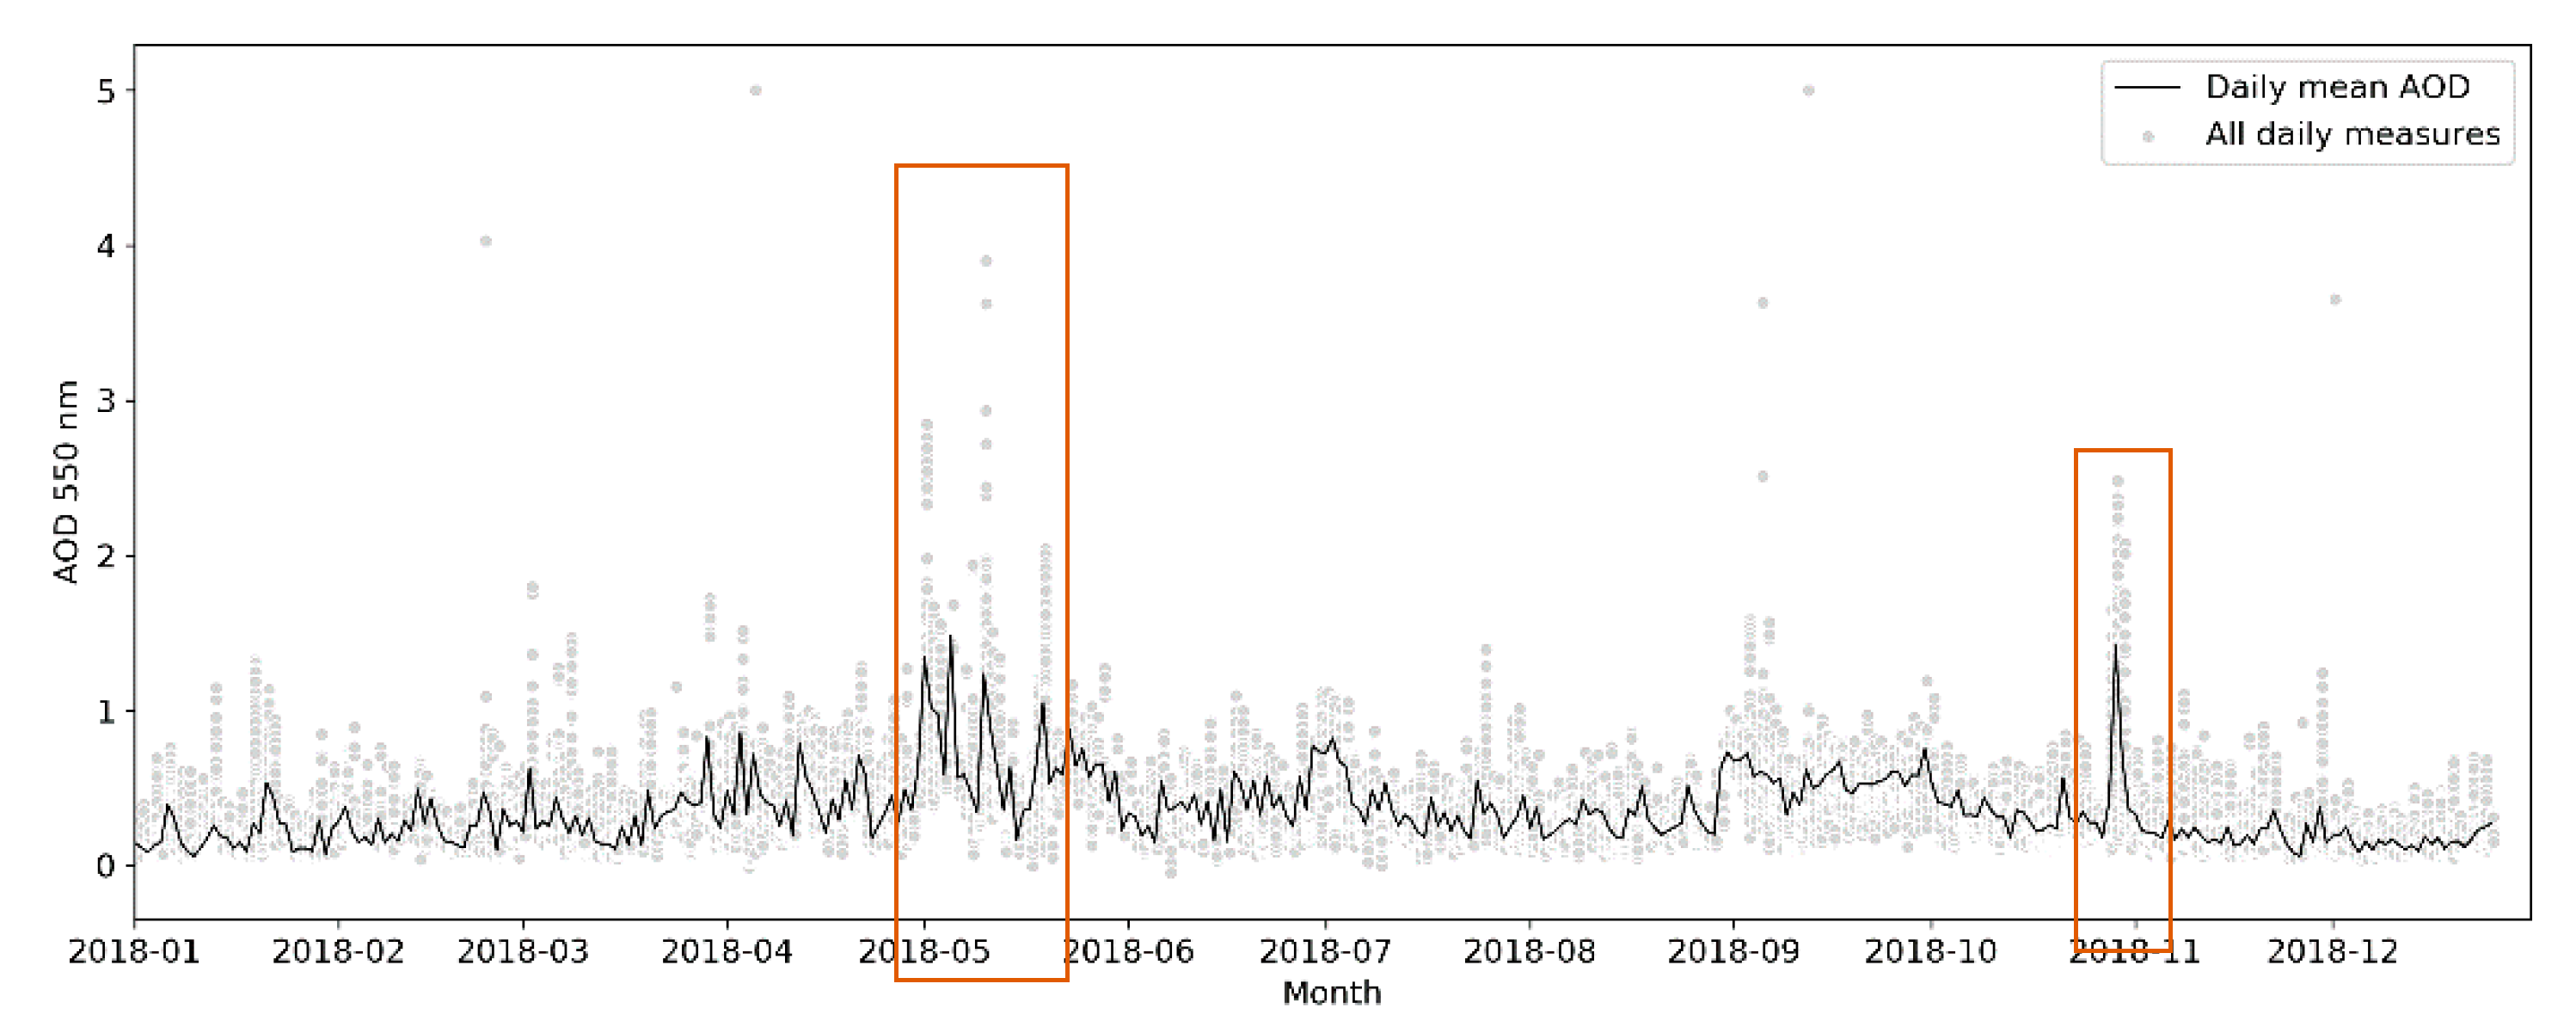
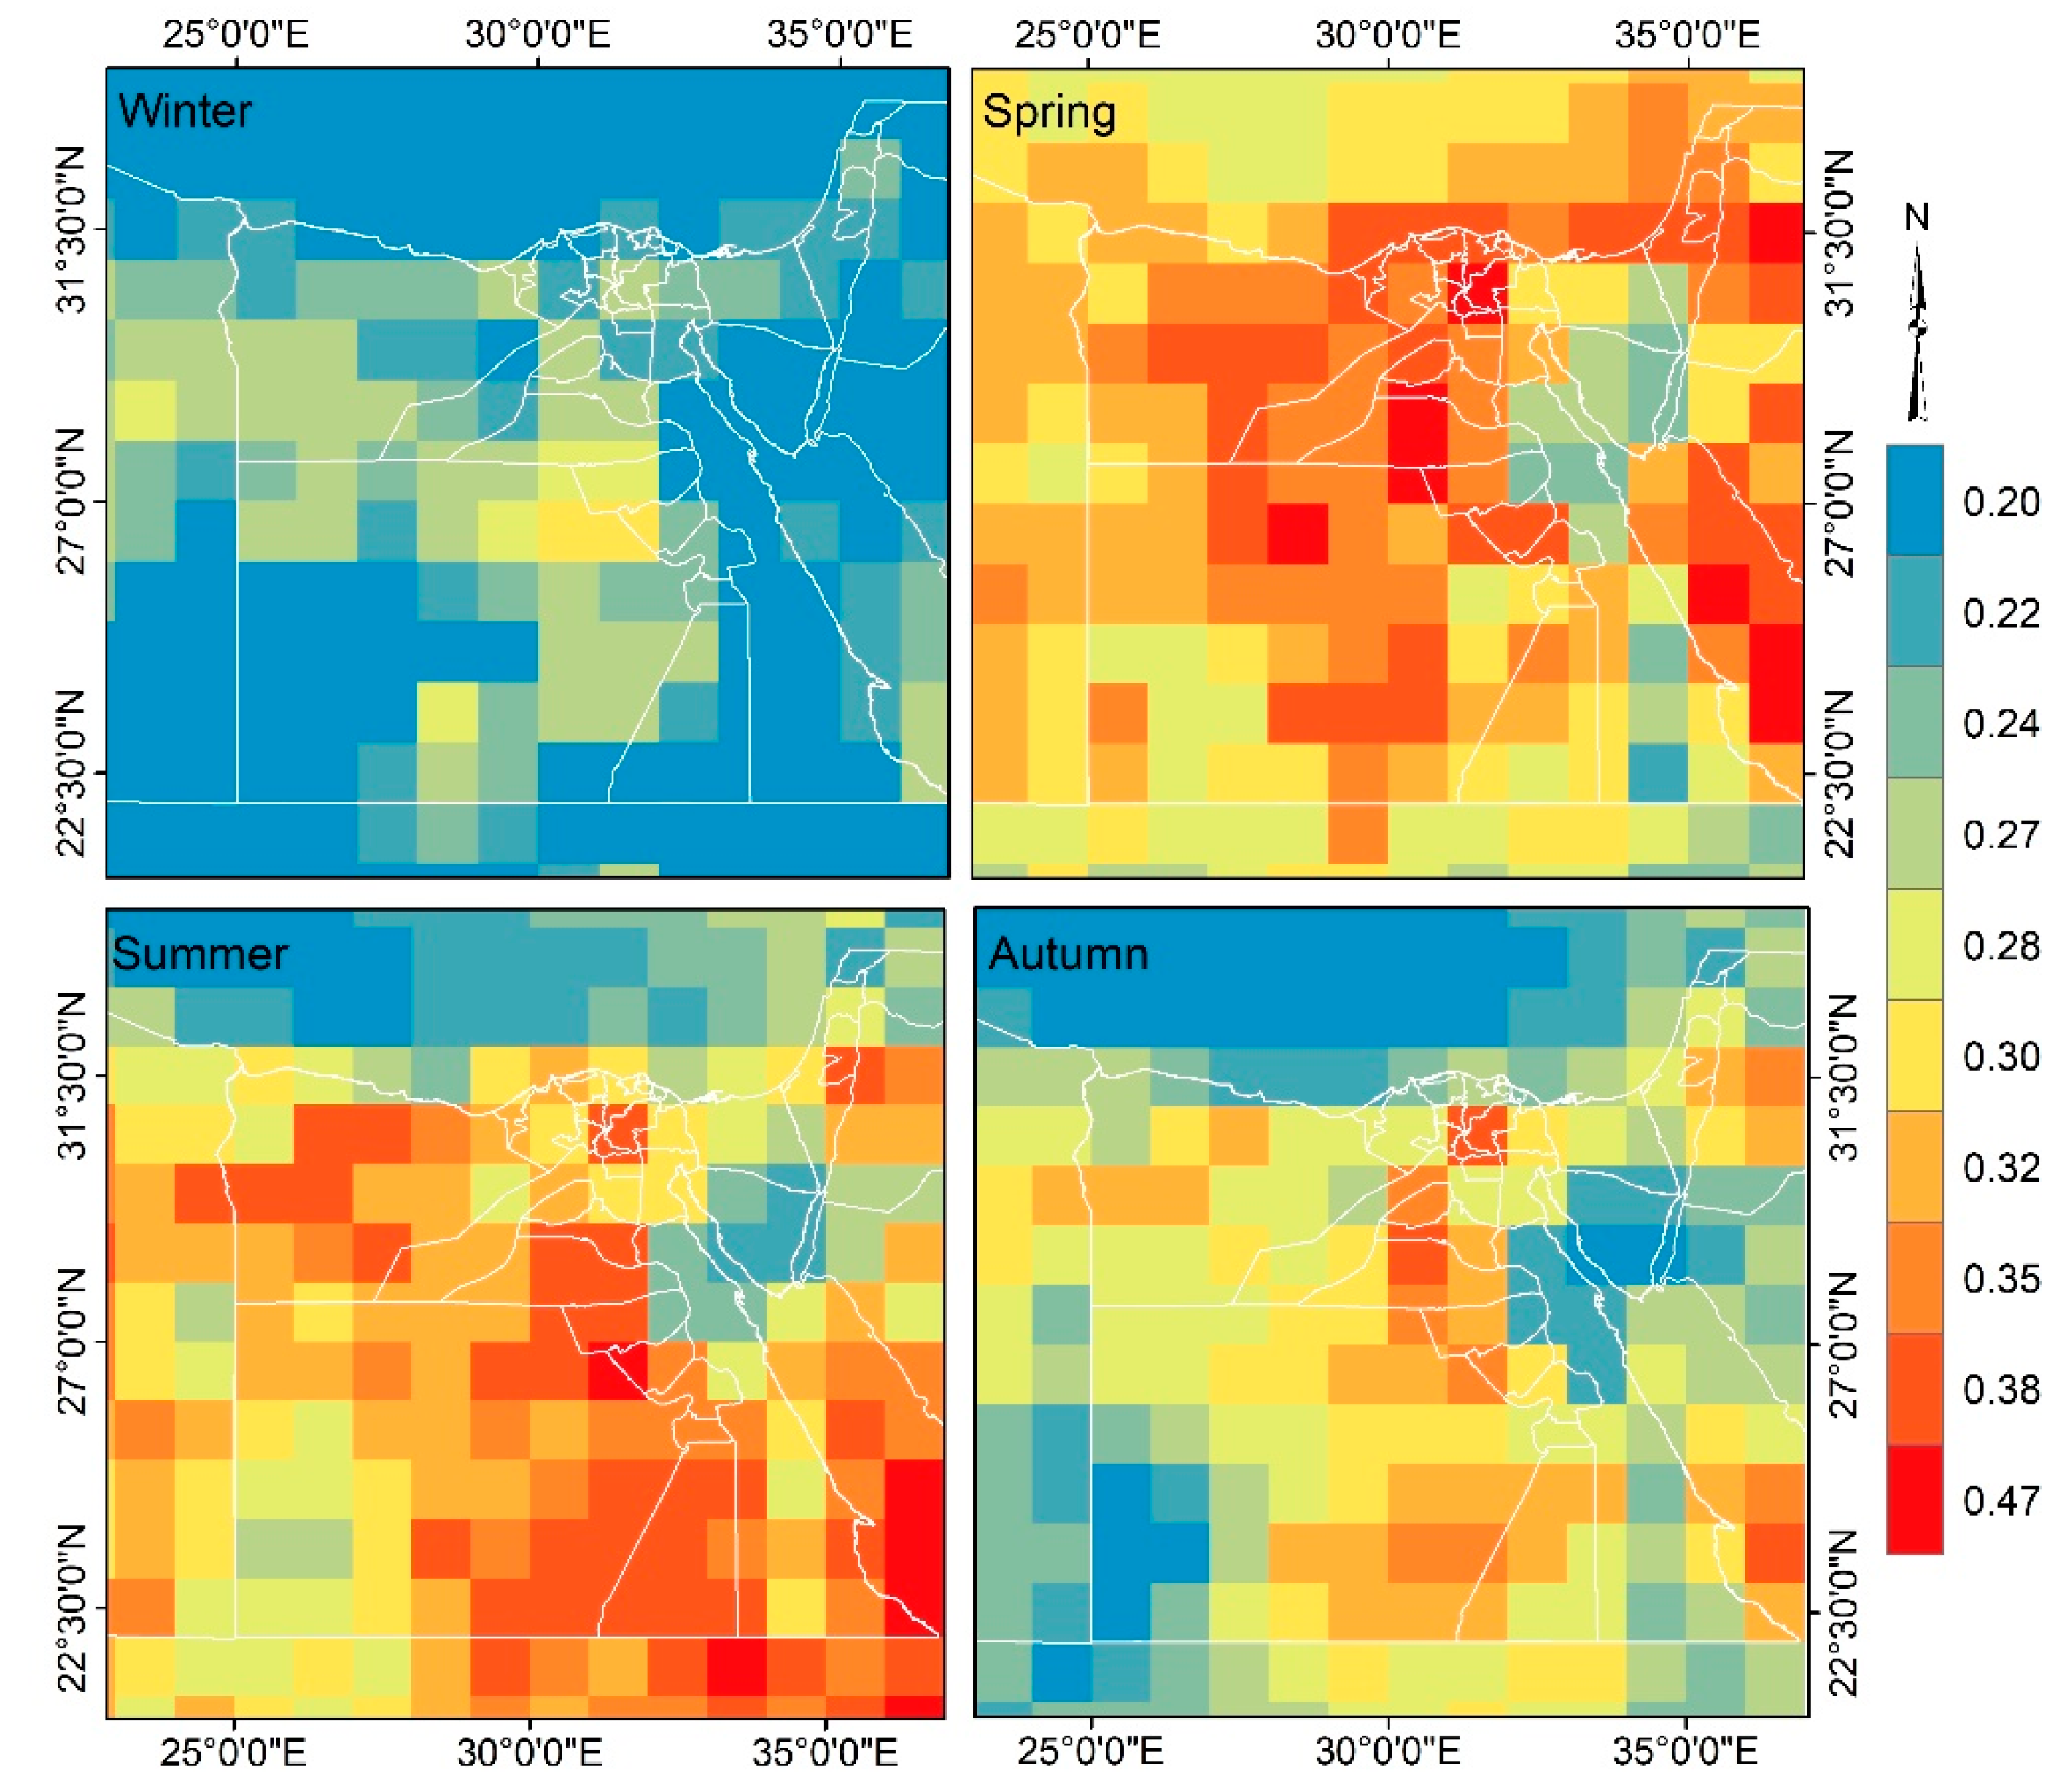
3.1. Variations in MODIS AOD
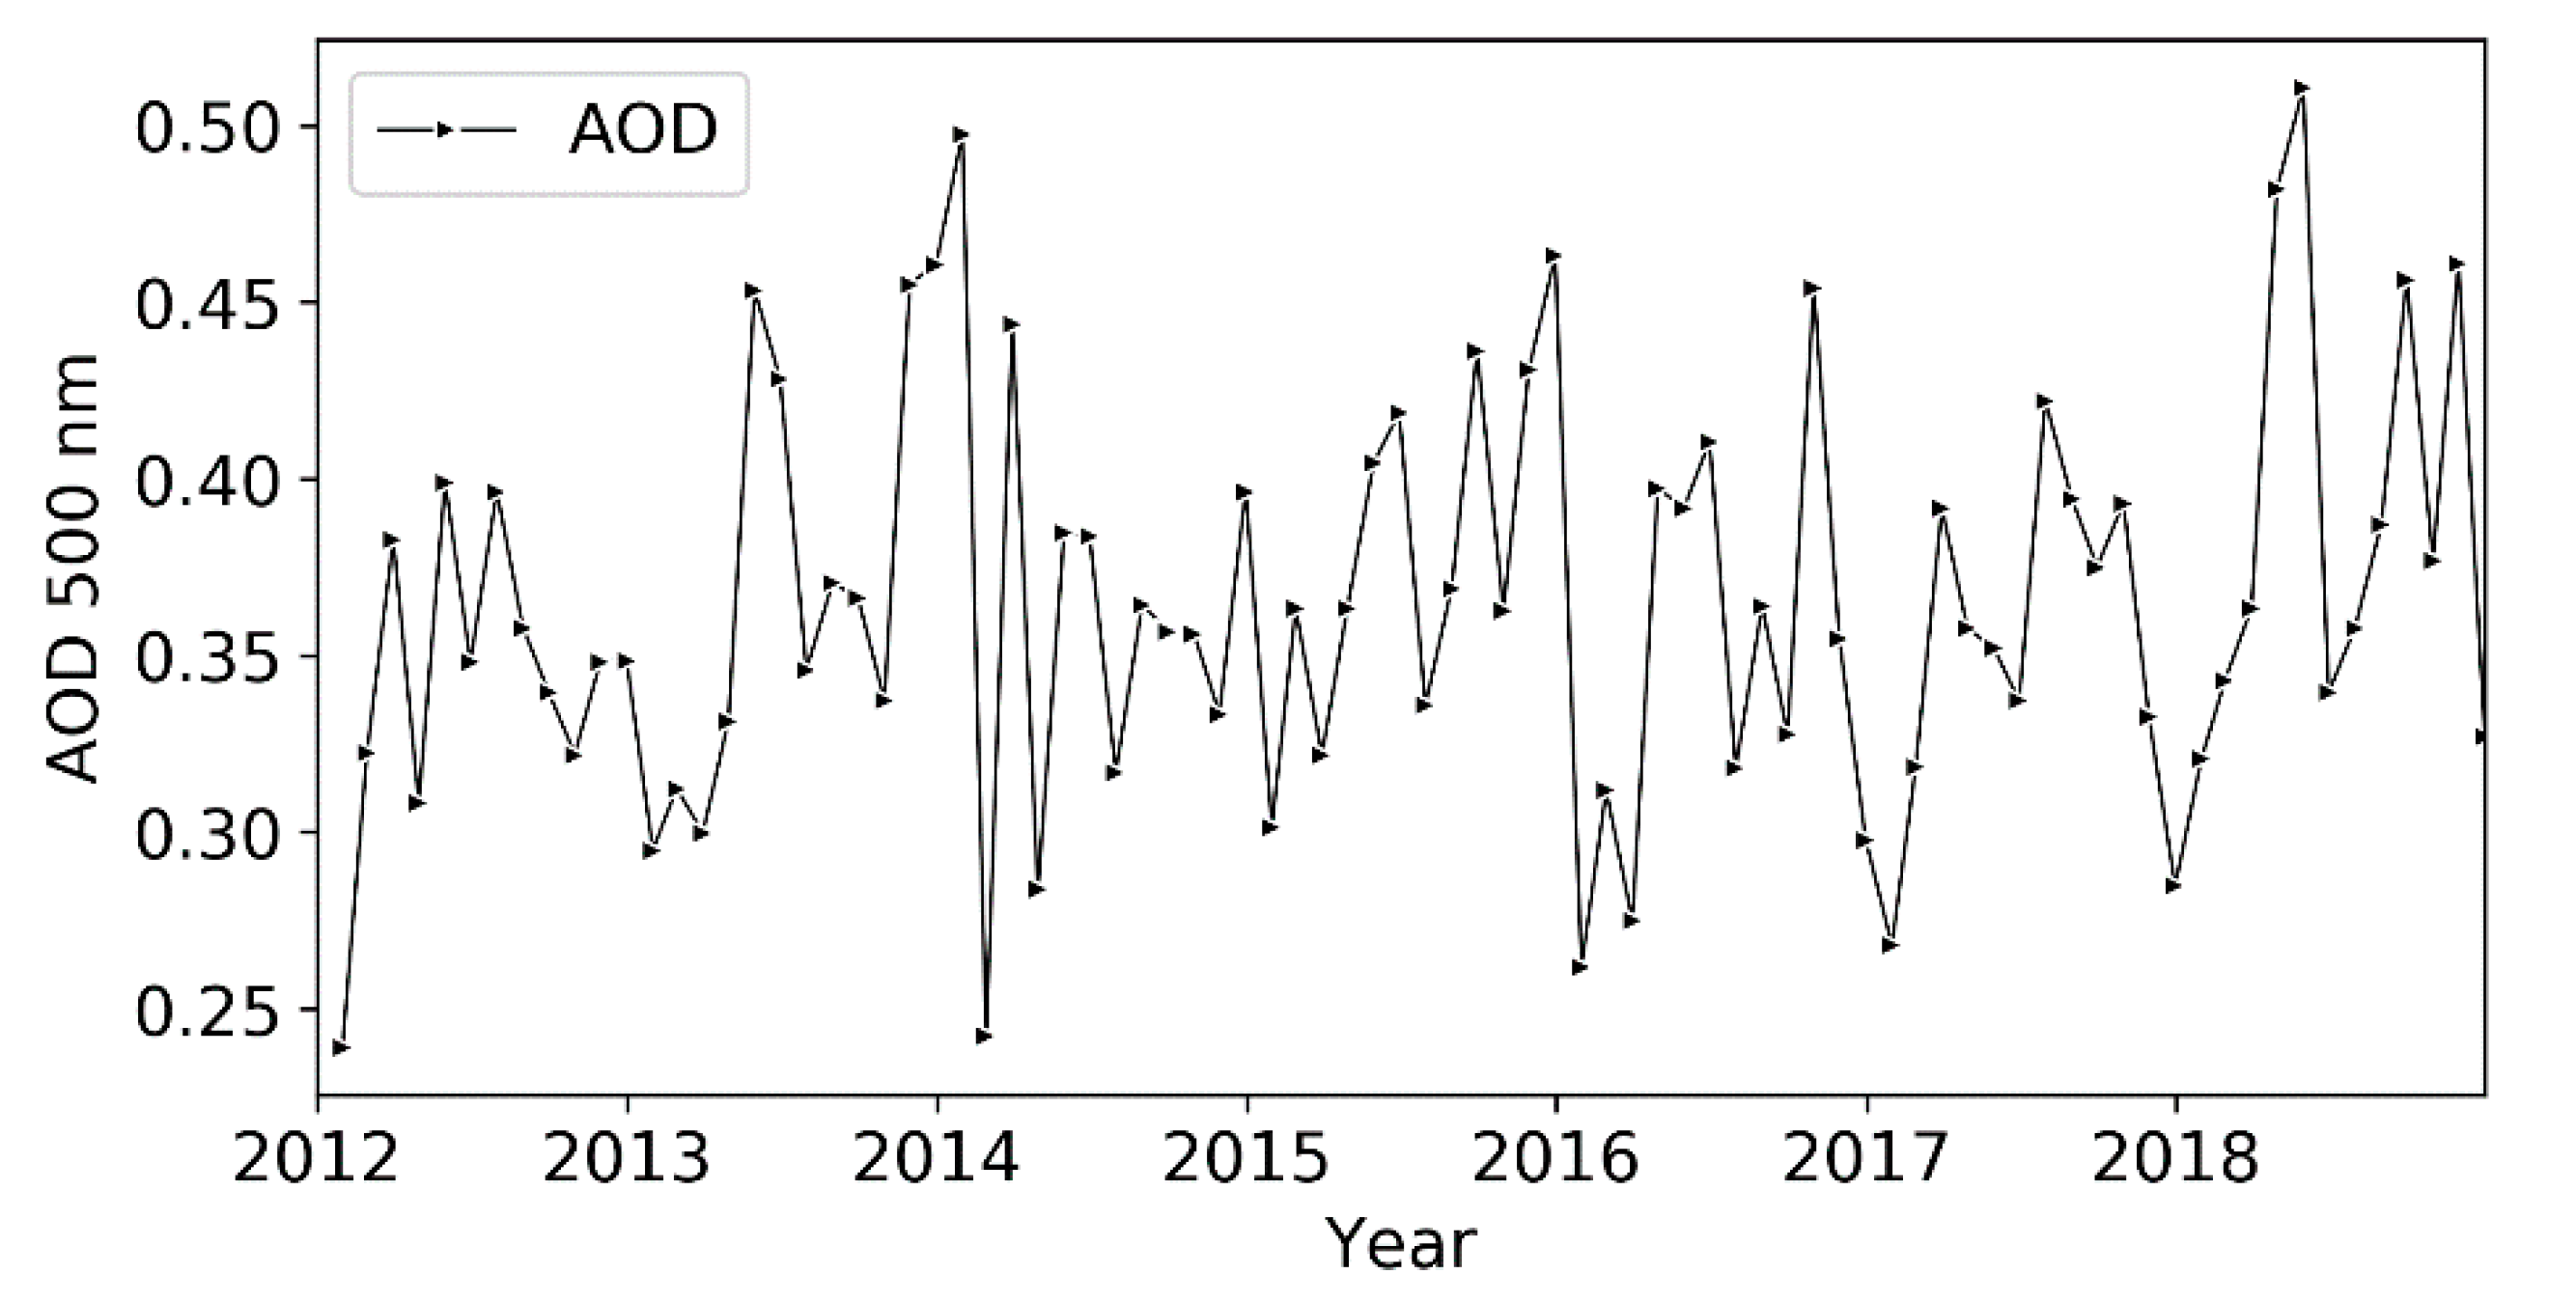
3.2. AERONET
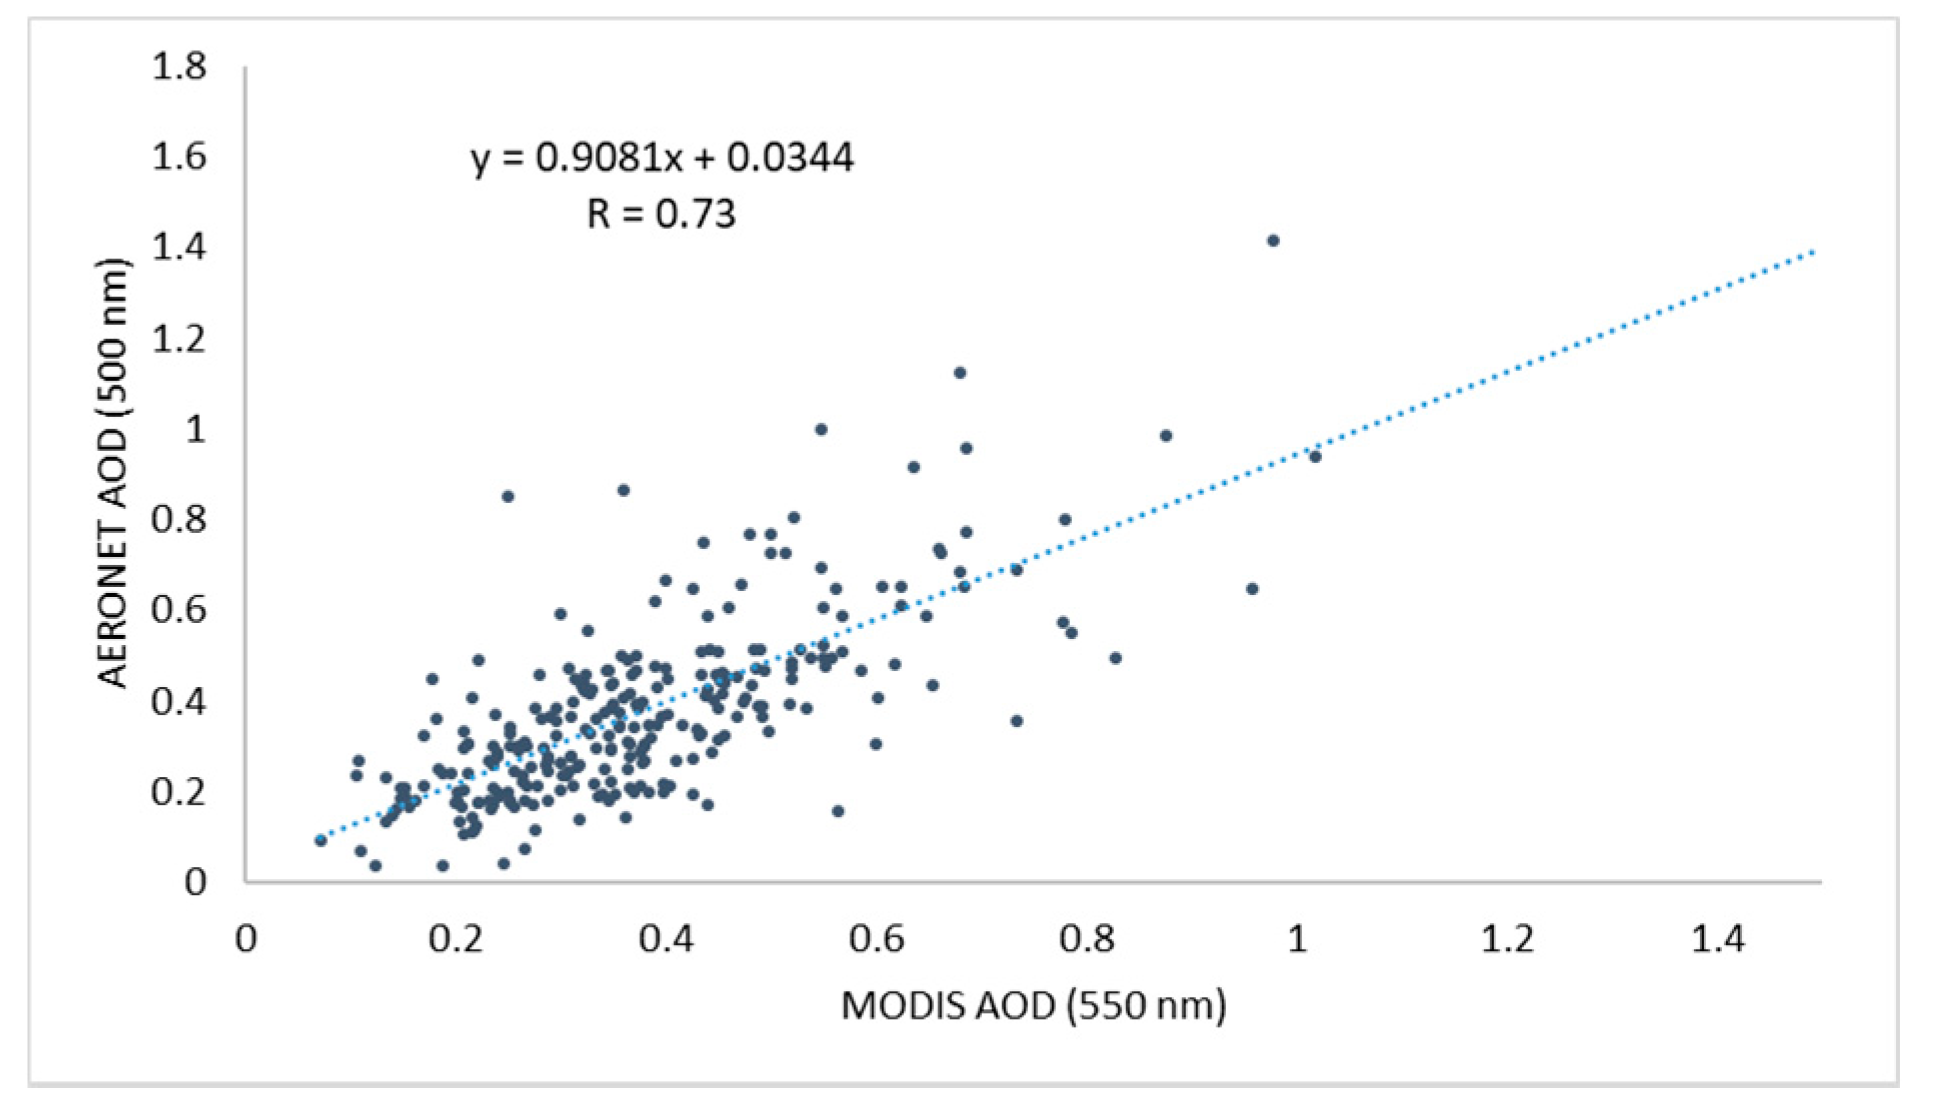
3.3. Validation
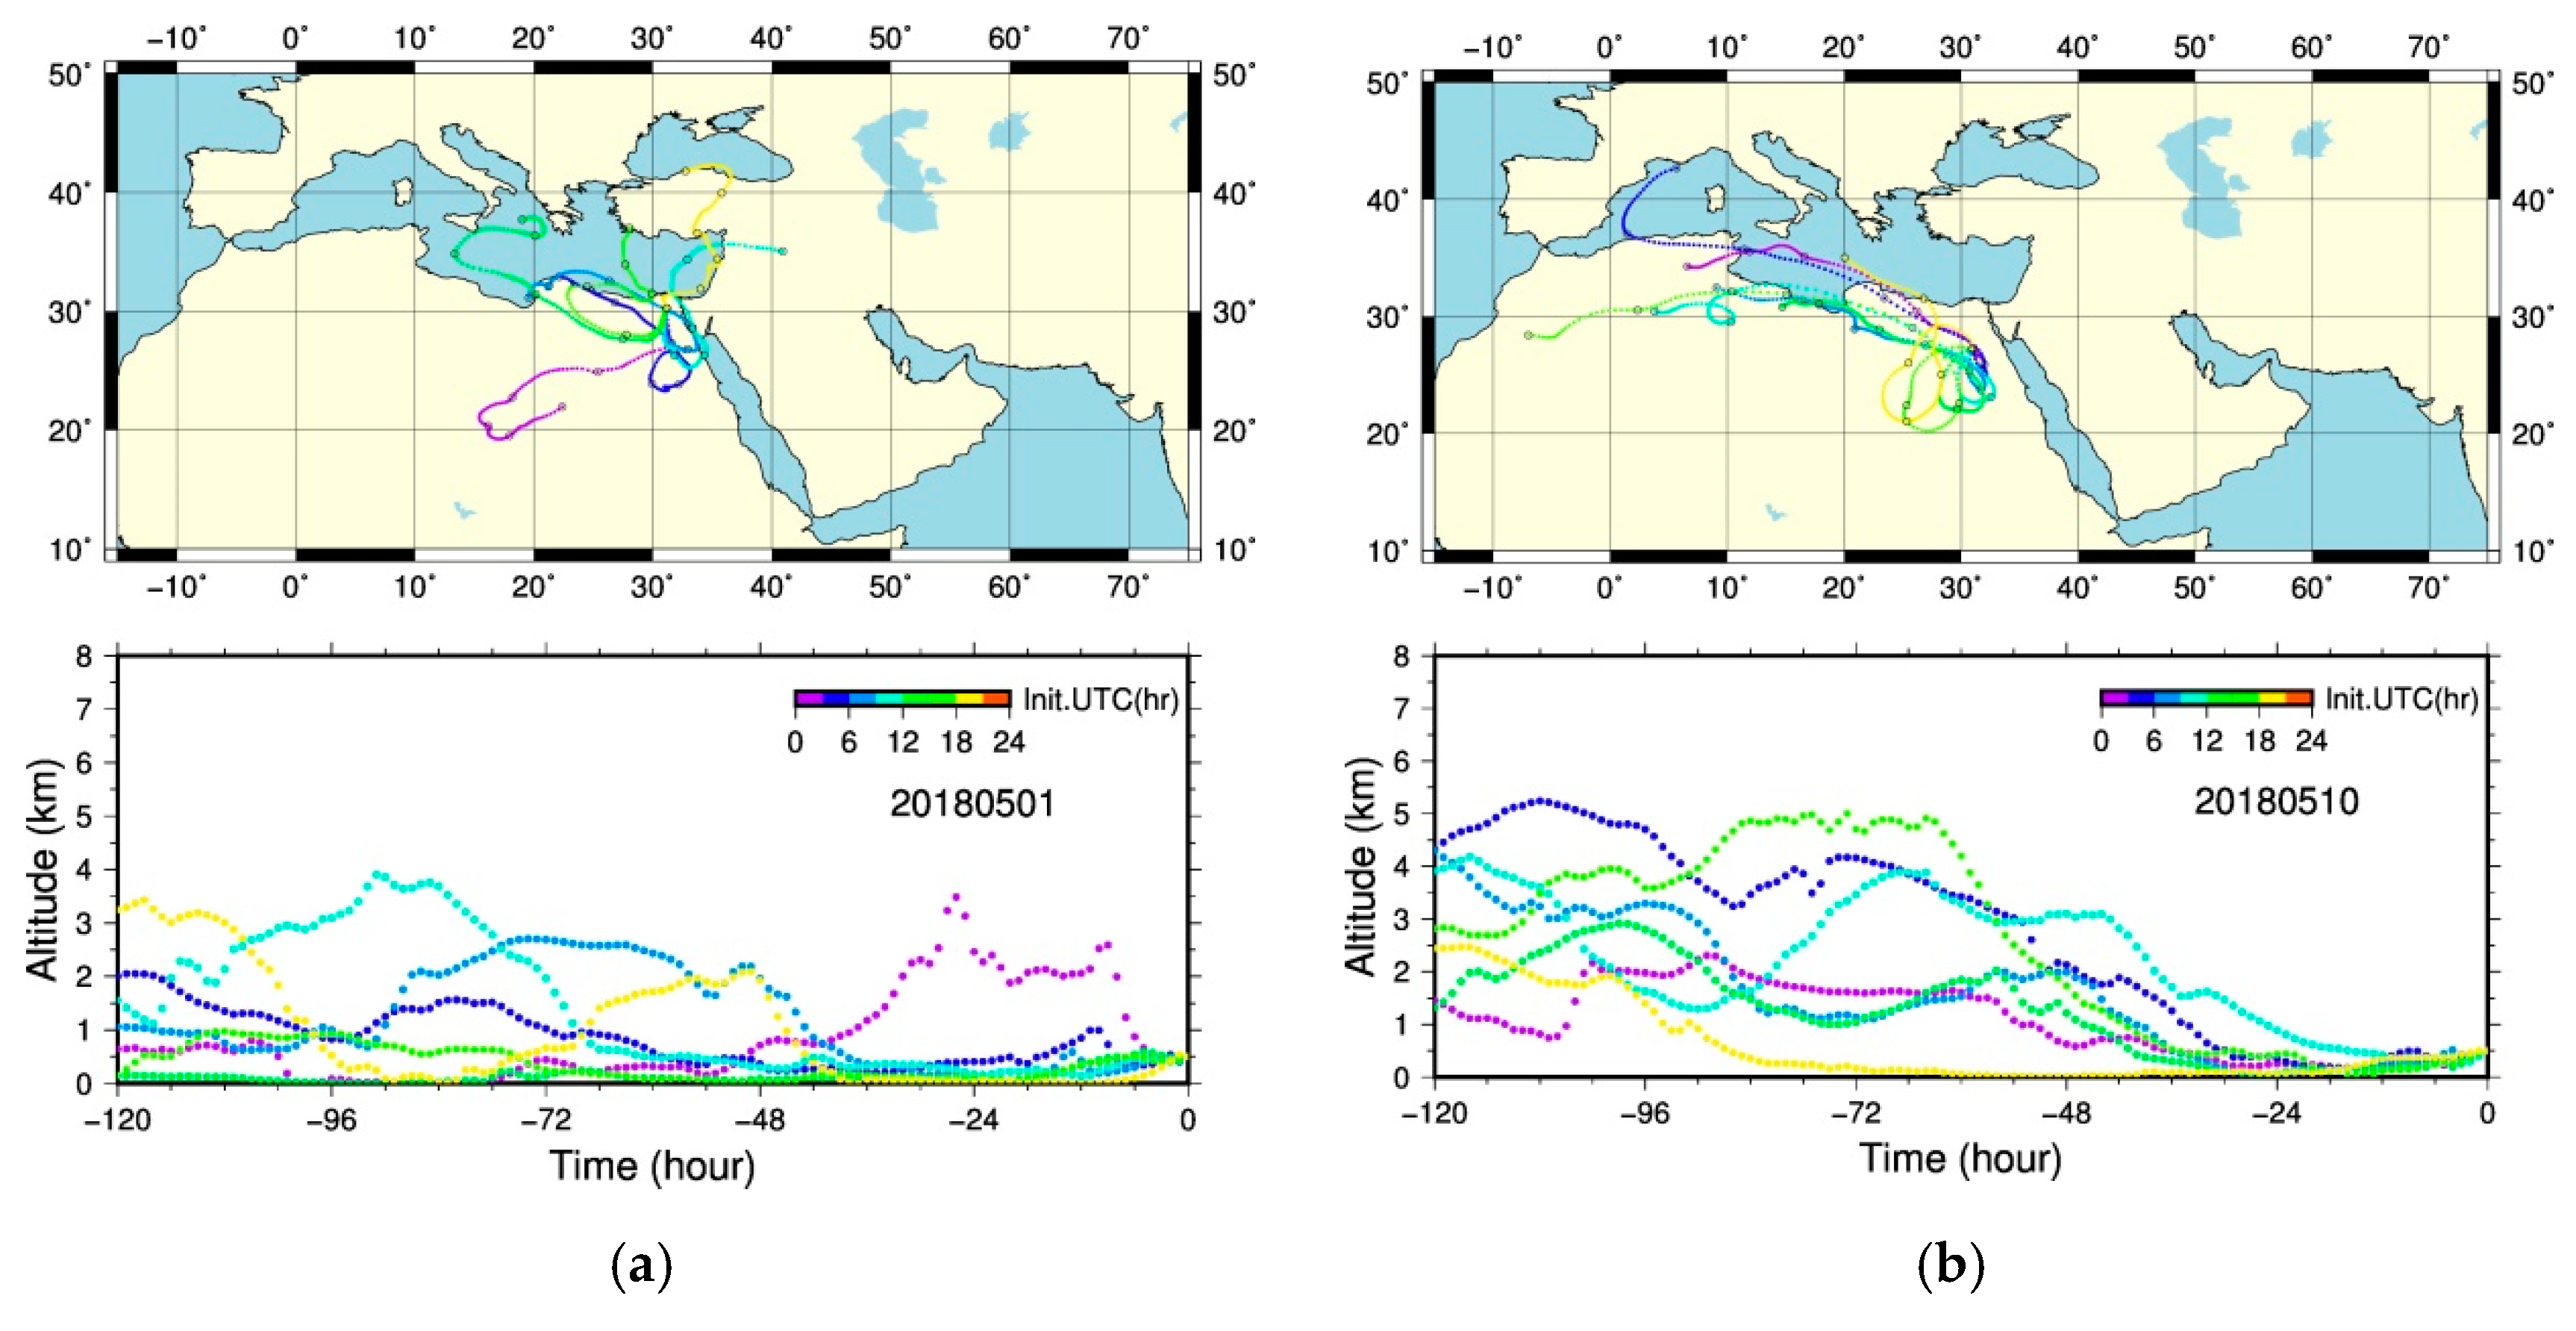
4. Discussion
5. Conclusions
Author Contributions
Funding
Acknowledgments
Conflicts of Interest
References
- Twomey, S. Atmospheric Aerosols; Elsevier Scientific Publishing, Co.: New York, NY, USA, 1977. [Google Scholar]
- Andrews, E.; Ogren, J.A.; Bonasoni, P.; Marinoni, A.; Cuevas, E.; Rodríguez, S.; Sun, J.Y.; Jaffe, D.A.; Fischer, E.V.; Baltensperger, U.; et al. Climatology of aerosol radiative properties in the free troposphere. Atm. Res. 2011, 102, 365–393. [Google Scholar] [CrossRef] [Green Version]
- Appel, B.R.; Tokiwa, Y.; Hsu, J.; Kothny, E.L.; Hahn, E. Visibility as related to atmospheric aerosol constituents. Atm. Environ. (1967) 1985, 19, 1525–1534. [Google Scholar] [CrossRef]
- Soni, K.; Singh, S.; Bano, T.; Tanwar, R.S.; Nath, S. Wavelength Dependence of the Aerosol Angstrom Exponent and Its Implications Over Delhi, India. Aerosol Sci. Tech. 2011, 45, 1488–1498. [Google Scholar] [CrossRef]
- Kaskaoutis, D.G.; Kambezidis, H.D.; Hatzianastassiou, N.; Kosmopoulos, P.; Badarinath, K.V.S. Aerosol Climatology: On the Discrimina- tion of the Aerosol Types Over Four AERONET Sites. Atmos. Chem. Phys. Discuss 2007, 7, 6357–6411. [Google Scholar] [CrossRef]
- Varga, G. Changing nature of Saharan dust deposition in the Carpathian Basin (Central Europe): 40 years of identified North African dust events (1979–2018). Environ. Inter. 2020, 139, 105712. [Google Scholar] [CrossRef] [PubMed]
- Engelstaedter, S.; Tegen, I.; Washington, R. North African dust emissions and transport. Earth-Sci. Rev. 2006, 79, 73–100. [Google Scholar] [CrossRef]
- Marinou, E.; Amiridis, V.; Binietoglou, I.; Tsikerdekis, A.; Solomos, S.; Proestakis, E.; Konsta, D.; Papagiannopoulos, N.; Tsekeri, A.; Vlastou, G.; et al. Three-dimensional evolution of Saharan dust transport towards Europe based on a 9-year EARLINET-optimized CALIPSO dataset. Atmos. Chem. Phys. 2017, 17, 5893–5919. [Google Scholar] [CrossRef] [Green Version]
- Ginoux, P.; Chin, M.; Tegen, I.; Prospero, J.; Holben, B.; Dubovik, O.; Lin, S.-J. Sources and distributions of dust aerosols simulated with the GOCART model. J. Geophys. Res. Space Phys. 2001, 106, 20255–20273. [Google Scholar] [CrossRef]
- Miller, R.L.; Tegen, I.; Perlwitz, J. Surface radiative forcing by soil dust aerosols and the hydrologic cycle. J. Geophys. Res. Space Phys. 2004, 109, 203. [Google Scholar] [CrossRef]
- Goudie, A.S.; Middleton, N.J. Desert Dust in the Global System; Springer: Berlin/Heidelberg, Germany, 2006; p. 287. [Google Scholar]
- Varga, G.; Kovács, J.; Újvári, G. Analysis of Saharan dust intrusions into the Carpathian Basin (Central Europe) over the period of 1979–2011. Glob. Plan. Chan. 2013, 100, 333–342. [Google Scholar] [CrossRef] [Green Version]
- Rodríguez, S.; Querol, X.; Alastuey, A.; Kallos, G.; Kakaliagou, O. Saharan dust contributions to PM10 and TSP levels in Southern and Eastern Spain. Atm. Environ. 2001, 35, 2433–2447. [Google Scholar] [CrossRef]
- Matassoni, L.; Pratesi, G.; Centioli, D.; Cadoni, F.; Lucarelli, F.; Nava, S.; Malesani, P. Saharan dust contribution to PM10, PM2.5 and PM1in urban and suburban areas of Rome: A comparison between single-particle SEM-EDS analysis and whole-sample PIXE analysis. J. Environ. Monit. 2011, 13, 732–742. [Google Scholar] [CrossRef] [PubMed]
- Gerasopoulos, E.; Kouvarakis, G.; Babasakalis, P.; Vrekoussis, M.; Putaud, J.P.; Mihalopoulos, N. Origin and variability of particulate matter (PM10) mass concentrations over the Eastern Mediterranean. Atm. Environ. 2006, 40, 4679–4690. [Google Scholar] [CrossRef]
- Wheeler, D.A. The meteorological background to the fall of Saharan dust, November 1984. Meteo. Mag. 1986, 115, 1–9. [Google Scholar]
- Klein, H.; Nickovic, S.; Haunold, W.; Bundke, U.; Nillius, B.; Ebert, M.; Weinbruch, S.; Schuetz, L.; Levin, Z.; Barrie, L.A.; et al. Saharan dust and ice nuclei over Central Europe. Atmo. Chem. Phys. 2010, 10, 10211–10221. [Google Scholar] [CrossRef] [Green Version]
- Holben, B.N.; Eck, T.F.; Slutsker, I.; Tanré, D.; Buis, J.P.; Setzer, A.; Vermote, E.; Reagan, J.A.; Kaufman, Y.J.; Nakajima, T.; et al. AERONET—A federated instrument network and data archive for aerosol characterization. Remote Sens. Environ. 1998, 66, 1–16. [Google Scholar] [CrossRef]
- Lee, K.H.; Li, Z.; Kim, Y.J.; Kokhanovsky, A. Atmospheric Aerosol Monitoring from Satellite Observations: A History of Three Decades. In Atmospheric and Biological Environmental Monitoring; Kim, Y.J., Platt, U., Gu, M.B., Iwahashi, H., Eds.; Springer: Dordrecht, The Netherlands, 2009; pp. 13–37. [Google Scholar] [CrossRef]
- Remer, L.A.; Kleidman, R.G.; Levy, R.C.; Kaufman, Y.J.; Tanre, D.; Mattoo, S.; Martins, J.V.; Ichoku, C.; Koren, I.; Yu, H.; et al. Global aerosol climatology from the MODIS satellite sensors. J. Geophys. Res. 2008, 113, D14S07. [Google Scholar] [CrossRef] [Green Version]
- Filonchyk, M.; Yan, H.; Zhang, Z.; Yang, S.; Li, W.; Li, Y. Combined use of satellite and surface observations to study aerosol optical depth in different regions of China. Nat. Sci. Rep. 2019, 9, 6174. [Google Scholar] [CrossRef] [PubMed]
- Mehta, M. A study of aerosol optical depth variations over the Indian region using thirteen years (2001e2013) of MODIS and MISR Level 3 data. Atm. Environ. 2015, 109, 161–170. [Google Scholar] [CrossRef]
- Verma, S.; Prakash, D.; Soni, M.; Ram, K. Atmospheric Aerosols Monitoring: Ground and Satellite-Based Instruments. Aerosols Monitoring: Ground and Satellite-Based Instruments. In Advances in Environmental Monitoring and Assessment; Sarvajayakesavalu, S., Ed.; IntechOpen: London, UK, 2019; pp. 67–80. [Google Scholar]
- Levy, R.C.; Remer, L.A.; Dubovik, O. Global aerosol optical properties and application to Moderate Resolution Imaging Spectroradiometer aerosol retrieval over land. J. Geophys. Res. Space Phys. 2007, 112. [Google Scholar] [CrossRef] [Green Version]
- Levy, R.C.; Remer, L.A.; Mattoo, S.; Vermote, E.F.; Kaufman, Y.J. Second-generation operational algorithm: Retrieval of aerosol properties over land from inversion of Moderate Resolution Imaging Spectroradiometer spectral reflectance. J. Geophys. Res. Space Phys. 2007, 112, D13. [Google Scholar] [CrossRef] [Green Version]
- Hsu, N.; Tsay, S.-C.; King, M.D.; Herman, J.R. Aerosol Properties Over Bright-Reflecting Source Regions. IEEE Trans. Geosci. Remote. Sens. 2004, 42, 557–569. [Google Scholar] [CrossRef]
- Hsu, N.; Tsay, S.-C.; King, M.D.; Herman, J.R. Deep Blue Retrievals of Asian Aerosol Properties During ACE-Asia. IEEE Trans. Geosci. Remote. Sens. 2006, 44, 3180–3195. [Google Scholar] [CrossRef]
- Hsu, N.C.; Jeong, M.-J.; Bettenhausen, C.; Sayer, A.M.; Hansell, R.; Seftor, C.S.; Huang, J.; Tsay, S.-C. Enhanced Deep Blue aerosol retrieval algorithm: The second generation. J. Geophys. Res. Atmos. 2013, 118, 9296–9315. [Google Scholar] [CrossRef]
- Rezaei, M.; Farajzadeh, M.; Mielonen, T.; Ghavidel, Y. Analysis of spatio-temporal dust aerosol frequency over Iran based on satellite data. Atmos. Pollut. Res. 2019, 10, 508–519. [Google Scholar] [CrossRef]
- Kaskaoutis, D.; Sifakis, N.; Retalis, A.; Kambezidis, H.D. Aerosol Monitoring over Athens Using Satellite and Ground-Based Measurements. Adv. Meteorol. 2010, 2010, 1–12. [Google Scholar] [CrossRef] [Green Version]
- Su, B.; Li, H.; Zhang, M.; Bilal, M.; Wang, M.; Atique, L.; Zhang, Z.; Zhang, C.; Han, G.; Qiu, Z.; et al. Optical and Physical Characteristics of Aerosol Vertical Layers over Northeastern China. Atmosphere 2020, 11, 501. [Google Scholar] [CrossRef]
- Shaw, N.; Gorai, A.K. Study of aerosol optical depth using satellite data (MODIS Aqua) over Indian Territory and its relation to particulate matter concentration. Environ. Dev. Sustain. 2018, 22, 265–279. [Google Scholar] [CrossRef]
- Li, W.; Ali, E.; El-Magd, I.A.; Mourad, M.M.; El-Askary, H.M. Studying the Impact on Urban Health over the Greater Delta Region in Egypt Due to Aerosol Variability Using Optical Characteristics from Satellite Observations and Ground-Based AERONET Measurements. Remote. Sens. 2019, 11, 1998. [Google Scholar] [CrossRef] [Green Version]
- Papadimas, C.D.; Hatzianastassiou, N.; Mihalopoulos, N.; Querol, X.; Vardavas, I. Spatial and temporal variability in aerosol properties over the Mediterranean basin based on 6- year (2000–2006) MODIS data. J. Geophys. Res. 2008, 113, D11205. [Google Scholar] [CrossRef]
- El-Metwally, M.; Alfaro, S.; Wahab, M.M.A.; Favez, O.; Mohamed, Z.; Chatenet, B. Aerosol properties and associated radiative effects over Cairo (Egypt). Atmos. Res. 2011, 99, 263–276. [Google Scholar] [CrossRef]
- Shokr, M.; El-Tahan, M.; Ibrahim, A.; Steiner, A.; Gad, N. Long-Term, High-Resolution Survey of Atmospheric Aerosols over Egypt with NASA’s MODIS Data. Remote Sens. 2017, 9, 1027. [Google Scholar] [CrossRef] [Green Version]
- El-Askary, H.; Prasad, A.K.; El-Raey, M.; Kallos, G.; Kafatos, M. Analyzing Black Cloud Dynamics over Cairo, Nile Delta Region and Alexandria using Aerosols and Water Vapor Data. In Air Quality-Models and Applications; IntechOpen: London, UK, 2011; pp. 211–232. [Google Scholar] [CrossRef] [Green Version]
- EL-ASKARY, H. Air pollution impact on aerosol variability over mega cities using remote sensing technology: Case study, Cairo. Eg. J. Rem. Sens. Spa. Sci. 2006, 9, 31–40. [Google Scholar]
- El-Magd, I.A.; Ismail, A.; Zanaty, N. Spatial Variability of Urban Heat Islands in Cairo City, Egypt using Time Series of Landsat Satellite Images. Int. J. Adv. Remote Sens. GIS 2016, 5, 1618–1638. [Google Scholar] [CrossRef] [Green Version]
- Zakey, A.S.; Abdel-Wahab, M.M.; Pettersson, J.B.C.; Gatari, M.J.; Hallquist, M. Seasonal and spatial variation of atmospheric particulate matter in a developing megacity, the Greater Cairo, Egypt. Atmósfera 2008, 21, 171189. [Google Scholar]
- Marey, H.S.; Gille, J.C.; El-Askary, H.M.; Shalaby, E.A.; El-Raey, M.E.; El-Askary, H.M. Aerosol climatology over Nile Delta based on MODIS, MISR and OMI satellite data. Atmos. Chem. Phys. Discuss. 2011, 11, 10637–10648. [Google Scholar] [CrossRef] [Green Version]
- Prasad, A.; El-Askary, H.M.; Kafatos, M. Implications of high altitude desert dust transport from Western Sahara to Nile Delta during biomass burning season. Environ. Pollut. 2010, 158, 3385–3391. [Google Scholar] [CrossRef]
- Central Agency for Public Mobilization and Statistics (CAPMAS). Egypt in Figures-Population. Available online: https://www.capmas.gov.eg/Pages/StaticPages.aspx?page_id=5035 (accessed on 10 March 2020).
- World health statistics 2017: Monitoring health for the SDGs, Sustainable Development Goals. Available online: https://www.who.int/gho/publications/world_health_statistics/2017/en/WHO (accessed on 21 September 2019).
- World health statistics 2018: Monitoring health for the SDGs, Sustainable Development Goals. Available online: https://www.who.int/gho/publications/world_health_statistics/2018/en/WHO (accessed on 21 September 2019).
- IRIN (Integrated Regional Information Network) online report. 2008. Available online: https://www.thenewhumanitarian.org/news/2008/10/09/efforts-fight-%E2%80%9Cblack-cloud%E2%80%9D-cairo (accessed on 22 March 2020).
- NASA MODIS. Available online: https://modis.gsfc.nasa.gov/data/ (accessed on 20 May 2019).
- Levy, R.C.; Mattoo, S.; Munchak, L.A.; Remer, L.A.; Sayer, A.M.; Patadia, F.; Hsu, N.C. The Collection 6 MODIS aerosol products over land and ocean. Atmos. Meas. Tech. 2013, 6, 2989–3034. [Google Scholar] [CrossRef] [Green Version]
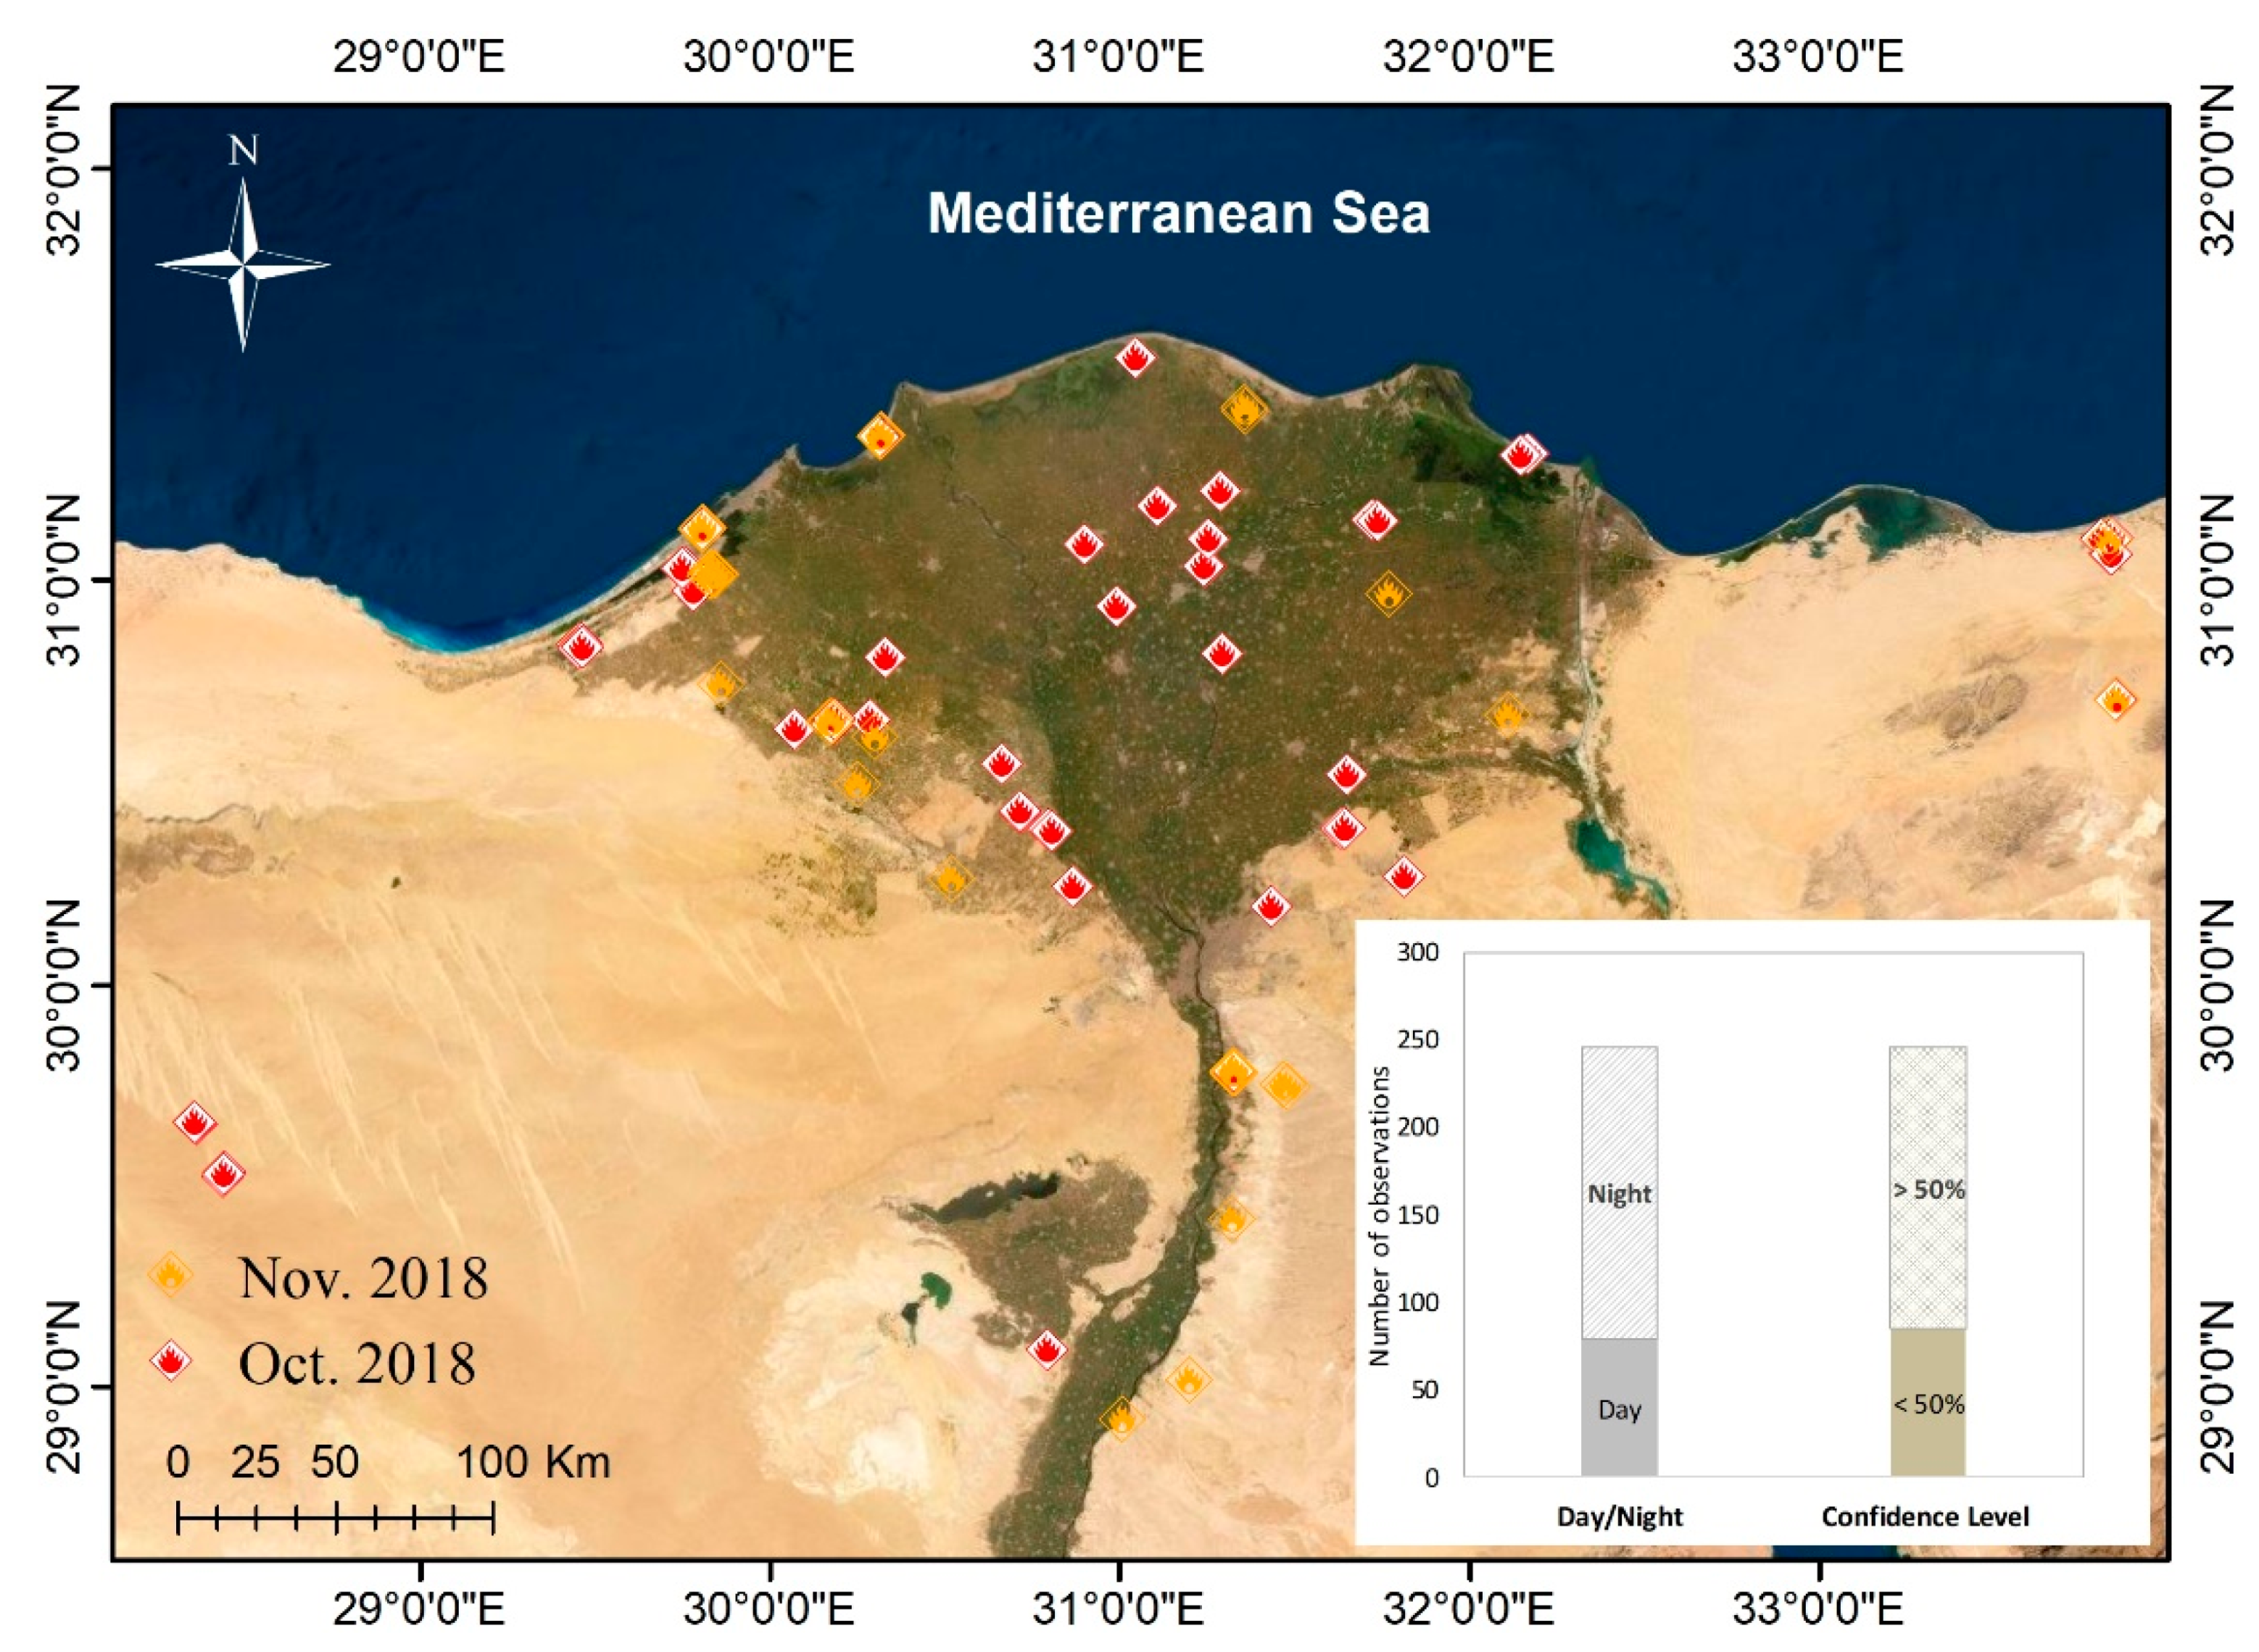
- Fire Information for Resource Management System (FIRMS). Available online: https://firms.modaps.eosdis.nasa.gov/active_fire/#firms-shapefile (accessed on 15 March 2020).
- Kolhe, A.R.; Pawar, G.V.; Varpe, S.R.; Kumar, P.P.; Devara, P.C.S.; Aher, G.R. Multi-Year Analysis of Aerosol Properties Retrieved from the Ångström Parameters for Different Spectral Ranges over Pune. Aerosol. Air Qual. Res. 2017, 16, 3266–3280. [Google Scholar] [CrossRef] [Green Version]
- Vitali, L.; Righini, G.; Piersanti, A.; Cremona, G.; Pace, G.; Ciancarella, L. M-TraCE: A new tool for high-resolution computation and statistical elaboration of backward trajectories on the Italian domain. Theor. Appl. Clim. 2016, 129, 629–643. [Google Scholar] [CrossRef]
- Zeng, J.; Matsunaga, T.; Mukai, H. METEX—A flexible tool for air trajectory calculation✩. Environ. Model. Softw. 2010, 25, 607–608. [Google Scholar] [CrossRef]
- Tian, X.; Gao, Z. Validation and Accuracy Assessment of MODIS C6.1 Aerosol Products over the Heavy Aerosol Loading Area. Atmosphere 2019, 10, 548. [Google Scholar] [CrossRef] [Green Version]
- Barnaba, F.; Gobbi, G.P. Aerosol seasonal variability over the Mediterranean region and relative impact of maritime, continental and Saharan dust particles over the basin from MODIS data in the year 2001. Atmos. Chem. Phys. Discuss. 2004, 4, 2367–2391. [Google Scholar] [CrossRef] [Green Version]
- Kallos, G.; Astitha, M.; Katsafados, P.; Spyrou, C.; Spyrou, C. Long-Range Transport of Anthropogenically and Naturally Produced Particulate Matter in the Mediterranean and North Atlantic: Current State of Knowledge. J. Appl. Meteorol. Clim. 2007, 46, 1230–1251. [Google Scholar] [CrossRef] [Green Version]
- Luria, M.; Peleg, M.; Sharf, G.; Tov-Alper, D.S.; Spitz, N.; Ben Ami, Y.; Gawii, Z.; Lifschitz, B.; Yitzchaki, A.; Seter, I. Atmospheric sulfur over the east Mediterranean region. J. Geophys. Res. Space Phys. 1996, 101, 25917–25930. [Google Scholar] [CrossRef]
- Millan, M.M.; Salvador, R.; Mantilla, E.; Kallos, G. Photo oxidant dynamics in the Mediterranean basin in summer: Results from European research projects. J. Geophys. Res. 1997, 102, 8811–8823. [Google Scholar] [CrossRef]
- Kallos, G.; Kotroni, V.; Lagouvardos, K.; Papadopoulos, A. On the Long-Range Transport of Air Pollutants from Europe to Africa. Geophys. Res. Lett. 1998, 25, 619–622. [Google Scholar] [CrossRef]
- Eck, T.F.; Holben, B.N.; Reid, J.S.; Dubovik, O.; Smirnov, A.O.; Neill, N.T.; Slutsker, I.; Kinne, S. Wavelength Dependence of the Optical Dept of Bio Mass Burning, Urban, and Desert Dust Aerosols. J. Geophys. Res. 1999, 104, 31333–31349. [Google Scholar] [CrossRef]


| Data Name | Product | Level | Observation Time | Wavelength | Temporal Resolution | Spatial Resolution |
|---|---|---|---|---|---|---|
| MODIS Terra AOD (land and Ocean) | MOD04 | 2 | 2012–2018 | 550 nm | Daily/Monthly | 10 km |
| MODIS Terra AOD (land only) | MOD04 | 2 | 2012–2018 | 470 nm 550 nm 660 nm | Daily/Monthly | 10 km |
| MODIS Terra combined Dark Target and Deep Blue algorithms | MOD08 | 3 | 2012–2018 | 550 nm | Daily/Monthly | 1° |
| AERONET AOD | AOD 500 nm | 2 | 2012–2018 | 500 nm | Daily/Monthly | Point location |
| PM10 concentrations | In-situ | - | 2016 | - | Hourly | Point location |
| Station Name | Longitude | Latitude | Type | No. of Available Data Points | Mean PM10 µg/m3 |
|---|---|---|---|---|---|
| Al-Salam | 31°26′51.99″ E | 30°9′22.71″ N | Mixed | 290 | 172.7 |
| Shoubra | 31°16′13.56″ E | 30°6′40.80″ N | Industrial | 581 | 163.3 |
| Masr El-Gedida | 31°20′13.49″ E | 30°6′24.01″ N | Residential | 236 | 131.3 |
| Nasser City | 31°19′29.79″ E | 30°3′36.39″ N | Residential | 469 | 113.8 |
| Al-Qollaly | 31°14′38.00″ E | 30°3′36.98″ N | Traffic/urban | 556 | 161.4 |
| Six of October | 30°52′59.37″ E | 29°56′9.32″ N | Residential/Industrial | 416 | 202.4 |
| Mohandesen | 31°12′43.39″ E | 30°2′47.70″ N | Residential | 423 | 224.8 |
| Helwan | 31°19′10.27″ E | 29°51′54.82″ N | Residential/Industrial | 106 | 469.6 |
| Tebin | 31°18′11.10″ E | 29°46′55.04″ N | Industrial | 322 | 124.2 |
| Al Maadi | 31°15′51.80″ E | 29°58′2.71″ N | Residential | 120 | 469.6 |
| Al-Maasara | 31°12′42.88″ E | 30°0′34.79″ N | Mixed | 462 | 254.7 |
| New Cairo | 31°25′6.93″ E | 29°59′36.39″ N | Residential | 359 | 94 |
| Abbasia | 31°17′27.43″ E | 30°4′47.91″ N | Residential/urban | 240 | 138 |
| Nasser Institute | 31°14′24.43″ E | 30°5′44.10″ N | Urban | 292 | 272 |
| Qaha | 31°12′24.27″ E | 30°17′10.14″ N | Remote Area | 452 | 214 |
| Shebin El-Kom | 31°0′35.48″ E | 30°33′25.51″ N | Urban | 169 | 313 |
| Al Mahala Al kobra | 31°0′58.35″ E | 30°46′31.07″ N | Industrial | 96 | 230 |
| Month | January | February | March | April | May | June | July | August | September | October | November | December |
|---|---|---|---|---|---|---|---|---|---|---|---|---|
| No. of dust events | 3 | 3 | 3 | 5 | 2 | 2 | - | - | - | 3 | 2 | 1 |
| Duration/day | 8 | 6 | 4 | 8 | 2 | 2 | 3 | 12 | 2 | |||
| Mean | 0.22 | 0.12 | 0.34 | 0.39 | 0.42 | 0.39 | 0.37 | 0.38 | 0.35 | 0.35 | 0.27 | 0.17 |
| Std. Dev. | 0.21 | 0.07 | 0.21 | 0.24 | 0.17 | 0.14 | 0.21 | 0.12 | 0.1 | 0.09 | 0.06 | 0.06 |
© 2020 by the authors. Licensee MDPI, Basel, Switzerland. This article is an open access article distributed under the terms and conditions of the Creative Commons Attribution (CC BY) license (http://creativecommons.org/licenses/by/4.0/).
Share and Cite
Abou El-Magd, I.; Zanaty, N.; Ali, E.M.; Irie, H.; Abdelkader, A.I. Investigation of Aerosol Climatology, Optical Characteristics and Variability over Egypt Based on Satellite Observations and In-Situ Measurements. Atmosphere 2020, 11, 714. https://doi.org/10.3390/atmos11070714
Abou El-Magd I, Zanaty N, Ali EM, Irie H, Abdelkader AI. Investigation of Aerosol Climatology, Optical Characteristics and Variability over Egypt Based on Satellite Observations and In-Situ Measurements. Atmosphere. 2020; 11(7):714. https://doi.org/10.3390/atmos11070714
Chicago/Turabian StyleAbou El-Magd, Islam, Naglaa Zanaty, Elham M. Ali, Hitoshi Irie, and Ahmed I. Abdelkader. 2020. "Investigation of Aerosol Climatology, Optical Characteristics and Variability over Egypt Based on Satellite Observations and In-Situ Measurements" Atmosphere 11, no. 7: 714. https://doi.org/10.3390/atmos11070714