Article

Characterization and Source Apportionment of Fine Particles during a Heavy Pollution Episode over the Yangtze River Delta, China

1
Collaborative Innovation Centre on Forecast and Evaluation of Meteorological Disasters, Nanjing University of Information Science & Technology, Nanjing 210044, China
2
Key Laboratory of Meteorological Disaster, Ministry of Education (KLME), Nanjing University of Information Science & Technology, Nanjing 210044, China
3
Special Test Field of National Integrated Meteorological Observation, Nanjing University of Information Science & Technology, Nanjing 210044, China
*
Author to whom correspondence should be addressed.
Atmosphere 2020, 11(7), 720; https://doi.org/10.3390/atmos11070720
Submission received: 3 June 2020 / Revised: 28 June 2020 / Accepted: 2 July 2020 / Published: 6 July 2020
(This article belongs to the Section Aerosols)

Abstract

:
Regional-scale field observations of fine particles (PM2.5) were carried out at urban, suburban and regional background sites across the Yangtze River Delta (YRD) from 15–30 January 2015. The coefficients of divergence (CD) values reveal the similarity of dataset at the three sites. The PM2.5 concentrations and meteorological data exhibit temporal synchronization. From January 15 to 26, the YRD experienced severe PM2.5 pollution resulting from a cold front moving through and high-pressure control. Then, a 4-day intermittent rain event from 27–30 January significantly scavenged PM2.5. For the chemical components in PM2.5, secondary inorganic ions were dominant, and they accounted for larger proportions at the urban and suburban sites than at the regional background site. The OC/EC ratios were higher in daytime than at night, and were lower on polluted days than on clean (rainy) days. The principal sources of PM2.5 were secondary nitrate (38%) and sulfate (23%) formation, biomass burning (14%), and marine source (8%). Marine (16%) and sulfate (30%) sources were enhanced on clean (rainy) days, indicating the notable effect of marine air masses on PM2.5 chemical components. The open burning source contribution at the regional site was the largest during the polluted period because more air masses arrived from combustion zones.

Graphical Abstract

1. Introduction

Over the last several decades, with rapid economic growth and urbanization [1], megacities and city clusters [2] in China have been experiencing severe air pollution [3]. An overview of trends of Chinese air pollution since 2000 has been summarized in Lin et al., (2013) [4]. Due to the adverse effects on public health [5], visibility [6], and climate effects [7], PM2.5 (fine particles with aerodynamic diameter ≤ 2.5 μm) have received much attention [8,9]. Generally, in addition to the intensive anthropogenic emission, PM2.5 pollutions in China are mainly contributed by adverse meteorological conditions, secondary aerosol formation, and regional transport [10,11].
The Yangtze River Delta (YRD), located in eastern China, is one of the densely populated city clusters with the highest economic development in China. Field observations of the ambient particle pollution over the YRD have been conducted in previous studies, which mostly focus on the chemical properties, formation mechanisms, source apportionment, etc. For example, The PM2.5 concentrations in Nanjing (NJ) varied with season and were extremely elevated in winter. In addition, the secondary nitrate, coal combustion, and road dust concentrations were all higher in winter compared with the other seasons [12]. In Changzhou, the secondary processes are the dominant contribution to aerosol components [13]. The main sources in the NJ northern suburban area were vehicle exhaust, secondary aerosols, and residual oil, accounting for 25%, 20%, and 16%, respectively [14]. In Shanghai, cluster analysis of trajectories revealed that PM2.5 originated from marine aerosols and medium- and large-range transportation. Secondary formation was the principal source of PM2.5 [15]. More than 15% of the organic carbon (OC) in PM2.5 in Lin’an (LA) stemmed from biomass burning [16].
However, most of these studies only focused on isolated sites, such as the megacities of NJ and Shanghai, or regional background sites, such as LA. The understandings of the regional features over the YRD or the differences between cities within YRD are limited. In this article, we report the results obtained from simultaneous field observations carried out in NJ (a suburban site, industrial factory area), Suzhou (SZ, an urban site, residential area) and LA (a regional background site, mountain area) from 15–30 January 2015. Combined with meteorological data, the temporal and spatial variations in pollutants are examined. Besides, the similarities and differences between source contributions among these sites are also investigated to better understand regional particle pollution.

2. Material and Methods

2.1. Sampling and Chemical Analysis

Simultaneous field observations were carried out from 15 to 30 January 2015 at urban (SZ), suburban (NJ) and regional background (LA) sites. The geographical information of these sites and sample number are summarized in supplemental Table S1, and the site distributions combined with representative surface weather patterns during that period are illustrated in Figure 1.
Ambient PM2.5 samples were collected every 6 h (at local times 03:00–08:40, 09:00–14:40, 15:00–20:40 and 21:00–02:40 the following day) with a medium-volume air sampler (KC-120H, Qingdao Laoshan) at an air flow rate of 100 L/min. Consequently, a total of 179 samples were effectively collected. The quartz filters (PALL, USA, 90 mm) were baked at 800 °C for 5 h before use. An electronic microbalance with a resolution of 10 μg (Mettler Toledo MS-105) was used to weigh the particle mass. For quality assurance/quality control (QA/QC), each filter was weighed at least three times, and three field blank samples were collected and analyzed during sampling.
The OC and elemental carbon (EC) were analyzed with a thermal/optical carbon analyzer (DRI model 2001, US). For QA/QC, the analyzer was calibrated each day with known quantities of CH4. One out of ten samples was repeatedly measured, and the difference between the values from the replicate measurements was less than 5% for the total carbon and less than 10% for OC and EC. The detection limits (DLs) for OC and EC were 0.45 and 0.06 μg/cm2, respectively. The average blank concentrations were utilized to correct the sample results.
Half of each particle-loaded quartz filter was pretreated using an ultrasonic extraction system for water-soluble ion analysis. The ions (Na+, NH4+, K+, Mg2+, Ca2+, F, Cl, NO2, NO3 and SO42−) were measured using an 850 Professional Ion Chromatograph (Metrohm, Switzerland). The chromatography columns were a Metrosep C4150/4.0 separation column and a Metrosep A Supp 5150/4.0 separation column. The DLs for Na+, NH4+, K+, Mg2+, Ca2+, F, Cl, NO2, NO3 and SO42− were 0.001, 0.005, 0.001, 0.002, 0.001, 0.04, 0.01, 0.04, 0.006, and 0.05 mg/L, respectively. For more details, please see [17].

2.2. Data Analysis Methods

2.2.1. Positive Matrix Factorization (PMF) Receptor Model

The Environmental Protection Agency of the United States (U.S. EPA) PMF model is widely used in source apportionment depending on the component concentrations and source tracers [18]. The latest version of PMF v5.0 is capable of reading data at multiple sites, which satisfies the demands of this multisite study [19]. The input data contain a concentration file and an uncertainty file [20,21]. The uncertainty for each value is estimated as (0.05*concentration + DL) for values ≥ DL, while for values < DL, the uncertainty is (5*DL/6), and the concentration is replaced with DL/2. Species with a low signal-to-noise ratio (S/N ≤ 0.2) or a high percentage (70%) of data below the DL should be excluded from analysis.

2.2.2. Hybrid Single-Particle Lagrangian Integrated Trajectory (HYSPLIT) Model and Other Data

Based on National Centers for Environmental Prediction (NCEP) Global Data Assimilation System (GDAS) data (1° × 1°) (ftp://arlftp.arlhq.noaa.gov/pub/archives/gdas1/), the HYSPLIT model was run to identify the movement of air masses. Clustering analysis is a multivariate statistical technique which is widely used in air pollution research [22]. It aims at classifying lots of trajectories according to velocity and direction of air mass movement. Classification principle is that there are very few differences between trajectories within groups, but extremely large differences between groups [23]. The Fire Information for Resource Management System (FIRMS) provides locations of open burning sites (https://firms.modaps.eosdis.nasa.gov/map/). The CO concentrations were measured with a CO analyzer (Thermo Electron, 48i) using gas filter correlation technology. The analyzer was calibrated every week to maintain the measurement accuracy, and the DL was 0.04 ppm. The meteorological data (such as temperature, humidity, wind, precipitation, visibility) were obtained from the local surface observation stations (China Meteorological Administration) of each sampling site.

3. Results and Discussion

3.1. Statistics of the Species Concentrations

3.1.1. Fine-Particle Concentrations and Meteorological Conditions

The mean mass concentrations of PM2.5 during the observation period were 144.6 ± 59.4, 151.8 ± 65.4 and 132.9 ± 58.8 μg/m3 in NJ, SZ and LA, respectively. These mean values are nearly two times the 24-h PM2.5 standard for a class II region (75 μg/m3) in the China National Ambient Air Quality Standards (CNAAQS) [24], indicating serious PM2.5 pollution in winter over the YRD.
The PM2.5 concentration at LA was slightly lower than those at NJ (p = 0.009 < 0.05) and SZ (p = 0.006 < 0.05), but the difference between NJ and SZ was not statistically significant (p = 0.27 > 0.05). The coefficient of divergence (CD) is used to measure the spatial homogeneity of data at different sites. The CD value is determined as follows:
C D j k = 1 p i = 1 p ( x i j x i k x i j + x i k ) 2
where x i j and x i k represent the concentration of the component (i) at sites (j and k), and p is the number of samples [25]. The CD value of zero means there are no differences between concentrations at the sites, while a value approaching one indicates a great differences and absolute heterogeneity. Wongphatarakul et al. (1998) [26] suggested that a CD value lower than 0.27 reflected the similarity between particles of two sites. The CD values of the chemical components between the three sites are mostly 0.19–0.35, as shown in Table S2. It reveals a limited number of differences among the three sites, indicating that the PM2.5 pollution over the YRD tends to be regional [27,28].
The concentrations of PM2.5, OC, EC, and OC/EC in day (09:00–14:40 and 15:00–20:40) and night (21:00–02:40 and 03:00–08:40) are summarized in Table S3. The PM2.5 and OC concentrations at the three sites presented higher in daytime than those at night, whereas EC concentrations were comparable between daytime and nighttime. The OC/EC ratios were higher in daytime (p = 0.007 < 0.05), indicating the secondary OC formation were more intensive in daytime.
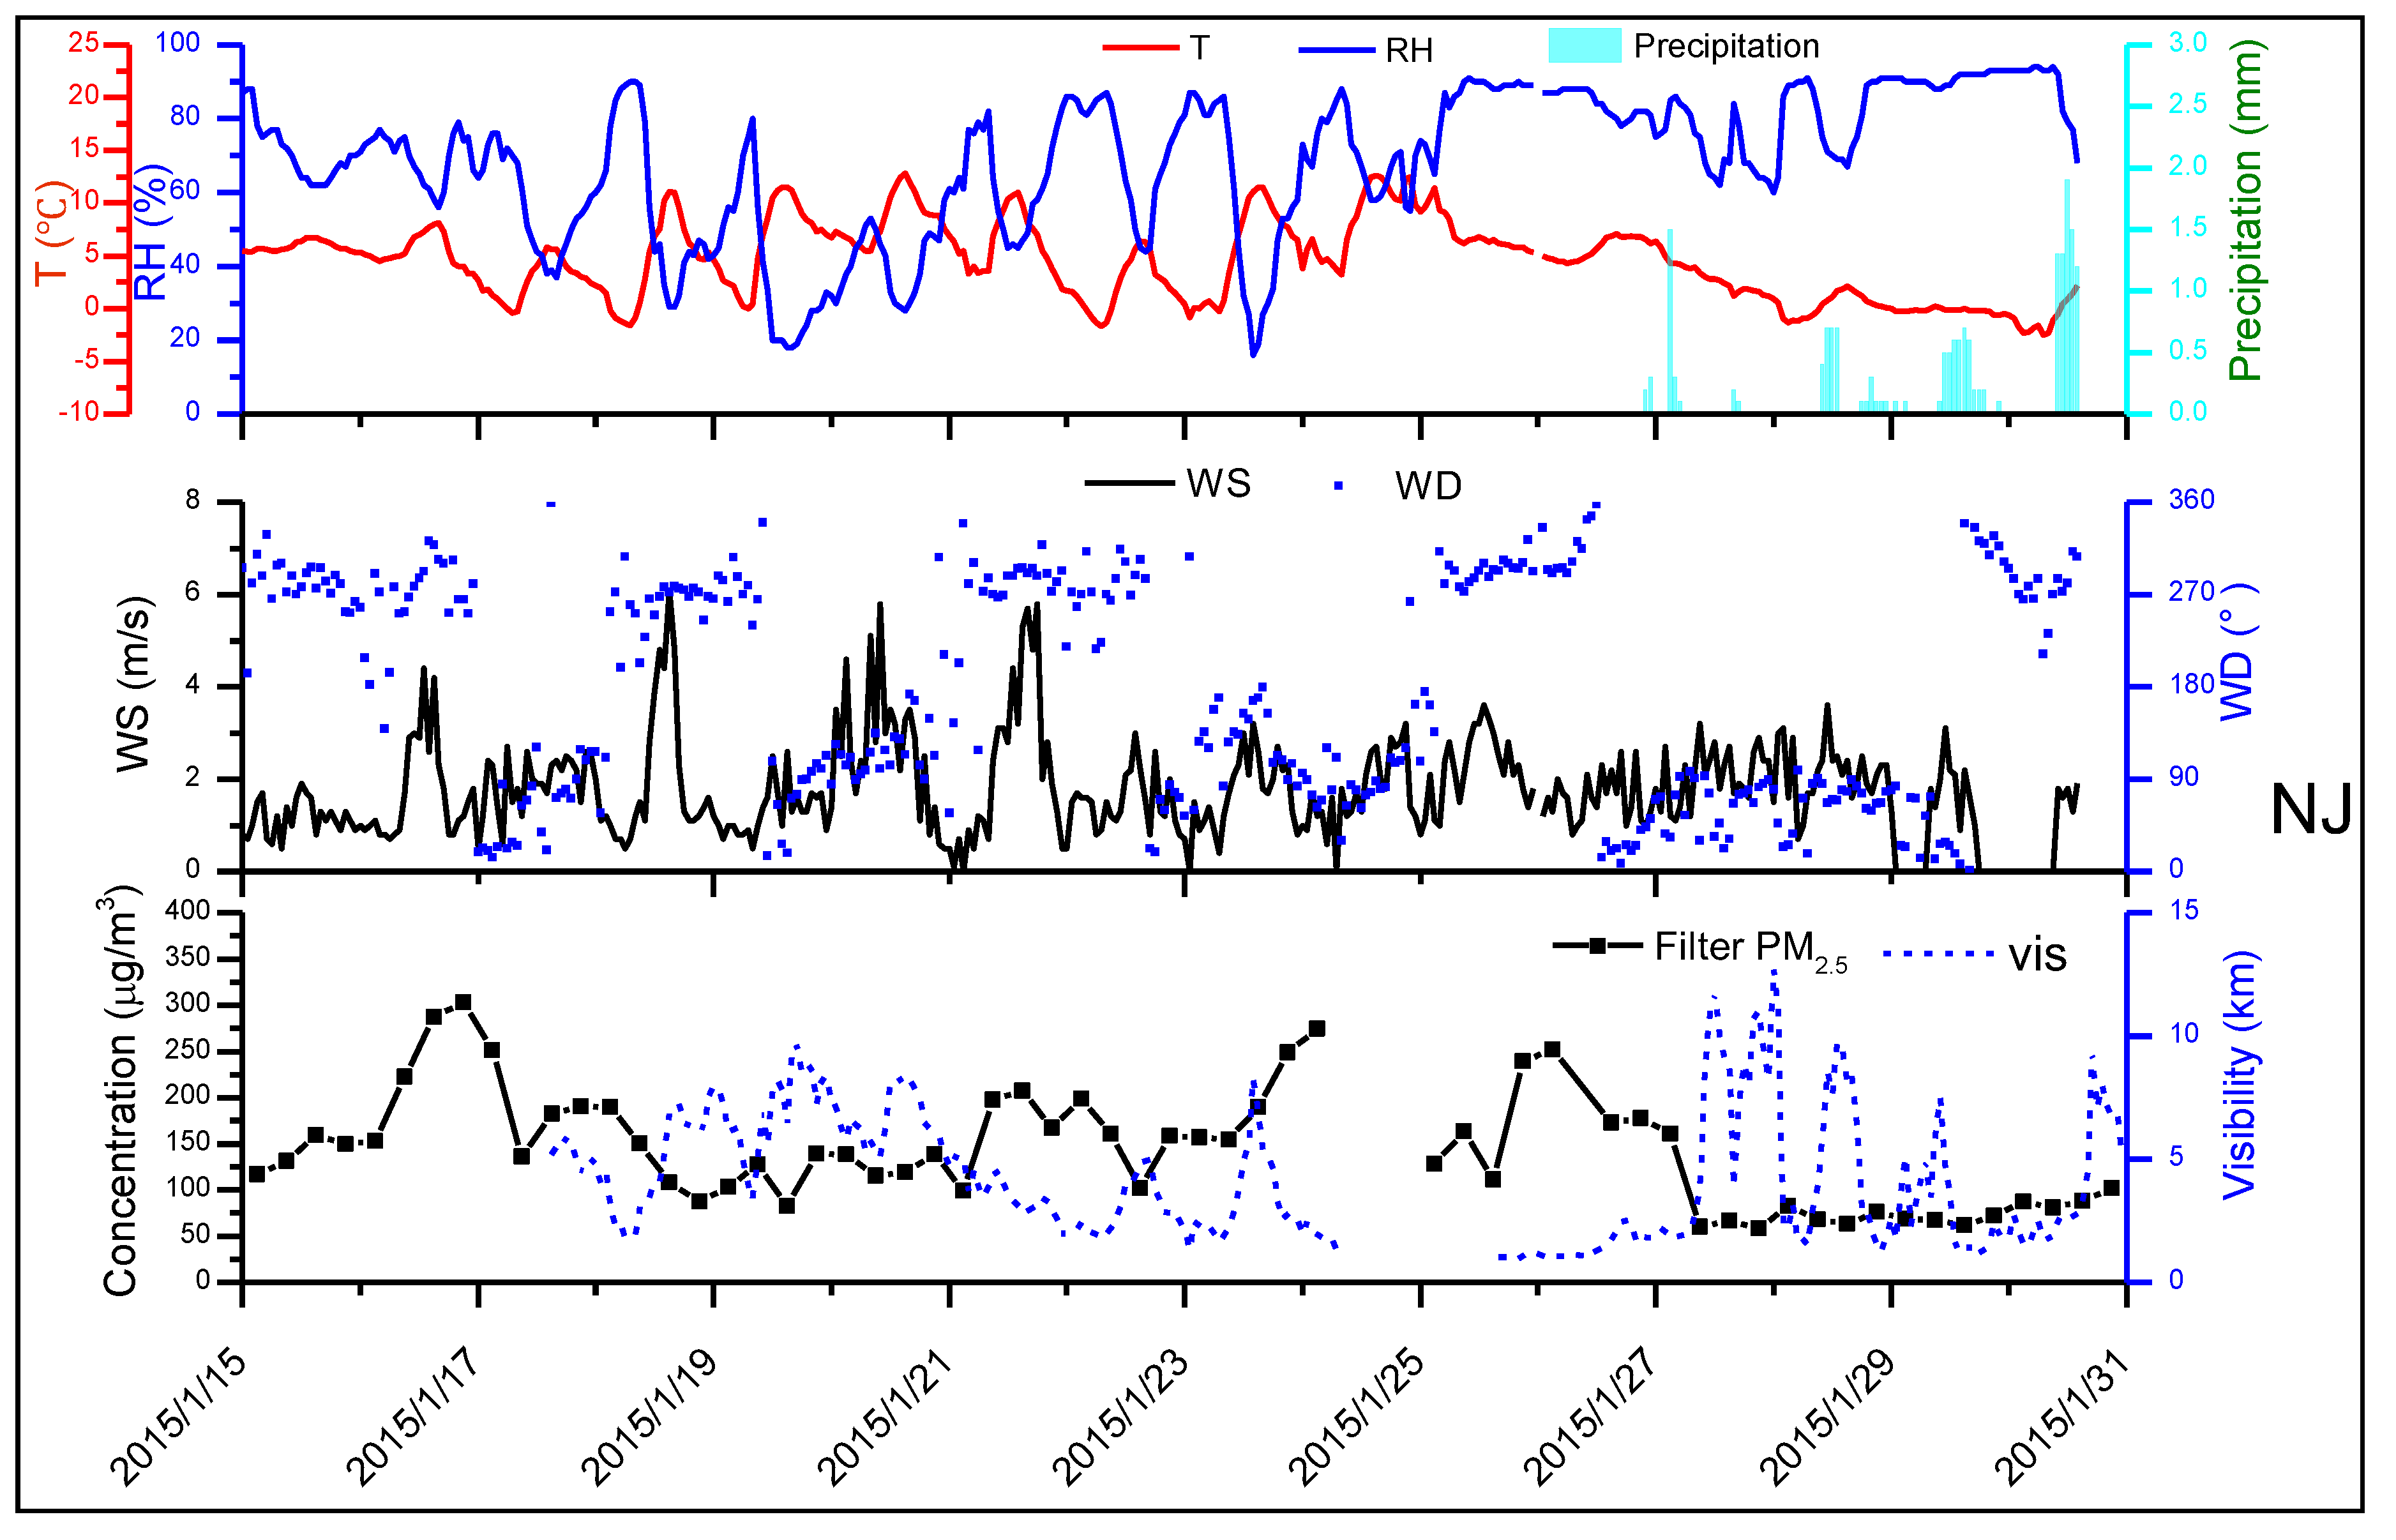
The temporal variations of the meteorological conditions and PM2.5 concentrations in NJ are illustrated in Figure 2, the same graphs for SZ and LA are shown in supplemental Figure S1. The meteorological conditions and PM2.5 pollution patterns at the three sites exhibit very similar temporal variations. From 15 to 26 January, the average PM2.5 concentrations were as high as 166.5 ± 43.2, 164.2 ± 44.5 and 147.5 ± 59.4 μg/m3, respectively, in NJ, SZ, and LA. The humidity averaged 63 ± 19, 72 ± 13, and 75 ± 20%, respectively, and the temperatures were 5.6 ± 3.3, 7.0 ± 3.0, and 7.1 ± 4.5 °C, respectively, in NJ, SZ, and LA. Such high PM2.5 concentrations resulted in low visibility, which was 4.0 ± 2.3, 2.9 ± 1.7, and 4.5 ± 3.8 km in NJ, SZ, and LA, respectively. During this pollution episode, eastern China was alternately dominated by cold front moving through and high-pressure system. According to the surface weather patterns, the cold front process occurred three times between 15 and 21 January, one of which is shown in Figure 1a. When the cold front progressed, the YRD was just on the south of the cold front passage. As a result, northwestern winds prevailed across the YRD, while the wind speed notably increased (up to 7.5 m/s) lasting for an average of 7 h when the wind speed was higher than 4.0 m/s, which is favorable for the long-range transport of aerosols. When the YRD was controlled by the high-pressure system from 22 to 26 January (Figure 1b), stagnant meteorological conditions occurred with low wind speeds (on average 1.8~2.2 m/s) promoting pollutant accumulation near the surface. Kang et al. (2019) [29] also found that the PM2.5 pollution episode over YRD during 21–26 January 2015 was attributed to a cold front passage (long-range transport) and the subsequent uniform pressure field (local accumulation), based on simulations of the Weather Research and Forecasting–Community Multiscale Air Quality Modeling System (WRF-CMAQ). Then this period between 15 and 26 January is called the pollution period.
On the other hand, from 27 to 30 January, a 4-day intermittent rain event (average intensity of 0.5 ± 0.4 mm/h) significantly scavenged the airborne PM2.5. The average PM2.5 concentrations dropped to 67.8 ± 21.4, 71.1 ± 36.0 and 63.7 ± 16.3 μg/m3 in NJ, SZ, and LA, respectively (below the standard for a class II region). The humidity increased to 82 ± 10, 82 ± 11, and 93 ± 6%, respectively, and the temperature decreased to 0.7 ± 1.8, 2.8 ± 1.6, and 1.9 ± 1.8 °C, respectively, in NJ, SZ, and LA. Figure 1c shows that the YRD was ahead of an inverted trough, and the eastern wind from the ocean transported abundant water vapor for intermittent rainfall. Therefore, the following period of 27–30 January is regarded as a clean period.

3.1.2. Chemical Components of PM2.5

In terms of the water-soluble cation and anion concentrations, SO42+, NO3, and NH4+ (SNA) were dominant. The SNA concentrations were 74.6 ± 37.7, 71.7 ± 35.0, and 61.8 ± 35.5 μg/m3 in NJ, SZ and LA, respectively, during the pollution period and 36.3 ± 23.2, 38.2 ± 29.2, and 25.1 ± 15.6 μg/m3, respectively, on the clean (rainy) days. The SNA/PM2.5 ratios in NJ and SZ were comparable (~0.45) and higher than that in LA (0.40, p = 0.008 < 0.05). Ions (such as SO42−, Cl, K+) can be split into the seasalt and non-seasalt fraction. Assuming that the Na+ in particles comes only from sea-salt, the concentration of non-seasalt ions (nss-X) can be estimated by the equation: nss-X = [X]-[Na+]*ratio(X), with ratio(X) of 0.2455(SO42−), 1.727(Cl), 0.0355(K+) [30]. The nss-SO42−, nss-K+ account for 90~99% of their soluble particulate ions, while nss-Cl were 79~88%. The fractions of nss-ions were the highest at NJ, and the lowest at LA (Table S4).
The equivalence concentration (μeq/m3) relationships among these ions during the sampling period are investigated (Figure S2). Cl is usually considered from biomass burning, coal combustion, seawater and so on [31]. The Cl/Na+ molar ratios (3.58–6.66) are higher than the average ratio (1.17) of bulk seawater [32]. K+ in aerosol is commonly used as a tracer of biomass burning. The Cl/K+ molar ratios are 2.14–5.15 at these sites. The relatively high Cl/Na+ and Cl/K+ molar ratios and the aforementioned nss-Cl/Cl ratios suggest that the Cl in this study is mainly from anthropogenic discharge (e.g., coal combustion) [33]. The Mg2+/Na+ molar ratios (0.42–0.53) are distinct from that of seawater (0.23), suggesting that Mg2+ mostly comes from a source other than sea salt. The good correlations (R2 > 0.90) between Mg2+ and Ca2+ illustrate that the dominant source of Mg2+ is mineral-related dust [34]. The ratio of total anions to total cations is 1.02 (R2 = 0.99) at the three sites, indicating the charge balance in PM2.5. There are good correlations between NH4+ and SO42− at the three sites, with ratios of 1.85–2.05. When NH4+/SO42− >1.5 in samples, NH4+ stabilizes NO3, and nitrate exists in the form of NH4NO3, which is the product of HNO3 neutralized by ammonia [35]. The molar ratios of NH4+/(NO3+SO42−) are 1.05, 1.02 and 0.96 at NJ, SZ, and LA, demonstrating that nitrate and sulfate were predominantly present in the form of (NH4)2SO4 and NH4NO3 [36]. In order to investigate the existing form of crustal cations (Ca2+, Mg2+), we examined the molar ratios of (NH4+ + Ca2+ + Mg2+)/(SO42−+ NO3) and (NH4+ + Ca2+ + Mg2+)/(SO42−+ NO3 +nss-Cl), which are 1.02–1.09, and 0.94–0.95, respectively. The change of the molar ratios indicates that Ca2+ and Mg2+ were likely to present in the form of CaCl2 and MgCl2.
For the organic species during the pollution period (Table S5), the mean OC concentrations were 23.8 ± 8.0, 26.9 ± 8.3, and 27.1 ± 11.5 μg/m3, and the mean EC concentrations were 6.8 ± 2.8, 6.9 ± 2.6, and 7.5 ± 3.4 μg/m3. The OC/EC ratios were approximately 4.0 (3.7 ± 0.7, 4.2 ± 1.1, and 3.9 ± 1.1 in NJ, SZ, and LA, respectively). On clean (rainy) days, the mean OC concentrations were 11.0 ± 5.3, 18.0 ± 9.7 and 9.8 ± 3.4 μg/m3, respectively, and the mean EC concentrations were 2.7 ± 1.5, 3.2 ± 1.8 and 2.4 ± 1.1 μg/m3, respectively, while the OC/EC ratios increased to 4.5 ± 1.2, 5.7 ± 1.8 and 4.9 ± 1.8, respectively, in NJ, SZ, and LA. The lower OC/EC ratios on polluted days might be due to larger amounts of local fresh primary pollutants emitted into the ambient air and the reduced age of the sampled particles [37]. Zhang et al. [38], who extensively monitored the carbonaceous aerosol composition over China, reported that the OC/EC ratio was approximately 3.0 at urban locations but could reach 6.0 at rural sites. However, those results indicate that the OC/EC ratios at urban, suburban and regional sites were comparable, and secondary organic aerosols were significantly present over the YRD.

3.2. Source Apportionment of Fine Particles

3.2.1. Overall Source Apportionment

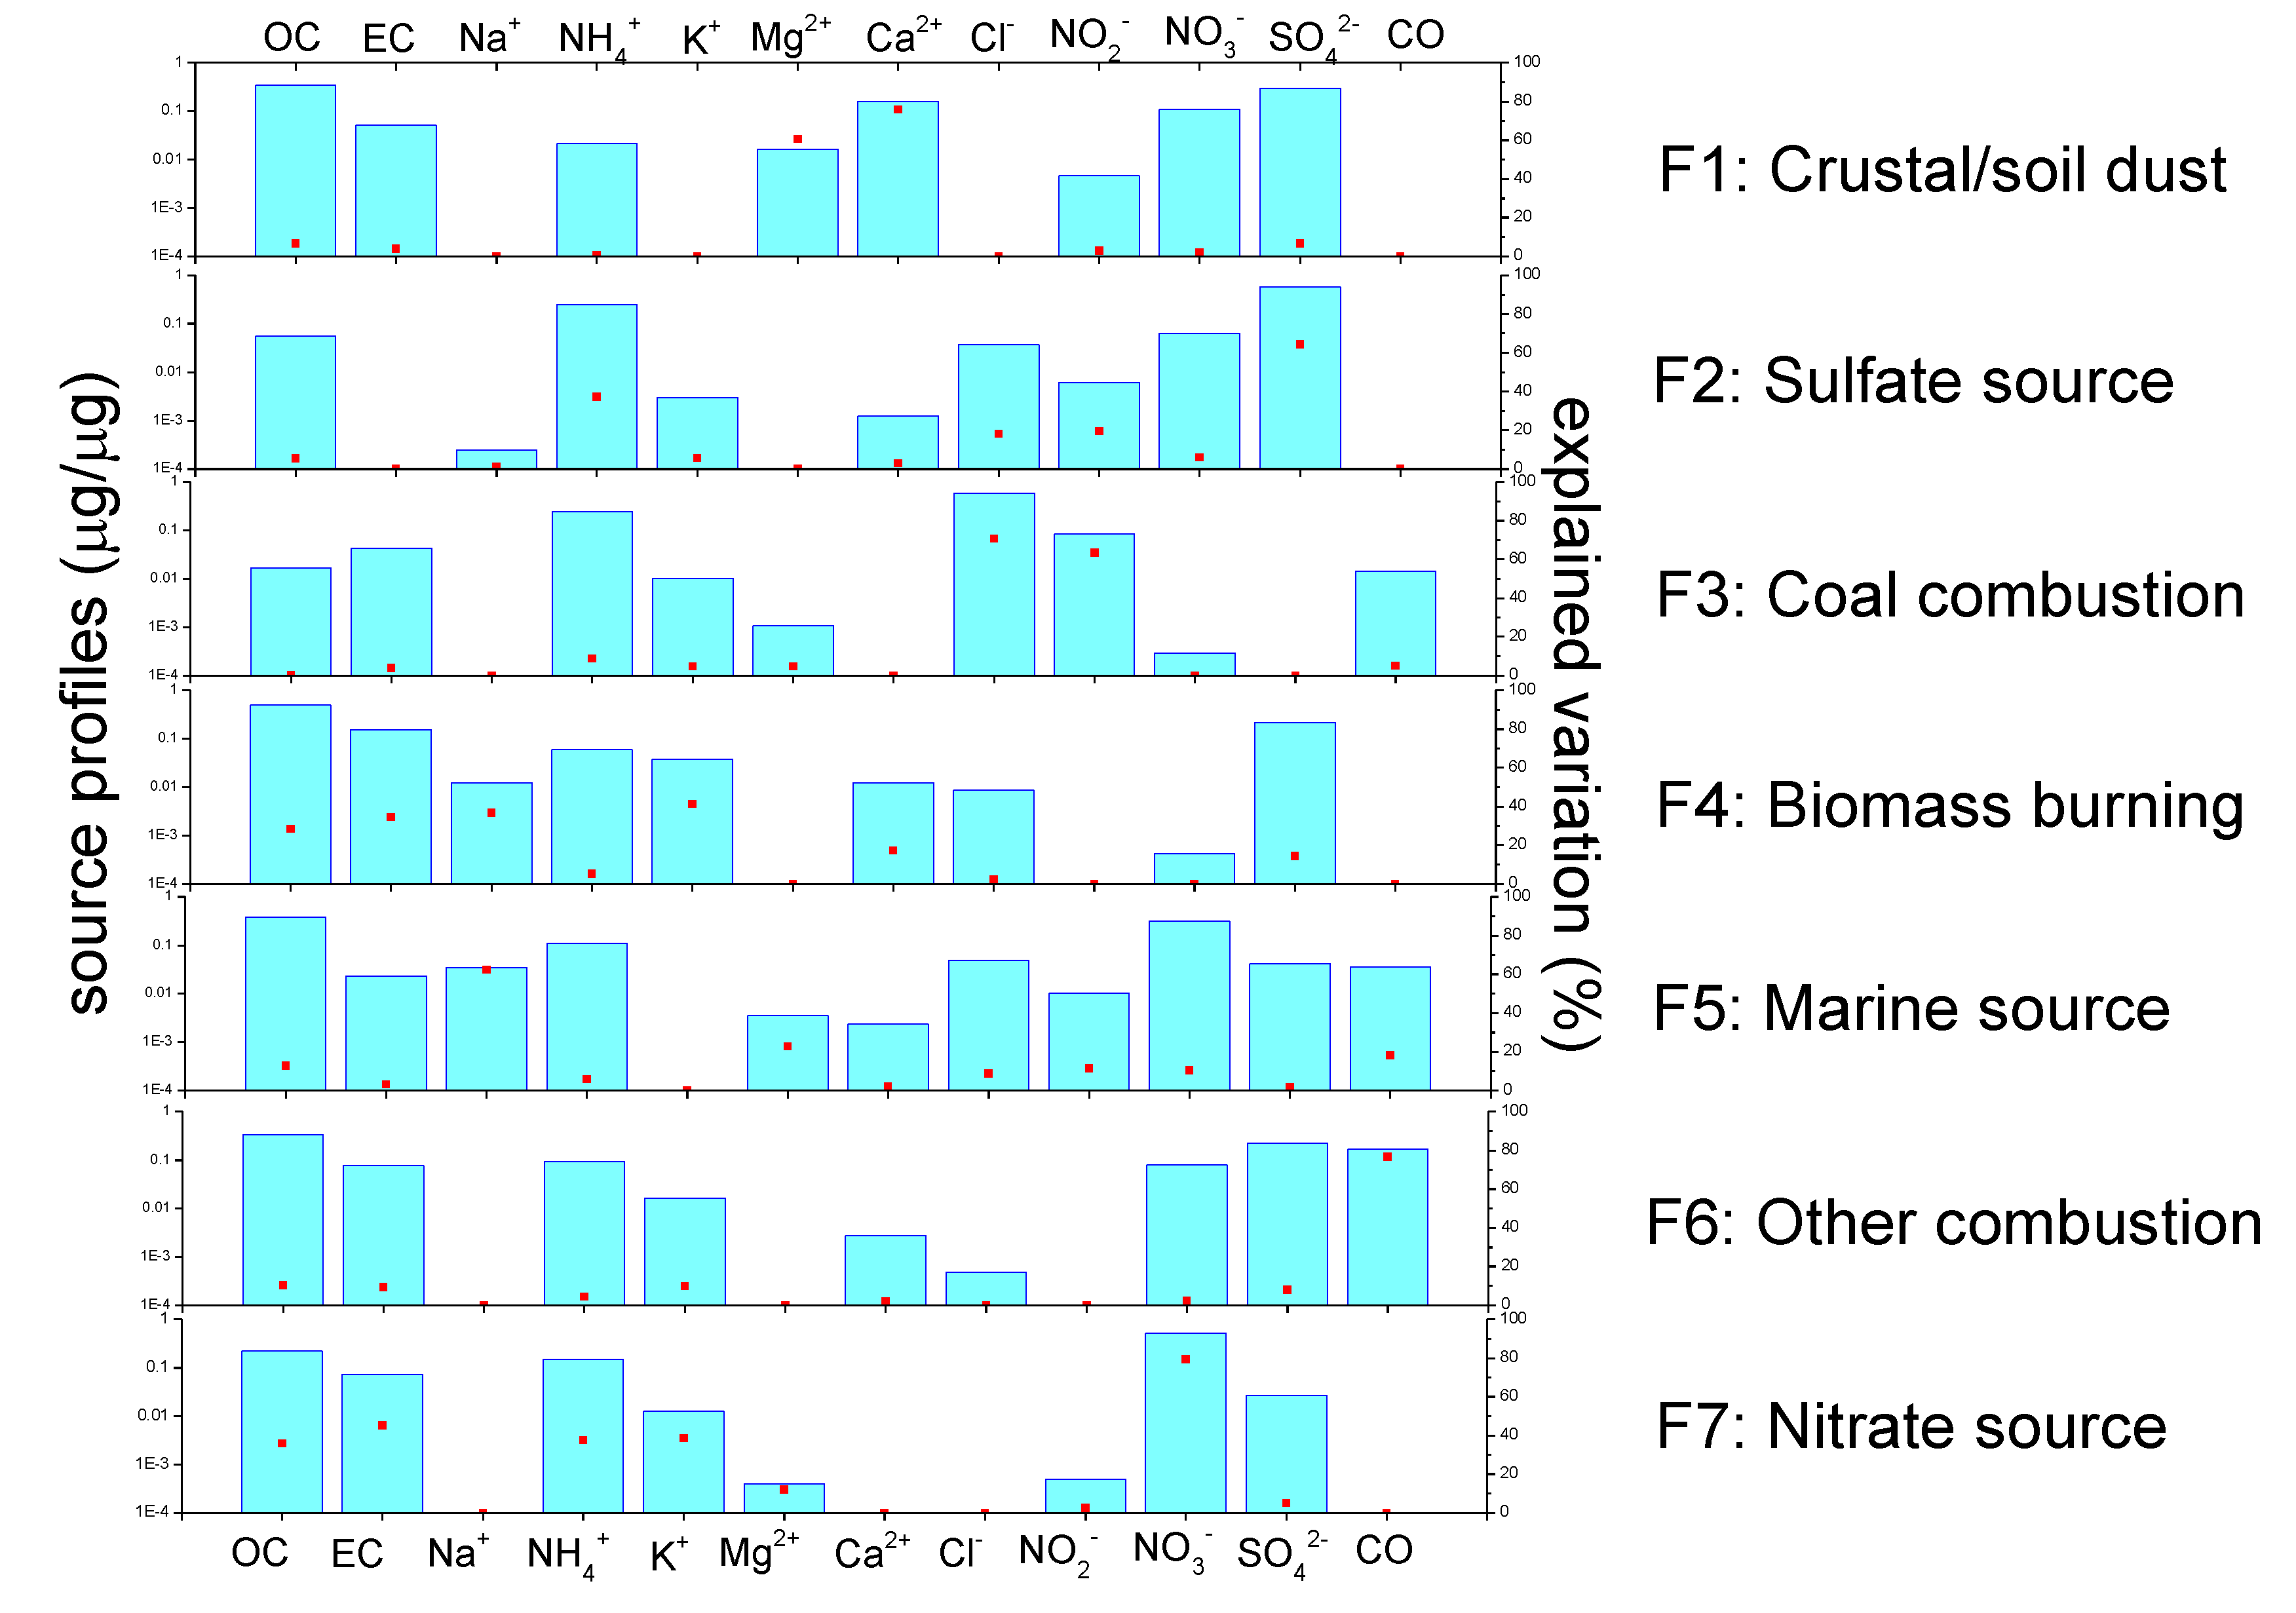
The aforementioned CD values demonstrate the data similarity of the three sites, as a result, the 179 samples could be lumped together as input for the EPA PMF model. To better interpret the corresponding sources, the CO concentration (a product of incomplete combustion and relatively stable in air) was included in the input file [39]. Several factor numbers were tested, and seven factors provided the best fit. The correlation ratios between the modeled and observed species concentrations were all above 0.87. After evaluating the stability of the obtained solution, the source profiles and explained variations (EVs) are shown in Figure 3.
The high EVs of Ca2+ and Mg2+ in factor 1 indicate a crustal/soil dust source. Factor 2, which accounted for 59% of SO42− and 44% of NH4+, is dominated by a secondary sulfate source. Factor 3 is associated with almost 73% of the Cl concentration. Cl is a combustion marker, especially coal combustion, which is widely used in power plants [40]. Thus, factor 3 is regarded as coal combustion. Factor 4 is highly associated with K+, EC, and OC. K+ is a typical component of biomass burning. Therefore, factor 4 is regarded as biomass combustion. Factor 5 is loaded on Na+, which is usually deemed a sea salt source. Hence, factor 5 is considered a marine source. Factor 6 is characterized by a high contribution to CO and is interpreted as other combustion (such as vehicle engine combustion and trash burning). Factor 7 is primarily loaded on NO3 and NH4+, indicating a secondary nitrate source. The source apportionment of the PM2.5 sampled at all three sites shows that secondary nitrate and sulfate sources account for 38% and 23%, respectively, followed by biomass combustion (14%), marine (8%), other combustion (7%) and crustal/soil dust sources (5%). Hua et al. [41] suggested that the PM2.5 during a fall haze episode in the YRD mainly came from secondary pollutants and primary emissions of vehicles and biomass burning, which was similar as in this paper.

3.2.2. Polluted vs. Clean Days

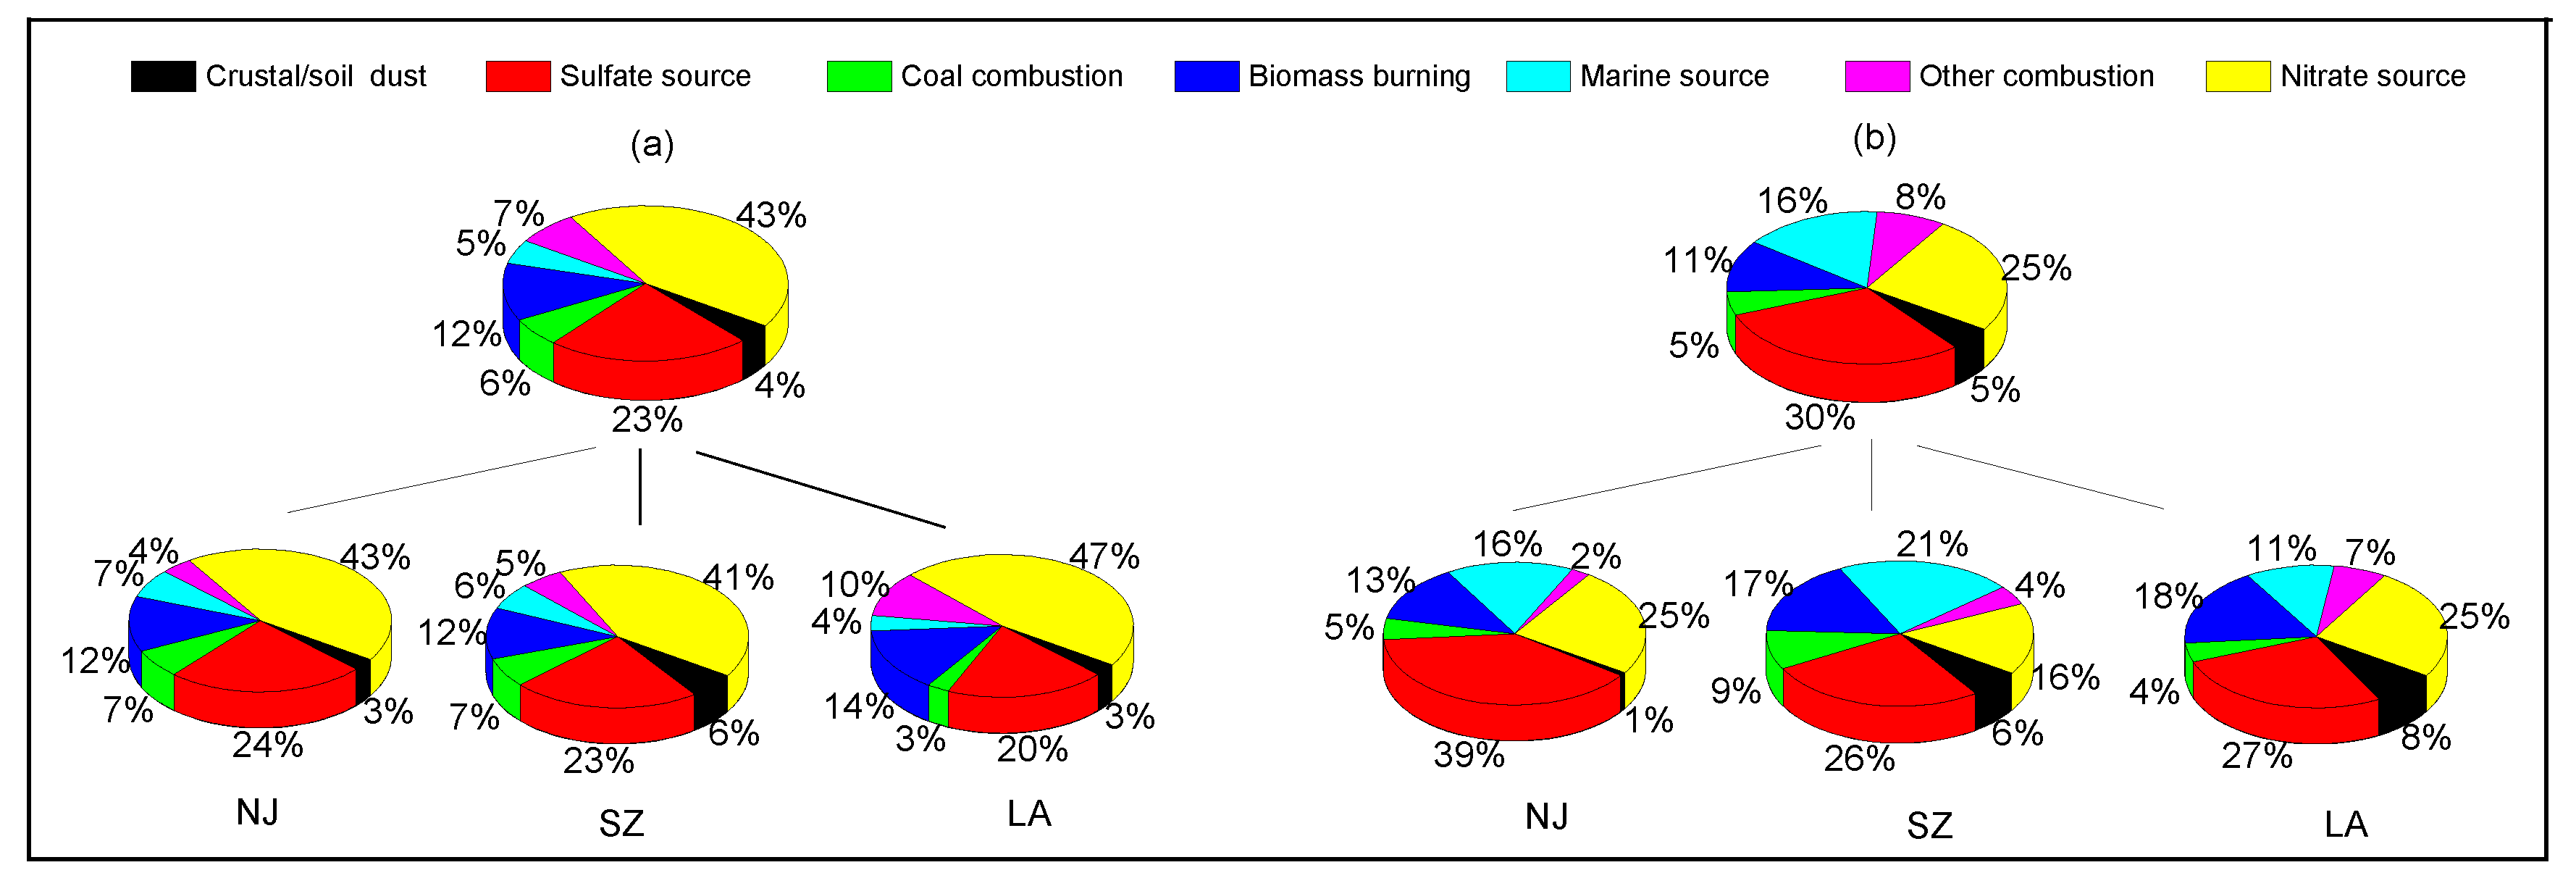
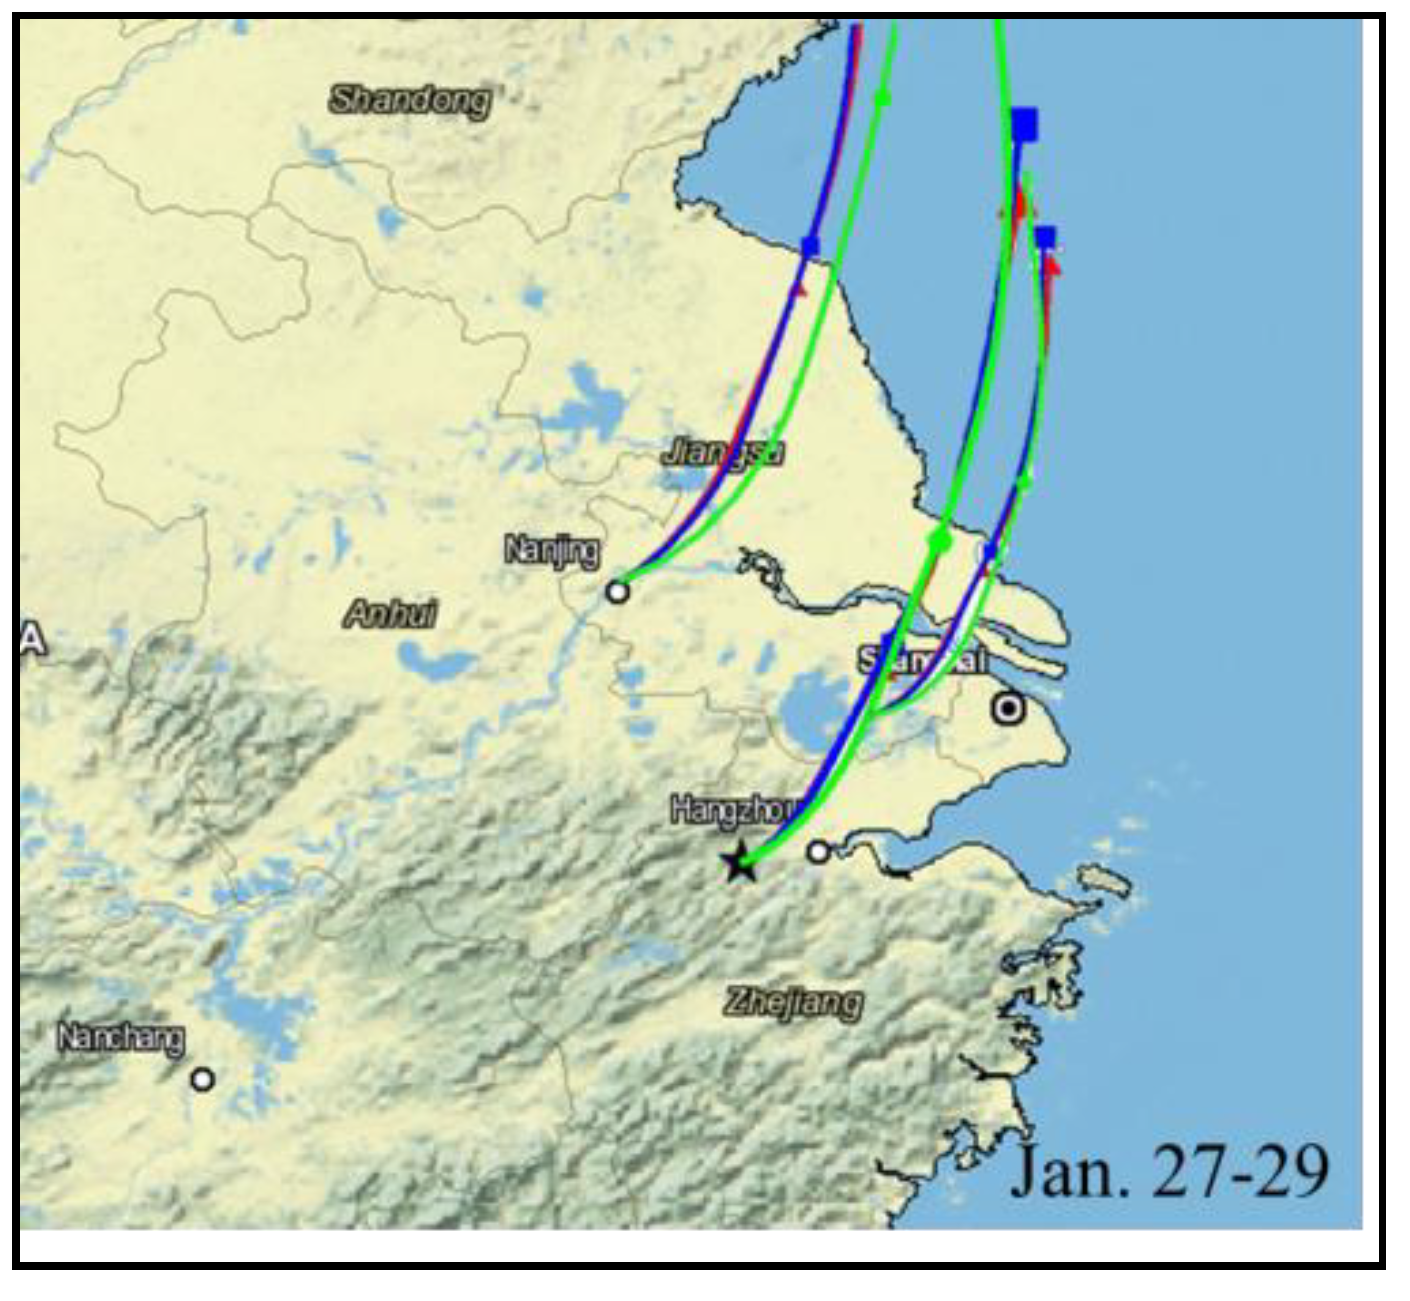
The source contribution of each sample can be obtained from the PFM results, and source apportionments of PM2.5 at each site during different pollution periods can be calculated according to the sampling time. The source contributions on polluted days were significantly distinct from those on clean (rainy) days (Figure 4). Both the nitrate and sulfate can be scavenged by precipitation on the rainy days. However, the contribution rates show that the nitrate source decreased from 43% to 25%, whereas the sulfate source increased from 23% to 30% on rainy days. In the meantime, the marine source contribution increased from 5% to 16% on rainy days. In addition, the average mass concentration ratios of SO42−/PM2.5 and Na+/PM2.5 were 0.18 and 0.004 in the pollution period, and increased to 0.21 and 0.008 on rainy days. Both Na+ and SO42− stem from ocean sprays and marine biogenic sources [42]. The 24-h backward trajectories during 27–29 January illustrate that the air masses all came from the sea (Figure 5). Those results indicate that marine air masses have a notable effect on the chemical composition of PM2.5 on rainy days. A similar phenomenon regarding the marine source contribution to PM2.5 in NJ was also identified by using a single-particle aerosol mass spectrometer [43].

3.2.3. Comparison between the Sites

Figure 4 also shows that there are differences in the source contributions within the YRD. During the polluted period, the open burning source (biomass burning + other combustion) in LA (24%) contributed more compared with the other two sites (16%–17%) during the polluted period. The fire map illustrates that intensive open burning (such as biomass burning and trash combustion) was observed in the southwest of the YRD. The fire map and the cluster analysis results are combined in Figure 6. Cluster analysis of the 48-h backward trajectories shows that 65% of the air masses moving to LA came from the southwest direction, while only 27% and 30% of the air masses moved to SZ and NJ, respectively. It suggests that the larger contribution of open burning in LA occurred because more air masses were transported from the combustion zones in the southwest, thereby bringing more combustion products. On the clean days, the marine source was enhanced in SZ (21%) compared with NJ (16%) and LA (11%), probably because the SZ site was the nearest to the sea along the identified air mass trajectories (Figure 5).

4. Conclusions

Regional-scale field observations of PM2.5 over the YRD were carried out from 15 to 30 January 2015. We found that the temporal variations in the meteorological conditions and PM2.5 concentrations exhibited temporal synchronization among the urban, suburban and background regional sites. The CD values reveal that data at the three sites were the spatial homogeneous. From 15 to 26 January, the YRD suffered severe PM2.5 regional-scale pollution (147.5–166.5 μg/m3) resulting from long-range transport due to a cold front moving through and local accumulation due to high-pressure control. From 27 to 30 January, an intermittent rain event significantly scavenged the airborne PM2.5, thus decreasing the ambient PM2.5 concentrations (63.7–71.1 μg/m3) below the standard for a class II region according to the CNAAQS.
Secondary inorganic ions (SO42+, NO3, and NH4+) were dominant in the ionic composition, and the SNA/PM2.5 ratios were higher at the urban and suburban sites (~45%) than at the regional background site (40%). The nss-SO42−, nss-K+ account for 90~99% of their soluble particulate ions, while nss-Cl were 79~88%. The elevated Cl/Na+ and Cl/K+ ratios and the nss-Cl/Cl ratios indicate that the high Cl concentrations mainly resulted from anthropogenic emissions. The total anions and total cations at the three sites were in charge balance, and nitrate and sulfate were predominantly present in the form of (NH4)2SO4 and NH4NO3. The OC/EC ratios were higher in daytime than at night (p = 0.007 < 0.05), indicating the secondary OC formation were more intensive in daytime. In addition, the OC/EC ratios were lower on polluted days than on clean (rainy) days.
The source apportionment of PM2.5 over the YRD illustrates that secondary nitrate and sulfate formation were the principal sources. On clean (rainy) days, the concentration ratios of SO42−/PM2.5 and Na+/PM2.5 increased, the marine and sulfate sources were distinctly enhanced. The 24-h backward trajectories illustrate that the air masses all came from the sea, indicating that marine air masses notably affect the chemical composition of PM2.5 on rainy days. On polluted days, the open burning source contributed more in LA because more air masses (65%) were transported from combustion zones in the southwest YRD. In addition, SZ experiences an enhanced marine source because SZ is the nearest to the sea along the identified air mass trajectories.
In general, PM2.5 pollution across the different sites was synchronized, and the concentrations were spatial homogeneous, revealing that the pollution over the YRD is regional. However, this study also revealed distinguishing characteristics between these sites in their chemical components and source apportionment results due to geographical distribution of sampling sites. These results could be helpful in PM2.5 pollution control and evaluation over the YRD.

Supplementary Materials

The following are available online at https://www.mdpi.com/2073-4433/11/7/720/s1.

Author Contributions

L.X. analyzed the data and wrote the manuscript; H.W., H.K. and J.A. collected the data, coordinated the data-analysis; B.Z. and H.W. revised the paper. All authors have read and agreed to the published version of the manuscript.

Acknowledgments

This work is supported by the National Key Research and Development Program of China (2016YFA0602003) and the National Natural Science Foundation of China (Grant No. 41575148).

Conflicts of Interest

The authors declare no conflict of interest.

References

  1. Han, L.J.; Zhou, W.Q.; Li, W.F.; Li, L. Impact of urbanization level on urban air quality: A case of fine particles (PM2.5) in Chinese cities. Environ. Pollut. 2014, 194, 163–170. [Google Scholar] [CrossRef] [PubMed]
  2. Pan, Y.P.; Tian, S.; Li, X.; Sun, Y.; Li, Y.; Wentworth, G.R.; Wang, Y.S. Trace elements in particulate matter from metropolitan regions of Northern China: Sources, concentrations and size distributions. Sci. Total Environ. 2015, 537, 9–22. [Google Scholar] [CrossRef] [PubMed]
  3. Kong, H.; Lin, J.; Zhang, R.; Liu, M.; Weng, H.; Ni, R.; Chen, L.; Wang, J.; Yan, Y.; Zhang, Q. High-resolution (0.05° ×  0.05°) NOx emissions in the Yangtze River Delta inferred from OMI. Atmos. Chem. Phys. 2019, 19, 12835–12856. [Google Scholar] [CrossRef] [Green Version]
  4. Lin, J.; Pan, D.; Zhang, R. Trend and interannual variability of Chinese air pollution since 2000 in association with socioeconomic development: A brief overview. Atmos. Ocean. Sci. Lett. 2013, 6, 84–89. [Google Scholar]
  5. Song, C.; He, J.; Wu, L.; Jin, T.; Chen, X.; Li, R.; Mao, H. Health burden attributable to ambient PM2.5 in China. Environ. Pollut. 2017, 223, 575–586. [Google Scholar] [CrossRef]
  6. Deng, J.; Wang, T.; Jiang, Z.; Xie, M.; Zhang, R.; Huang, X.; Zhu, J. Characterization of visibility and its affecting factors over Nanjing, China. Atmos. Res. 2011, 101, 681–691. [Google Scholar] [CrossRef]
  7. Liang, C.S.; Duan, F.K.; He, K.B.; Ma, Y.L. Review on recent progress in observations, source identifications and countermeasures of PM2.5. Environ. Int. 2016, 86, 150–170. [Google Scholar] [CrossRef]
  8. Huang, R.J.; Zhang, Y.; Bozzetti, C.; Ho, K.F.; Cao, J.J.; Han, Y.; Daellenbach, K.R.; Slowik, J.G.; Platt, S.M.; Canonaco, F.; et al. High secondary aerosol contribution to particulate pollution during haze events in China. Nature 2014, 514, 218–222. [Google Scholar] [CrossRef] [Green Version]
  9. Zheng, J.; Hu, M.; Peng, J.F.; Wu, Z.J.; Kumar, P.; Li, M.G.; Wang, Y.J.; Guo, S. Spatial distributions and chemical properties of PM2.5 based on 21 field campaigns at 17 sites in China. Chemosphere 2016, 159, 480–487. [Google Scholar] [CrossRef] [Green Version]
  10. Wang, Y.; Yao, L.; Wang, L.; Liu, Z.; Ji, D.; Tang, G.; Zhang, J.; Sun, Y.; Hu, B.; Xin, J. Mechanism for the formation of the January 2013 heavy haze pollution episode over central and eastern China. Sci. China Earth Sci. 2013, 57, 14–25. [Google Scholar] [CrossRef]
  11. Wang, H.; Xu, J.; Zhang, M.; Yang, Y.; Shen, X.; Wang, Y.; Chen, D.; Guo, J. A study of the meteorological causes of a prolonged and severe haze episode in January 2013 over central-eastern China. Atmos. Environ. 2014, 98, 146–157. [Google Scholar] [CrossRef]
  12. Li, H.; Wang, Q.G.; Yang, M.; Li, F.Y.; Wang, J.H.; Sun, Y.X.; Wang, C.; Wu, H.F.; Qian, X. Chemical characterization and source apportionment of PM2.5 aerosols in a megacity of Southeast China. Atmos. Res. 2016, 181, 288–299. [Google Scholar] [CrossRef]
  13. Ye, Z.; Li, Q.; Ma, S.; Zhou, Q.; Gu, Y.; Su, Y.; Chen, Y.; Chen, H.; Wang, J.; Ge, X. Summertime day-night differences of PM2.5 components (inorganic ions, OC, EC, WSOC, WSON, HULIS, and PAHs) in Changzhou, China. Atmosphere 2017, 8, 189. [Google Scholar] [CrossRef] [Green Version]
  14. An, J.; Duan, Q.; Wang, H.; Miao, Q.; Shao, P.; Wang, J.; Zou, J. Fine particulate pollution in the Nanjing northern suburb during summer: Composition and sources. Environ. Monit. Assess. 2015, 187, 561. [Google Scholar] [CrossRef]
  15. Qiao, T.; Zhao, M.F.; Xiu, G.L.; Yu, J.Z. Simultaneous monitoring and compositions analysis of PM1 and PM2.5 in Shanghai: Implications for characterization of haze pollution and source apportionment. Sci. Total Environ. 2016, 557–558, 386–394. [Google Scholar] [CrossRef] [PubMed]
  16. Feng, J.; Hu, J.; Xu, B.; Hu, X.; Sun, P.; Han, W. Characteristics and seasonal variation of organic matter in PM2.5 at a regional background site of the Yangtze River Delta region, China. Atmos. Environ. 2015, 123, 288–297. [Google Scholar] [CrossRef]
  17. Wang, H.; Zhu, B.; Shen, L.; Xu, H.H.; An, J.; Xue, G.Q.; Cao, J. Water-soluble ions in atmospheric aerosols measured in five sites in the Yangtze River Delta, China: Size-fractionated, seasonal variations and sources. Atmos. Environ. 2015, 123, 370–379. [Google Scholar] [CrossRef]
  18. Paatero, P.; Eberly, S.; Brown, S.G.; Norris, G.A. Methods for estimating uncertainty in factor analytic solutions. Atmos. Meas. Tech. 2014, 7, 781–797. [Google Scholar] [CrossRef] [Green Version]
  19. Lau, A.K.H.; Yuan, Z.; Yu, J.Z.; Louie, P.K.K. Source apportionment of ambient volatile organic compounds in Hong Kong. Sci. Total Environ. 2010, 408, 4138–4149. [Google Scholar] [CrossRef]
  20. Brown, S.G.; Eberly, S.; Paatero, P.; Gary, A.N. Methods for estimating uncertainty in PMF solutions: Examples with ambient air and water quality data and guidance on reporting PMF results. Sci. Total Environ. 2015, 518–519, 626–635. [Google Scholar] [CrossRef] [Green Version]
  21. Norris, G.; Brown, S. EPA Positive Matrix Factorization (PMF) 5.0 Fundamentals and User Guide; EPA PMF 5.0 Man; US Environmental Protection Agency: Washington, DC, USA, 2014.
  22. Draxler, R.R.; Hess, G.D. Description of the HYSPLIT-4 Modeling System; NOAA Technical Memorandum ERL ARL-224; NOAA Air Resources Laboratory: Silver Spring, MD, USA, 1997; pp. 1–24.
  23. Dorling, S.R.; Davies, T.D.; Piece, C.E. Cluster analysis: A technique for estimating the synoptic meteorological controls on air and precipitation chemistry—Method and applications. Atmos. Environ. 1992, 26, 2575–2581. [Google Scholar] [CrossRef]
  24. Ministry of Environmental Protection of the People’s Republic of China. Release of the New Ambient Air Quality Standard (GB3095-2012). Available online: http://kjs.mep.gov.cn/hjbhbz/bzwb/dqhjbh/dqhjzlbz/201203/W020120410330232398521.pdf (accessed on 22 November 2019).
  25. Cesari, D.; Donateo, A.; Conte, M.; Merico, E.; Giangreco, A.; Giangreco, F.; Contini, D. An inter-comparison of PM2.5 at urban and urban background sites: Chemical characterization and source apportionment. Atmos. Res. 2016, 174–175, 106–119. [Google Scholar] [CrossRef]
  26. Wongphatarakul, V.; Friedlander, S.; Pinto, J. A comparative study of PM2.5 ambient aerosol chemical databases. Environ. Sci. Technol. 1998, 32, 3926–3934. [Google Scholar] [CrossRef]
  27. Feng, J.; Hu, M.; Chan, C.K.; Lau, P.S.; Fang, M.; He, L.; Tang, X. A comparative study of the organic matter in PM2.5 from three Chinese megacities in three different climatic zones. Atmos. Environ. 2006, 40, 3983–3994. [Google Scholar] [CrossRef]
  28. Wang, Q.Q.; Huang, X.H.H.; Zhang, T.; Zhang, Q.Y.; Feng, Y.M.; Yuan, Z.B.; Wu, D.; Lau, A.K.H.; Yu, J.Z. Organic tracer-based source analysis of PM2.5 organic and elemental carbon: A case study at Dongguan in the Pearl River Delta, China. Atmos. Environ. 2015, 118, 164–175. [Google Scholar] [CrossRef]
  29. Kang, H.; Zhu, B.; Gao, J.; He, Y.; Wang, H.; Su, J.; Yu, B. Potential impacts of cold frontal passage on air quality over the Yangtze River Delta, China. Atmos. Chem. Phys. 2019, 19, 3673–3685. [Google Scholar] [CrossRef] [Green Version]
  30. Morales, J.A.; Pirela, D.; De Nava, M.G.; De Borrego, B.S.; Velásquez, H.; Durán, J. Inorganic water soluble ions in atmospheric particles over Maracaibo Lake Basin in the western region of Venezuela. Atmos. Res. 1998, 46, 307–320. [Google Scholar] [CrossRef]
  31. Zhang, Y.; Huang, W.; Cai, T.; Fang, D.; Wang, Y.; Song, J. Concentrations and chemical compositions of fine particles (PM2.5) during haze and non-haze days in Beijing. Atmos. Res. 2016, 174–175, 62–69. [Google Scholar] [CrossRef]
  32. Chester, R. Marine Geochemistry; Cambridge University Press: London, UK, 1990; 698p. [Google Scholar]
  33. Yao, X.H.; Chan, C.K.; Fang, M.; Cadle, S.; Chan, T.; Mulawa, P.; He, K.B.; Ye, B.M. The water-soluble ionic composition of PM2.5 in Shanghai and Beijing, China. Atmos. Environ. 2002, 36, 4223–4234. [Google Scholar] [CrossRef]
  34. Li, G.; Chen, J.; Chen, Y.; Yang, J.; Ji, J.; Liu, L. Dolomite as a tracer for the source regions of Asian dust. J. Geophys. Res. 2007, 112, D17201. [Google Scholar] [CrossRef]
  35. Squizzato, S.; Masiol, M.; Brunelli, A.; Pistollato, S.; Tarabotti, E.; Rampazzo, G. Factors determining the formation of secondary inorganic aerosol: A case study in the Po Valley (Italy). Atmos. Chem. Phys. 2013, 13, 1927–1939. [Google Scholar] [CrossRef] [Green Version]
  36. Zhang, R.; Jing, J.; Tao, J.; Hsu, S.-C.; Wang, G.; Cao, J.; Lee, C.S.L.; Zhu, L.; Chen, Z.; Zhao, Y.; et al. Chemical characterization and source apportionment of PM2.5 in Beijing: Seasonal perspective. Atmos. Chem. Phys. 2013, 13, 7053–7074. [Google Scholar] [CrossRef] [Green Version]
  37. Cheng, Y.F.; Su, H.; Rose, D.; Gunthe, S.S.; Berghof, M.; Wehner, B.; Achtert, P.; Nowak, A.; Takegawa, N.; Shiraiwa, M.; et al. Size-resolved measurement of the mixing state of soot in the megacity Beijing, China: Diurnal cycle, aging and parameterization. Atmos. Chem. Phys. Discuss. 2011, 11, 32161–32204. [Google Scholar] [CrossRef]
  38. Zhang, X.Y.; Wang, Y.Q.; Zhang, X.C.; Guo, W.; Gong, S.L. Carbonaceous aerosol composition over various regions of China during 2006. J. Geophys. Res. 2008, 113, D14111. [Google Scholar] [CrossRef]
  39. Geng, F.; Cai, C.; Tie, X.; Yu, Q.; An, J.; Peng, L.; Zhou, G.Q.; Xu, J. Analysis of VOC emissions using PCA/APCS receptor model at city of Shanghai, China. J. Atmos. Chem. 2010, 62, 229–247. [Google Scholar] [CrossRef]
  40. Yudovich, Y.E.; Ketris, M.P. Chlorine in coal: A review. Int. J. Coal Geol. 2006, 67, 127–144. [Google Scholar] [CrossRef]
  41. Hua, Y.; Cheng, Z.; Wang, S.; Jiang, J.; Chen, D.; Cai, S.; Fu, X.; Fu, Q.; Chen, C.; Xu, B.; et al. Characteristics and source apportionment of PM2.5 during a fall heavy haze episode in the Yangtze River Delta of China. Atmos. Environ. 2015, 123, 380–391. [Google Scholar] [CrossRef]
  42. Seinfeld, J.H.; Pandis, S.N. Atmospheric Chemistry and Physics: From Air Pollution to Climate Change; Wiley: Hoboken, NJ, USA, 2006. [Google Scholar]
  43. Hu, R.; Wang, H.; Yin, Y.; Chen, K.; Zhu, B.; Zhang, Z. Mixing state of ambient aerosols during different fog-haze pollution episodes in the Yangtze River Delta, China. Atmos. Environ. 2018, 178, 1–10. [Google Scholar] [CrossRef]
Figure 1. Surface weather patterns and locations of the sampling sites (the red square area represents the YRD, and the red stars represent the sampling sites).
Atmosphere 11 00720 g001
Figure 2. The temporal variations in the meteorological conditions and PM2.5 concentration in NJ.
Atmosphere 11 00720 g002
Figure 3. Simulated source profiles (blue bars, in units of μg/μg) and explained variations (red squares, in units of %) of PM2.5 species via PMF(Positive Matrix Factorization).
Atmosphere 11 00720 g003
Figure 4. Source apportionment of the fine particles on polluted (a) and clean (b) days.
Atmosphere 11 00720 g004
Figure 5. The 24-h backward trajectories for each site from 27–29 January (the red, blue and green lines represent the trajectories at 50, 100 and 500 m above ground level (AGL), respectively).
Atmosphere 11 00720 g005
Figure 6. Cluster analysis of the 48-h backward trajectories combined with the fire map during the polluted period in NJ, SZ, and LA.
Atmosphere 11 00720 g006