Article

Measurements of Indoor and Outdoor Fine Particulate Matter during the Heating Period in Jinan, in North China: Chemical Composition, Health Risk, and Source Apportionment

1
School of Water Conservancy and Environment, University of Jinan, Jinan 250022, China
2
Jinan Ecological Environment Monitoring Center, Jinan 250101, China
3
College of Oceanic and Atmospheric Sciences, Ocean University of China, Qingdao 266100, China
*
Author to whom correspondence should be addressed.
Atmosphere 2020, 11(9), 885; https://doi.org/10.3390/atmos11090885
Submission received: 23 July 2020 / Revised: 14 August 2020 / Accepted: 15 August 2020 / Published: 20 August 2020
(This article belongs to the Section Air Quality)

Abstract

:
Fine particulate matter (PM2.5) was simultaneously collected from the indoor and outdoor environments in urban area of Jinan in North China from November to December 2018 to evaluate the characteristics and sources of indoor PM2.5 pollution. The concentrations of indoor and outdoor PM2.5 were 69.0 ± 50.5 µg m−3 and 128.7 ± 67.9 µg m−3, respectively, much higher than the WHO-established 24-h standards for PM2.5, indicating serious PM2.5 pollution of indoor and outdoor environments in urban Jinan. SO42−, NO3, NH4+, and organic carbon (OC) were the predominant components, which accounted for more than 60% of the PM2.5 concentration. The total elemental risk values in urban Jinan for the three highly vulnerable groups of population (children (aged 2–6 years and 6–12 years) and older adults (≥70 years)) were nearly 1, indicating that exposure to all of the elements in PM2.5 had potential non-carcinogenic risks to human health. Further analyses of the indoor/outdoor concentration ratios, infiltration rates (FINF), and indoor-generated concentration (Cig) indicated that indoor PM2.5 and its major chemical components (SO42−, NO3, NH4+, OC, and elemental carbon) were primarily determined by outdoor pollution. The lower indoor NO3/SO42− ratio and FINF of NO3 relative to the outdoor values were due to the volatility of NO3. Positive matrix factorization (PMF) was performed to estimate the sources of PM2.5 using the combined datasets of indoor and outdoor environments and revealed that secondary aerosols, dust, cement production, and coal combustion/metal smelting were the major sources during the sampling period.

1. Introduction

Epidemiological and toxicological studies have repeatedly shown that fine particulate matter (PM2.5) is linked with increased health risk, such as respiratory illness, cardiovascular diseases, Alzheimer’s disease, and increased mortality [1,2,3]. The toxicity of PM2.5 is closely associated with its chemical composition (e.g., water-soluble ions, organic carbon (OC) to elemental carbon (EC) ratio, trace elements, and polycyclic aromatic hydrocarbons (PAHs)) [4,5]. Previous studies of PM2.5 and its chemical characteristics have mostly focused on the outdoor atmosphere rather than indoor environments [6,7,8,9,10,11]. Some studies have shown that urban population spends ~80% of time indoors [12,13]; therefore, it is of particular importance to make clear the characteristics of indoor PM2.5 pollution and to evaluate the effect on human health.
Indoor PM2.5 has recently begun to receive research attention, following the detection of some gaseous pollutants in indoor environments (e.g., formaldehyde, NO2, volatile organic compounds) [14,15,16,17,18,19,20,21], and studies on PM2.5 have shown that indoor PM levels exceed the limit recommended by the WHO and the air quality standards of many nations [19,22,23,24,25,26,27,28,29]. However, these studies were focused on residential houses, school rooms, and hospital rooms [29,30,31,32,33]. Most urban office workers spend a considerable part of their working day in an office [5,27,34], yet only a few PM2.5 studies focused on workplace offices in the past decade. The concentrations of PM2.5 and its chemical components in a typical indoor environment are significantly affected by the outdoor sources, in addition to the individual indoor sources (e.g., electronic equipment discharge, air conditioners, and human activity) [5,26,29,35,36]. Therefore, to obtain the sources of indoor PM2.5, it is fundamental to investigate the relationship between indoor and outdoor PM2.5 components, which is usually evaluated by combining the I/O ratio (i.e., the ratio of indoor and outdoor mass concentrations), and the permeability coefficient (i.e., FINF, the fraction of outdoor particles that enter indoor and remain suspended) [26,28,37,38,39]. The I/O ratio is simple and can provide a preliminary evaluation of the relation between indoor and outdoor PM2.5 [17,40]. However, this parameter is affected by other factors (e.g., air exchange rate, particle penetration factor, outdoor particle concentration, season variety) [37,40] and cannot quantify the contribution of the two types of sources (i.e., outdoor and individual indoor sources) which function can be implemented by the permeability coefficient (FINF). By combining the I/O ratio and the FINF methods, Zwoździak et al. [41] found that in a middle school in Poland, Zn, Pb, and S in PM2.5 were mainly transmitted from outdoor to indoor, whereas Si, Ca, Ti, Sr, and As originated from independent indoor sources. Sangiorgi et al. [5] found that PM2.5, SO42−, NO3, and NH4+ had no indoor sources in a typical office in Milan. To date, although several studies have investigated the indoor PM2.5 components and their sources (e.g., OC and EC [22,42], OC, EC, S, Ca, K, and V [43,44], and PAHs [29,45]), the contribution of outdoor sources to the indoor PM2.5 pollution in polluted environments in North China remains unclear. Comprehensive and systematic evaluation is required to fill this knowledge gap.
As the capital of Shandong Province in the North China Plain, Jinan has experienced heavy PM2.5 pollution in both indoor and outdoor environments in the last few years [24,26]. In recent years, the PM2.5 and SO42− concentrations have rapidly decreased due to the stringent control of SO2 emissions [46,47]; however, NO3 concentrations have exhibited an increasing trend in the outdoor environment in Jinan [46,47,48], which could have an influence on indoor PM2.5 pollution. In this study, sample collection and chemical analysis of aerosol in an office and outdoor environment were synchronously performed in Jinan to investigate the characteristics and main sources of indoor PM2.5, and assess its human health risk using the data of constituent elements. The results of this study were also compared with those of the previous studies conducted in Jinan to identify the variations of indoor and outdoor PM2.5 pollution.

2. Experiment and Methodology

2.1. Sample Site and Chemical Analysis

The measurements were synchronously conducted in a typical office room and the outdoor atmosphere in an urban area in Jinan (36°69′ N, 117°06′ E) from 12 November to 5 December 2018 (Figure 1). The outdoor PM2.5 samples were collected on the rooftop (approximately 20 m above ground level) of a six-story office building on the west campus in the University of Jinan, whereas an office room on the second floor of the same office building was selected for indoor sampling. The building is more than 20 years old and has not been decorated or furnished in the last 10 years. The room has two sliding windows facing the street and one door opening into the corridor. During the sampling period, the office was empty and the windows were closed without any natural and mechanical ventilation. The door was always closed throughout the sampling process, although students entered and exited the room daily to collect samples. The sampling site is surrounded by residential and commercial areas. There are two major roads nearby (~500 m away) that frequently have heavy traffic, viz., ErHuan South Road in the south and Nanxinzhuang West Road in the west. The inlets for PM2.5 collection were set 1.5 m above the floor.
PM2.5 samples were collected manually on quartz fiber filters (90 mm in diameter with a 2 μm pore size; Pall, NY, USA) using an intelligent sampler (Model TH-150A, Wuhan Tianhong Corporation, Wuhan, China) at a flow rate of 100 L/min. Most samples were collected in two 12-h phases in a day (around 7:30–19:00 and 19:30–7:30), and in a single 24-h phase (from 7:30 to 7:00 the next day). Finally, 34 sets of PM2.5 samples (7 sets for 24 h, 26 sets for 12 h, and 1 blank sample) were collected from both indoor and outdoor environments. The filter was mounted on the sampler for 24-h to collect the blank sample when the sampler was not operated, and the blank sample was processed simultaneously with the field samples. Before sampling, the quartz filters were baked in a muffle oven at 600 °C for 4 h, and after sampling, all of the filters were kept in plastic Petri dishes and then stored in a freezer at −4 °C.
To obtain the mass concentrations of PM2.5, the filters were weighed before and after sampling with a Sartorius ME 5-F electronic microbalance (sensitivity: ±1 μg, Sartorius, Göttingen, Germany) after equilibration for 24 h at 20 °C to 23 °C and 35% to 45% relative humidity. The filter was cut into three sections for analysis of water-soluble ions, OC/EC and trace elements. The concentrations of water-soluble ions (including F, Cl, NO2, NO3, SO42−, Na+, NH4+, K+, Mg2+, and Ca2+) were determined by ion chromatography (Dionex IC 90, Dionex Corporation, Sunnyvale, CA, USA) after the filters were extracted with ultra-pure water and the water extracts were filtered. The details of this process can be found in reports by Nie et al. [49] and Zhou et al. [50]. The contents of OC and EC were determined with a thermal-optical carbon analyzer (Dual-oven model, Sunset Laboratory, OR, USA) with a non-dispersive infrared detector, which used the thermal-optical transmittance (TOT) method and complied with the NIOSH 5040 protocol. The principles and operation of this analyzer were described by Wang et al. [51]. The trace elements (K, Cl, Al, Fe, Ca, Ti, Mn, Cu, Cr, Se, Ni, Zn, As, Pb, S, V, and Co) in the PM2.5 samples were quantified by an energy dispersive X-ray fluorescence spectrometer (XRF, Epsilon 4, Malvern Panalytical, Malvern, UK). The estimated detection limits were 0.010–0.084 µg m−3 for all of the ions, 0.04 µg m−3 for OC/EC, and 0.3–1.0 ng cm2 for elements, with measurement uncertainties of approximately 10%. The temperature was obtained from the PM2.5 intelligent sampler (Model TH-150A, Wuhan Tianhong Corporation, Wuhan, China).

2.2. Positive Matrix Factorization (PMF) Analysis

A receptor model from the U.S. Environmental Protection Agency (EPA), PMF 5.0, was used to identify the contributing sources of the major components in PM2.5 in Jinan. The PMF model is a multivariate factor analysis tool that is widely used for atmospheric samples [52,53]. Detailed information on the principles and use of the PMF model can be found in the user guide and related literature [52,53]. The concentrations of water-soluble ions, OC, EC, and elements were input into the PMF model to estimate the sources of PM2.5. This study made use of the same uncertainty estimation method used by Wang et al. [53].
Uncertainty = { 5 6 × MDL ij ,   C ij < MDL ij ( 0.15 × C ij ) 2 + ( 0.5 × MDL ij ) 2 ,   C ij > MDL ij
where MDLij is the method detection limit of species j in sample i and Cij is the concentration of species j in sample i. After that, three to nine factors and plenty of combinations of chemical species were trialed to obtain the best solution of PMF. One hundred runs were performed for each calculation to ensure the robustness of the statistics.
The number factors were selected mainly based on the physical interpretability of PMF solutions and the factor matching rate calculated by bootstrap error estimation. Solutions with five to seven factors show the high physical interpretability. However, each factor profile of six-factor PMF result has the most physicochemical meaning. In five-factor PMF solution, road dust factor has seldom SO42− and NO3 and there is no Ti in it. For seven-factor PMF results, there is a factor hardly to be interpreted, which has abundant secondary inorganic ions, OC, EC and some mineral species but no Ti, in which SO42− and Ni has the highest contribution. Furthermore, the factor matching rates are approximately or less than 80% for five- and seven-factor solutions, while more than 90% for the six-factor solution. Hence, six-factor solution was selected as the optimal PMF scheme.

3. Results and Discussion

3.1. Concentrations of PM2.5 and Its Chemical Components

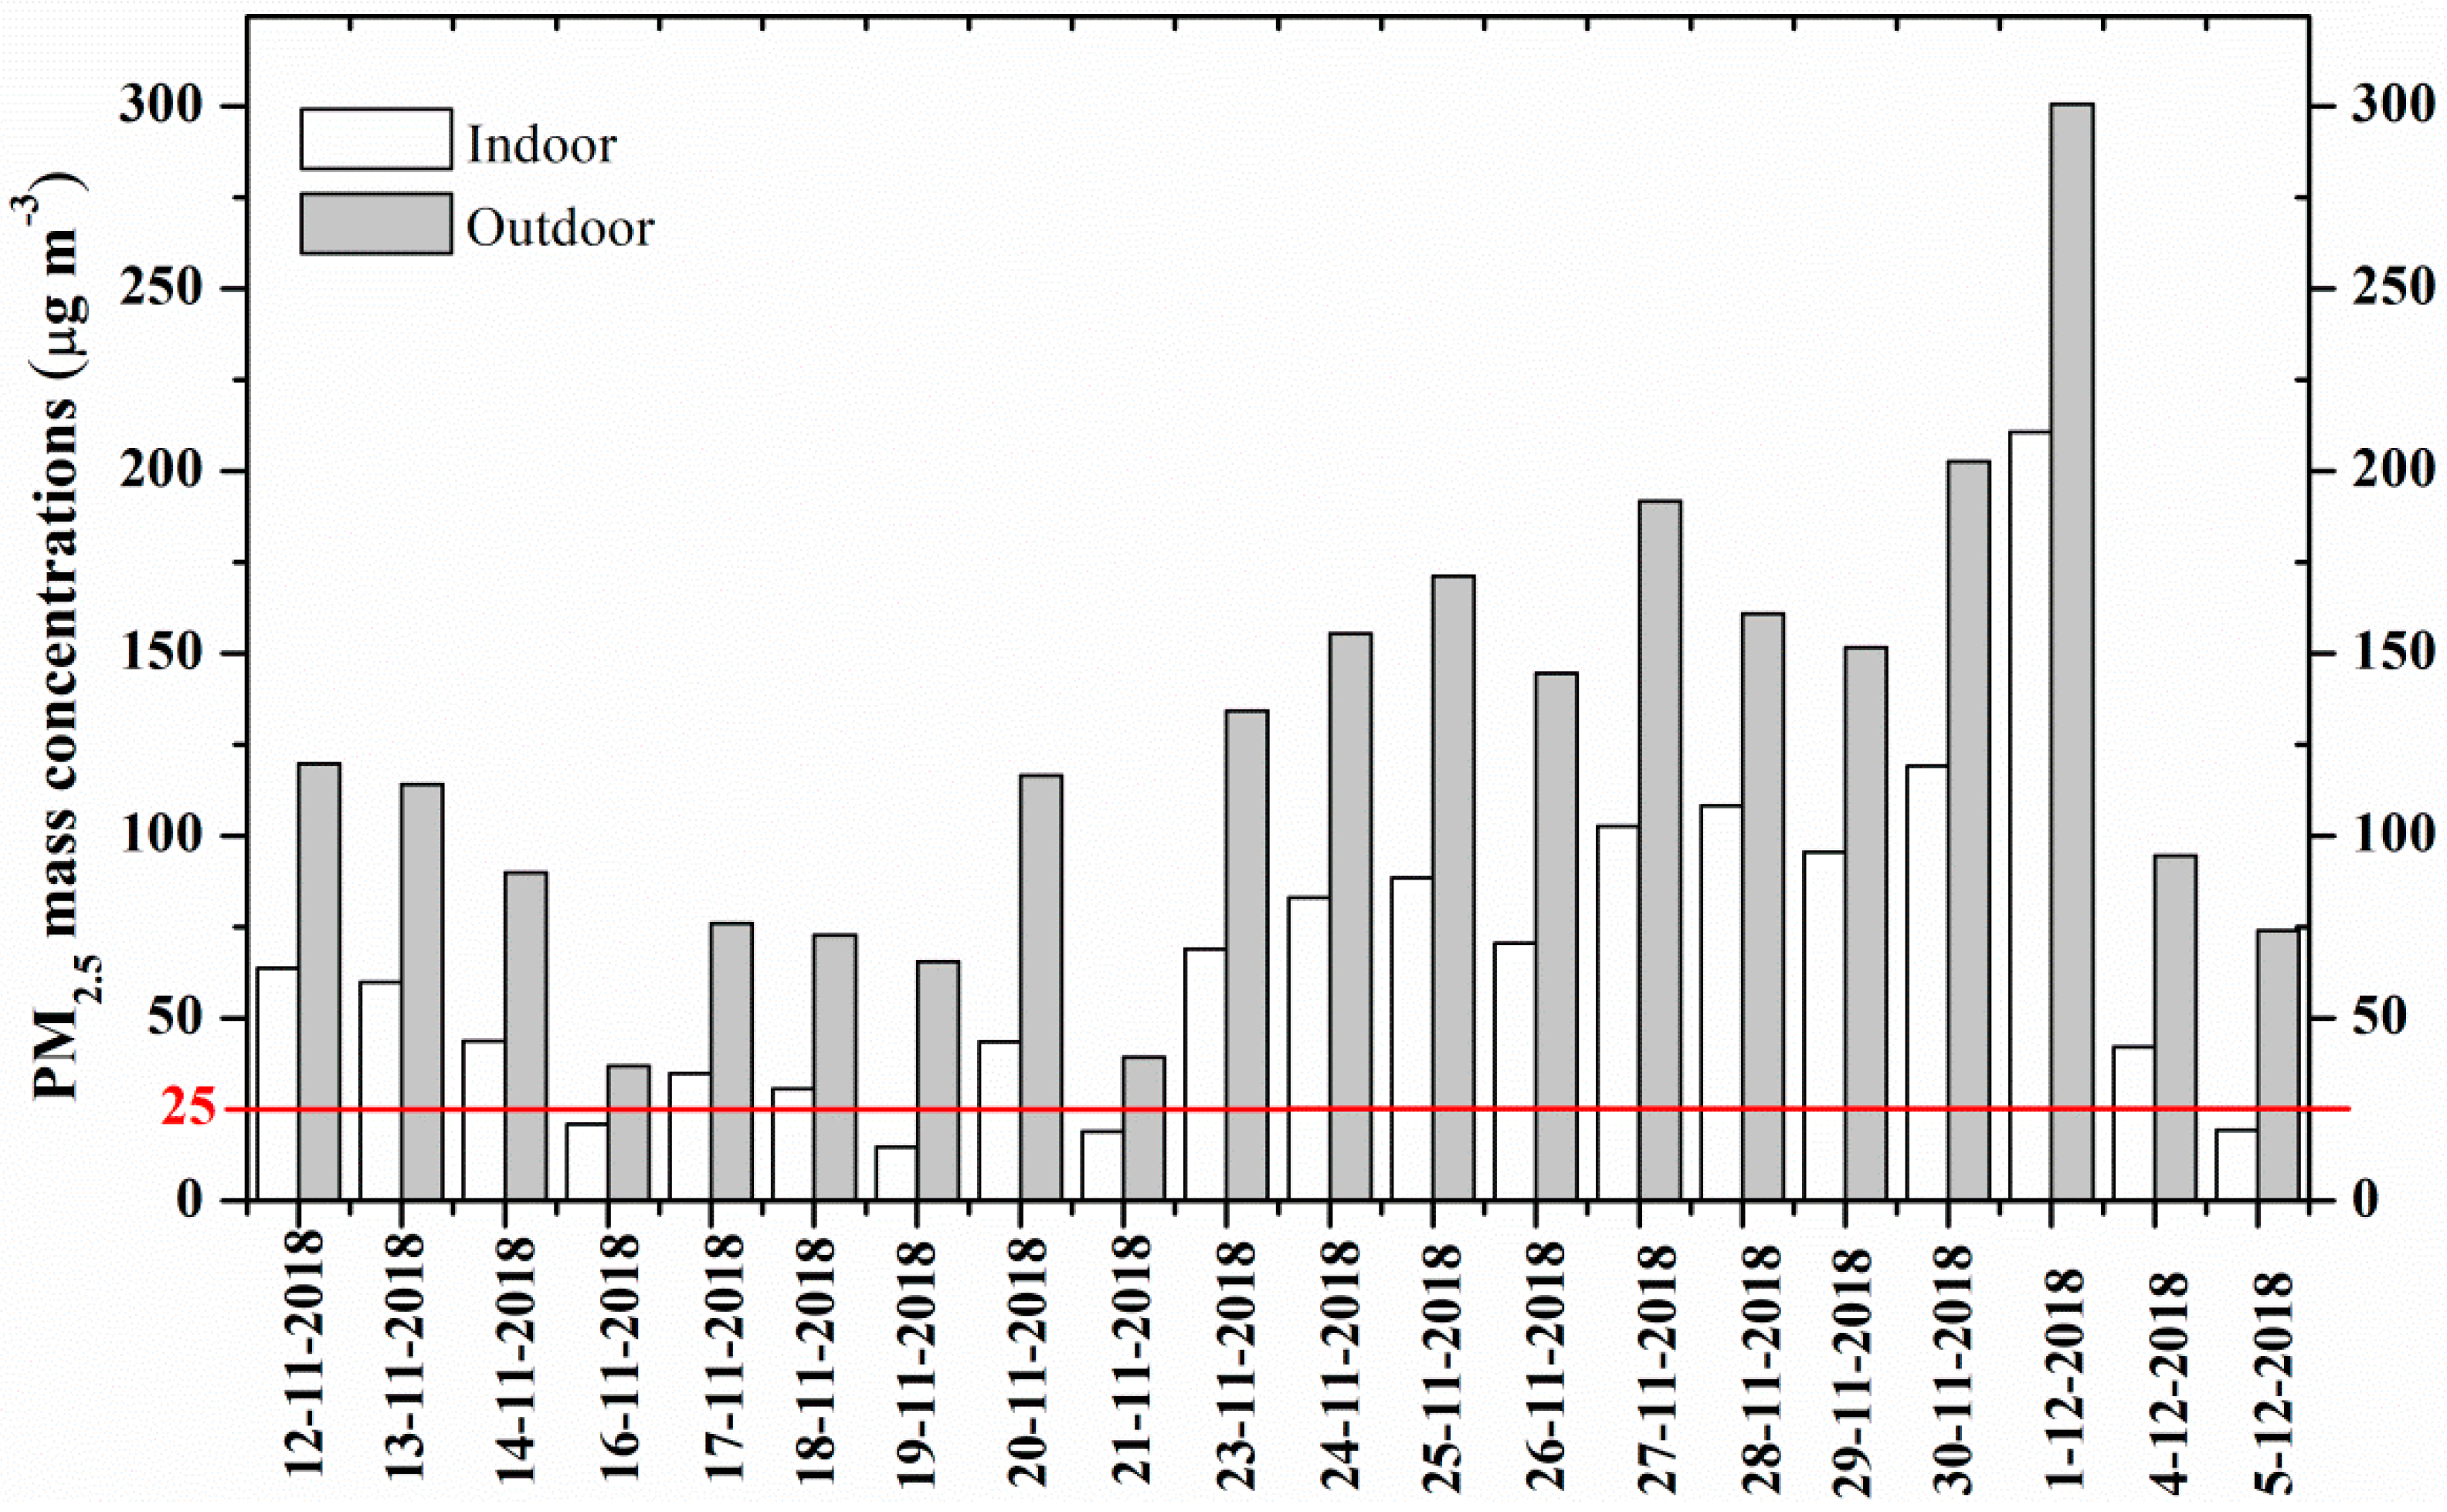
Figure 2 shows the time series of indoor and outdoor PM2.5 mass concentrations during the entire observation period. The variations of indoor and outdoor PM2.5 concentrations were similar with wide range of fluctuations (i.e., from 37 µg m−3 to more than 300 µg m−3 in the outdoor environment, while from 15 µg m−3 to 211 µg m−3 in the indoor environment). The daily average concentrations of all outdoor samples and 80% of the indoor samples exceeded the WHO-established 24-h standard of 25 µg m−3 for PM2.5 [54], which implies that PM2.5 pollution in both indoor and outdoor environments in Jinan is severe.
Table 1 summarizes the statistics (including daily, daytime, and nighttime mean values) of indoor and outdoor PM2.5 and its major chemical components. In general, the concentrations of indoor PM2.5 and its major chemical components were always lower than those of the outdoor counterparts (Figure 2 and Table 1). The mean outdoor and indoor PM2.5 concentrations were 69.0 ± 50.5 µg m−3 and 128.7 ± 67.9 µg m−3, respectively. In a highly polluted urban area such as Jinan, indoor PM2.5 was approximately 50% of the outdoor PM2.5 and therefore indoor had slightly better air quality. This holds for an unoccupied, unused office that has closed the door and windows and is probably determined by outdoor air leaking into the building. Compared with the findings of previous studies in urban Jinan [24,26], both indoor and outdoor concentrations in this study were lower, suggesting alleviation of PM2.5 pollution. Water-soluble ions were the most abundant species. The total concentrations of water-soluble ions (F, Cl, NO2, NO3, SO42−, Na+, NH4+, K+, Mg2+, and Ca2+) in outdoor and indoor environments were 75.23 ± 35.35 µg m−3 and 41.71 ± 20.79 µg m−3, respectively (with ranges of 20–177 µg m−3 and 13–113 µg m−3, respectively), accounting for 60% and 62% of the outdoor and indoor PM2.5 concentrations, respectively. Among these water-soluble ions, SO42−, NO3, and NH4+ were predominant, whereas other ions (F, Cl, NO2, K+, Na+, Mg2+, and Ca2+) were normally observed at very low concentrations in both the indoor and outdoor PM2.5 samples. The concentrations of predominant water-soluble ions followed the order of SO42− > NO3 > NH4+ in indoor PM2.5 and NO3 > SO42− > NH4+ in outdoor PM2.5. In addition, OC and EC constituted important fractions of the PM2.5 concentration, with average concentrations of 11.46 ± 5.62 µg m−3 and 2.53 ± 1.06 µg m−3 in the indoor environment, respectively, and 14.88 ± 7.80 µg m−3 and 3.53 ± 1.56 µg m−3 in the outdoor environment, respectively.
The indoor and outdoor PM2.5 composition were similar (see Figure 3), and SO42, NO3, NH4+ and OC were the predominant chemical components, together contributing 61.9% and 63.7% to the indoor and outdoor PM2.5 concentrations, respectively. The main difference observed between the indoor and outdoor PM2.5 was in the NO3/SO42 mass ratio. The outdoor NO3/SO42 mass ratio was 1.94, approximately twice the indoor ratio of 1.00. This difference can be explained by the loss of semi-volatile NO3 during the transport of PM2.5 from the outside atmosphere to indoor air due to the higher indoor temperature (21 °C on average) than the outdoor temperature (10 °C on average).
In this study, the NO3 concentration (34.39 ± 16.37 µg m−3) was much higher than the SO42− concentration (17.73 ± 9.27 µg m−3) in the outdoor environment, which contradicted the results of previous studies in Jinan reporting the SO42− concentration to be higher than the NO3 concentration [24,26,27,55]. In this study, the NO3/SO42 mass ratio (1.94) was higher than the results obtained from 2005 to 2015 in Jinan [48]. We further compared the concentrations of indoor PM2.5 and its chemical components in this study with those in previous studies [24,27]. The indoor PM2.5 and water-soluble ion concentrations (except NO3) in 2018 decreased, following the decrease in outdoor concentrations. However, the indoor NO3 concentration in 2018 increased by almost 25%, which was consistent with the increase in the outdoor NO3 concentration. These phenomena may be due to the following two causes: (1) the strict control of SO2 emissions has led to a remarkable decrease in SO42 concentration in China [35,46]; and (2) the sampling site is different from those in the previous studies; and specifically, it is close to ErHuan South Road and Nanxinzhuang West Road, which frequently have heavy traffic.

3.2. Assessment of Health Risks for Metals and Sulfur in PM2.5

PM2.5-bound heavy metals can enter deep into the lungs and cause risks to human health due to their toxicity. Thus, in this study, the possible non-carcinogenic risk to human health from both indoor and outdoor environments was assessed based on representative elemental components of PM2.5 for three highly vulnerable groups: children (aged 2–6 years and 6–12 years) and older adults (≥70 years). According to the method described by the U.S. EPA [56], the elemental risk (R) was calculated using the formula
DE = (C × I × F × D)/(t × W)
R = DE/RD
where DE: dose of exposure (mg/kg-day); C: mean concentrations (mg/m3); I: inhalation rate (m3/day); F: exposure frequency (days/year); D: exposure duration (years); t: average time (days); W: body weight (kg); R: elemental risk; RD: reference dose [56]. The values of W, I, F, and D were 16, 6.00, 180 and 4 for young children, 29, 11.04, 180, and 6 for children aged of 6–12 years, 70, 19.92, 180, and 30 for adults, respectively. Table 2 shows the calculated R values for the indoor and outdoor environments.
Overall, the risk values of various elements were slightly higher in the outdoor environment than the indoor environment. Individual elemental risk values greater than 0.1 were considered to denote adverse health effects for children [57]. As shown in Table 2, the elements in PM2.5 with individual risk values greater than 0.1 for the study populations were Mn, Cr, Co, and S in both indoor and outdoor environments. To consider the cumulative effect of the non-carcinogenic risks of elements, the individual risk values of the 10 elements were summed to give the total risk values. The total risk values were 0.78 for children aged 2–6 years, 0.80 for children aged 6–12 years and 0.59 for elderly adults in the indoor environment. These values were slightly higher in the outdoor environment. In addition, a comparison between the risk values for children and older adults indicated that children were the most susceptible group to non-carcinogenic effects. Compared with the data reported by Yang et al. [57], the risk values of individual elements in this study were lower, which is consistent with the reduction of PM2.5 concentration as described above. These results indicated that the exposure to elements found in PM2.5 may pose a reduced public health risk in this study area. However, the results of the risk assessment are affected by some uncertainties, associated mainly with the estimates of toxicity values and exposure parameters. In this study, we calculated the risks of only some heavy metals in PM2.5 (e.g., Cd was not assessed), and PM2.5 contains other harmful substances as well, such as PAHs [27]. Therefore, although the total risk value of elements calculated in this study was less than 1, the harmful effects of PM2.5 to human health cannot be ignored because the actual risks could be greater than our calculated results.

3.3. Source Analysis

3.3.1. Indoor/Outdoor Ratio (I/O Ratio)

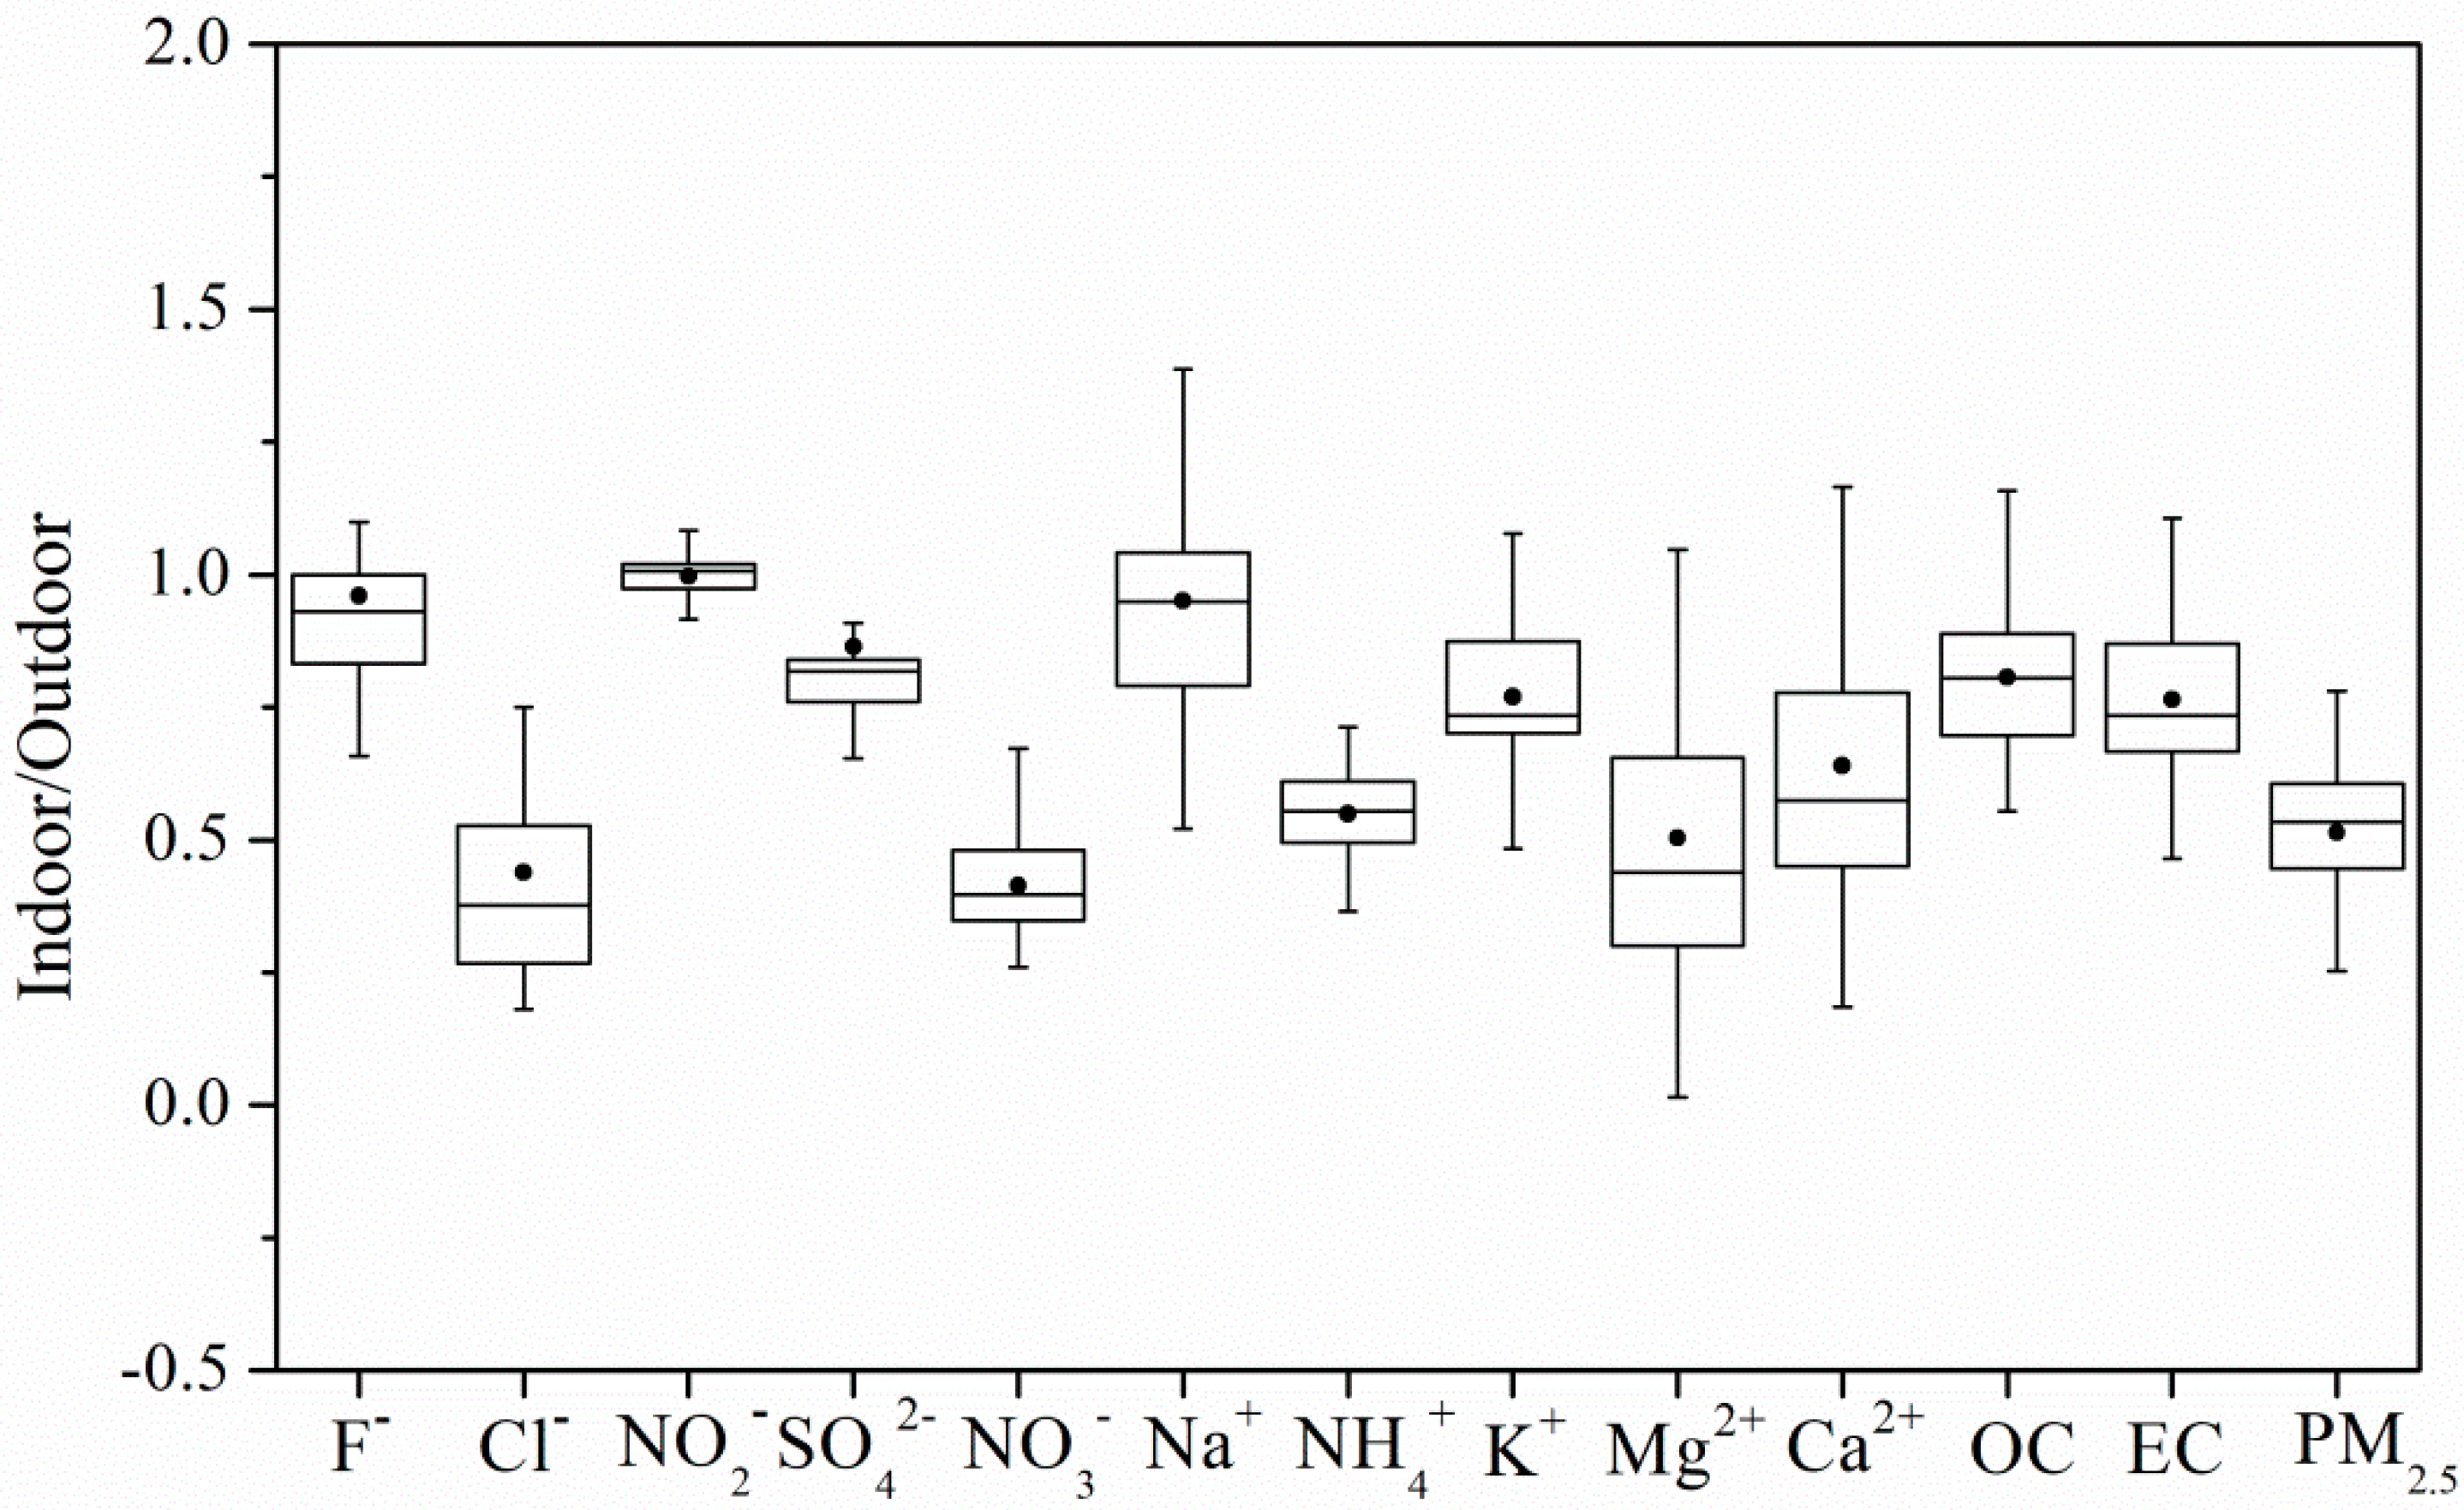
The indoor/outdoor ratio (I/O ratio) is calculated as Cin/Cout [37], where Cin and Cout are the indoor and outdoor species concentrations, respectively. Figure 4 shows I/O ratios of PM2.5 and its chemical components. The average I/O ratios of PM2.5 and its chemical components were all lower than 1.0, indicating that the indoor PM2.5 concentration was strongly affected by outdoor pollution. The I/O ratios of SO42− and OC were the highest, both of which were 0.81 (SO42− range: 0.65–1.05, OC range: 0.55–1.16), whereas that of NO3 (0.41 ± 0.10) was lower, as also observed by previous studies [24,26]. The decomposition of ammonium nitrate and other volatile components due to higher indoor temperatures led to a reduction in the PM2.5 I/O ratio.

3.3.2. Infiltration Factor (FINF) and Indoor Source Contribution (Cig)

The linear regressions between indoor and outdoor PM2.5 and its major chemical components can be expressed as Cin = FINF Cout + Cig [37], where Cig is the indoor particle concentration contributed by indoor sources, and FINF (called the infiltration factor) is the fraction of outdoor PM2.5 and its chemical compounds that enter the indoor environment and remain suspended. The linear regressions of PM2.5 and its major chemical components are depicted in Figure 5. The FINF of PM2.5 was approximately 0.68, indicating that more than half of the outdoor PM2.5 had entered indoors. It should be noted that the office windows were closed during most of the sampling periods, which limited the effect of natural ventilation on the indoor–outdoor air circulation. The Cig of PM2.5 was negative, indicating the very limited contribution of indoor sources to indoor PM2.5 concentration. A similar finding was reported by Sangiorgi et al. [5] in cold conditions.
As with the I/O ratio, the FINF of major chemical components also followed the order of SO42− > OC > EC (>PM2.5) > NH4+ > NO3, which could be attributable to the semi-volatile characteristic of NH4NO3 and the non-volatile characteristic of (NH4)2SO4 and EC. Temperature is the main factor affecting the gas–particle conversion of semi-volatile compounds [5,14,40]. During the transfer of NH4NO3 from outdoor to indoor, the higher indoor temperature (21 °C on average) compared with the outdoor temperature (10 °C on average) led to the partitioning from the particle phase to the gas phase [5,26]. However, (NH4)2SO4 and EC were not affected by the temperature. The Cig values for major chemical components were positive, except for NH4+. The Cig values of SO42−, OC, EC, NH4+, and NO3 only accounted for less than 20% of their indoor concentrations, implying that the indoor sources of PM2.5 were negligible, which was consistent with the characteristics of the selected office.

3.3.3. Source Identification by PMF

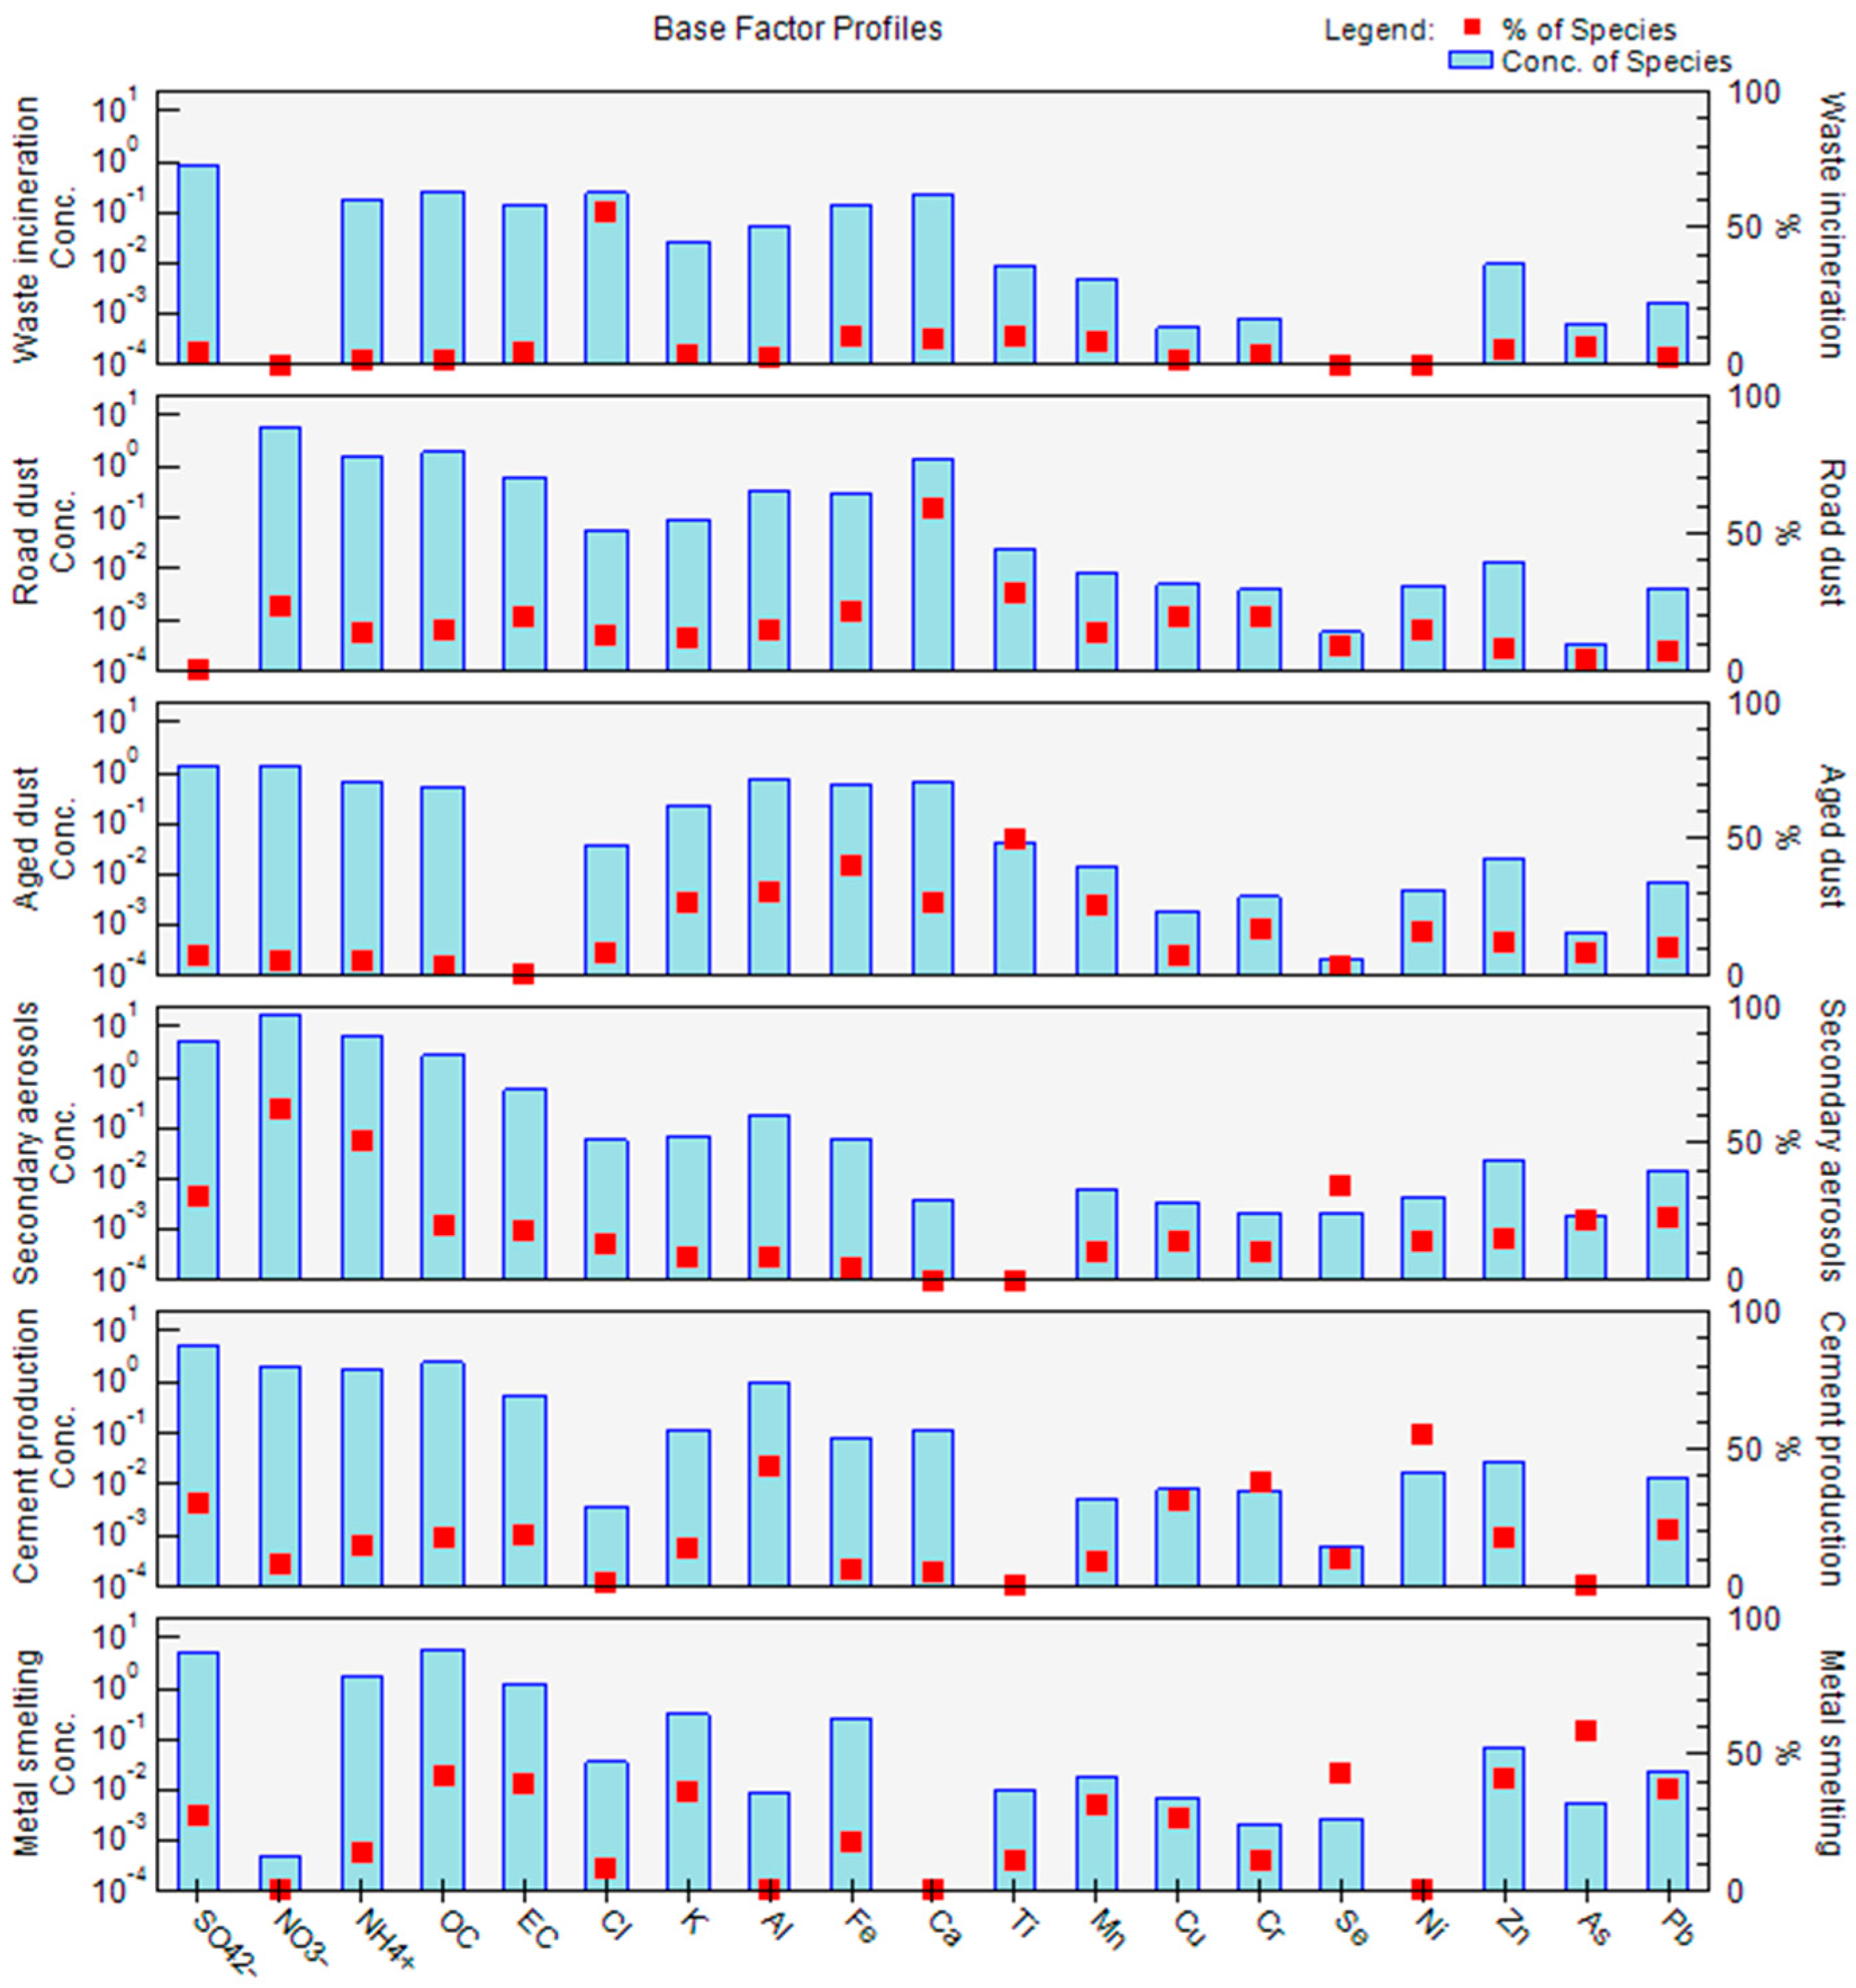
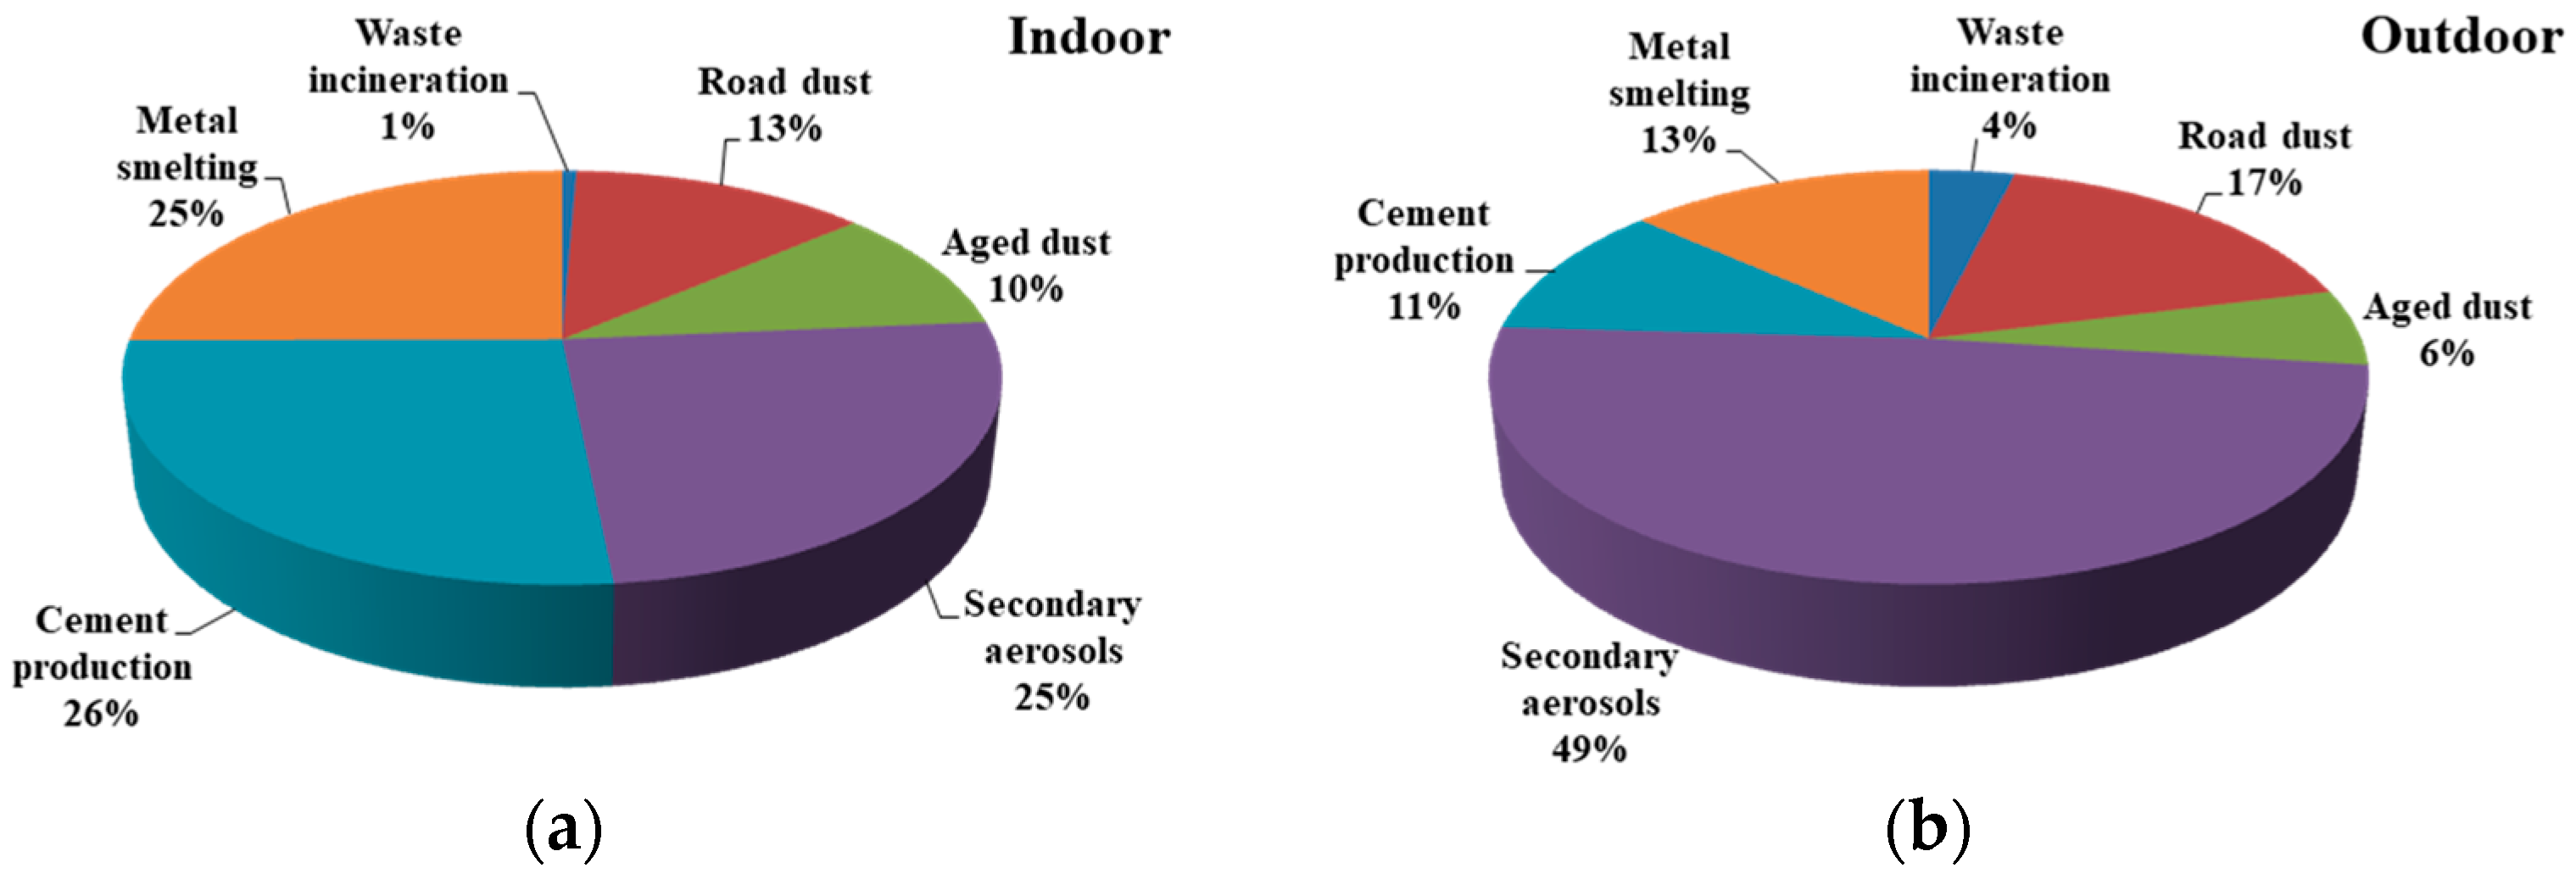
According to the relationships of the indoor and outdoor PM2.5, I/O ratios, and the FINF mentioned above, indoor PM2.5 pollution was primarily determined by the outdoor pollution, which suggests that indoor and outdoor PM2.5 in Jinan had the same or similar sources. Thus, PMF was performed using the combined datasets of the PM2.5 chemical components (SO42−, NO3, NH4+, OC, EC, Cl, K, Al, Fe, Ca, Ti, Mn, Cu, Cr, Se, Ni, As, Zn, and Pb) in both indoor and outdoor environments to obtain the possible sources of PM2.5. Six sources were identified, and the source profiles and contribution of each source to PM2.5 are described in Figure 6 and Figure 7. These major sources include secondary aerosols, local road dust, long-range dust storm, cement production, and coal combustion/metal smelting.
Factor 1 showed a high loading of Cl (56% of the total Cl mass concentration) and low loadings of other metals such as Zn, Pb, and Fe, which could be associated with waste incineration [58,59]. The contribution of this factor was minor (4% and 1% to the outdoor and indoor PM2.5 concentrations, respectively; Figure 7).
Factor 2 showed a high loading of Ca (contributing 59% to the total Ca concentration) and moderate loadings of Fe, Ti, NO3, and EC, potentially highlighting links with local road dust resuspended by moving traffic [60,61]. The contributions of factor 2 were 17% and 13% to the outdoor and indoor PM2.5 concentrations, respectively (Figure 7).
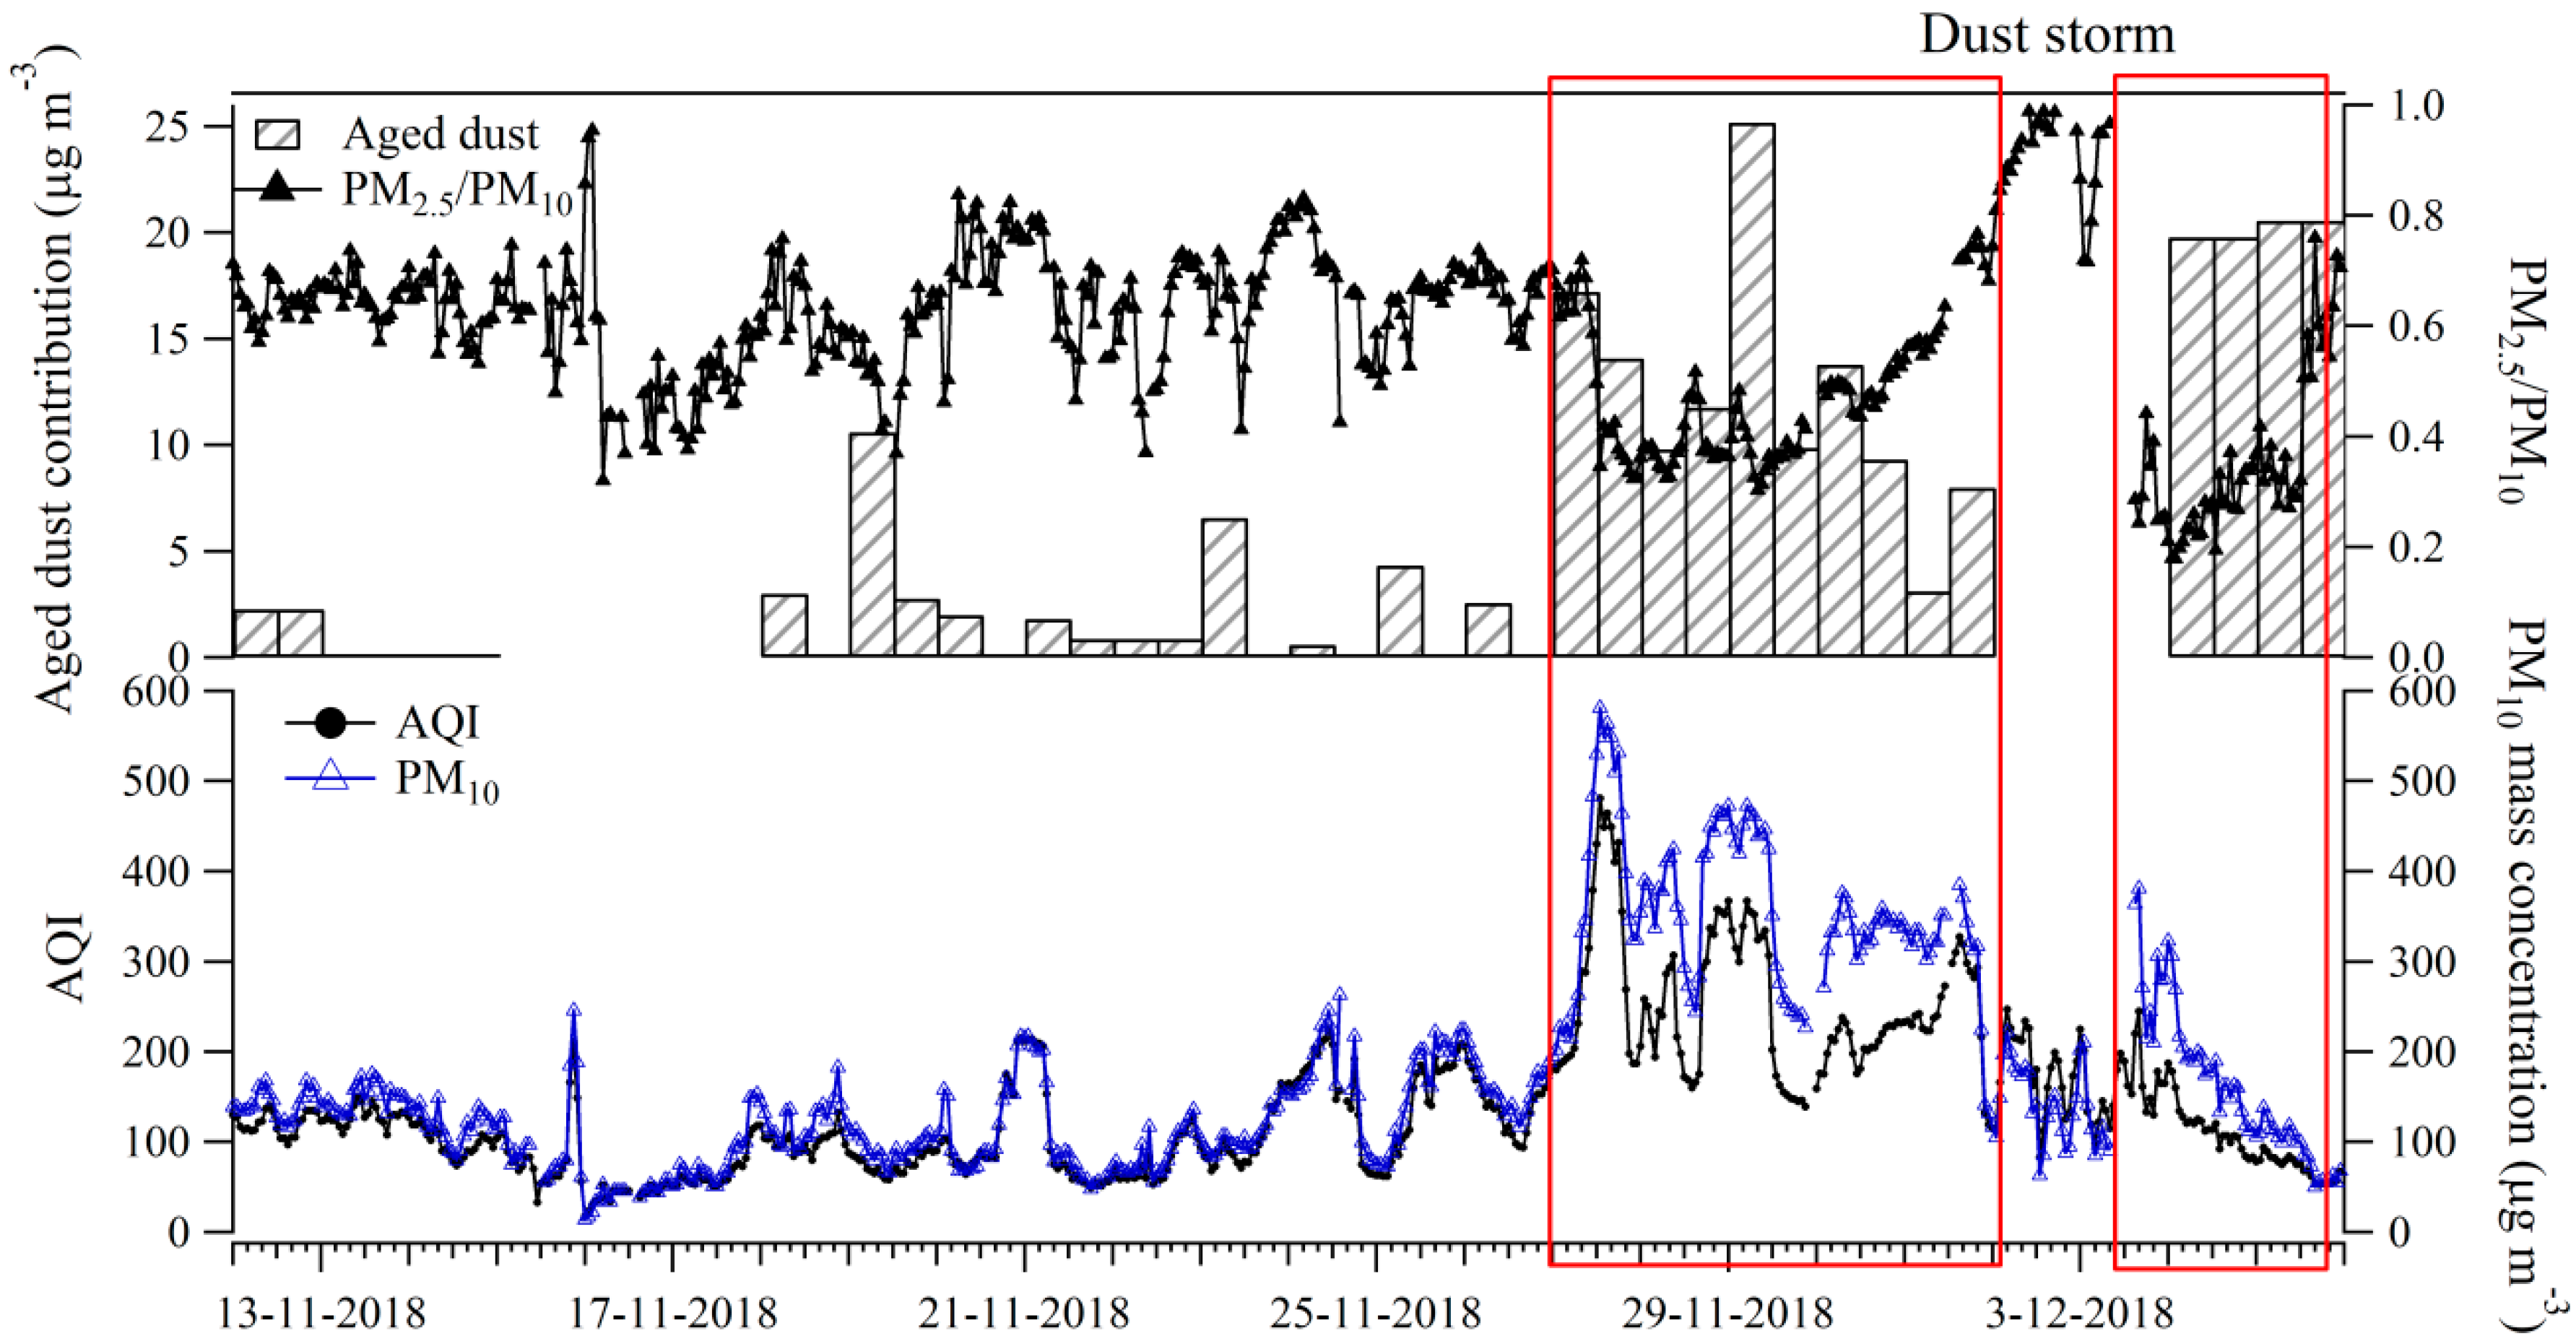
Factor 3 was primarily associated with long-range dust storm due to high loadings of Ti, Fe, Al, and Ca. As shown in Figure 8, a dust storm from Mongolia affected Jinan from 27–30 November and from 3–5 December 2018, when the observed hourly PM10 concentrations reached 581 µg m−3 and the ratio of PM2.5/PM10 declined to 0.20–0.40 (as compared with >0.40 outside the dust storm period). This dust storm caused serious air pollution in Jinan and increased the hourly air quality index to 481 (shown in Figure 8, the hourly data of PM2.5, PM10 and AQI from http://fb.sdem.org.cn:8801/AirDeploy.Web/AirQuality/MapMain.aspx). In addition, high loadings of NO3 and NH4+ (22% and 11% of factor mass, respectively) indicated that the dust plumes had aged during the transport. The time series of PMF results further showed that the contribution of long-range dust storm to PM2.5 was reasonable (Figure 8). This factor accounted for 6% and 10% of the outdoor and indoor PM2.5 concentrations, respectively (Figure 7).
Factor 4 had the highest loadings of NO3, SO42−, and NH4+. NO3, SO42−, and NH4+ in this factor were major contributors to the PM2.5 concentrations of factor 4 (51% and 20%, respectively) and also contributed 63%, 30%, and 51%, respectively, to the total NO3 and NH4+ concentrations. This factor could thus be identified as secondary aerosols. In addition, many other components (e.g., Se, As, Pb, OC, and EC) were observed with moderate loadings and contributions in factor 4, potentially highlighting links with coal combustion and vehicle emissions [62,63]. The secondary aerosols contributed an average of 49% and 25% to the outdoor and indoor PM2.5 concentrations, respectively (Figure 7).
Factor 5 included Ni, Al, Ca, Cr, and Cu, which may be associated with cement production [64]. This factor contributed 11% and 26% to the outdoor and indoor PM2.5 concentrations, respectively (Figure 7).
Factor 6 was suggested to be associated mainly with coal combustion [60,61], because it was characterized by the high loadings of As, Se, Zn, OC, and EC and contributed 59%, 43%, 41%, 42%, and 39% to the total As, Se, Zn, OC, and EC concentrations, respectively. Coal is still a primary energy source in Shandong Province, particularly during the heating season, with As, Se, Pb, Cr, Mn, Cu, and Zn as representative element tracers [62]. This factor also contained large contributions from Mn, Cu, and Pb and was associated with metal smelting [65]. This factor contributed 13% and 25% to the outdoor and indoor PM2.5 concentrations, respectively (Figure 7).

4. Conclusions

To understand the pollution characteristics and sources of indoor PM2.5, PM2.5 samples were collected simultaneously from inside a typical office and its outdoor atmosphere at an urban site in Jinan from 12 November to 5 December 2018. Subsequent chemical analysis revealed high PM2.5 concentrations in both indoor and outdoor environments.
The chemical compositions of the indoor and outdoor PM2.5 were similar, with SO42−, NO3, NH4+, and OC being the predominant components. A comparison with the results of previous studies in urban Jinan revealed significant decreases in PM2.5 and SO42− concentrations but an increase in NO3 concentration in recent years. The results of elemental risk assessment indicated the potential risk of PM2.5 to health. The obtained I/O ratios and FINF indicated that indoor PM2.5 pollution was largely affected by the outdoor environment. No significant indoor sources were found for the major chemical components of PM2.5 based on the low Cig values, as the contributions of all sources to the indoor PM2.5 concentrations were less than 20%. The main sources of PM2.5 in Jinan were found to be secondary aerosols, local road dust, long-range dust storm, cement production, and coal combustion/metal smelting.

Author Contributions

Conceptualization, X.G.; Methodology, W.L., X.S., and Z.W.; Formal analysis, W.G.; Investigation, Z.W.; Data curation, X.G., W.G., and W.J.; Software, W.L. and X.S.; Writing—original draft preparation, X.G. and Z.W.; Writing—review and editing, X.G., W.G., X.S., W.J., Z.W., and W.L.; Supervision, X.G.; Funding acquisition, X.G. All authors have read and agreed to the published version of the manuscript.

Funding

This work was funded by the National Natural Science Foundation of China, grant number 21607054, Key Research, Development Program of Shandong Province, grant number 2019GSF109077, and Major projects for people’s livelihood from Jinan Science and Technology Bureau, grant number 201807008. It was also supported by the Doctoral Found Project, grant number XBS1429 and Scientific Research Fund, grant number XKY1326 from University of Jinan.

Conflicts of Interest

The authors declare no conflict of interest.

References

  1. Dockery, D.W.; Pope, C.A.; Xu, S.P.; Spengler, J.D.; Ware, J.H.; Fay, M.E.; Ferris, B.G.; Speizer, F.E. An association between air pollution and mortality in six United States cities. N. Engl. J. Med. 1993, 329, 1753–1759. [Google Scholar] [CrossRef] [PubMed] [Green Version]
  2. Pope, C.A.; Bates, D.V.; Raizenne, M.E. Health effects of particulate air pollution: Time for reassessment? Environ. Health Perspect. 1995, 103, 1390–1406. [Google Scholar] [CrossRef] [PubMed]
  3. Zhou, J.; Ito, K.; Lall, R.; Lippmann, M.; Thurston, G. Time-series analysis of mortality effects of fine particulate matter components in Detroit and Seattle. Environ. Health Perspect. 2011, 119, 461–466. [Google Scholar] [CrossRef] [PubMed]
  4. Englert, N. Fine particles and human health–a review of epidemiological studies. Toxicol. Lett. 2004, 149, 235–242. [Google Scholar] [CrossRef]
  5. Sangiorgi, G.; Ferrero, L.; Ferrini, B.S.; Lo Porto, C.; Perrone, M.G.; Zangrando, R.; Gambaro, A.; Lazzati, Z.; Bolzacchini, E. Indoor airborne particle sources and semi-volatile partitioning effect of outdoor fine PM in offices. Atmos. Environ. 2013, 65, 205–214. [Google Scholar] [CrossRef] [Green Version]
  6. Zhang, Y.H.; Zhu, X.L.; Slanina, S.; Shao, M.; Zeng, L.M.; Hu, M.; Bergin, M.; Salmon, L. Aerosol pollution in some Chinese cities. Pure Appl. Chem. 2004, 76, 1227–1239. [Google Scholar] [CrossRef]
  7. Chan, C.K.; Yao, X.H. Air pollution in mega cities in China. Atmos. Environ. 2008, 42, 1–42. [Google Scholar] [CrossRef]
  8. Yang, F.; Tan, J.; Zhao, Q.; Du, Z.; He, K.; Ma, Y.; Duan, F.; Chen, G.; Zhao, Q. Characteristics of PM2.5 speciation in representative megacities and across China. Atmos. Chem. Phys. 2011, 11, 5207–5219. [Google Scholar] [CrossRef] [Green Version]
  9. Zhang, Y.L.; Cao, F. Fine particulate matter (PM2.5) in China at a city level. Sci. Rep. 2015, 5, 14884. [Google Scholar] [CrossRef] [Green Version]
  10. Cheng, Z.; Luo, L.N.; Wang, S.X.; Wang, Y.G.; Sharma, S.; Shimadera, H.; Wang, X.L.; Bressi, M.; de Miranda, R.M.; Jiang, J.K.; et al. Status and characteristics of ambient PM2.5 pollution in global megacities. Environ. Int. 2016, 89–90, 212–221. [Google Scholar] [CrossRef]
  11. Isley, C.F.; Nelson, P.F.; Taylor, M.P.; Mani, F.S.; Maata, M.; Atanacio, A.; Stelcer, E.; Cohen, D.D. PM2.5 and aerosol black carbon in Suva, Fiji. Atmos. Environ. 2017, 150, 55–66. [Google Scholar] [CrossRef]
  12. Klepeis, N.E.; Nelson, W.C.; Ott, W.R.; Robinson, J.P.; Tsang, A.M.; Switzer, P.; Behar, J.V.; Hern, S.C.; Engelmann, W.H. The National Human Activity Pattern Survey (NHAPS): A resource for assessing exposure to environmental pollutants. J. Expo. Anal. Environ. Epidemiol. 2001, 11, 231–252. [Google Scholar] [CrossRef] [PubMed] [Green Version]
  13. Adgate, J.L.; Ramachandran, G.; Pratt, G.; Waller, L.; Sexton, K. Spatial and temporal variability in outdoor, indoor, and personal PM2.5 exposure. Atmos. Environ. 2002, 36, 3255–3265. [Google Scholar] [CrossRef]
  14. Ohura, T.; Amagai, T.; Fusaya, M.; Matsushita, H. Polycyclic aromatic hydrocarbons in indoor and outdoor environments and factors affecting their concentrations. Environ. Sci. Technol. 2004, 38, 77–83. [Google Scholar] [CrossRef] [PubMed]
  15. Banerjee, S.; Annesi-Maesano, I. Spatial variability of indoor air pollutants in schools. A multilevel approach. Atmos. Environ. 2012, 61, 558–561. [Google Scholar] [CrossRef]
  16. Chi, C.C.; Chen, W.D.; Guo, M.; Weng, M.L.; Yan, G.; Shen, X.Y. Law and features of TVOC and Formaldehyde pollution in urban indoor air. Atmos. Environ. 2016, 132, 85–90. [Google Scholar] [CrossRef] [Green Version]
  17. Xu, J.; Szyszkowicz, M.; Jovic, B.; Cakmak, S.; Austin, C.C.; Zhu, J.P. Estimation of indoor and outdoor ratios of selected volatile organic compounds in Canada. Atmos. Environ. 2016, 141, 523–531. [Google Scholar] [CrossRef]
  18. Huang, S.D.; Wei, W.J.; Weschler, L.B.; Salthammer, T.; Kan, H.D.; Bu, Z.M.; Zhang, Y.P. Indoor formaldehyde concentrations in urban China: Preliminary study of some important influencing factors. Sci. Total Environ. 2017, 590–591, 394–405. [Google Scholar] [CrossRef]
  19. Huang, L.H.; Qian, H.; Deng, S.X.; Guo, J.F.; Li, Y.P.; Zhao, W.P.; Yue, Y. Urban residential indoor volatile organic compounds in summer, Beijing: Profile, concentration and source characterization. Atmos. Environ. 2018, 188, 1–11. [Google Scholar] [CrossRef]
  20. Villanueva, F.; Tapia, A.; Lara, S.; Amo-Salas, M. Indoor and outdoor air concentrations of volatile organic compounds and NO2 in schools of urban, industrial and rural areas in Central-Southern Spain. Sci. Total Environ. 2018, 622–623, 222–235. [Google Scholar] [CrossRef]
  21. Vu, D.C.; Ho, T.L.; Vo, P.H.; Bayati, M.; Davis, A.N.; Gulseven, Z.; Carlo, G.; Palermo, F.; McElroy, J.A.; Nagel, S.C.; et al. Assessment of indoor volatile organic compounds in Head Start child care facilities. Atmos. Environ. 2019, 215, 116900. [Google Scholar] [CrossRef]
  22. Cao, J.J.; Huang, H.; Lee, S.C.; Chow, J.C.; Zou, C.W.; Ho, K.F.; Watson, J.G. Indoor/outdoor relationships for organic and elemental carbon in pm2.5 at residential homes in guangzhou, China. Aerosol Air Qual. Res. 2012, 12, 902–910. [Google Scholar] [CrossRef] [Green Version]
  23. Chithr, V.S.; Shiva Nagendr, S.M. Chemical and morphological characteristics of indoor and outdoor particulate matter in an urban environment. Atmos. Environ. 2013, 77, 579–587. [Google Scholar] [CrossRef]
  24. Dong, C.; Yang, L.X.; Yan, C.; Yuan, Q.; Yu, Y.C.; Wang, W.X. Particle size distributions, PM2.5 concentrations and water soluble inorganic ions in different public indoor environments: A case study in Jinan, China. Front. Environ. Sci. Eng. 2013, 7, 55–65. [Google Scholar] [CrossRef]
  25. Buczyńska, A.J.; Krata, A.; Grieken, R.V.; Brown, A.; Polezer, G.; DeWael, K.; Potgieter-Vermaak, S. Composition of PM2.5 and PM1 on high and low pollution event days and its relation to indoor air quality in a home for the elderly. Sci. Total Environ. 2014, 490, 134–143. [Google Scholar] [CrossRef] [PubMed]
  26. Zhang, J.M.; Chen, J.M.; Yang, L.X.; Sui, X.; Yao, L.; Zheng, L.F.; Wen, L.; Xu, C.H.; Wang, W.X. Indoor PM2.5 and its chemical composition during a heavy haze-fog episode at Jinan, China. Atmos. Environ. 2014, 99, 641–649. [Google Scholar] [CrossRef]
  27. Zhu, Y.H.; Yang, L.X.; Meng, C.P.; Yuan, Q.; Yan, C.; Dong, C.; Sui, X.; Yao, L.; Yang, F.; Lu, Y.L.; et al. Indoor/outdoor relationships and diurnal/nocturnal variations in water-soluble ion and PAH concentrations in the atmospheric PM2.5 of a business office area in Jinan, a heavily polluted city in China. Atmos. Res. 2015, 153, 276–285. [Google Scholar] [CrossRef]
  28. Gao, P.; Lei, T.T.; Jia, L.M.; Song, Y.; Xing, Y.F.; Zhang, Z.H.; Yu, D.H.; Feng, Y.J.; Xing, B.S. Exposure assessment of PM2.5 during winter in outdoor and indoor environments of research center: Spatial-temporal distribution, carbonaceous compositions and contributions of infiltration. Sci. Total Environ. 2016, 573, 854–861. [Google Scholar] [CrossRef]
  29. Xu, H.M.; Guinot, B.; Cao, J.J.; Li, Y.Q.; Niu, X.Y.; Ho, K.F.; Shen, Z.X.; Liu, S.X.; Zhang, T.; Lei, Y.L.; et al. Source, health risk and composition impact of outdoor very fine particles (VFPs) to school indoor environment in Xi’an, Northwestern China. Sci. Total Environ. 2018, 612, 238–246. [Google Scholar] [CrossRef]
  30. Wang, X.H.; Bi, X.H.; Sheng, G.Y.; Fu, J.M. Hospital indoor PM10/PM2.5 and associated trace elements in Guangzhou, China. Sci. Total Environ. 2006, 366, 124–135. [Google Scholar] [CrossRef]
  31. Fromme, H.; Diemer, J.; Dietrich, S.; Cyrys, J.; Heinrich, J.; Lang, W.; Kiranoglu, M.; Twardella, D. Chemical and morphological properties of particulate matter (PM10, PM2.5) in school classrooms and outdoor air. Atmos. Environ. 2008, 42, 6597–6605. [Google Scholar] [CrossRef]
  32. Polidori, A.; Cheung, K.L.; Arhami, M.; Delfino, R.J.; Schauer, J.J.; Sioutas, C. Relationships between size-fractionated indoor and outdoor trace elements at four retirement communities in southern California. Atmos. Chem. Phys. 2009, 9, 4521–4536. [Google Scholar] [CrossRef] [Green Version]
  33. Wang, S.X.; Wei, W.; Li, D.; Aunan, K.; Hao, J.M. Air Pollutants in rural homes in Guizhou, China—Concentrations, speciation, and size distribution. Atmos. Environ. 2010, 44, 4575–4581. [Google Scholar] [CrossRef]
  34. Saraga, D.; Maggos, T.; Sfetsos, A.; Tolis, E.; Andronopoulos, S.; Bartzis, J.; Vasilakos, C. PAHs sources contribution to the air quality of an office environment: Experimental results and receptor model (PMF) application. Air Qual. Atmos. Health 2010, 3, 225–234. [Google Scholar] [CrossRef]
  35. Li, Z.S.; Wen, Q.M.; Zhang, R.L. Sources, health effects and control strategies of indoor fine particulate matter (PM2.5): A review. Sci. Total Environ. 2017, 586, 610–622. [Google Scholar] [CrossRef]
  36. Martins, N.R.; da Graca, G.C. Impact of PM2.5 in indoor urban environments: A review. Sustain. Cities Soc. 2018, 42, 259–275. [Google Scholar] [CrossRef]
  37. Chen, C.; Zhao, B. Review of relationship between indoor and outdoor particles: I/O ratio, infiltration factor and penetration factor. Atmos. Environ. 2011, 45, 275–288. [Google Scholar] [CrossRef]
  38. Diapouli, E.; Chaloulakou, A.; Koutrakis, P. Estimating the concentration of indoor particles of outdoor origin: A review. J. Air Waste Manag. Assoc. 2013, 63, 1113–1129. [Google Scholar] [CrossRef]
  39. Rivas, M.; Viana, T.; Moreno, L.; Bouso, M.; Pandolfi, M.; Alvarez-Pedrerol, J.; Forns, A.; Alastuey, J.; Sunyer, X. Outdoor infiltration and indoor contribution of UFP and BC, OC, secondary inorganic ions and metals in PM2.5 in schools. Atmos. Environ. 2015, 106, 129–138. [Google Scholar] [CrossRef]
  40. Assimakopoulos, V.D.; Bekiari, T.; Pateraki, S.; Maggos, T.; Stamatis, P.; Nicolopoulou, P.; Assimakopoulos, M.N. Assessing personal exposure to PM using data from an integrated indoor-outdoor experiment in Athens-Greece. Sci. Total Environ. 2018, 636, 1303–1320. [Google Scholar] [CrossRef]
  41. Zwoździak, A.; Sówka, I.; Krupińska, B.; Zwoździak, J.; Nych, A. Infiltration or indoor sources as determinants of the elemental composition of particulate matter inside a school in Wrocław, Poland? Build. Environ. 2013, 66, 173–180. [Google Scholar] [CrossRef]
  42. Custodio, D.; Pinho, I.; Cerqueira, M.; Nunes, T.; Pio, C. Indoor and outdoor suspended particulate matter and associated carbonaceous species at residential homes in northwestern Portugal. Sci. Total Environ. 2014, 473–474, 72–76. [Google Scholar] [CrossRef] [PubMed]
  43. Meng, Q.Y.; Spector, D.; Colome, S.; Turpin, B. Determinants of indoor and personal exposure to PM2.5 of indoor and outdoor origin during the RIOPA study. Atmos. Environ. 2009, 43, 5750–5758. [Google Scholar] [CrossRef] [PubMed] [Green Version]
  44. Jeong, C.H.; Salehi, S.; Wu, J.; North, M.L.; Kim, J.S.; Chow, C.W.; Evans, G.J. Indoor measurements of air pollutants in residential houses in urban and suburban areas: Indoor versus ambient concentrations. Sci. Total Environ. 2019, 693, 133446. [Google Scholar] [CrossRef]
  45. Li, C.L.; Fu, J.M.; Sheng, G.Y.; Bi, X.H.; Hao, Y.M.; Wang, X.M.; Mai, B.X. Vertical distribution of PAHs in the indoor and outdoor PM2.5 in Guangzhou, China. Build. Environ. 2005, 40, 329–341. [Google Scholar] [CrossRef]
  46. Wang, Y.; Zhang, Q.Q.; He, K.; Zhang, Q.; Chai, L. Sulfate-nitrate-ammonium aerosols over China: Response to 2000–2015 emission changes of sulfur dioxide, nitrogen oxides, and ammonia. Atmos. Chem. Phys. 2013, 13, 2635–2652. [Google Scholar] [CrossRef] [Green Version]
  47. Li, C.; McLinden, C.; Fioletov, V.; Krotkov, N.; Carn, S.; Joiner, J.; Streets, D.; He, H.; Ren, X.; Li, Z.; et al. India Is Overtaking China as the World’s Largest Emitter of Anthropogenic Sulfur Dioxide. Sci. Rep. 2017, 7, 14304. [Google Scholar] [CrossRef] [Green Version]
  48. Wen, L.; Xue, L.K.; Wang, X.X.; Xu, C.H.; Chen, T.S.; Yang, L.X.; Wang, T.; Zhang, Q.Z.; Wang, W.X. Summertime fine particulate nitrate pollution in the North China Plain: Increasing trends, formation mechanisms and implications for control policy. Atmos. Chem. Phys. 2018, 18, 11261–11275. [Google Scholar] [CrossRef] [Green Version]
  49. Nie, W.; Wang, T.; Gao, X.M.; Pathak, R.K.; Wang, X.F.; Gao, R.; Zhang, Q.Z.; Yang, L.X.; Wang, W.X. Comparison among filter-based, impactor based and continuous techniques for measuring atmospheric fine sulfate and nitrate. Atmos. Environ. 2010, 44, 4396–4403. [Google Scholar] [CrossRef]
  50. Zhou, Y.; Wang, T.; Gao, X.M.; Xue, L.K.; Wang, X.F.; Wang, Z.; Gao, J.; Zhang, Q.Z.; Wang, W.X. Continuous observations of water-soluble ions in PM2.5 at Mount Tai (1534 m a.s.l.) in central-eastern China. J. Atmos. Chem. 2010, 64, 107–127. [Google Scholar] [CrossRef]
  51. Wang, Z.; Wang, T.; Gao, R.; Xue, L.K.; Guo, J.; Zhou, Y.; Nie, W.; Wang, X.F.; Xu, P.J.; Gao, J.; et al. Source and variation of carbonaceous aerosols at Mount Tai, North China: Results from a semicontinuous instrument. Atmos. Environ. 2011, 45, 1655–1667. [Google Scholar] [CrossRef]
  52. Norris, G.; Duvall, R.; Brown, S.; Bai, S. EPA-Positive Matrix Factorization (PMF) 5.0 Fundamentals and User Guide; U.S. Environmental Protection Agency: Washington, DC, USA, 2014.
  53. Wang, Q.Q.; He, X.; Huang, X.H.; Griffith, S.M.; Feng, Y.M.; Zhang, T.; Zhang, Q.Y.; Wu, D.; Yu, J.Z. Impact of Secondary Organic Aerosol Tracers on Tracer-Based Source Apportionment of Organic Carbon and PM2.5: A Case Study in the Pearl River Delta, China. ACS Earth Space Chem. 2017, 1, 562–571. [Google Scholar] [CrossRef]
  54. World Health Organization. Air Quality Guidelines-Global Update 2005: Particulate Matter, Ozone, Nitrogen Dioxide and Sulfur Dioxide; WHO Regional Office for Europe: Copenhagen, Denmark, 2006; ISBN 92-890-21926. Available online: http://www.euro.who.int/_data/assets/pdf_file/0005/78638/E90038.pdf (accessed on 20 August 2020).
  55. Cheng, S.H.; Yang, L.X.; Zhou, X.H.; Wang, Z.; Zhou, Y.; Gao, X.M.; Nie, W.; Wang, X.X.; Xu, P.J.; Wang, W.X. Evaluating PM2.5 ionic components and source apportionment in Jinan, China from 2004 to 2008 using trajectory statistical methods. J. Environ. Monit. 2011, 13, 1662. [Google Scholar] [CrossRef] [PubMed]
  56. USEPA (United States Environmental Protection Agency). Human Health Evaluation Manual. EPA/540/1–89/002. Risk Assessment Guidance for Superfund; U.S. Environmental Protection Agency: Washington, DC, USA, 1989; Volume I.
  57. Yang, Y.L.; Cheng, S.H.; Wang, X.F.; Nie, W.; Xu, P.J.; Gao, X.M.; Yuan, C.; Wang, W.X. Source identification and health impact of PM2.5 in a heavily polluted urban atmosphere in China. Atmos. Environ. 2013, 75, 265–269. [Google Scholar] [CrossRef]
  58. Setyan, A.; Patrick, M.; Wang, J. Very low emissions of airborne particulate pollutants measured from two municipal solid waste incineration plants in Switzerland. Atmos. Environ. 2017, 166, 99–109. [Google Scholar] [CrossRef]
  59. Liu, Y.M.; Fan, Q.; Chen, X.Y.; Zhao, J.; Ling, Z.H.; Hong, Y.Y.; Li, W.B.; Chen, X.L.; Wang, M.J.; Wei, X.L. Modeling the impact of chlorine emissions from coal combustion and prescribed waste incineration on tropospheric ozone formation in China. Atmos. Chem. Phys. 2018, 18, 2709–2724. [Google Scholar] [CrossRef] [Green Version]
  60. Lough, G.C.; Schauer, J.J.; Park, J.S.; Shafer, M.M.; Deminter, J.T.; Weinstein, J.P. Emissions of metal associated with motor vehicle roadways. Environ. Sci. Technol. 2005, 39, 826–836. [Google Scholar] [CrossRef]
  61. Morishita, M.; Keeler, G.J.; Wagner, J.G.; Harkema, J.R. Source identification of ambient PM2.5 during summer inhalation exposure studies in Detroit, MI. Atmos. Environ. 2006, 40, 3823–3834. [Google Scholar] [CrossRef]
  62. Duan, J.C.; Tan, J.H. Atmospheric heavy metals and Arsenic in China: Situation, sources and control policies. Atmos. Environ. 2013, 74, 93–101. [Google Scholar] [CrossRef]
  63. Liu, B.S.; Song, N.; Dai, Q.L.; Mei, R.B.; Sui, B.H.; Bi, X.H.; Feng, Y.C. Chemical composition and source apportionment of ambient PM2.5 during the non-heating period in Taian, China. Atmos. Res. 2016, 170, 23–33. [Google Scholar] [CrossRef]
  64. Lim, J.M.; Lee, J.H.; Moon, J.H.; Chung, Y.S.; Kin, K.H. Source apportionment of PM10 at a small industrial area using Positive Matrix Factorization. Atmos. Res. 2010, 95, 88–100. [Google Scholar] [CrossRef]
  65. Alleman, L.Y.; Lamaison, L.; Perdri, E.; Robache, A.; Galloo, J.C. PM10 metal concentrations and source identification using positive matrix. Atmos. Res. 2010, 96, 612–625. [Google Scholar] [CrossRef]
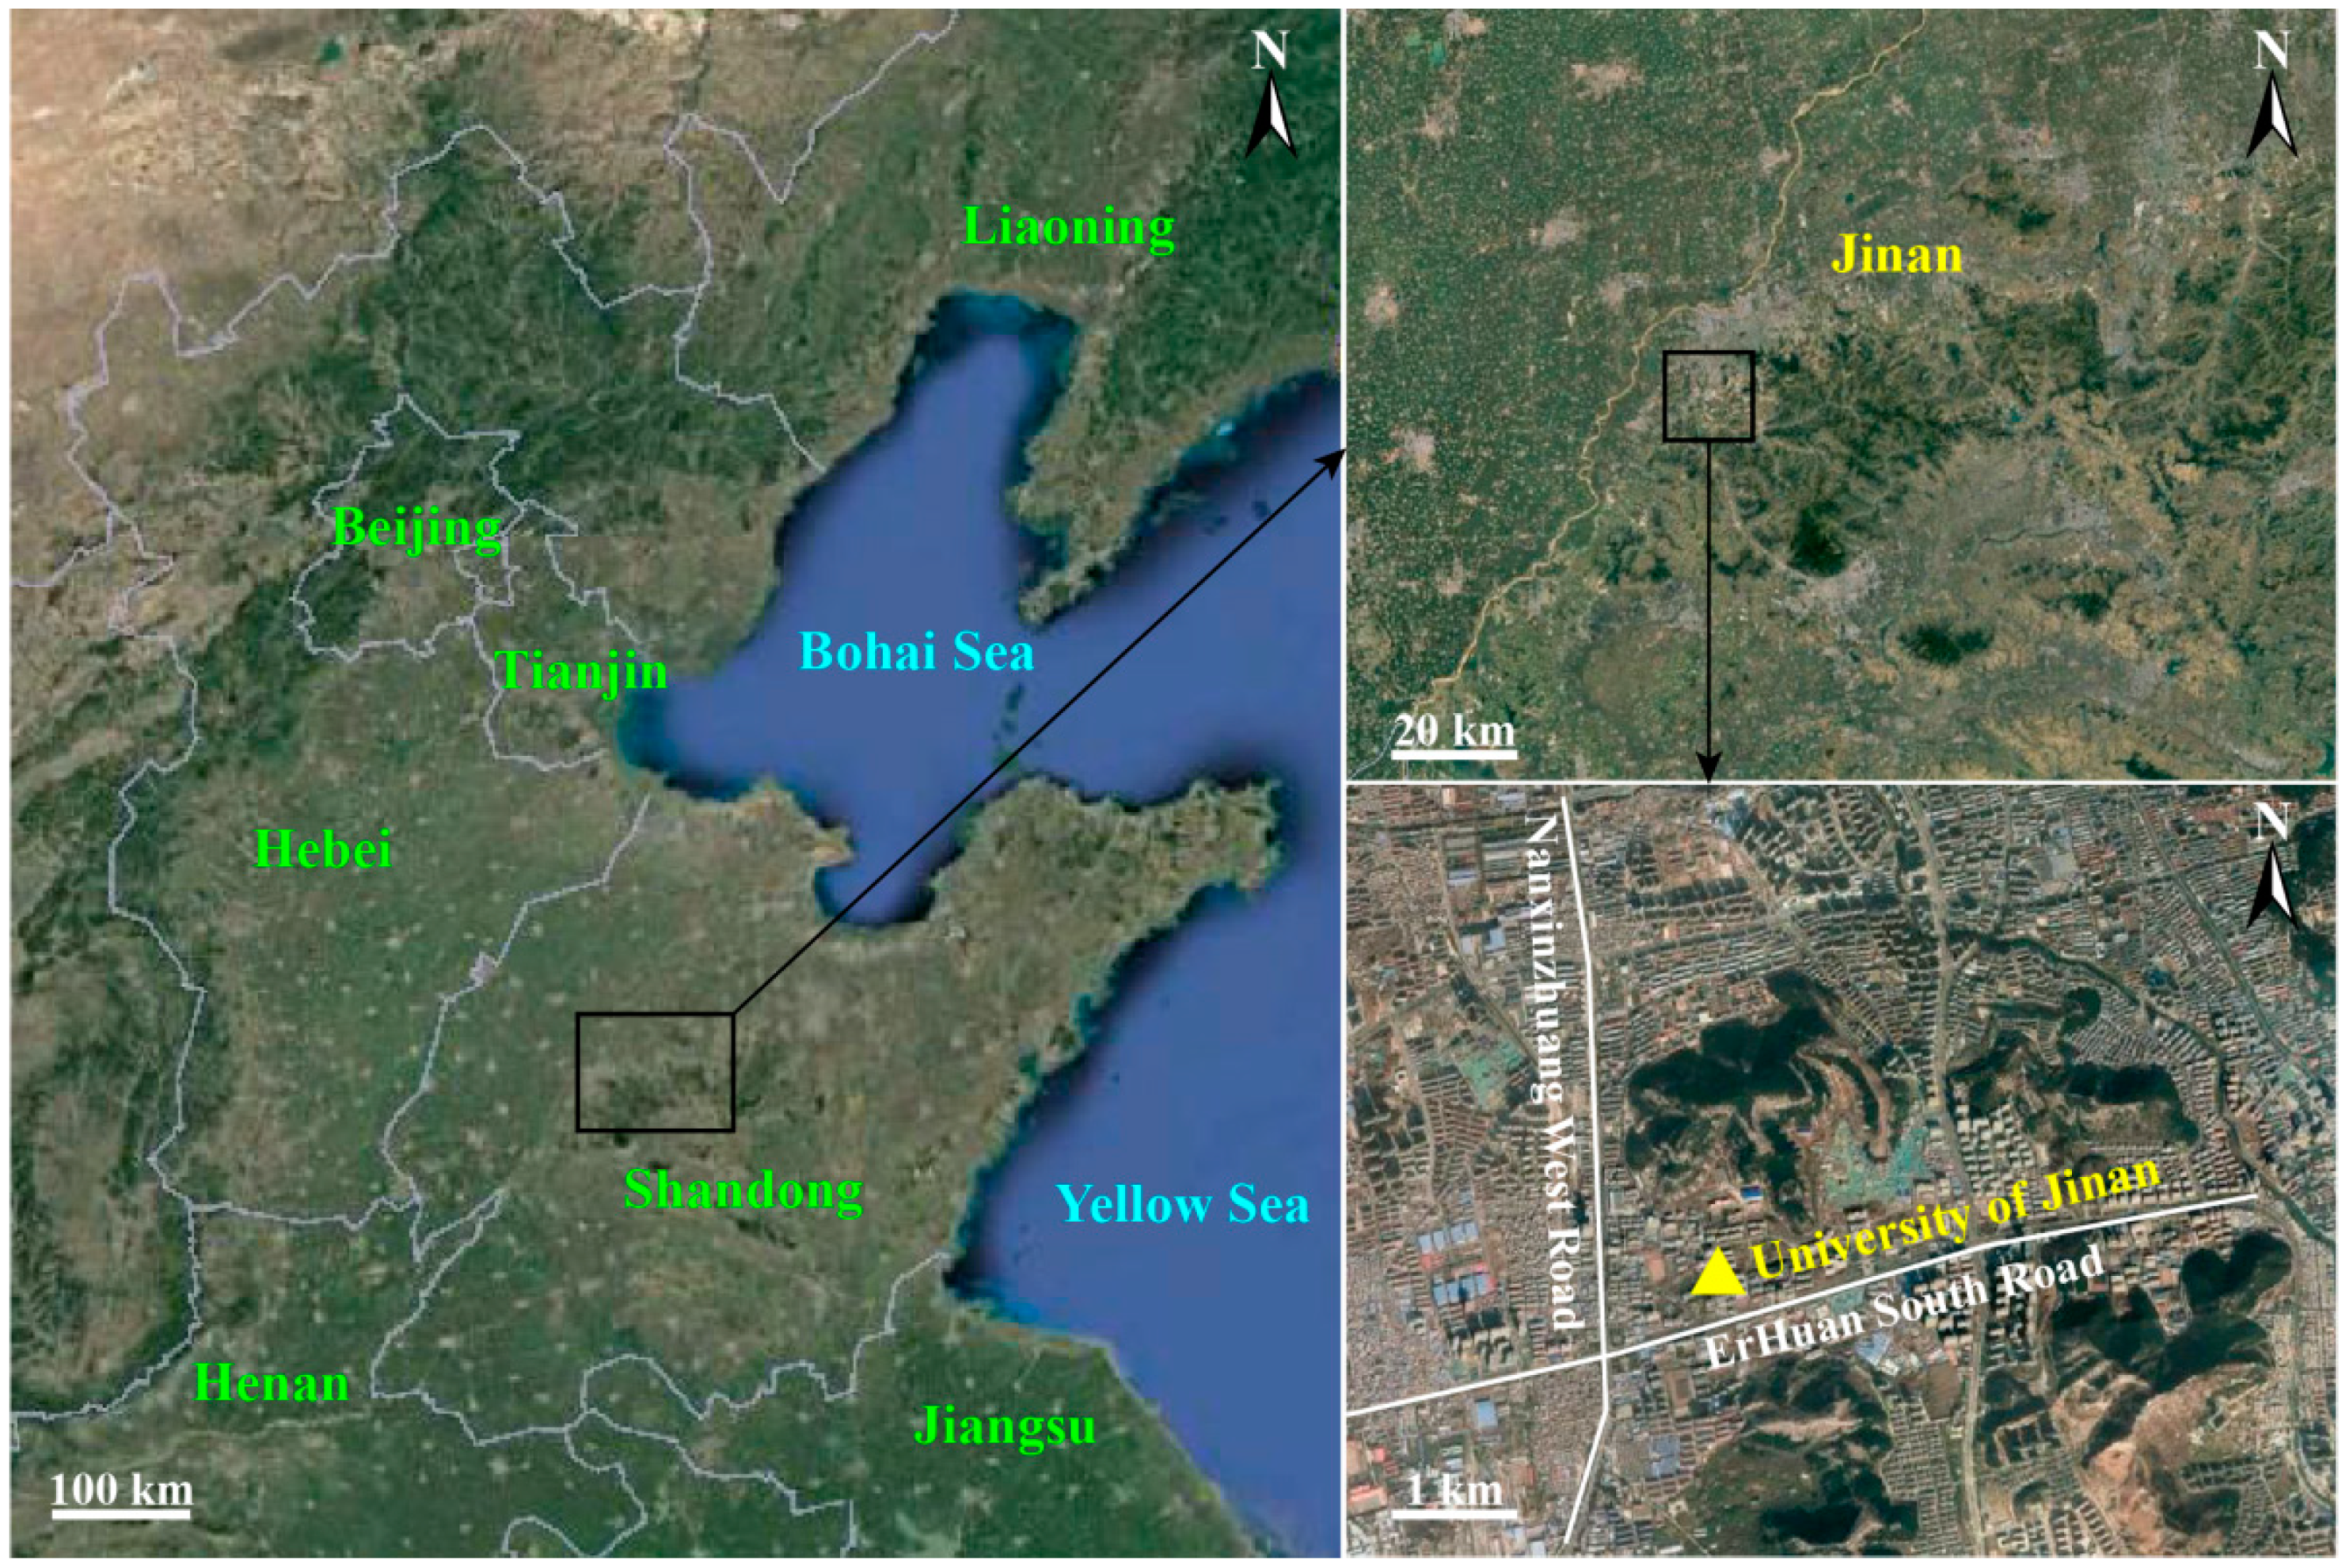
Figure 1. Location of sampling site.
Atmosphere 11 00885 g001
Figure 2. Time series of indoor and outdoor PM2.5 mass concentrations.
Atmosphere 11 00885 g002
Figure 3. Chemical composition of indoor and outdoor PM2.5.
Atmosphere 11 00885 g003
Figure 4. Indoor/outdoor ratios (I/O ratios) of PM2.5 and its chemical components (Boxes range: 25% and 75%; Points: median; Whiskers: 1.5 times the interquartile range away).
Atmosphere 11 00885 g004
Figure 5. Linear regression between indoor and outdoor: (a) PM2.5; (b) SO42−, NO3, and NH4+; (c) OC and EC.
Atmosphere 11 00885 g005
Figure 6. Factor profile of PMF results.
Atmosphere 11 00885 g006
Figure 7. Contribution of six factors to indoor and outdoor PM2.5 obtained from PMF: (a) indoor and (b) outdoor.
Atmosphere 11 00885 g007
Figure 8. Time series of PM10, PM2.5/PM10, AQI, and aged dust contribution to PM2.5 obtained by PMF.
Atmosphere 11 00885 g008
Table 1. Statistics of indoor and outdoor PM2.5 and chemical components (µg m−3).
IndoorOutdoor
Species24 h Mean
(N = 20)
Day Mean
(N = 13)
Night Mean
(N = 13)
24 h Mean
(N = 20)
Day Mean
(N = 13)
Night Mean
(N = 13)
PM2.569.03 ± 50.4785.65 ± 52.8779.70 ± 56.31128.74 ± 67.94146.92 ± 78.01148.42 ± 71.95
SO42−14.55 ± 6.9218.25 ± 7.1016.46 ± 7.8217.73 ± 9.2722.62 ± 10.2220.65 ± 10.05
NO314.00 ± 7.8017.72 ± 8.6114.37 ± 7.4834.39 ± 16.3741.58 ± 17.5540.63 ± 15.80
Cl1.01 ± 0.451.18 ± 0.380.92 ± 0.432.71 ± 1.743.33 ± 2.193.11 ± 2.21
F0.41 ± 0.180.52 ± 0.260.41 ± 0.210.44 ± 0.200.59 ± 0.330.48 ± 0.19
NO20.59 ± 0.210.75 ± 0.050.61 ± 0.270.60 ± 0.210.75 ± 0.060.62 ± 0.30
Na+0.47 ± 0.220.55 ± 0.250.50 ± 0.260.51 ± 0.230.62 ± 0.300.55 ± 0.27
NH4+8.20 ± 4.9010.11 ± 5.079.50 ± 5.9115.04 ± 8.0318.70 ± 9.1517.74 ± 8.34
K+0.83 ± 0.451.00 ± 0.451.04 ± 0.471.11 ± 0.551.33 ± 0.641.38 ± 0.57
Mg2+0.14 ± 0.130.15 ± 0.160.15 ± 0.130.29 ± 0.200.33 ± 0.280.34 ± 0.19
Ca2+1.50 ± 0.811.52 ± 0.721.41 ± 0.722.42 ± 0.862.68 ± 1.072.16 ± 1.10
OC11.46 ± 5.6213.53 ± 6.2013.96 ± 5.8614.88 ± 7.8016.98 ± 9.4018.55 ± 8.81
EC2.53 ± 1.062.86 ± 1.232.92 ± 1.103.53 ± 1.563.63 ± 1.984.24 ± 1.56
N denotes the number of samples.
Table 2. R values estimated from elements of PM2.5 in the indoor and outdoor environments.
IndoorOutdoor
ElementsChildren
(2–6 Years)
Children
(6–12 Years)
Older AdultsChildren
(2–6 Years)
Children
(6–12 Years)
Older Adults
S0.150.160.120.190.190.14
V6.61 × 10−56.71 × 10−55.02 × 10−58.16 × 10−58.29 × 10−56.20 × 10⁻⁵
Cr0.140.140.100.160.160.12
Mn0.280.280.210.350.350.26
Ni3.18 × 10−43.22 × 10−42.41 × 10−43.33 × 10−43.38 × 10−42.53 × 10⁻⁴
Cu1.24 × 10−41.25 × 10−49.38 × 10−51.50 × 10−41.52 × 10−41.14 × 10⁻⁴
Zn1.20 × 10−41.22 × 10−49.13 × 10−51.37 × 10−41.39 × 10−41.04 × 10⁻⁴
Pb3.31 × 10−33.36 × 10−32.51 × 10−34.22 × 10−34.28 × 10−33.20 × 10⁻³
As5.94 × 10−36.03 × 10−34.51 × 10−37.69 × 10−37.80 × 10−35.83 × 10⁻³
Co0.210.210.160.190.190.14
Total0.780.800.590.900.910.68