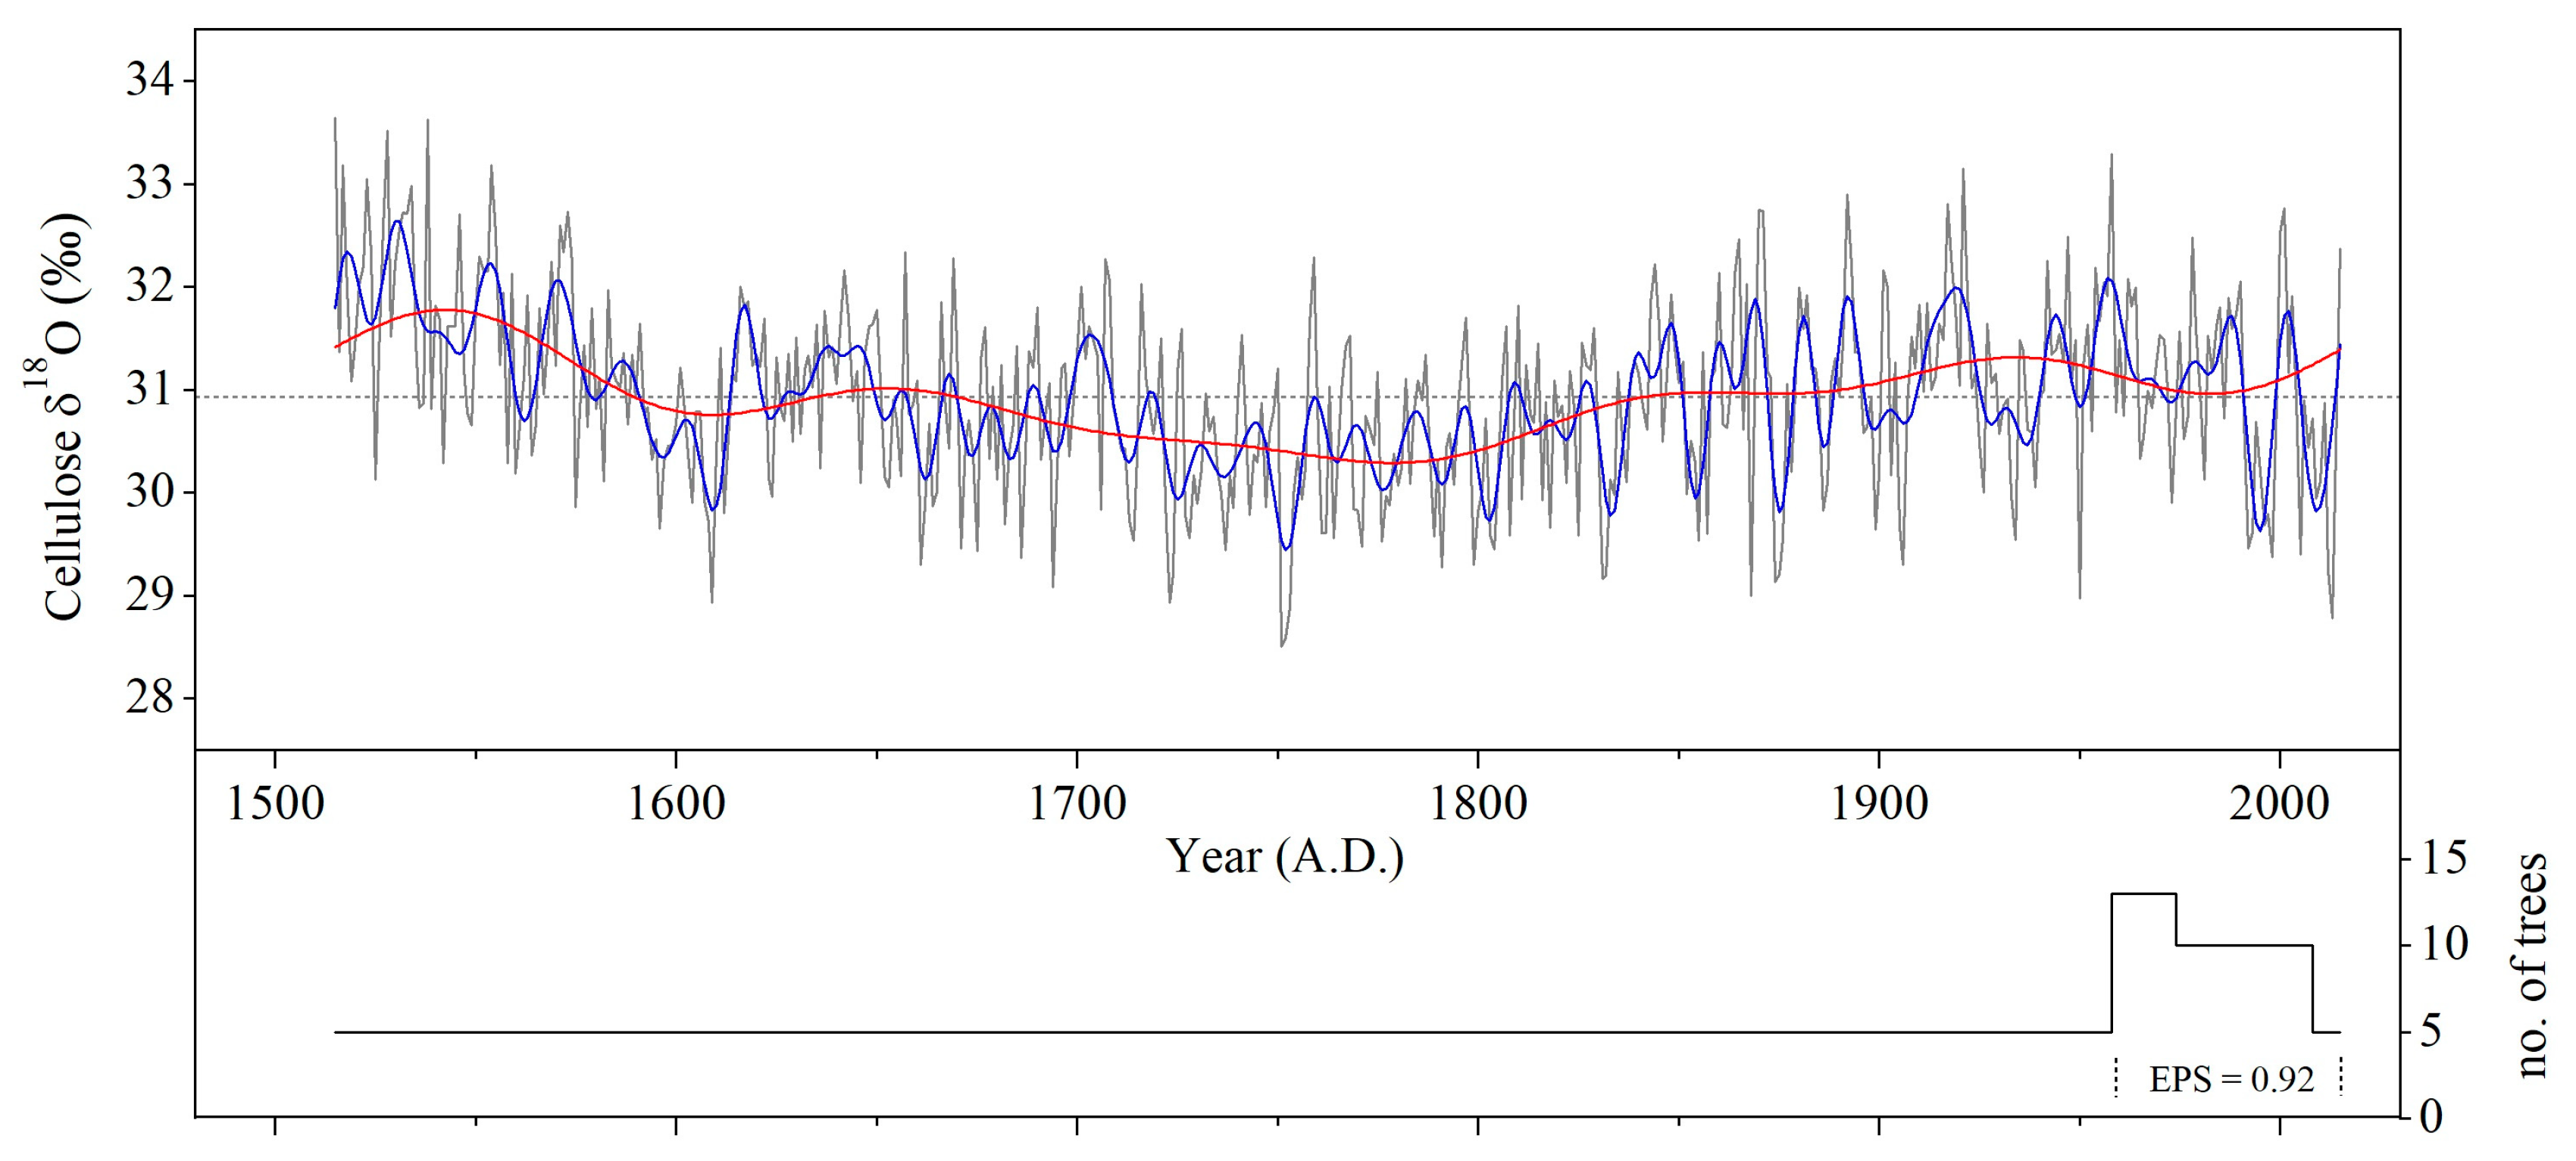
3.1. Characteristics of the Tree-Ring δ18O Chronology
Our resulting δ
18O chronology extends from 2015 back to 1515 AD (
Figure 2). The mean δ
18O value of the chronology is 30.94‰ ± 0.91, with a range of δ
18O values between 28.51‰ and 33.64‰, respectively (
Table 1). The average Rbar and EPS calculated for the period 1958–2015 were 0.48 (
p < 0.01) and 0.92. This exceeds the commonly accepted threshold of 0.85 for sufficient signal strength of a chronology [
60], indicating a high consistency between individual trees’ isotope series. Hence, we are confident that isotope chronology is also robust for the time before 1958, for which isotope samples were pooled for individual years (
Figure 2).
The first-order autocorrelation coefficient (AC1) was 0.41, indicating a significant influence of the previous year on the isotopic composition of the current tree ring. Trees with the access to snow meltwater or/and groundwater stored over one growing season can carry the climate signal of the preceding year along with the actual climate signal [
73,
74,
75]. Moreover, memory effects stemming from the incorporation of carbohydrates taken up during preceding years into the earlywood cell walls formed in the following year may contribute to the isotope signal of the whole tree ring. Considering the often very narrow tree rings of junipers of ca. 0.1 mm and their small portions of latewood, we nevertheless had to conduct stable isotope analyses for whole tree rings.
Our multi-century δ
18O chronology showed higher oxygen isotope values during the 16th century. Since the mid-16th century, a steady decline in tree ring δ
18O values can be observed (
Figure 2). From ca. 1670–1840, δ
18O values stayed below the 501-year mean δ
18O values for two centuries, with a gradual increase since 1790 AD. With regard to findings of Foroozan et al. [
29], more humid local climate conditions can be inferred for this period, as it was identified as a cooler period by Bayramzadeh et al. [
36]. After 1850 AD, the stable oxygen isotope ratios are constantly above the long-term mean, indicating generally drier climate conditions in northern Iran.
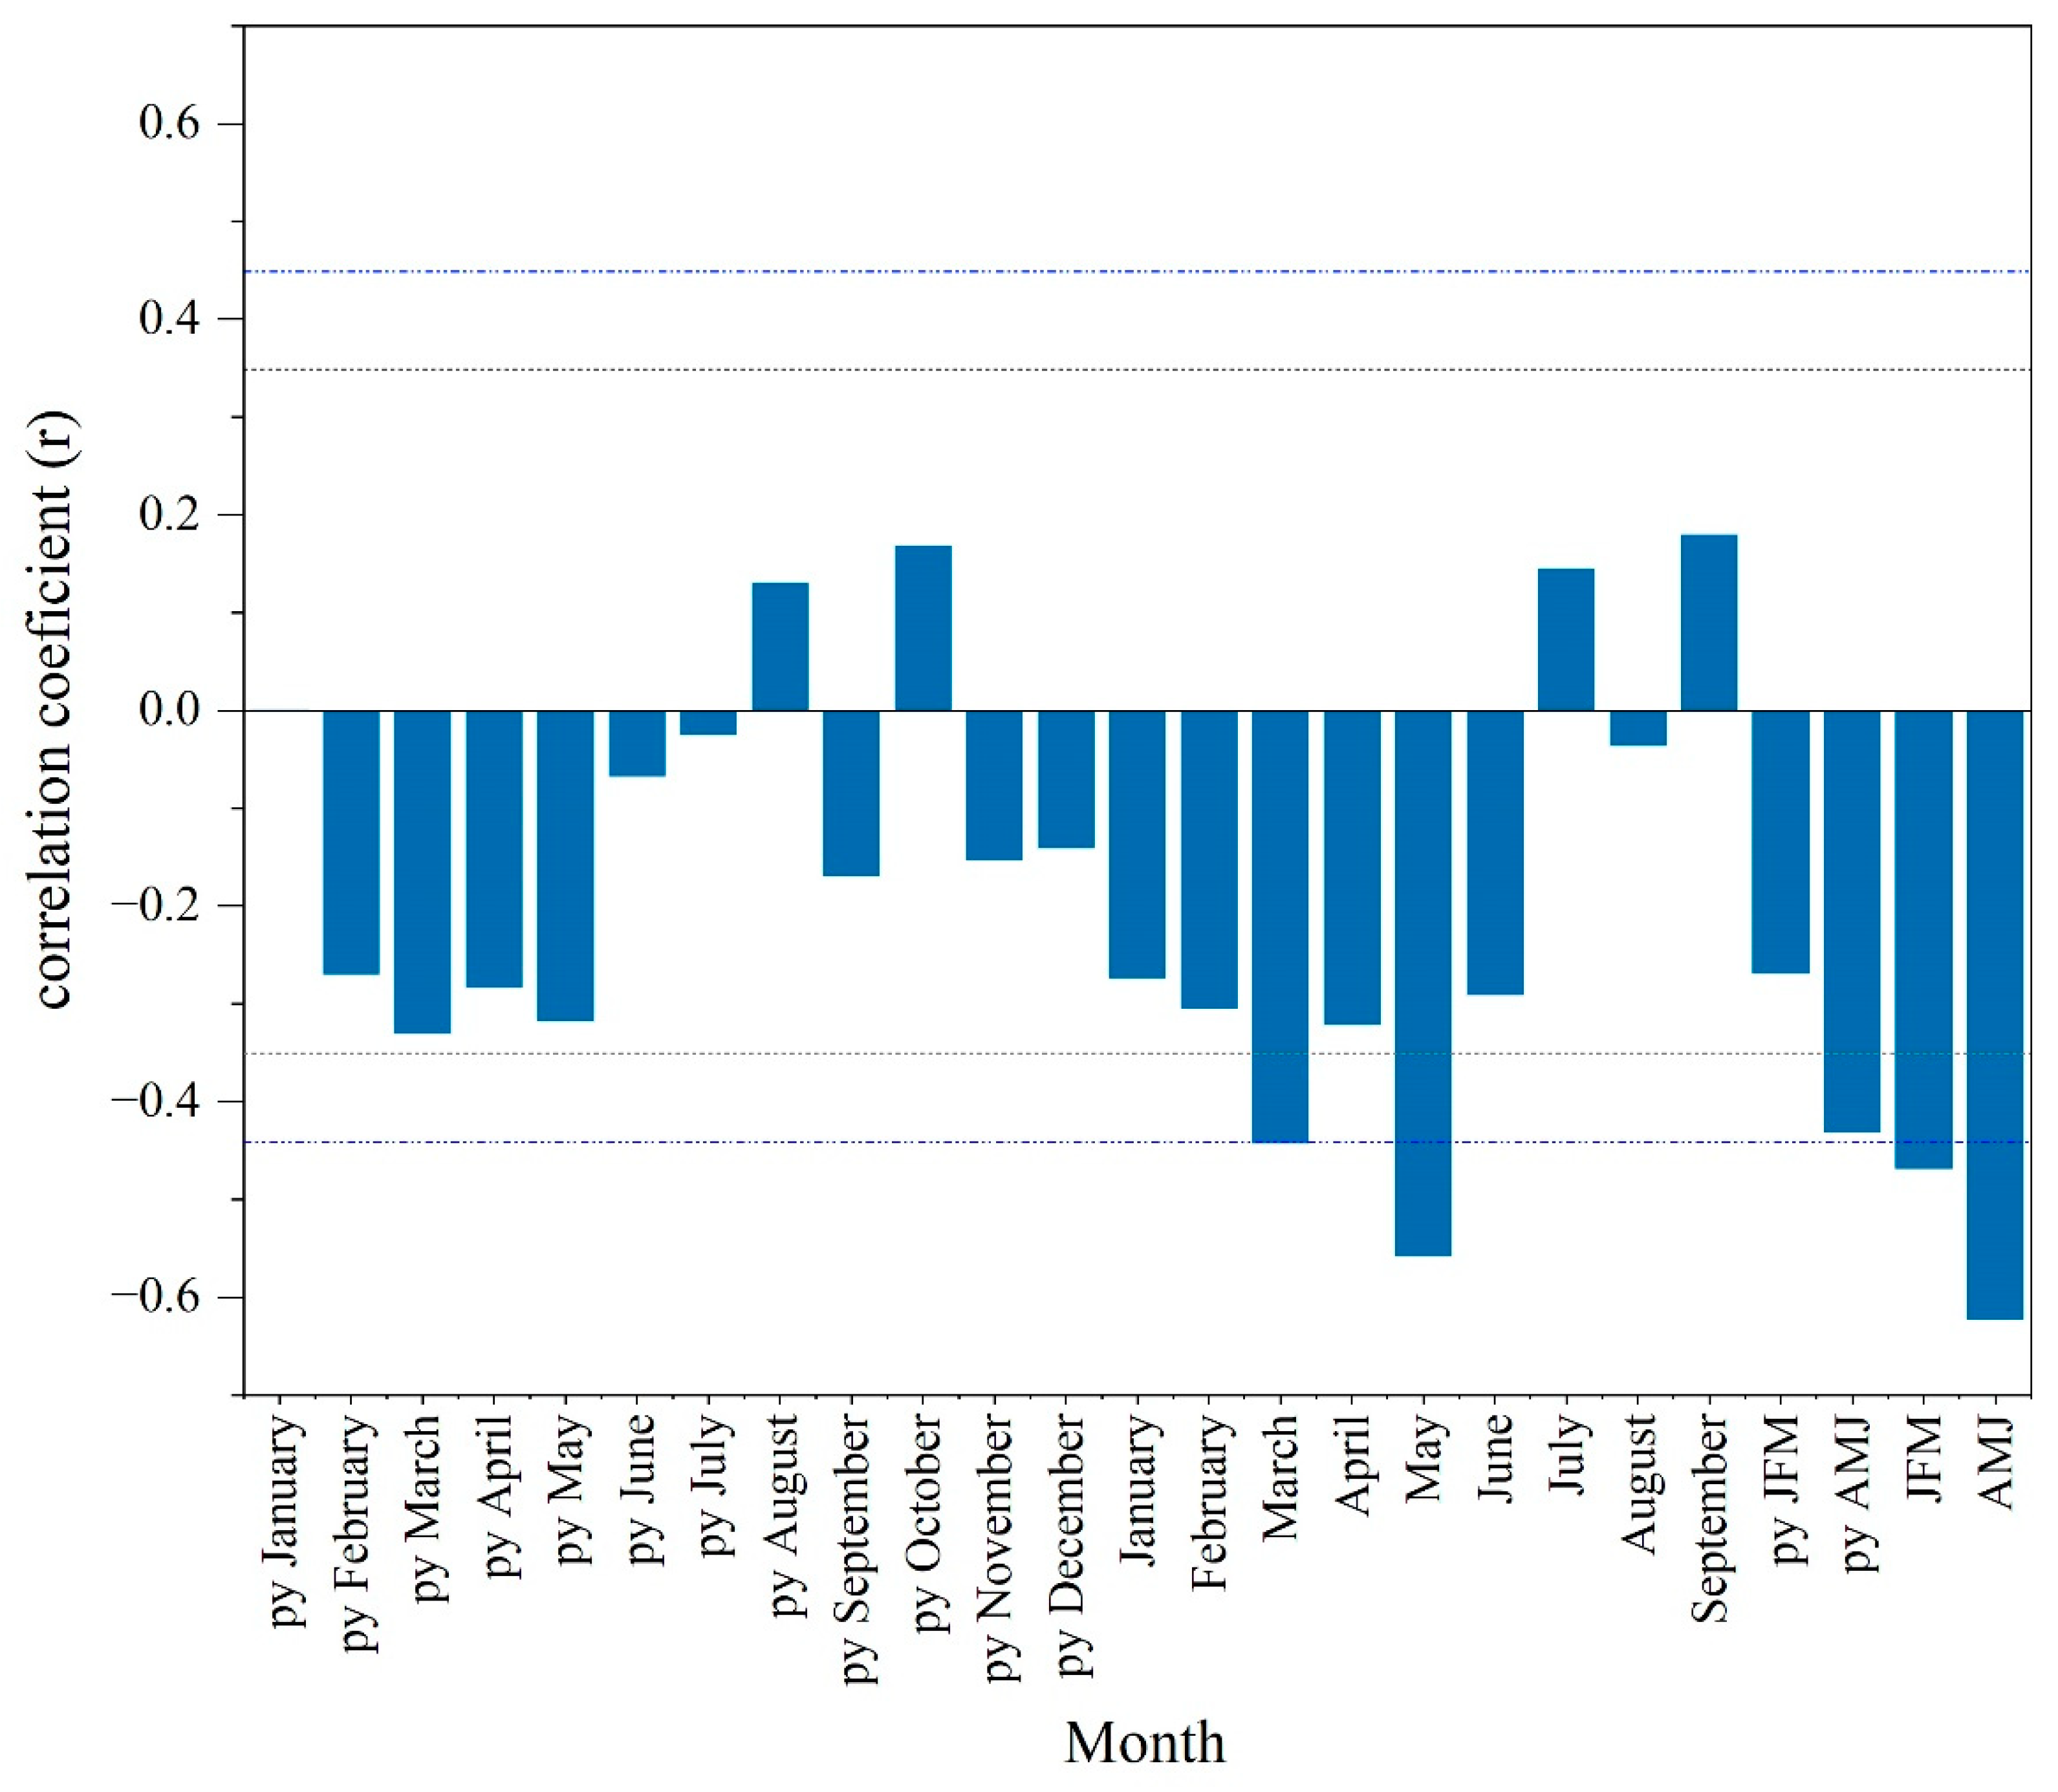
3.2. Climate—δ18O Response
Figure 3 illustrates the proxy-climate relationships as derived from calibration analyses between our δ
18O series and climate data from Mojen station.
In general, a significant negative relationship was observed between tree-ring δ
18O values with monthly precipitation during spring and winter months in both the current and previous year. Like in other studies conducted in Asia, statistically significant negative correlations were found between the tree-ring δ
18O values and precipitation [
24,
45,
47,
76,
77,
78]. Strongest negative correlations are apparent for tree-ring δ
18O and April–June seasonal precipitation during the year of growth (r = −0.62,
p < 0.01), indicating the major influence of spring precipitation on tree-ring δ
18O variations during the calibration period (AD 1982–2015) (
Figure 3).
In general, the variability of the oxygen isotope composition of plant organic material, such as tree-ring cellulose, depends on three main sources. The first source of δ
18O variability is determined by the source water absorbed from the soil by tree roots, which flows through the xylem into the leaf without further fractionation [
79,
80]. Source water for trees derives from meteoric water including local rainfall and snow, and from water stored in deeper soil layers or groundwater. The δ
18O of source water is determined by the isotopic composition of precipitation, which varies mainly with temperature [
57,
81]. The δ
18O of precipitation in high latitudes is in positive relation with temperature during droplet formation, so that winter precipitation under cold conditions will be more depleted in δ
18O [
20,
81,
82,
83]. Further, δ
18O in soil water alters by residence time in the soil and evaporation from the upper soil layers, causing the highest δ
18O enrichment in the superficial water pool [
84]. However, trees growing under drought conditions may use the deeper soil water pool, if the superficial soil moisture is depleted. Accordingly, such trees can show a different source water signal from the enriched δ
18O signal of the upper soil layers [
85,
86,
87].
The second source of tree-ring δ
18O variability is the δ
18O variations in leaf water. Within leaves, the δ
18O signal of the source water is modified at the evaporative sites as the result of evaporative losses of the lighter water isotopologues H
16O during transpiration [
88,
89]. This indicates the key role of relative humidity determining the gradient of the water vapor pressure in the intercellular air spaces and the air around the leaves on transpiration rate, and consequently on the evaporative enrichment of leaf water [
23,
88,
90,
91]. Accordingly, plants growing at higher vapor pressure deficit are expected to have higher leaf water enrichment [
92]. However, this is the case when the variation in evaporative demand controls the transpiration rate [
89]. The other likely scenario happens when the dominant advection of non-δ
18O enriched water from the xylem to the evaporative sites hinders the isotopically enriched water to diffuse back from the evaporative sites to the leaf lamina, where it mixes with unenriched xylem water, which is called Péclet-effect [
88,
89,
93]. According to the conceptual Péclet model, the greater the Péclet number, the less the enrichment of water in the leaf will be. However, conifer needles have a rather low density of stomata, and their transportation rates are relatively low. In addition, the variation of their effective path length for water movement through the mesophyll is not very well understood [
94]. In this concept, some studies even applied a two-pool model as a sufficient alternative to explain the leaf water enrichment in conifers [
94,
95]. The two-pool model proposes the existence of two separate water pools within leaves, the unenriched source water mainly in the major veins and the enriched water in the evaporative site, to explain the difference between the isotopic enrichment of leaf water and evaporative site. Either way, compared with the positive effect of the evaporation on leaf water enrichment, the negative effect of the Péclet model is negligible and will further diminish through the process of tree-ring formation. Hence it does not have a considerable effect on isotopic signals in tree-ring cellulose [
23,
96].
The
18O signature of leaf water enrichment will be imprinted on sucrose during assimilation, by which oxygen atoms exchange between enriched leaf water and carbonyl groups. Sucrose is then carried down along the trunk through the phloem to the cambium cells, where additional oxygen atom exchange occurs between sucrose and source (xylem) water during cellulose biosynthesis [
97]. Based on initial measurements, an enrichment factor of 27‰ on average is considered for δ
18O of cellulose relative to δ
18O of the source water [
98,
99,
100]. Thus, the isotopic signal of cellulose will eventually reflect the δ
18O signal of the source water and leaf water enrichment, relative to their relative strength.
Due to the shallow root system of junipers, trees in this study use the superficial soil water pools during the growing season, which probably contain a mixture of solid winter precipitation (snow) and liquid precipitation falling during the early growing season. Therefore, the significant negative correlation (r = − 0.47,
p < 0.05) between the tree-ring δ
18O and winter (January–March) precipitation during the current year points to a probable use of less
18O enriched water by the trees coming from snowmelt during the early growing season for earlywood formation (
Figure 3).
With regard to the negative effects of vapor pressure during spring on δ
18O values (r = −0.58,
p < 0.01) in junipers, the strong negative correlation between spring precipitation and cellulose δ
18O can be explained by the influence of precipitation on vapor pressure and plant transpiration. Accordingly, a growing season with higher precipitation results in lower vapor pressure deficit and plant transpiration, and consequently to a lower enrichment of leaf water δ
18O. Lower evaporative enrichment on the leaf level will lead to carbohydrates with a lower δ
18O signature, which will be transported via the phloem down the stem to be finally incorporated in wood cellulose [
23,
101].
The significant positive δ18O-temperature relationship (r = 0.49, p < 0.01) supports our interpretation that the δ18O signal in tree-ring cellulose rather reflects variations in leaf water evaporative enrichment than in source water. Actually, the temperature has an indirect effect on δ18O variations in juniper tree-rings by increasing evaporative enrichment during spring.
Regarding the highest negative δ
18O-precipitation correlation, the total sum of spring precipitation of the current and the previous year (r = −0.72,
p < 0.01) was chosen as the most robust predictor of δ
18O variations in tree rings in our study site (
Table 2).
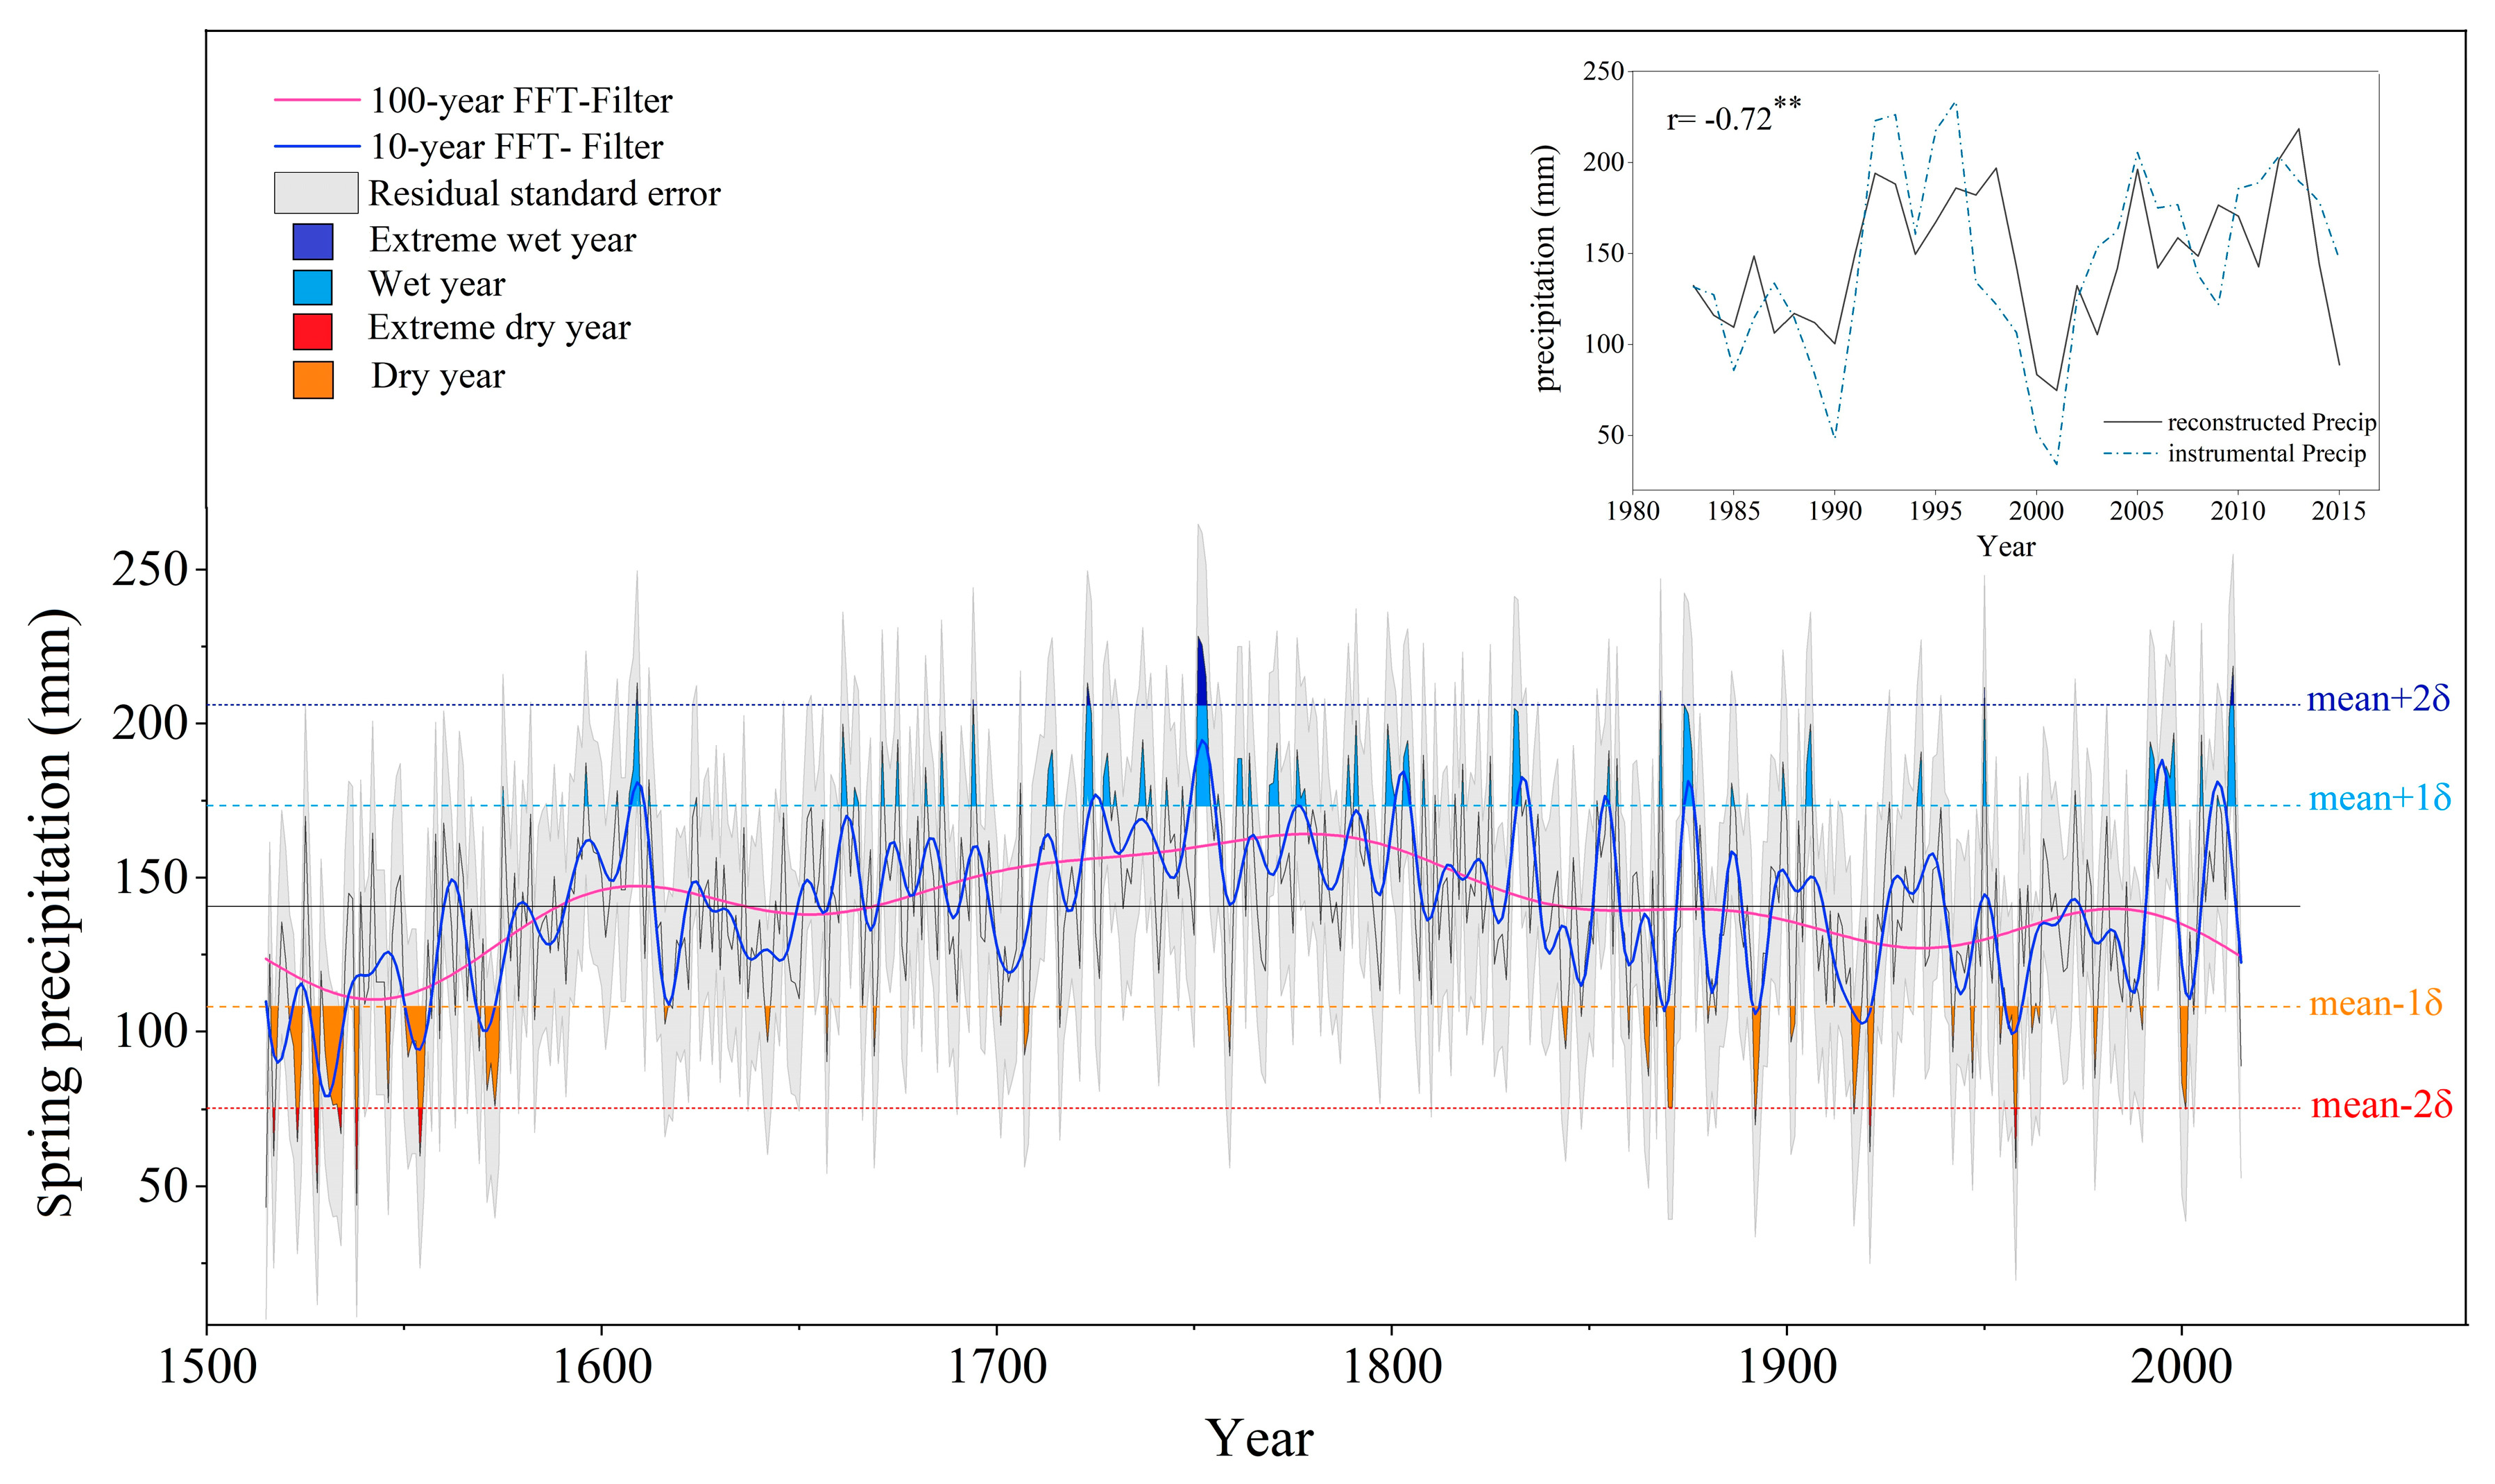
3.3. Precipitation Reconstruction
We developed the following linear regression model to reconstruct the variations in the combined total precipitation of py AMJ + AMJ in northern Iran back to 1515 AD:
Verification statistics for our precipitation reconstruction including the reduction of error (RE), the sign test (ST), F-stat, Durbin–Watson test, and product means test (PMT) [
15,
102,
103] are shown in
Table 3. The resulting reconstruction explained 52% of the actual precipitation py AMJ + AMJ variance during the calibration period. The Durbin–Watson (DW) statistic was less than 2 (DW = 1.14), meaning that moderate autocorrelation is apparent in the regression residuals of the calibration model (
Table 3). Positive RE and an
F-test value of 33.90 confirmed the validity and reliability of the linear regression model (
Table 3). According to the significant sign-test, the number of agreements and disagreements between the reconstructed and instrumental data [
15], indicates consistency in the high-frequency variations of the actual and reconstructed values (
Table 3). In summary, the statistical results proved the stability and predictive skill of the regression model.
Based on these verification results, we reconstructed precipitation during the early growing season (py AMJ + AMJ) using Equation (1) for the 501-year long period from 1515 to 2015 (
Figure 4). Unfortunately, the shortness of the climate data series covering only 34 years does not allow for testing the stationarity of the climate-proxy relationships. However, the explanations of the tree-ring isotope relations are meaningful from a tree physiological point of view, since the reconstructed climatic window covers the main growing season of the trees. Therefore, we have confidence that the detected main climate influence on the isotope variation in the studied trees was also valid in other climate periods and that the presented reconstruction is trustworthy.
The mean total precipitation py AMJ + AMJ reconstructed for 1515–2015 was 140.7 ± 32.7 mm. On a centennial timescale, the 16th century showed the highest negative deviation below the 501-year average precipitation (mean
precip = 120 mm) (
Figure 4). However, this period showed a gradual tendency towards wetter conditions into the 17th century. From ca. 1665–1840, spring precipitation stayed above average (
Figure 4). The most humid periods occurred during the second half of the 18th century. These humid periods seem to coincide with cold periods at the beginning of the 17th and 18th century and 1749 until 1830, as reported by Bayramzadeh et al. [
36]. In contrast, the 19th and 20th centuries witnessed a gradual decline in spring precipitation (
Figure 4). Our finding is consistent with results by Khaleghi [
32], who postulated for northeastern Iran a long-term declining precipitation trend over the last two centuries.
Years with relatively dry/wet AMJ periods were identified as dry year < 108 mm, wet year > 173.4 mm, extreme dry year < 75.4 mm, and extreme wet year > 206 mm, respectively. The identification of dry/wet events revealed that our multi-century reconstruction consists of 68% normal years, 17% years with relatively wet and extremely wet AMJ periods, and 15% years with relatively dry and extremely dry AMJ periods (
Table A1 and
Table A2). About 38% of wet and extreme wet events of the last 501 years were observed during the 18th century (
Figure 4,
Table 4). Hence, the 18th century was the wettest century during the past 501 years, with a mean total precipitation of 157.7 mm. The highest frequencies of dry and extremely dry year events occurred in the 16th century, the driest period of the past 501 years (
Figure 4,
Table 4). The 20th century can be characterized as the driest century since the past 400 years (mean
precip = 133.3 mm), with the highest frequencies of the dry and extreme dry events since the 16th century. Throughout the last three centuries, the occurrence of dry events continued to rise, whereas wet year events decreased. However, the frequency of the occurrence of extreme events increased in this period (
Table 4). In accordance with the NDWMC report, years with dry and wet conditions have frequently occurred in Iran during the last 30 years, while the frequency of dry years is higher [
104].
Based on our precipitation reconstruction, the duration of the dry periods varied from one year to maximum five years, whilst one and two year dry periods occurred more frequently, as 70% and 21% of dry periods lasted for one and two years, respectively. The highest frequencies of one and two year length dry period has been reported for the southern Zagros Mountains in Southwest Iran [
5,
34] (
Table A1). Longer dry periods of 4–5 years, that account for 9% of the dry periods, arose only in the 16th century. The periods 1530–1534, 1551–1555, and 1956–1958 were the longest periods with drier conditions during the 16th and 20th centuries (
Table A1). The persistence of wet periods varies from one to three years, whilst 64% of wet periods lasted for one year and 21% and 13% lasted for two and three years, respectively. However, one wet period in the 18th century (1751–1754) lasted for four years. Prolonged wet periods occurred mostly in the 18th century and included about 57% of three year wet periods of the last five centuries (
Table A1).
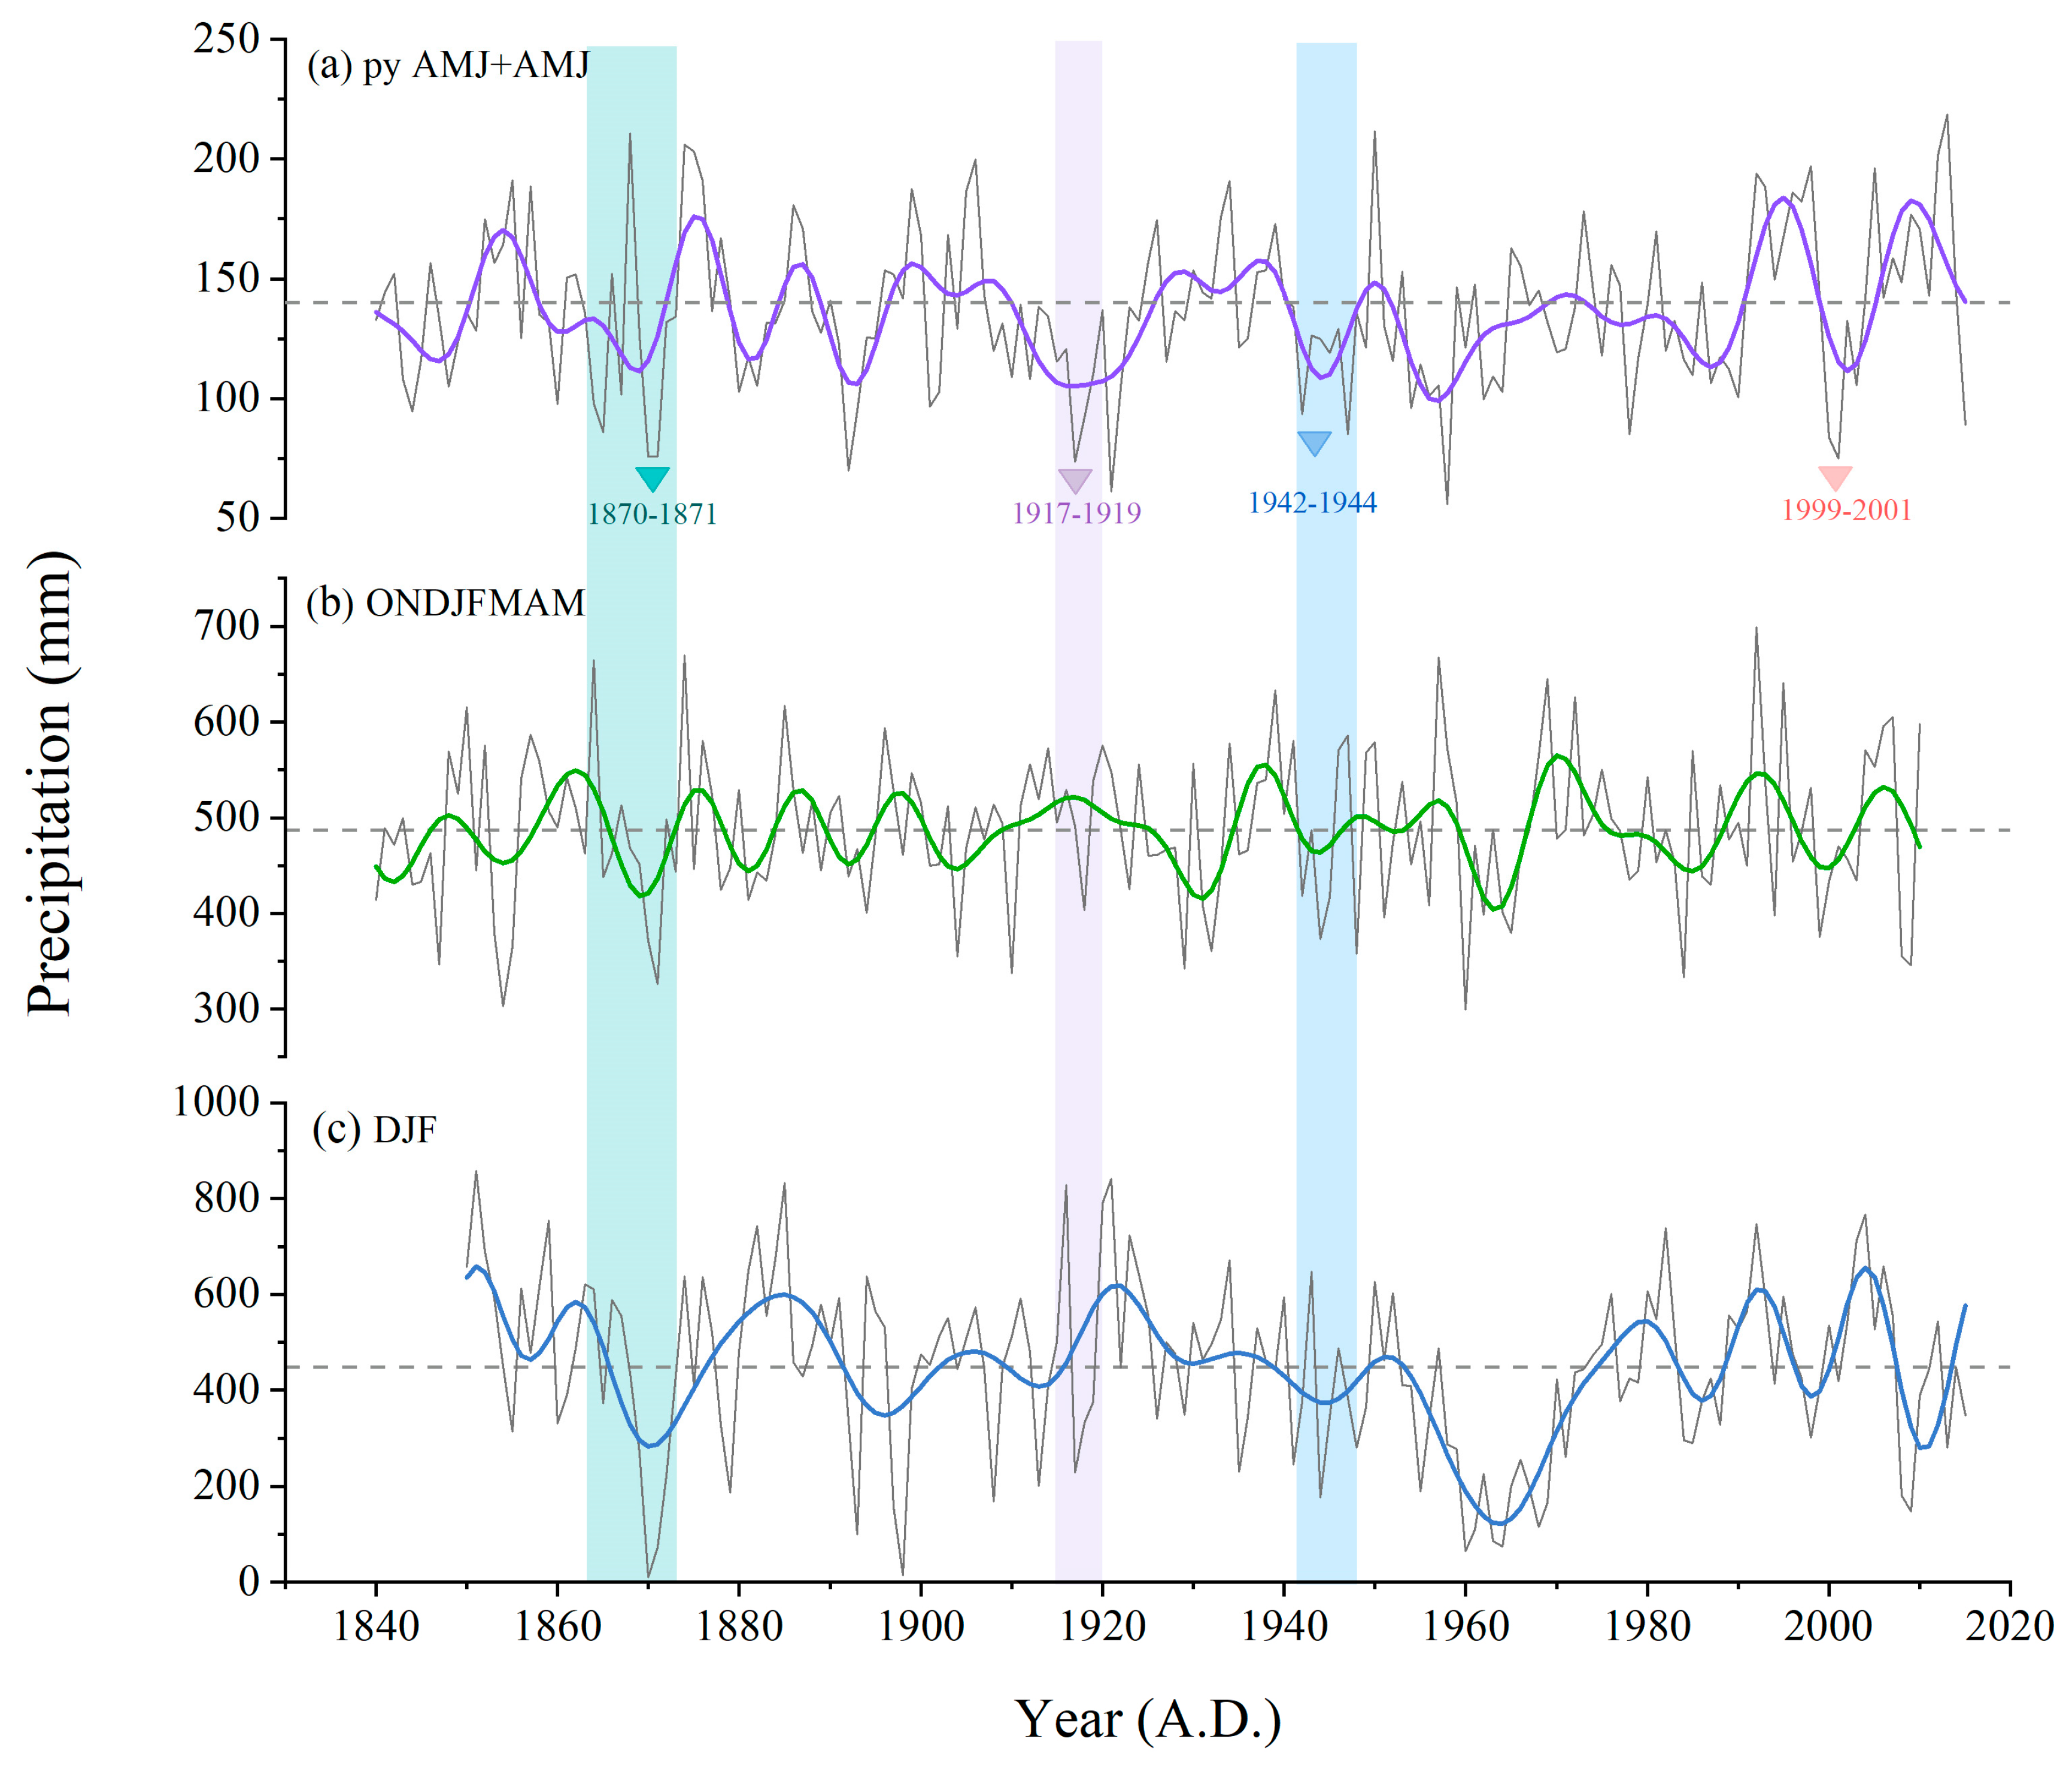
Figure 5 compares the annual and decadal scale fluctuations in the reconstructed total spring precipitation py AMJ + AMJ for the period 1840–2015, for which other precipitation reconstructions from neighboring regions are available. In particular, our reconstructed precipitation py AMJ + AMJ synchronized with reconstructed dry events in 1860–1861 [
105,
106], 1870–1871, 1917–1919, 1942–1945 [
34], and 1958 [
5,
107]. Additionally, dry years in our reconstruction were contemporaneous to negative pointer years in western Asia in 1917 and 1961 [
27]. Hydrological extreme events have been recurring throughout Persian history. Although Iran covers a vast area, several historic meteorological disasters resulting from widespread flood and drought occurred throughout the country. Three catastrophic famines that occurred during 1869–1873, 1917–1919, and 1942–1944 have been reported by historical documents [
68,
69,
70,
71,
72]. In compliance with historical records, the decadal-frequency observations of reconstructed spring precipitation (py AMJ + AMJ) indicate that the decline in precipitation since 1861 lead to the severe drought and famine in 1870–1872 that affected almost the whole country, while eastern and northeastern Iran were affected in 1870–1871 [
69,
70,
72] (
Figure 5a). The great drought disasters of 1917–1919 and 1942–1944 were also observed in our study region [
71,
108] (
Figure 5a).
Likewise, historical documents recorded widespread and serious flooding in 1867, 1885, 1924–1925, the 1930s, and 1948–1949 (1950, northeastern-Mashhad) distinguished by heavy and continuous rainfalls in different months [
68]. Unprecedented, torrential rainfalls have been frequently reported by observations during the 1930s around our study site, for instance in April 1931, May 1933, April 1934 (northeastern, Mashhad), and 1939 (March in Mashhad, whole spring in Birjand). In agreement with historical documents, our reconstruction registered the years 1868, 1886, 1926, 1933–1934, and 1950 as wet years at the southern slopes of the Alborz Mountains. Besides, the decadal mean precipitation stayed above the overall mean during the 1930s.
As recorded by the nearest meteorological stations Shahroud, Semnan, Mashhad, Bojnord and Sabzevar, the region experienced two common noteworthy decadal scale periods of low spring precipitation since 1950. In agreement with the nearby climate stations records, our reconstruction reveals a significant decrease in precipitation in the 1980s [
32]. This reduction is followed by a considerable increase starting in the middle of the 1990s. Afterwards, the famous severe drought during the last years of the 20th century from 1999 to 2001 occurred (
Figure 5a). The severe 1999–2001 drought is one of the largest persistent droughts globally since the 1940s, affecting Central and Southwest Asia, with the most severe impact on Iran, Afghanistan, Tajikistan, Western Pakistan, Uzbekistan, and Turkmenistan [
1,
109]. This drought affected more than 20 provinces of Iran, whereby the area around our study site was among the most affected ones.
We also compared our precipitation reconstruction with two other tree-ring-width based reconstructions of December–February [
5] and October–May precipitation [
34] from the Zagros Mountains in western Iran (
Figure 5). The October–May reconstructed precipitation by Azizi et al. [
34] (
Figure 5b) was significantly (r = 0.20,
p < 0.05) correlated with our spring precipitation reconstruction over the common period of 1840–2010. In addition, a significant correlation between our reconstruction and December–February precipitation for the southern Zagros Mountain by Arsalani et al. [
5] (
Figure 5c) was observed for 1850–2015 (r = 0.16,
p < 0.05). As both reconstructions are located quite far from our study site in northern Iran, the correlation coefficients are expectably low.
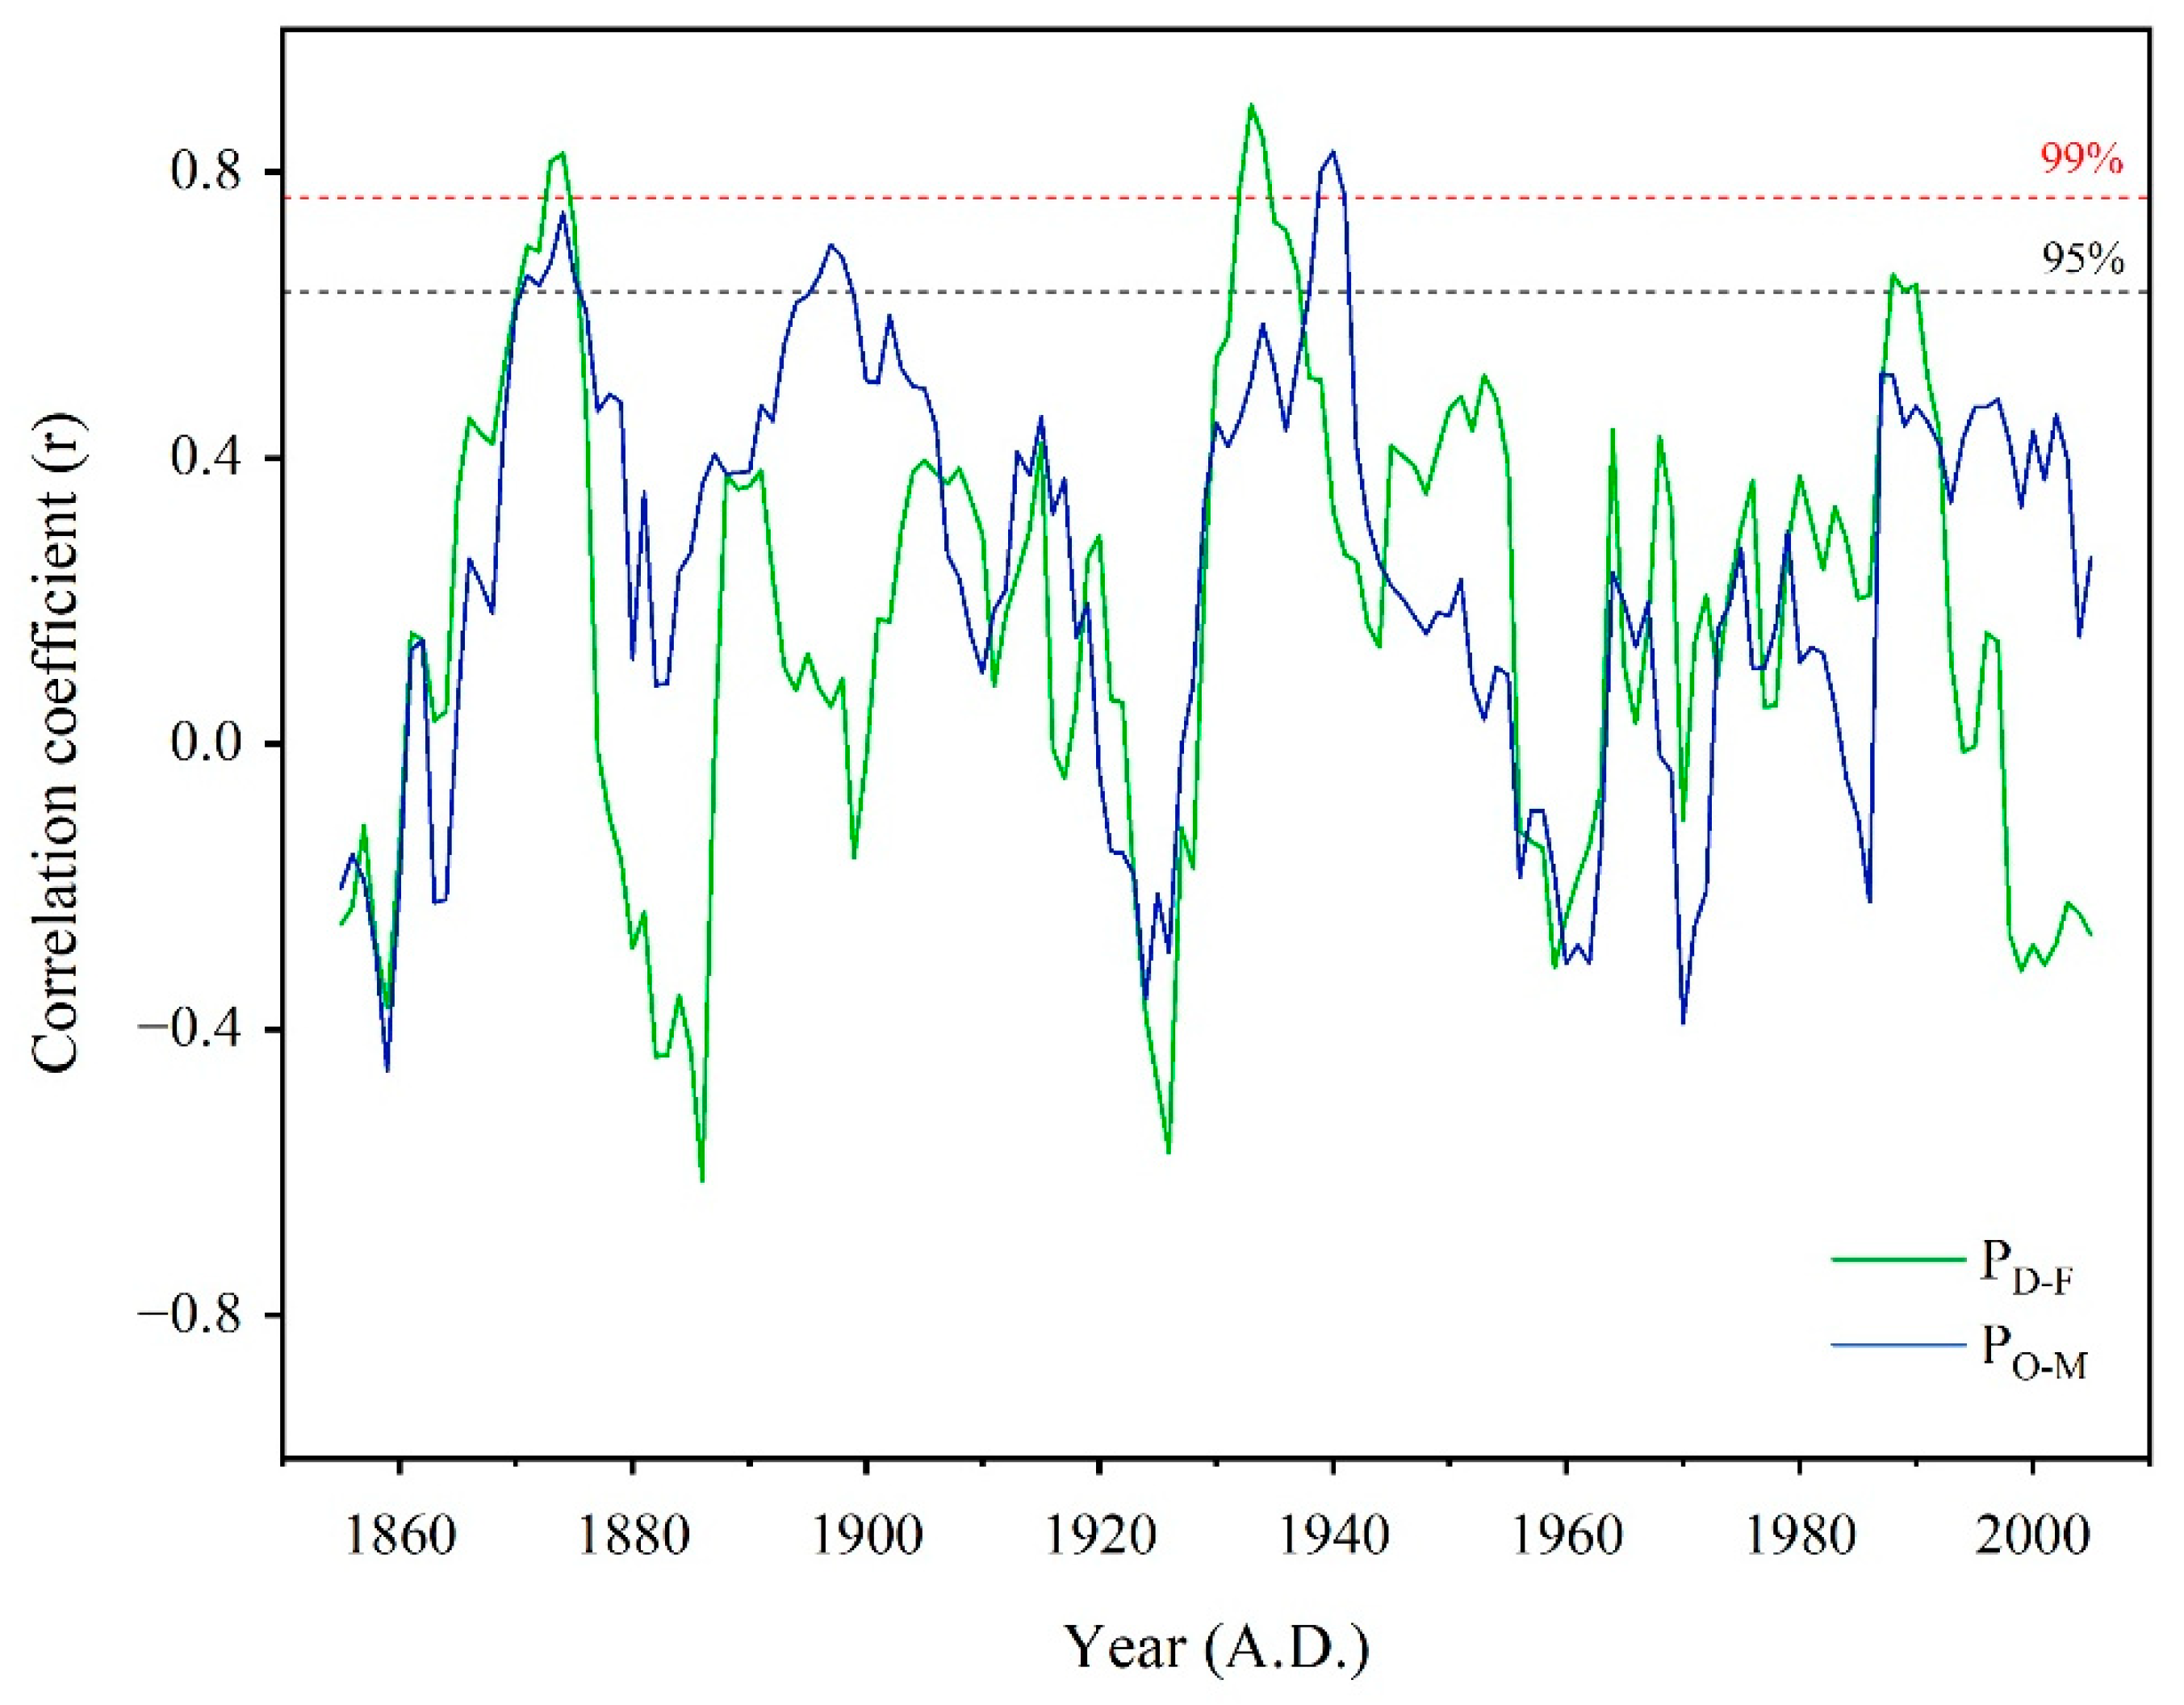
Nonetheless, moving correlations reveal that significant correlations between reconstructed spring precipitation in the Alborz Mountains and precipitation variations in the Zagros Mountains are restricted to the second half of the 19th century (P
O–M = 1855–1918) and the 20th century (P
O–M = 1972–2008 and P
D-F = 1922–1964) (
Figure 6). Since precipitation variations in the Zagros Mountains are mainly controlled by the mid-latitude westerlies, bringing moisture from the North Atlantic Ocean and the Mediterranean Sea, these correlations point to a temporally strong influence of westerly winds on spring precipitation in the eastern Alborz Mountains. However, we found no significant correlation between our reconstruction and large-scale climatic indices representing the westerlies’ influence/strength (NAO, AMO).
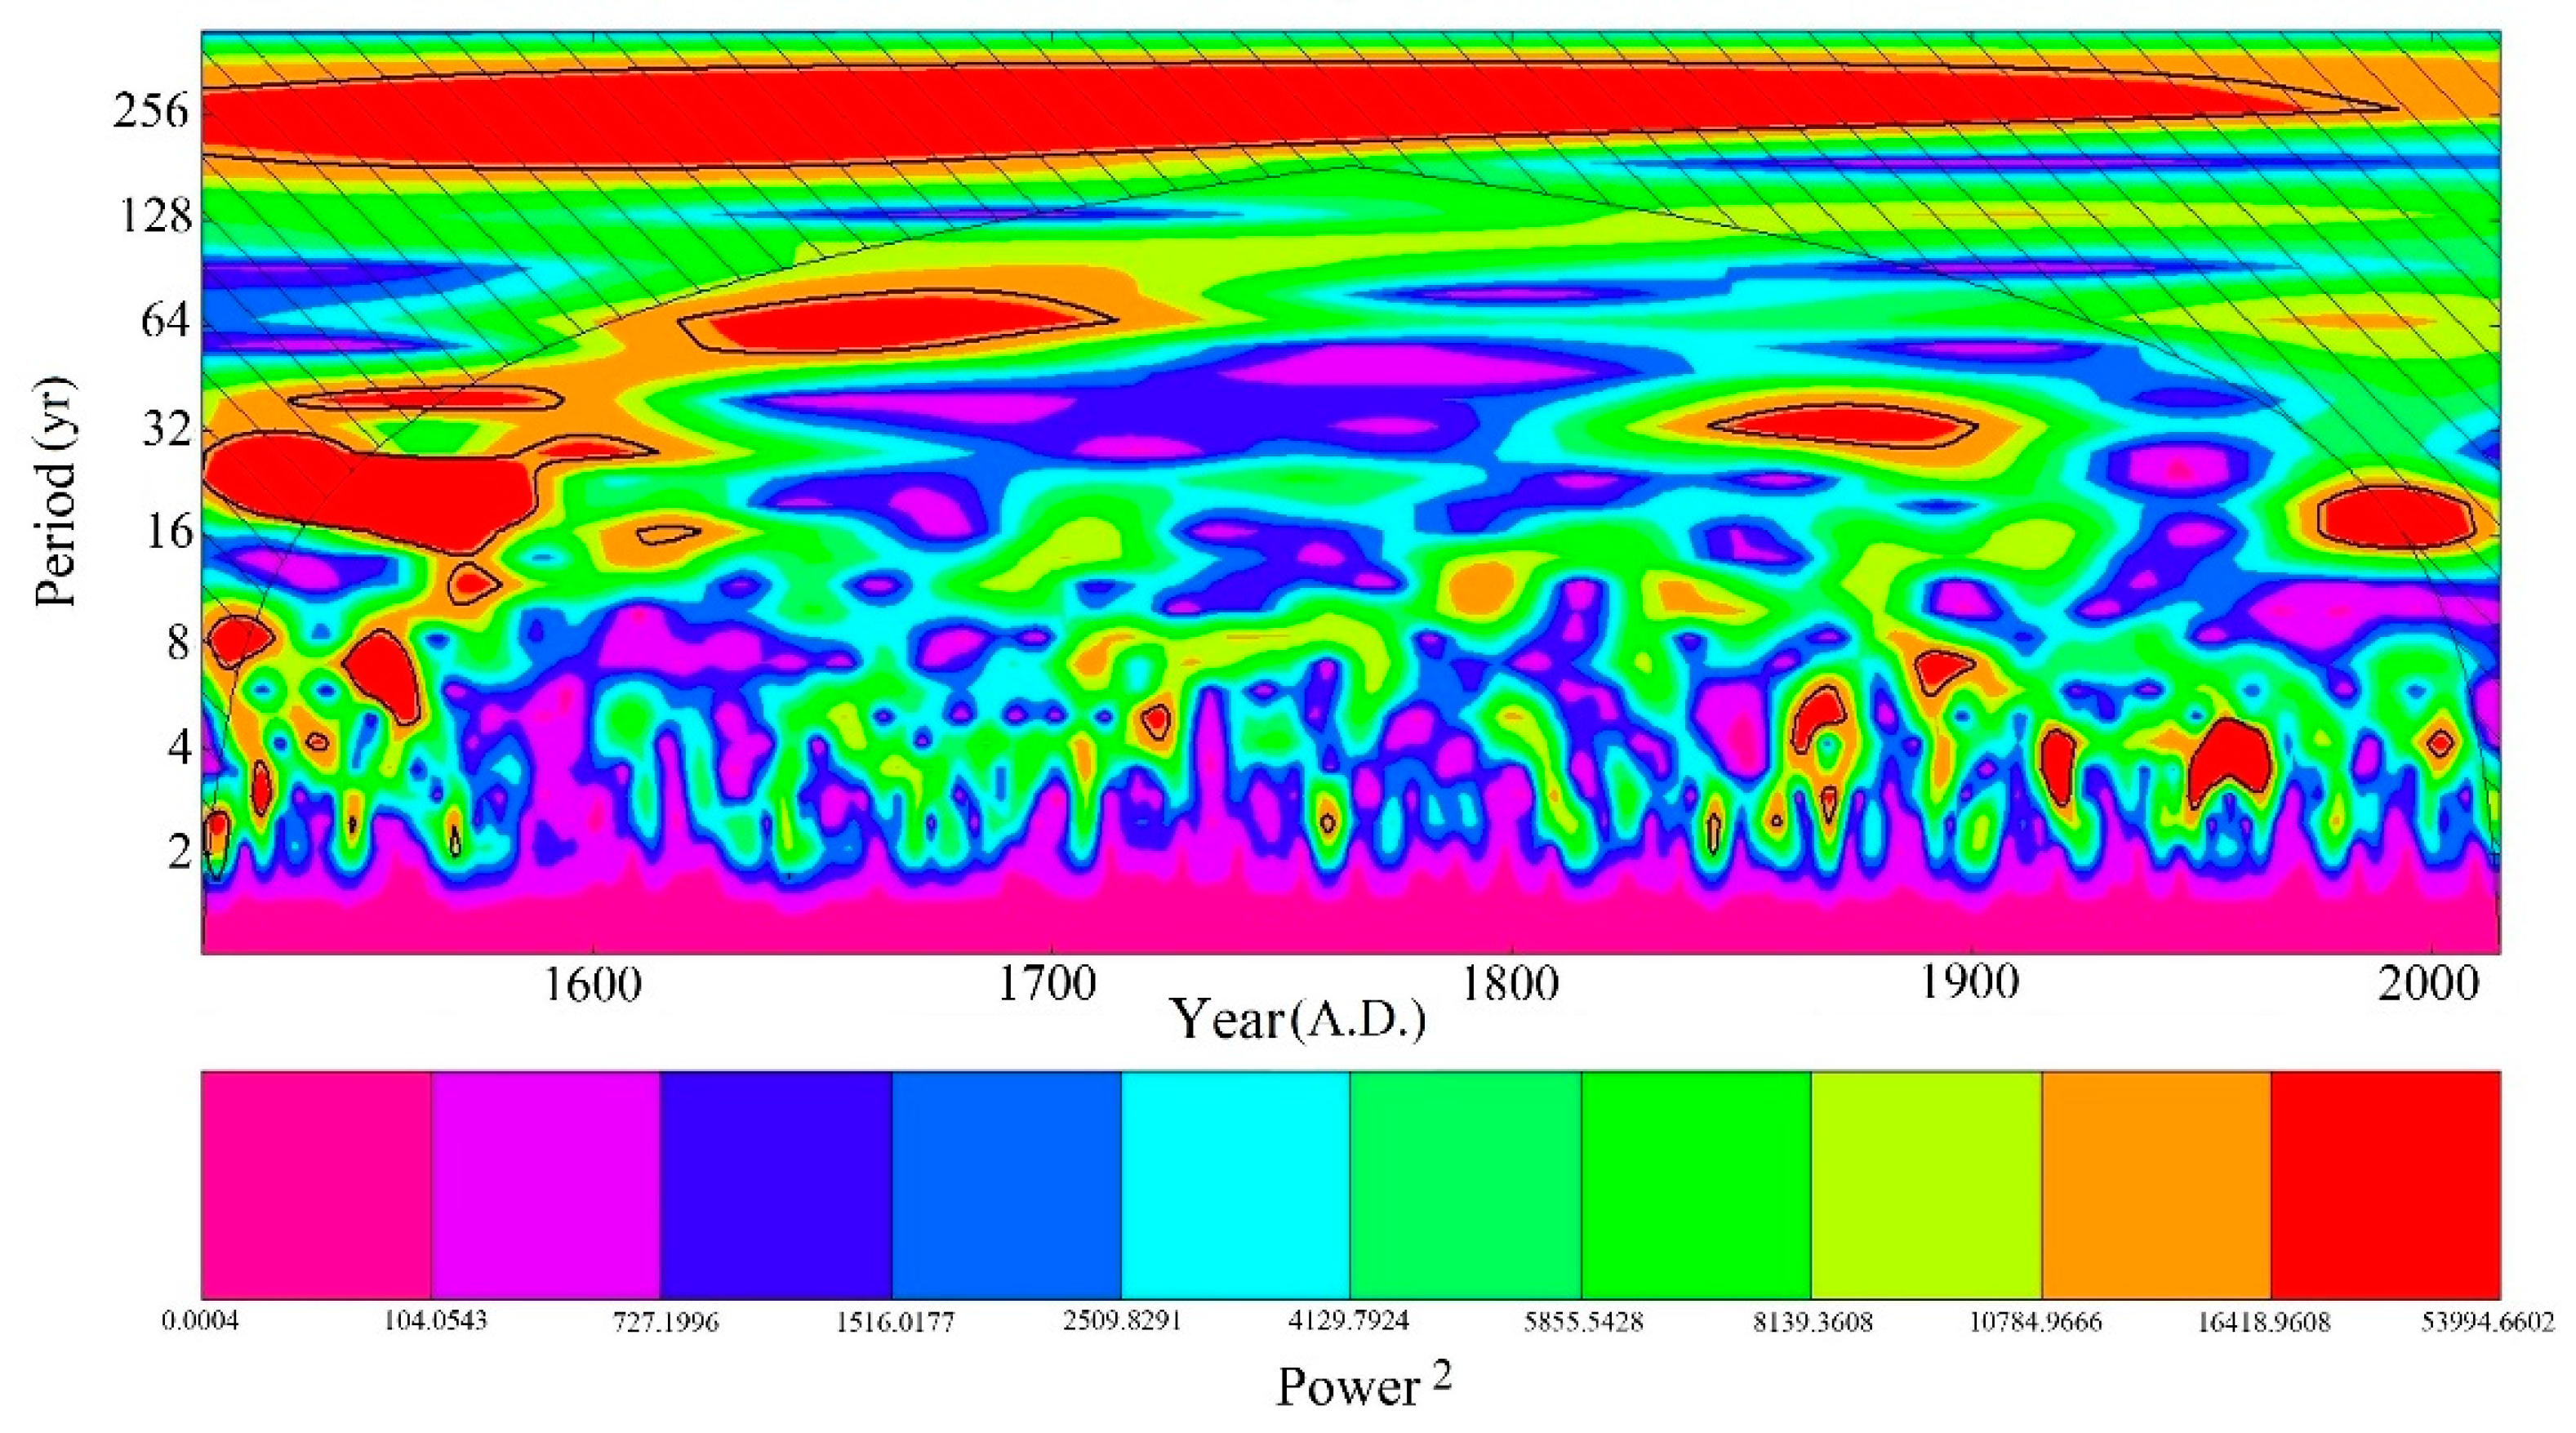
A wavelet analysis revealed that the presence of significant periodicities in our reconstructed precipitation is not persistent over the study period (
Figure 7). Significant cycles of precipitation fluctuations with periodicities lower than ca. 15 years appear during the 16th and at the beginning of 17 centuries, and during the late 19th and 20th centuries. These observations point to a variable strength of the influence of the westerlies on precipitation variations at our study side and a strong influence of regional atmospheric factors. These factors include the influence of local topography, the high elevation of our study site, and the regional climatic effect of the nearby Caspian Sea, for which no long-term data are yet available.


