Abstract
The Positive Matrix Factorization (PMF) receptor model is used for identification of source contributions to PM10 sampled during the period January 2019–January 2020 in Sofia. More than 200 filters were analyzed by X-Ray Fluorescence (XRF), Inductively Coupled Plasma Mass Spectrometry (ICP-MS), and Ion chromatography for chemical elements and soluble ions. Seasonal patterns of PM10 mass and elements’ concentration are observed with minimum in the summer months and maximum in the cold period. The results from source apportionment (SAP) study showed that the resuspension factor is the main contributor to the total PM10 mass (25%), followed by Biomass burning (BB) (23%), Mixed SO42− (19%), Sec (16%), Traffic (TR) (9%), Industry (IND) (4%), Nitrate rich (4%), and Fuel oil burning (FUEL) (0.4%) in Sofia. There are some similarities in relative contribution of the main factors compared to the years 2012–2013. The differences are in identification of the new factor described as mixed sulphate as well as the decrease of the FUEL factor. The results of comparing SAP with EPA PMF 5.0 and chemical transport models (CTM), given by Copernicus Atmosphere Monitoring Service, are presented and discussed for the first time for Bulgaria.
1. Introduction
Urban air pollution is the 10th most important risk factor for human health in the middle and high-developed countries according to the World Health Organization [1]. In a number of European countries, the main problem with air pollution in cities is related to exceedances of limit values for nitrogen oxides and fine particulate matter (PM) [2].
Air particulates are emitted into the atmosphere by a number of anthropogenic sources such as energy, industry, road transport, the burning of various solid and liquid fuels, and waste incineration. Natural sources, such as resuspension and erosion of soils, marine aerosols and volcanic eruptions, and formation of secondary particles by biogenic emissions, can also be significant depending on the region [3]. The harmful effect of air particulate on human health depends mainly on its size (Total Suspended Particulate, PM10, PM2.5, PM1), its concentration, and its chemical composition. Fine PM is easily deposited in the respiratory tract where they cause inflammations and diseases of the respiratory and cardiovascular system [1,4].
Southeast Europe is one of the hot spots on the continent with exceedances of PM10 limit values [2,5,6]. In Bulgaria many towns face problems with high PM10 concentrations, especially during the winter [7,8,9]. It is reported that the highest number of exceedances of daily permitted PM10 concentration (50 µg m−3) for 2017 are registered in Bulgaria: Plovdiv—127, Burgas—116, and Sofia—96 µg m−3.
Sofia is the most densely populated area in the country with a number of different air pollution sources from the industrial, traffic, and domestic sector. The city is located in a semi closed valley because of which unfavorable meteorological conditions contribute to the accumulation of pollutants [10,11,12]. Recent studies on PM elemental composition [13,14,15] indicate a distinguished seasonal pattern in the macro- and microelements concentration with maximums during the cold period of the year. This is due to the temperature inversions and stable stratification in the atmospheric boundary layer that creates conditions for limited dispersion of airborne particulates. The emissions of PM and precursor gases in winter increase because of the domestic heating [11,13,15].
The regulatory air quality monitoring network in Sofia is comprised of five stations in the city and one at a nearby mountain site (about 800 m above the Sofia valley). The data from the regulatory network is not sufficient to understand the distribution of pollutants in the complex environment and the impact of potential sources of emissions. Chemical transport models (CTM) have proven useful to fill in gaps in observations. They are also widely used to forecast pollutant concentrations and to simulate effects of different emission scenarios. The Bulgarian chemical weather forecasting system, running operationally since 2012, provides surface concentrations for the region of Sofia [16] but it underestimates observed PM mass concentrations mainly due to lack of detailed emission inventories on a small and regional scale [17]. Other important factors, like soil and road dust resuspension, are also not treated in the modelling system. For this reason, it was not used for source apportionment studies in Bulgaria. Other methods for apportioning of PM mass concentrations sources are receptor-oriented methods, which are based on observations for the PM chemical composition at a specific site.
Receptor oriented models are applied for many tasks in studying urban air pollution in many countries and regions not only in Europe but in Asia, North Africa, North and South America [18,19,20,21,22,23,24]. One of the most promising approaches is the advanced factor analysis technique (Positive matrix factorization—PMF), developed by Paatero and Tapper [25], further improved with the Multilinear Engine algorithm [26] and the error estimation procedures [27].
The success of applying receptor methods depends on the availability of data for the PM chemical composition and their quality. For Sofia, such data was obtained during the short time experimental campaigns during 2012–2013 [13,15]. Some of this data was used for a source apportionment study for some cities in the Danube region [28], which was first of a kind for Bulgaria.
In this work, we present results from newly obtained data on the chemical composition of PM10 in Sofia, covering one year (January 2019–January 2020). The data was analyzed using the Positive Matrix Factorization model recommended by the US Environmental Protection Agency (EPA PMF 5.0) following the recommendations given in [29,30]. The results are compared to previous analysis for Sofia [28].
2. Materials and Methods
2.1. Sampling Site
Sofia is the capital and the largest city in Bulgaria, located in the western part of the country (Figure 1). According to 2018 data, the city has a population of 1.3 million inhabitants [31]. Sofia is placed in the semi-closed Sofia valley surrounded by many mountains: Vitosha Mountain to the South with highest peak Cherni Vrah of 2290 m; Ljulin to South-West; Balkan and Murgash Mountains (1687 m) to the North and Northeast, and parts of Sredna gora; Lozen Mountain to the South-East (1226 m height), and Vakarel mountains to the East (700–900 m). Sofia valley is 75 km long (in direction NW to SE) and from 5 to 20 km wide. This topography of the city prevents dispersion of the pollutants and results in unfavorable air quality conditions [15]. Sofia has a humid continental climate with an average annual temperature of 10.4 °C. The regime of precipitation has a well-expressed continental character—the quantity of precipitation in the winter is substantially lower than in the summer. The complex relief of the Sofia valley also influences the wind regime. The winds are usually weak with a high number of days with calm conditions (about 40%). The prevailing wind directions are from west (more than 26%) followed from east, south-east, and south-west. The inversions are frequent in more than 50% of days in the year, mainly in the autumn and the winter [10,11].
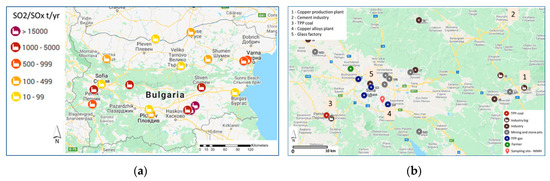
Figure 1.
Maps with main point source of SO2/SOx (a) and PM10 (b).
The main point emission sources of SO2 in the country (from west to east—about 400 km) and PM10 from industrial facilities in Sofia region are shown in Figure 1a,b. The main SO2 sources are coal fired thermal power plants (TPP). The biggest TPP in the Balkan Peninsula is located in south-east Bulgaria. Two other TPPs are located south-ward of Sofia at 30–60 km distance. The biggest industrial plant in the region of Sofia is a copper production plant (60 km to the east of the city) and cement plants (60–70 km to the north, north-east of the city).
PM sampling was carried out at the Central Meteorological Observatory (CMO) in Sofia (42.655 N, 23.384 E, at 586 m a.s.l.) (Figure 2). This is an urban background (UB) site located within the NIMH campus (south-east part of the city) not far away from the main traffic roads—Tsarigradsko shose and Malinov str. Being a populated area, it is also influenced by domestic emissions, including residential wood burning in the suburban and districts in the outskirt of the Vitosha mountain.
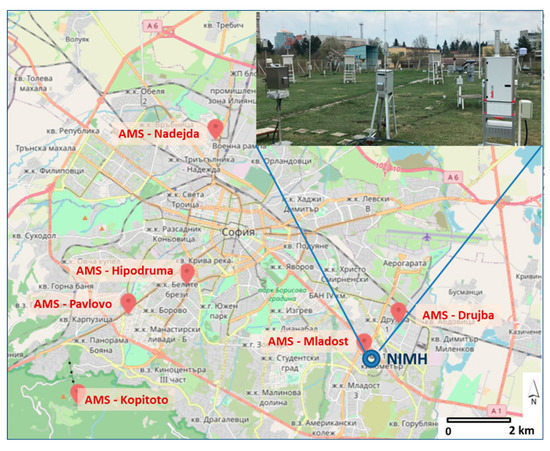
Figure 2.
Map with Automatic monitoring stations (AMS), NIMH site, and sampling instruments.
2.2. PM10 Sampling, Chemical Analysis, and Data Quality Control
PM10 samples were collected on a daily basis (24 h) with 3 different standardized low volume samplers (2.3 m3 h−1), according to EN-12341 standard: Tecora Echo PM Sampler, LVS—Sven Leckel GmbH, and automatic sequential sampler SQ1 (Giano and Gemini—Dado Lab company). All samplers were placed in CMO on a grass filed and the sampling heads were at 2 m. a.g.l (Figure 2). The samples were collected every day at 9:00 LST (local standard time). A total of 289 PM10 samples were collected on a quartz fiber filter (47 mm, Whatman QMA) during the period from 7 January 2019 to 2 February 2020 (67 samples with Tecora, 63 by SVL and 151 by SQ1). The samplers were in operation as follow: the Tecora from 7 January to 22 April 2019, and from 11 December to 15 December 2019; the LVS sampler from 13 February to 25 April 2019, and the SQ1 from 30 March 2019 to 18 April, from 24 June to 31 July 2019, from 11 September 2019 to 2 February 2020. The PM mass concentrations were obtained by gravimetric analysis (EN12341) with analytical balance (Mettler Toledo, MS105DU/M).
To ensure compatible results and as a part of quality control simultaneous, sampling was performed in 42 days with Tecora and SVL. PM10 samples with SQ1 were also simultaneously collected 20 days in April and 3 days in December. The results of PM10 mass concentration in these samples are summarized in Table S1 (in the Supplementary Materials). The difference in the concentration between Tecora and SVL samplers vary from 0% up to 15% in fewer than 41 days. The regression can be written as PM10 (Tecora) = 1.046 × PM10 (SVL)—0.0574 with R2 = 0.985. The mass concentrations obtained with SQ1 are slightly higher. It was decided to make no corrections in the derived PM10 mass concentrations but to increase the uncertainty when PM10 mass is analyzed with the EPA PMF 5.0 software.
The analyses for PM10 elemental composition were performed in the Institute for Medical Research and Occupational Health, Zagreb by Energy Dispersive X-Ray Fluorescence (ED XRF) technique (PANalytical Epsilon 5 Instrument). This technique was successfully tested and applied in previous studies [28,32,33].
Soluble ions from the punch of ¼ of the PM10 filters were analyzed in the certified laboratory “Aquateratest” Sofia by the Ion Chromatograph (ICS 1100, DIONEX), ICP OES (Vista MPX CCD Simultaneous, Varian) and the Spectrophotometer S-20, following standards: EN ISO 10304-1:2009, EN ISO11885:2009, and ISO 7150-1:2002. The elements and the number of samples above the Detection Limit (DL) are given in Section 3.1. The results for elemental concentration were compared to the measured ion concentration and high correlation was observed for Ca/Ca2+ Cl/Cl−, K/K+ (with few outliers). In case of Sulfur and SO42− time series, the agreement between measured concentrations is acceptable (Figure S1 in the Supplementary Materials).
The concentrations of the analyzed elements and ions were measured in some simultaneously collected samples. The comparison of some elements in the filters collected with different samplers is presented in Figure S2 (in the Supplementary Materials). The concentrations of macro-elements like S, Cl, K, Ca, Fe are very close in both PM10 samples with R2 about 0.90. Some of the microelements with concentration close to the DL show higher variability. The Scandium, detected mainly in Tecora PM10 samples, was not taken into account in further analyses.
2.3. Source Apportionment by PMF
The analysis was performed on 231 samples using the free software EPA PMF 5.0, implementing the ME-2 algorithm developed by Paaero et al., 2014 [27]. PMF is an advanced factor analysis technique that uses measured concentrations and their uncertainties to solve the mass balance equation X = G × F + E, where: X is the chemical composition matrix; G is the source contributions; F the factor profiles; and E the residual.
Strong, weak, and bad variables were selected according to their S/N (signal to noise ratio), as defined by Paatero and Taaper, 1994 [25]. Error estimation (EE), Bootstrap (BS), and Displacement (DISP) methods were used for analyzing factor analytical solutions. The uncertainty of elements is based on an estimate of the uncertainty for each species in a sample. The values below the detection limit were substituted with 1⁄2 of the DL and the corresponding uncertainty with 5⁄6 of the DL [34]. The analytical uncertainty for all soluble ions was set to 10%. Extra modeling uncertainty of 10% was used. One sample (25 April 2019) was excluded from the PMF analysis because of the presence of many outliers, most of which were crustal elements.
The solutions with different number of factors (from 4 up to 9) were tested. As it is recommended, one hundred simulations were performed and the differences in scaled residuals between the different simulations were very low. The summary of input data, EPA PMF settings, output data, and error estimation (EE) are presented in Section 3.2.
2.4. Source Apportionment by Copernicus Atmosphere Monitoring Service (CAMS) CTM
The source receptor (SR) analysis for Sofia, available from the Copernicus Atmosphere Monitoring Service (CAMS) on Policy Support [35], gives insight to the origin of PM10—the contribution by local/non-local and natural sources, the geographical origin, and the speciation. The SR analysis for 2019 and the four seasons, provided by CAMS, is based on two state-of-the-art chemical transport modelling systems. It is running operationally to forecast daily speciation for major EU cities—EMEP/MSC-W rv4.15, further on EMEP [36], and LOTOS-EUROSv2.0 [37]. Both models are run by one meteorological driver (ECMWF-IFS) and emissions input (TNO-MACC-III for 2011), but have different approach in the additional simulations for SR analysis—perturbation of emissions (EMEP) and labeling approach (LOTOS-EUROS). Further details on the models set up for SR analysis is given by [38,39]. The comparison of these two modelling systems for Sofia is useful to understand model uncertainty and to identify long-range transport effects on the chemical composition of PM10.
The results for Sofia refer to an area of 60 × 60 km (interpreted as “local”) and, considering the characteristics of the region, it is rather coarse and inhomogeneous, including the city, a part of Vitosha Mountain, and another town (Pernik) in southward direction. Thus, the SR analysis from the two modelling systems is used here to highlight the chemical composition of background PM in the region of Sofia.
3. Results and Discussion
3.1. PM10 Mass Concentrations
The mean annual PM10 concentrations and the number of exceedances measured by Automatic Monitoring Stations (AMS) of the national Executive Environmental Agency, Ministry of Environment and Waters presents a clear tendency of decrease in Sofia municipality since 2011 (Figure 3a). The number of days with mean daily concentration above 50 µg m−3 (EU daily limit value) exceeds 35 at 4 of 5 urban background AMS in 2019. There are 65 days with exceedance in AMS Nadejda (NW part of the city) [8]. The mean PM10 quarterly concentrations (I, II, III, and IV quarter) for air quality monitoring stations in Sofia are presented in Figure 3b. Clear seasonal pattern of PM10 concentration with maximum in the cold period of the year (from October until March) is due to variations in meteorological conditions and an increase in the number and strength of the sources. Time variation of PM10 data in this experimental study presented on Figure 4 is similar to that described for previous years based on mean quarterly concentrations with maximums in the January, February, November, December 2019, and January 2020. Minimums are observed in summer months when intensive turbulent mixing and a high atmospheric boundary layer (ABL) are present, resulting in lower measured concentrations. It is important to note that on a daily scale the pollutants and PM10 in particular are well mixed in the urban boundary layer. This is proved with high correlation of PM10 values between the 5 AMS stations. During 2019, the coefficient of determination R2 varies from the lowest 0.79 (Pavlovo-Drujba) to R2 = 0.91 between the AMS Hipodruma, the most eastern AMS Mladost, and the west-northern AMS Hadejda stations.
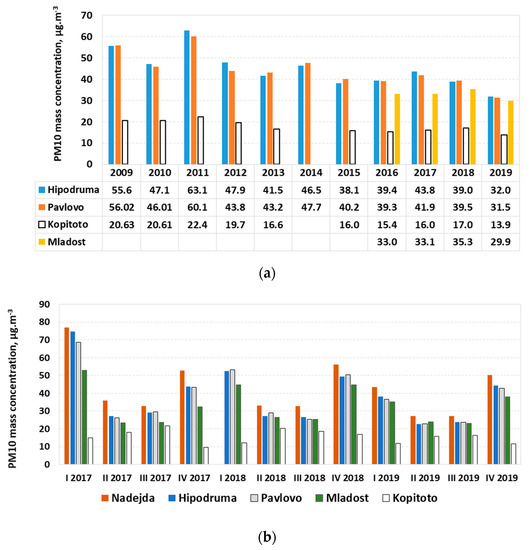
Figure 3.
Mean annual (a) and mean quarterly (b) PM10 concentrations in AMS.
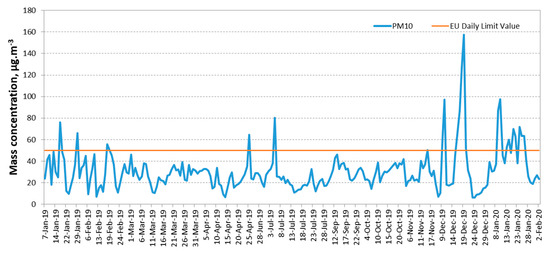
Figure 4.
Mass PM10 concentration and daily limit value.
The average PM10 concentration in this study (30.9 μg m−3) is close to the reported mean value (29.9 μg m−3) in the AMS Mladost, placed in the NIMH yard at a distance of 150 m from sampling site.
The percentage of the highest daily concentrations (>50 μg m−3) is 10%. In the neighboring station, the days with exceedance were 30. The summarized results of chemical composition in PM10 samples are given in Table 1.

Table 1.
Statistical results for the measured PM10 and element concentrations in ng m−3.
The data for Sodium (Na), measured by ED XRF, is not included in Table 2 because of its high concentration in the second batch of the blank filters. Some elements were above DL in only 2 or 4 days (Ag of about 5 ng.m−3 Rb of 2.6 ng.m−3 and Y of 0.002 ng.m−3).
Table 2.
Summary of the Positive Matrix Factorization (PMF) input and output data.
The concentration of sulfate ions (SO42−) is the highest one, with a mean value of 3.03 μg m−3, followed by nitrate (NO3−) of 1.87 μg m−3, and then in decreasing order by Ca2+, Na+, K+, Cl−, and Mg2+. The mean SO42−concentration is comparable with the measured in eastern, sought eastern, and part of central sites of EMEP network in Europe [40]. It is lower than reported for the years 2012–2013 [28] as it can be expected from a decrease of SO2 emissions on the continent [2]. The concentration of NO3− and other ions are comparable to those for some European countries [25,41] and lower than reported for sites in Asia [42,43]. PM10 in Sofia is enriched with Fe, Cu, Mn, and Zn in comparison to other European sites [44,45,46], which is a distinguished signal of industrial activities. Their concentrations are near to those observed in Barcelona, Porto, Milano, Firenze, and Athens [24] and lower in comparison with denser and more industrialized as Turkey [46] and Asian regions [47].
3.2. Source Apportionment Results
Several factors were tested (4–9) in order to obtain the optimum PMF solution. The solution with eight factors was chosen with regard to the highest number factors with physical meaning. The important summary of input and output data are summarized in Table 2. The identification of the factors is based on the key elements in the source fingerprint and the correlations between them. The diagnostic tests indicated acceptable Q/Qexp values (<2) for the majority of the elements, with the exception of Pb. The obtained ratio between the Qtrue and Qrobust values is lower than the value of 1.5 [48]. The PM mass reconstruction was satisfactory with R2 between modeled and real PM mass higher than 0.89 (Figure S3). The unaccounted PM10 mass is 3%. In the BS test, the obtained factors were mapped in >99%, with the exception of Traffic and Mixed SO42− (that were mapped 86% of the time) (Table 2).
Sources of ambient PM10 have been grouped into 8 categories: Resuspension (RES), Secondary (SEC), Biomass burning (BB), Traffic (TR), Industry (IND), Nitrate rich, Fuel oil burning (FUEL), and Mixed SO42−. In order to be sure in factors/source definition, they were compared with chemical profiles from the European database SPECIEUROPE [49]. The chemical factor profiles (the relative mass contribution of each chemical species to PM mass, μgμg−1) and factor contribution (% of each species apportioned to the factors) are presented in Figure 5. The temporal variations of all factors/sources identified by PMF for Sofia are presented in Figure S4 in the Supplementary Materials. The obtained source contribution to the PM10 mass concentration on annual and seasonal bases as pie chart and daily source contributions (μg m−3) are presented in Figure 6.
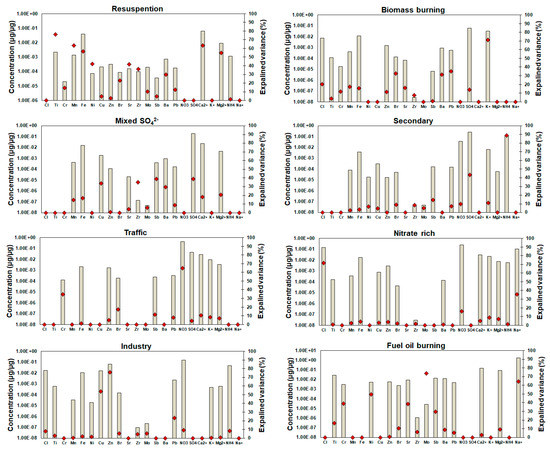
Figure 5.
Factor contribution and source chemical profiles.
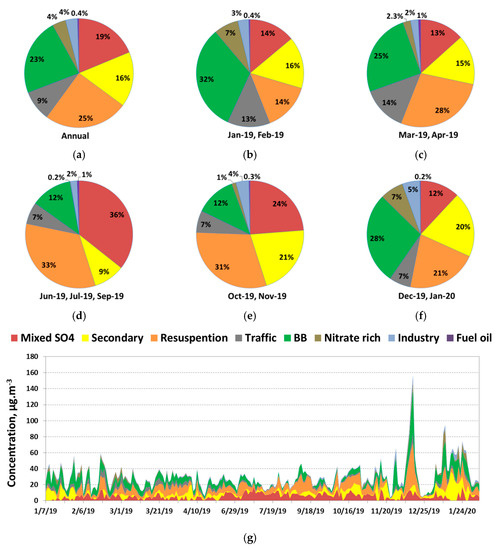
Figure 6.
Source profiles (%) on annual (a) and seasonal bases (b) Jan and Feb 2019; (c) Mar and Apr 2019; (d) Jun, Jul and Sep 2019; (e) Oct and Nov 2019; (f) Dec 2019 and Jan 2020), and daily source contributions to PM10 (g).
The Resuspension (RES) factor is dominated by crustal elements such as Mg, Ca, Ti, Sr, Mn, and Fe [25,28]. The name ‘’resuspension” includes contribution from soil and road dust resuspended into the surface air layer from wind blow and mechanically induced resuspension of air particulate from the vehicles. The presence of Zn, Cu, Ni, Sb, and Mo in this factor also suggested a slightly mixed with non-exhaust traffic source [24]. The minimum contribution is observed in the beginning of 2019 (January–February) and the maximum in the middle of December 2019, when stagnant weather conditions with prolonged inversion and presence of fog led to high PM10 concentrations (Figure S4 in the Supplementary Materials). The relatively high impact of RES (33%) is connected to the dryer periods (Figure 6d). In 2019, significantly lower monthly precipitation amounts were measured. After June and in December 2019 and January 2020, the monthly sum of precipitation was below 60% of the climatic norm. The RES source on annual base is the main contributor to the total PM10 mass in Sofia (25%) and is close to the one obtained on a smaller number of samples at the same site in 2012–2013 [28].
The biomass burning (BB) factor contains high concentration of the main tracer K+. Other chemical species, such as Cl−, SO42−, Zn, Pb, and Br, were also associated with this source [21,24,41,50]. The BB presents a typical seasonal trend with higher contributions in winter that gradually decrease to minimum levels in the summer (Figure S4 in the Supplementary Materials). This factor has a small contribution in the summer, probably due to forest fires [51]. The contribution of BB source to PM10 mass on an annual base is 24% (Figure 6a). As expected, the maximum is observed in the cold period with 32% (January and February 2019) (Figure 6b) and 29% (December 2019, January 2020) (Figure 6f).
The chemical profile of “Mixed SO42−” suggested a complex origin characterized by high concentrations of SO42−, Fe, Ca, Mg, Cu, and Pb. The concentration of this factor was rather stable during the study period with a maximum in the summer. The presence of elements such as Ca, Fe, Zr, and Mo suggested a combination of coal and waste combustion in power plants or cement factories [29,52,53]. Recently, in Bulgaria, cement plants use coal, tiers, and RDF as alternative fuel (Bulgarian National Emission Register, annual reports for 2018/2019) [53,54]. The back-trajectory analysis for some days with high contribution of this factor showed prevailing directions from N and S-SW (Figure S5 in the Supplementary Materials). In both directions there are industrial plants with official permission for RDF burning (Bulgarian National Emission Register), confirming regional influence.
Secondary aerosol (SEC) was dominated by inorganic ions (ammonium sulphate and ammonium nitrate). Secondary inorganic aerosols may be associated with “long range transport”. The residence time of sulphates and nitrates in the atmosphere is between 3 and 9 days [3] and is frequently associated with “aged air masses” due to the slow oxidation of SO2 to SO42− [55]. The presence of anthropogenic elements (e.g., Br, Pb) indicated aged primary emissions mixed with secondary sulphate. A contribution of this source was 16% of the total mass and expressed a seasonal trend [28]. The maximum contribution of SEC factor was observed in January 2020 (35 µg m−3), when the height of ABL was low and fog occurred. (Figure S4 in the Supplementary Materials).
The traffic (TR) factor is primarily composed by NO3− and elements as Ca, Zn, Sb, Cr, Mg, Fe, and K+ (markers for non-exhaust traffic emissions). NO3− is deriving from the ageing of exhaust gases [56,57]. Several studies have shown emissions of Zn, Sb, and Cr, which are associated with brake wear, tires, and lubricants [58,59,60,61]. According to Diapouli et. al, 2017 [62], the concentration of Zn is approximately 15 times higher in tires compared to brakes, while concentrations of other heavy metals such as Fe, Sb, Cu, and Ba were higher for brake materials. The elements Ca, Fe, K, and Mg are mostly attributed to road dust [24,28,63]. The lack of information about BC or EC/OC concentration in this analysis probably leads to some mixing of this source with others, like biomass burning. The TR accounts for 9% of the measured PM10. The TR source has a slightly seasonal pattern with maximums in the cold periods in Sofia (13 µg m−3).
The Industry (IND) factor is characterized by high levels of Cu, Zn, and Pb, markers of industrial emissions [24,41]. This factor is associated with local copper alloys and glass production (the Glass factory Drujba is located in the city at about 15 km and the Copper alloy factory is at about 4 km distance from the sampling site) (Bulgarian National Emission Register). The IND source is permanent during the year with some maximums during the cold period when the prolonged inversions occurred (Figure S4 in the Supplementary Materials). The IND factor contributes with 4% to the total PM10 mass.
The Nitrates rich factor is composed mainly by NO3−, Cl, and Na and a mixture of Ca, K+, and Fe. According to Kocak et al., 2011 and Eleftheriadis et al., 2014, [42,63], the presence of Na+ indicates the production of NaNO3 due to the interaction of sea salt aerosol with anthropogenic gaseous precursors (NOx). Nitrate is more often related to local rather than regional sources. The mixture of pollutants emitted from both anthropogenic and natural sources, and their interaction and transportation to the receptor site is reflected by the presence of mixed source profiles [64]. The contribution of this factor to the PM10 mass is 4% on annual bases. The Nitrates rich source has seasonality in its contribution to PM10 mass, with a maximum in the cold periods (7%) and a minimum in the summer (1%). The Nitrates rich factor is also related to oxidized local gaseous NOx emissions from thermal power plants (TPP) working on natural gas, which supply thermal energy in more than 60% of households in Sofia. This source can be called Secondary nitrate following [24] or Nitrates/Aged Sea Salt [42,62,63]. They explain “as oxidation product of NOx emissions (road traffic and industrial plants)” in the five AIRUSE cities Barcelona, Florence, Athens, Porto, and Milan.
The Fuel oil burning (FUEL) factor is characterized by high concentration of Ni, key tracers for oil fuel, and Na, Ti, Sb, Cr, Ba, and Mo [42]. This factor represented 0.4% of the total PM10 (Figure 6a) mass (0.14 µg m−3) which is lower than observed for other sampling sites in Europe (0.8-1.0 µg m−3) [24]. One of the known minor sources is fuel oil burn up, when the gas boilers of TPPs begin to operate. The higher contributions observed in the spring (0.24 µg m−3) might be due to some regional transport when there is more intensive atmospheric air circulation, which favors their movement and distribution. The contribution of FUEL source is less in comparison to a previous study for Sofia (6%) [28]. It is much lower, reflecting the change from fuel oil to gas in small installations for local districts heating.
3.3. Contribution of Outside Sources and Chemical Composition of Background PM Concentrations
The CTM model results for Sofia in 2019 available at CAMS [51] give insight to the contributions from different geographical areas and chemical species to the PM10 background concentrations in the region of Sofia (Figure 7a). The contributions from Bulgarian sources (“domestic”) are estimated as 51.4% (EMEP) and 36.8% (LOTOS-EUROS). For the natural contribution, mainly from Saharan dust, there are significant differences—10.8% (EMEP) and 29.4% (LOTOS-EUROS). The rather high share for “others” (representing non-EU countries and model boundary conditions) are comparable for both systems (26.4% and 21.7%). This is due to the position of Sofia in the western part of the country and the prevailing synoptic flow (from west and north-west), suggesting contributions from emission sources in the Western Balkans.
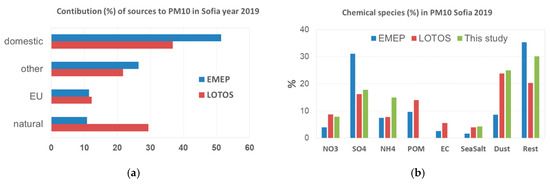
Figure 7.
Contribution (a) and chemical species (b) in PM10 for Sofia, 2019.
Figure 7b shows the chemical composition from the two model systems along with the results from this study on yearly basis. The comparison is not straightforward as the model results refer to background concentrations for a large area around Sofia, while our results are based on measurements at a fixed point in a residential area. The models use emission inventory for 2011 but emissions certainly have changed from 2011 to 2019, especially reduction in SO2 emissions and increase of NO2 emissions in the Balkan region [2]. Nevertheless, there are some common findings using the two CTM SR analysis and the results from the PMF in this study. The contribution of SO42− is significant—the models’ average is 23%, whereas this study indicates 18%. This is related to processes of secondary aerosol formation and regional contribution from SO2 emissions in the country and SE Europe [28]. To note the high contribution of the group “rest” that includes secondary organic aerosols, particle-bound water, and unaccounted primary aerosols: models indicate 25% on average, this study—30%. Further studies, including considerations of detailed emissions on local and regional levels, are needed to understand these results. The dust contribution to PM10 concentrations in Sofia seems to be important for the year 2019—with a share varying from 16% on average by the models to about 25% in this study. This suggests that the impact of natural factors on the PM10 concentrations should be further studied.
4. Conclusions
This study has focused on the PM levels, chemical composition, and sources apportionment for a one-year period in the capital of Bulgaria, Sofia. Seasonal patterns of PM10 mass concentration with a minimum in the summer months and a maximum in the cold period is accompanied by the similar time variation of the prevailing macroelements (Ca, Fe), some of the microelements (Pb, Zn, Cu, Mn, Cr, Br, Sr), and ions (SO42−, NO3−, Cl−, K+, NH4+, Na+). This is due to the different meteorological conditions and in some extent to the contribution of additional sources of primary and secondary PM10.
The application of the positive matrix factorization method with EPA PMF 5.0 software led to the identification of eight factors, six of which are with the most significant contribution to the PM10 mass concentration in Sofia (RES, SEC, Mixed SO42−, BB, TR, and IND). In comparison with a previous study (2012–2013), a new source appeared (Mixed SO42−) with a relatively high contribution during the summer. The RES source is the main contributor to the total PM10 mass in Sofia (25%) and is close to the one obtained in 2012–2013. Second is the BB followed by Mixed SO42−, Sec, TR, IND, Nitrate rich, and FUEL.
For the first time the obtained results for contribution of sulphates, nitrates, ammonium ions, and dust (RES) are compared with modeled ones, derived by CAMS models. The variation in SO42− and NO3− contribution in PM10 mass obtained by two CTM models is seen. The relative contribution to the PM10 in this study is closer to the derived by LOTOS model.
The results from source apportionment (SAP) are of high importance to the development of action plans for improving the air quality based on PM characterization and source apportionment. The authorities can focus on measures to reduce emissions of the sources which they can control. This study provides important information for policy design with specific measures to improve urban air quality in Sofia. Future work on more in-depth analysis for long range transport and Probability Source Contribution Function is planned.
Supplementary Materials
The following are available online at https://www.mdpi.com/2073-4433/11/9/890/s1, Table S1: Comparison of PM10 concentration obtained by tree different samplers; Figure S1: Comparison of obtained results with different analytical techniques; Figure S2: Comparison of results obtained with different samplers; Figure S3: Correlation between experimental PM10 and modeled PM10; Figure S4: Daily source contributions to PM10 levels for the study period in Sofia; Figure S:. HYSPLIT [65] back trajectories for two selected days with high contribution of “Mixed SO42−“ factor.
Author Contributions
Conceptualization, E.H. and B.V.; Methodology, B.V. and E.H.; Formal Analysis, E.H., B.V., E.G. and H.B.; Writing—Original Draft Preparation, E.H., B.V. and E.G.; Visualization, E.H.; Funding Acquisition, H.B. All authors have read and agreed to the published version of the manuscript.
Funding
This research received no external funding.
Acknowledgments
The authors acknowledge the International Atomic Energy Agency for technical support through project TN-RER7011-1804467 and to the Institute for Medical Research and Occupational Health, Zagreb for the elemental analysis.
Conflicts of Interest
The authors declare no conflict of interest.
References
- World Health Organization. Available online: https://www.who.int/en/news-room/fact-sheets/detail/ambient-(outdoor)-air-quality-and-health (accessed on 20 June 2020).
- European Environment Agency. Air Quality in Europe—2019 Report; Publications Office of the European Union: Luxembourg, 2019; ISBN 978-92-9480-088-6. [Google Scholar] [CrossRef]
- Seinfeld, J.H.; Pandis, N.S. Atmospheric Chemistry and Physics. From Air Pollution to Climate Change, 2nd ed.; John Wiley & Sons: Hoboken, NJ, USA, 2006; p. 1225. [Google Scholar]
- Lim, S.S.; Vos, T.; Flaxman, A.D.; Danaei, G.; Shibuya, K.; Adair-Rohani, H.; AlMazroa, M.A.; Amann, M.; Anderson, H.R.; Andrews, K.G.; et al. A comparative risk assessment of burden of disease and injury attributable to 67 risk factor clusters in 21 regions, 1990–2010: A systematic analysis for the Global Burden of Disease Study 2010. Lancet 2012, 380, 2224–2260. [Google Scholar] [CrossRef]
- CAMS71_2016SC2. Annual Air Quality Assessment Report for 2015. Available online: https://policy.atmosphere.copernicus.eu/reports/CAMS-71_SC22016_D71.1.3_201801_V2.pdf (accessed on 27 June 2020).
- Putaud, J.-P.; van Dingenen, R.; Alastuey, A.; Bauer, H.; Birmili, W.; Cyrys, J.; Flentje, H.; Fuzzi, S.; Gehrig, R.; Hansson, H.C.; et al. A European aerosol phenomenology 3: Physical and chemical characteristics of particulate matter from 60 rural, urban, and kerbside sites across Europe. Atmos. Environ. 2010, 44, 1308–1320. [Google Scholar] [CrossRef]
- MOEW Rep. National Report on the State and Protection of the Environment in the Republic of Bulgaria in 2017. Issued 2019 from Ministry of Environment and Waters (MEW). Available online: http://eea.government.bg/bg/soer/2017 (accessed on 16 June 2020).
- MOEW. Regional Situation Report of the Environment in 2019; Regional Inspectorate of Environment and Water: Sofia, Bulgaria, 2020. [Google Scholar]
- MOEW. National Report on the State and Protection of The Environment, MoEW, Sofia. Available online: http://eea.government.bg/bg/soer/2014 (accessed on 12 June 2020).
- Andreev, V.; Branzov, C.; Koleva, E.; Tzenkova, A.; Ivancheva, J.; Videnov, P. Climate and Human Comfort of Sofia. Ecology of the City of Sofia, Species and Communities in an Urban Environment; Pensoft Publishers: Sofia, Bulgaria, 2004; pp. 25–54. [Google Scholar]
- Batchvarova, E.; Syrakov, D.; Tzenkova, A. Air Pollution Characteristics of a Region of Sofia and Data from Field Experiments (1992–1993). In Urban Air Pollution; Allegrini, I., De Santis, F., Eds.; Springer: Berlin, Germany, 1996; Volume 8, pp. 235–242. [Google Scholar]
- Naydenova, I.; Petrova, T.; Velichkova, R.; Simova, I. PM10 exceedance in Bulgaria. In Proceedings of the CBU International Conference on Innovations in Science and Education, Prague, Czech Republic, 21–23 March 2018; Volume 6. [Google Scholar]
- Hristova, E.; Veleva, B. Variation of air particulate concentration in Sofia, 2005–2012. Bulg. J. Meteo. Hydr. 2013, 18, 47–56. [Google Scholar]
- Veleva, B.; Hristova, E.; Nikolova, E.; Kolarova, M.; Valcheva, R. Elemental composition of air particulate (PM10) in Sofia by EDXRF techniques. J. Chem. Techno. Metallu. 2014, 49, 163–169. [Google Scholar]
- Veleva, B.; Hristova, E.; Nikolova, E.; Kolarova, M.; Valcheva, R. Statistical evaluation of elemental composition data of PM10 air particulate in Sofia. Int. J. Environ. Pollut. 2015, 57, 175–188. [Google Scholar] [CrossRef]
- Syrakov, D.; Prodanova, M.; Etropolska, I.; Slavov, K.; Ganev, K.; Miloshev, N.; Ljubenov, T. A Multy- Domain Operational Chemical Weather Forecast System. In International Conference on Large-Scale Scientific Computing; Lirkov, I., Ed.; LSSC 2013, LNCS 8353; Springer: Berlin, Germany, 2014; pp. 413–420. [Google Scholar] [CrossRef]
- Georgieva, E.; Syrakov, D.; Prodanova, M.; Etropolska, I.; Slavov, K. Evaluating the performance of WRF-CMAQ air quality modelling system in Bulgaria by means of the DELTA tool. Int. J. Environ. Pollut. 2015, 57, 272–284. [Google Scholar] [CrossRef]
- Viana, M.; Kuhlbusch, T.; Querol, X.; Alastuey, A.; Harrison, R.M.; Hopke, P.K.; Winiwarter, W.; Vallius, M.; Szidat, S.; Prévôt, A.S.H.; et al. Source apportionment of particulate matter in Europe: A review of methods results. J. Aerosol Sci. 2008, 39, 827–849. [Google Scholar] [CrossRef]
- Hopke, P.K. The application of receptor modeling to air quality data. Pollut. Atmos. 2010, 91, 91–109. [Google Scholar]
- Amato, F.; Pandolfi, M.; Escrig, A.; Querol, X.; Alastuey, A.; Pey, J.; Perez, N.; Hopke, P.K. Quantifying Road Dust Resuspension in Urban Environment by Multilinear Engine: A Comparison with PMF2. Atmos. Environ. 2009, 43, 2770–2780. [Google Scholar] [CrossRef]
- Belis, C.A.; Cancelinha, J.; Duane, M.; Forcina, V.; Pedroni, V.; Passarella, R.; Tanet, G.; Douglas, K.; Piazzalunga, A.; Bolzacchini, E.; et al. Sources for PM air pollution in the Po Plain, Italy: I. Critical comparison of methods for estimating biomass burning contributions to benzo(a)pyrene. Atmos. Environ. 2011, 45, 7266–7275. [Google Scholar] [CrossRef]
- Johnson, T.M.; Guttikunda, S.; Wells, G.J.; Artaxo, P.; Bond, T.C.; Russell, A.G.; Watson, J.G.; West, J. Tools for Improving Air Quality Management: A Review of Top-down Source Apportionment Techniques and Their Application in Developing Countries; The World Bank Group: Washington, DC, USA, 2011; p. 220. [Google Scholar]
- Hwang, I.-J.; Hopke, P.K. Comparison of source apportionment of PM25 using, P.M.F.2.; EPAPMF version 2 Asian. J. Atmos. Environ. 2011, 5, 86–96. [Google Scholar] [CrossRef]
- Amato, F.; Alastuey, A.; Karanasiou, A.; Lucarelli, F.; Nava, S.; Calzolai, G.; Severi, M.; Becagli, S.; Gianelle, V.L.; Colombi, C.; et al. AIRUSE-LIFE +: A harmonized PM speciation and source apportionment in five southern European cities. Atmos. Chem. Phys. 2016, 16, 3289–3309. [Google Scholar] [CrossRef]
- Paatero, P.; Tapper, U. Positive matrix factorization: A non-negative factor model with optimal utilization of error estimates of data values. Environmetrics 1994, 5, 111–126. [Google Scholar] [CrossRef]
- Paatero, P. The multilinear engine a table-driven, least squares program for solving multilinear problems, including the n-way parallel factor analysis model. J. Comput. Graph. Stat. 1999, 8, 854–888. [Google Scholar]
- Paatero, P.; Eberly, S.; Brown, S.G.; Norris, G.A. Methods for estimating uncertainty in factor analytic solutions. Atmos. Meas. Tech. 2014, 7, 781–797. [Google Scholar] [CrossRef]
- Perrone, M.G.; Vratolis, S.; Georgieva, E.; Török, S.; Šega, K.; Veleva, B.; Osánd, J.; Bešlić, I.; Kertész, Z.; Pernigotti, D.; et al. Sources and geographic origin of particulate matter in urban areas of the Danube macro-region: The cases of Zagreb (Croatia), Budapest (Hungary) and Sofia (Bulgaria). Sci. Tot. Environ. 2018, 619–620, 1515–1529. [Google Scholar] [CrossRef]
- Belis, C.A.; Larsen Bo, R.; Amato, F.; El Haddad, I.; Favez, O.; Harrison, R.M.; Hopke, P.K.; Nava, S.; Paatero, P.; Prevot, A.; et al. European Guide on Air Pollution Source Apportionment with Receptor Models; JRC Reference Reports, 9789279325144. ⟨10.2788/9307⟩; Publications Office of European Union: Luxembourg, 2014. [Google Scholar]
- Belis, C.A.; Favez, O.; Mircea, M.; Diapouli, E.; Manousakas, M.-I.; Vratolis, S.; Gilardoni, S.; Paglione, M.; Decesari, S.; Mocnik, G.; et al. European Guide on Air Pollution Source Apportionment with Receptor Models—Revised Version 2019; EUR 29816 EN; JRC117306; Publications Office of the European Union: Luxembourg, 2019; ISBN 978-92-76-09001-4. [Google Scholar] [CrossRef]
- National Statistical Institute. Available online: https://www.nsi.bg/en/content/6710/population-towns-and-sex (accessed on 20 June 2020).
- Davila, S.; Bešlić, I.; Šega, K. Use of ED-XRF instruments to monitor air quality, 244–249. In Proceedings of the 11th Symposium of the Croatian Radiation Protection Association, Zagreb, Croatia, 5–7 April 2017. [Google Scholar]
- Bešlić, I.; Burger, J.; Cadoni, F.; Centioli, D.; Kranjc, I.; van den Bril, B.; Rinkovec, J.; Šega, K.; Zang, T.; Žužul, S.; et al. Determination of As, Cd, Ni and Pb in PM10—comparison of different sample work-up and analysis methods. Gefahrstoffe - Reinhaltung der Luft 2020, 81, 227–233. [Google Scholar]
- Polissar, A.V.; Hopke, P.K.; Paatero, P.; Malm, W.C.; Sisler, J.F. Atmospheric aerosol over Alaska: 2 Elemental composition sources. J. Geoph. Res. Atmos. 1998, 103, 19,045–19,057. [Google Scholar] [CrossRef]
- Atmosphere monitoring service. Available online: https://policy.atmosphere.copernicus.eu/ (accessed on 29 June 2020).
- Simpson, D.; Benedictow, A.; Berge, H.; Bergström, R.; Emberson, L.D.; Fagerli, H.; Flechard, C.R.; Hayman, G.D.; Gauss, M.; Jonson, J.E.; et al. The EMEP MSC-W chemical transport model—technical description. Atmos. Chem. Phys. 2012, 12, 7825–7865. [Google Scholar] [CrossRef]
- Manders, A.M.M.; Builtjes, P.J.H.; Curier, L.; Denier van der Gon, H.A.C.; Hendriks, C.; Jonkers, S.; Kranenburg, R.; Kuenen, J.J.P.; Segers, A.J.; Timmermans, R.M.A.; et al. Curriculum vitae of the LOTOS–EUROS (v2.0) chemistry transport model. Geosci. Model Dev. 2017, 10, 4145–4173. [Google Scholar] [CrossRef]
- Pommier, M.; Fagerli, H.; Schulz, M.; Valdebenito, A.; Kranenburg, R.; Schaap, M. Prediction of source contributions to urban background PM10 concentrations in European cities: A case study for an episode in December 2016 using EMEP/MSC-W rv4.15 and LOTOS-EUROS v2.0—Part 1: The country contributions. Geosci. Model Dev. 2020, 13, 1787–1807. [Google Scholar] [CrossRef]
- Schulz, M.; Mortier, A.; Tsyro, S.V. Annual Source-Receptor Major European Cities—2019. Issued by: Met Norway, 06/07/2020 Ref: CAMS71_2019SC1_D3.1.5-2020_202007_AnnualSR2019_v2. 2020. Available online: https://policy.atmosphere.copernicus.eu/reports/CAMS71_D3.1.5-2020_v2.pdf (accessed on 21 June 2020).
- Alastuey, A.; Querol, X.; Aas, W.; Lucarelli, F.; Moreno, T.; Cavalli, F.; Areskoug, H.; Balan, V.; Catrambone, M.; Ceburnis, D.; et al. Geochemistry of PM10 over Europe. Atmos. Chem. Phys. 2016, 16, 6107–6129. [Google Scholar] [CrossRef]
- Taiwo, A.M. Source Apportionment of Urban Background Particulate Matter in Birmingham, United Kingdom Using a Mass Closure Model. Aerosol Air Qual. Res. 2016, 16, 1244–1252. [Google Scholar] [CrossRef]
- Koçak, M.; Theodosi, C.; Zarmpas, P.; Ima, U.; Bougiatioti, A.; Yenigun, O.; Mihalopoulos, N. Particulate matter (PM10) in Istanbul: Origin, source areas and potential impact on surrounding regions. Atmos. Environ. 2011, 45, 6891–6900. [Google Scholar] [CrossRef]
- Sharma, S.K.; Mandal, T.K.; Saxena, M.; Rashmi; Rohtash; Sharma, A.; Gautam, R. Source apportionment of PM10 by using positive matrix factorization at an urban site of Delhi, India. Urban Clim. 2014, 10, 656–670. [Google Scholar] [CrossRef]
- Manousakas, M.; Diapouli, E.; Papaefthymiou, H.; Migliori, A.; Karydas, A.G.; Padilla-Alvarez, R.; Bogovac, M.; Kaiser, R.B.; Jaksic, M.; Bogdanovic-Radovic, I.; et al. Source apportionment by PMF on elemental concentrations obtained by PIXE analysis of PM10 samples collected at the vicinity of lignite power plants and mines in Megalopolis, Greece. Nucl. Instrum. Methods Phys. Res. 2015, 349, 114–124. [Google Scholar] [CrossRef]
- Samek, L.; Stegowski, Z.; Furman, L.; Fiedor, J. Chemical content and estimated sources of fine fraction of particulate matter collected in Krakow. Air Qual. Atmos. Health 2017, 10, 47–52. [Google Scholar] [CrossRef]
- Bozkurt, Z.; Gaga, E.O.; Taşpınar, F.; Arı, A.; Pekey, B.; Pekey, H.; Döğeroğlu, T.; Üzmez, Ö.Ö. Atmospheric ambient trace element concentrations of PM10 at urban and sub-urban sites: Source apportionment and health risk estimation. Environ. Monit. Assess 2018, 190, 2–17. [Google Scholar] [CrossRef]
- Karagulian, F.; Belis, C.A.; Francisco, C.; Dora, C.; Prüss-Ustün, A.M.; Bonjour, S.; Adair-Rohani, H.; Amann, M. Contributions to cities’ ambient particulate matter (PM): A systematic review of local source contributions at global level. Atmos. Environ. 2015, 120, 475–483. [Google Scholar] [CrossRef]
- Norris, G.; Duvall, R. EPA Positive Matrix Factorization (PMF) 5.0 Fundamentals and User Guide. United States; (EPA/600/R-14/2018); Environmental Protection Agency (EPA); Office of Research and Development: Washington, DC, USA, 2014. [Google Scholar]
- Pernigotti, D.; Belis, C.A.; Span, L. SPECIEUROPE: The European data base for PM source profiles. Atmos. Pollu. Res. 2016, 7, 307–314. [Google Scholar] [CrossRef]
- Gunchin, G.; Manousakas, M.; Osan, J.; Karydas, A.G.; Eleftheriadis, K.; Lodoysamba, S.; Shagjjamba, D.; Migliori, A.; Padilla-Alvarez, R.; Streli, C.; et al. Three-year Long Source Apportionment Study of Airborne Particles in Ulaanbaatar Using X-ray Fluorescence and Positive Matrix Factorization. Aerosol Air Qual. Res. 2019, 19, 1056–1067. [Google Scholar] [CrossRef]
- Copernicus Emergency Management Service. Available online: https://effis.jrc.ec.europa.eu/static/effis_current_situation/public/index.html (accessed on 15 June 2020).
- SPECISUROPE. Available online: https://source-apportionment.jrc.ec.europa.eu/Specieurope/profiles.aspx?specie=779] (accessed on 21 May 2019).
- Bulgarian National Emission Register. Available online: http://pdbase.government.bg/forms/public_eprtr.jsp (accessed on 21 May 2019).
- Annual Reports. Available online: http://eea.government.bg/bg/r-r/r-kpkz/godishni-dokladi-14/index (accessed on 7 May 2019).
- Lazaridis, M.; Eleftheriadis, K.; Smolik, J.; Colbeck, I.; Kallos, G.; Drossinos, Y.; Zdimal, V.; Mihalopoulos, N.; Mikuska, P.; Bryant, C.; et al. Dynamics of fine particles and photo-oxidants in the Eastern Mediterranean (SUB-AERO). Atmos. Environ. 2006, 40, 6214–6228. [Google Scholar] [CrossRef]
- Raman, R.S.; Hopke, P.K. Source apportionment of fine particles utilizing partially speciated carbonaceous aerosol data at two rural locations in New York State. Atmos. Environ. 2007, 41, 7923–7939. [Google Scholar] [CrossRef]
- Lim, J.M.; Lee, J.H.; Moon, J.H.; Chung, Y.S.; Kim, K.H. Source apportionment of PM10 at a small industrial area using positive matrix factorization. Atmos. Res. 2010, 95, 88–100. [Google Scholar] [CrossRef]
- Wahlin, P.; Berkowicz, R.; Palmgren, F. Characterisation of traffic-generated particulate matter in Copenhagen. Atmos. Environ. 2006, 40, 2151–2159. [Google Scholar] [CrossRef]
- Song, F.; Gao, Y. Size distributions of trace elements associated with ambient particular matter in the affinity of a major highway in the New Jerseye, New York metropolitan area. Atmos. Environ. 2011, 45, 6714–6723. [Google Scholar] [CrossRef]
- Amato, F.; Pandolfi, M.; Moreno, T.; Furger, M.; Pey, J.; Alastuey, A.; Bukowiecki, N.; Prevot, A.S.H.; Baltensperger, U.; Querol, X. Sources and variability of inhalable road dust particles in three European cities. Atmos. Environ. 2011, 45, 6777–6787. [Google Scholar] [CrossRef]
- Pant, P.; Harrison, R.M. Estimation of the contribution of road traffic emissions to particulate matter concentrations from field measurements: A review. Atmos. Environ. 2013, 77, 78–97. [Google Scholar] [CrossRef]
- Diapouli, E.; Manousakas, M.I.; Vratolis, S.; Vasilatou, V.; Pateraki, S.; Bairachtari, K.A.; Querol, X.; Amato, F.; Alastuey, A.; Karanasiou, A.A.; et al. AIRUSE-LIFE +: Estimation of natural source contributions to urban ambient air PM10 and PM2.5 concentrations in Southern Europe—implications to compliance with limit values. Atmos. Chem. Phys. 2017, 17, 3673–3685. [Google Scholar] [CrossRef]
- Eleftheriadis, K.; Ochsenkuhn, K.M.; Lymperopoulou, T.; Karanasiou, A.; Razos, P.; Ochsenkuhn-Petropoulou, M. Influence of local and regional sources on the observed spatial and temporal variability of size resolved atmospheric aerosol mass concentrations and water-solublespecies in the Athens metropolitan area. Atmos. Environ. 2014, 97, 252–261. [Google Scholar] [CrossRef]
- Kim, B.M.; Park, J.-S.; Kim, S.-W.; Kim, H.J. Source apportionment of PM10 mass and particulate carbon in the Kathmandu Valley, Nepal. Atmos. Environ. 2015, 123, 190–199. [Google Scholar] [CrossRef]
- Stein, A.F.; Draxler, R.R.; Rolph, G.D.; Stunder, B.J.B.; Cohen, M.D.; Ngan, F. NOAA’s HYSPLIT atmospheric transport and dispersion modeling system. Bull. Amer. Meteor. Soc. 2015, 96, 2059–2077. [Google Scholar] [CrossRef]


© 2020 by the authors. Licensee MDPI, Basel, Switzerland. This article is an open access article distributed under the terms and conditions of the Creative Commons Attribution (CC BY) license (http://creativecommons.org/licenses/by/4.0/).