Article

Heat Wave and Elderly Mortality: Historical Analysis and Future Projection for Metropolitan Region of São Paulo, Brazil

by
Fernanda Rodrigues Diniz
1,*,
Fábio Luiz Teixeira Gonçalves
1 and
Scott Sheridan
2
1
Institute of Astronomy, Geophysics and Atmospheric Sciences, University of São Paulo (USP), São Paulo 05508-090, Brazil
2
Department of Geography, Kent State University, Kent, OH 44242, USA
*
Author to whom correspondence should be addressed.
Atmosphere 2020, 11(9), 933; https://doi.org/10.3390/atmos11090933
Submission received: 30 July 2020 / Revised: 21 August 2020 / Accepted: 26 August 2020 / Published: 31 August 2020
(This article belongs to the Section Biometeorology and Bioclimatology)

Abstract

:
The Metropolitan Region of Sao Paulo (MRSP) is one of the main regions of Brazil that in recent years has shown an increase in the number of days with heat waves, mainly affecting the health of the most sensitive populations, such as the elderly. In this study, we identified the heat waves in the MRSP using three different definitions regarding the maximum daily temperature threshold. To analyze the impact of heat waves on elderly mortality, we used distributed lag nonlinear models (dlnm) and we quantified the heat wave-related excess mortality of elderly people from 1985 to 2005 and made projections for the near future (2030 to 2050) and the distant future (2079–2099) under the climate change scenarios RCP4.5 and RCP8.5 (RCP: Representative Concentration Paths). An important aspect of this research is that for the projections we take into account two assumptions: non-adaptation and adaptation to the future climate. Our projections show that the heat wave-related excess of elderly mortality will increase in the future, being highest when we consider no adaptation, mainly from cardiovascular diseases in women (up to 587 deaths per 100,000 inhabitants per year). This study can be used for public policies to implement preventive and adaptive measures in the MRSP.

1. Introduction

According to paleo-climatic studies, the Earth has always witnessed natural cycles of heating and cooling [1,2]. However, the unbridled increase in industrial activity in recent centuries is affecting the Earth’s climate outside of its natural variation [1]. The Intergovernmental Panel on Climate Change (IPCC) has demonstrated in the Fifth Assessment Report (AR5)—its most recent—that the influence of human action on the climate system is obvious, with recent emissions of greenhouse gases being the highest in history [3].
According to the IPCC report, the global average temperature is expected to rise between 1.8 and 4 °C by 2100 [3]. In this report, four scenarios of emissions and concentration of greenhouse gases that could occur through 2100 were presented, called Representative Concentration Paths (RCPs). The four scenarios, RCP2.6, RCP4.5, RCP6, and RCP8.5, are labeled as a possible range of radiative forcing values in the year 2100 (2.6, 4.5, 6.0 and 8.5 W/m2, respectively).
Climate change can cause numerous impacts on the planet, such as rising sea levels, excess precipitation, droughts and intense heat waves [4]. In terms of the health of the world population, heat waves have a direct impact on the population. While there have been many studies on heat waves and health, there is no universal definition of what a heat wave is [5]. In this study, we use several definitions—daily maximum temperature must exceed the 90th, 95th, or 98th percentile of temperature for the reference period for three consecutive days to be classified as a heat wave, a metric used in a number of other studies [6,7].
The structure of the population within society today is changing; the proportion of elderly people is increasing due to increased longevity, which results in a higher prevalence of chronic diseases [8]. Studies show that the elderly population is among the most vulnerable to heat waves due to them having the most sensitive thermoregulatory system [9]. Physiological responses to environmental conditions deteriorate with aging and some medications further interact with thermoregulation, increasing the risk. According to the World Health Organization (WHO) [10], high air temperatures contribute directly to deaths from cardiovascular and respiratory diseases, particularly among the elderly, as high temperatures, in addition to affecting thermoregulation also increase ozone and other pollutants that exacerbate cardiovascular and respiratory diseases, which sometimes result in deaths.
Studies have shown associations between heat waves and mortality in different regions of the world [11,12,13,14,15]. Nori-Sarma et al. [14] studied the impacts of heat waves on mortality in India in the period 2000 to 2012, as a result found that mortality increases about 18.1% on days when there are heat waves. According to the study by Steen et al. [13] who reviewed the presence of gender-specific results in studies conducted on elderly mortality (>65 years) due to heat waves in Europe, most studies showed worse health outcomes for elderly women compared to men. Guo et al. [11] pointed out that Brazil appeared to be vulnerable to increased mortality of elderly people with cardiovascular and respiratory diseases during heat waves. Although the country is tropical, episodes of heat waves have become more frequent over recent years [16]. The study by Geirinhas et al. [17] showed that Sao Paulo, Manaus and Recife showed the most marked growth in the number of days per year with heat waves from 1961 to 2014, with Sao Paulo being the city where the greatest number of heat wave days was identified, reaching 50 days with heat waves in 2014.
According to Gou et al. [18], urban areas may be particularly vulnerable to heat waves due to high concentrations of susceptible population groups and urban heat islands. This is observed in the Metropolitan Region of Sao Paulo (MRSP), which has one of the largest populations of elderly in Brazil. According to Pereira et al. [19], the elderly population in the region is increasing over time and may increase by 40% by 2050. In addition to the population increase, MRSP suffers from increases in local temperature due to urban heat islands. Therefore, with the continual rise in global mean temperature due to climate change coupled with an increasing urban heat island and aging population, research on excess mortality of the elderly population during heat waves in the MRSP becomes highly important.
Studies show that temperature percentiles that are associated with mortality vary from region to region, suggesting that the population has the potential to adapt to some degree to the local climate [6,18]. Likewise, it is expected that people may also have the ability to adapt to the increase in the frequency and intensity of heat waves, through adaptation interventions. According to Wight at al. [20] and adapted by Guo et al. [12] adaptation to heat waves can largely be explained by six levels of adaptation interventions: Individual, interpersonal, community, institutional, environmental and public policy. In summary, individual intervention occurs by information provision; interpersonal intervention occurs by sharing information to other people; the community intervention has a fundamental role strengthening community infrastructure; institutional intervention must occur by procedures and regulations; environmental intervention occurs by urban planning and management and public policy intervention occurs by improvement of health and services. According to Guo et al. [12] these adaptation interventions could change human behavior and physiology (e.g., clothing, physical activity, healthy lifestyles, city planning) affecting the health burden of high temperatures. Therefore, considering uncertainties about future adaptation to heat waves would make mortality estimates more robust [12].
For this reason, this study aims to quantify the excess mortality of the elderly population due to respiratory and cardiovascular diseases during heat waves in the MRSP in the baseline period (1985 to 2005) and to make projections, considering the scenarios RCP4.5 and RCP8.5 of climate change for the near future (2030 to 2050) and distant future (2079 to 2099). An important aspect of this study is the analysis of the uncertainties in the estimation of excess mortality attributed to heat waves, such as climate change scenarios, heat wave definitions (changes in percentiles) and population adaptation.

2. Experiments

2.1. Metropolitan Region of São Paulo (MRSP)

The MRSP is the largest metropolitan region in Brazil with an area of 7946.84 km2 and includes 39 municipalities [21]. The MRSP is also one of the ten most populous metropolitan regions in the world with approximately 21.5 million inhabitants [21].
The climate of the MRSP according to the classification of Köppen–Geiger is humid subtropical (Cwa), that is, the summer season is marked by moderate temperatures and much precipitation due to unstable tropical air masses [22,23]. The winter season is characterized by a dry season with milder temperatures [22,23].

2.2. Data

2.2.1. Mortality and Elderly Population of the MRSP

Mortality daily data were obtained from the website of the Department of Informatics of the Brazilian Unified Health System (DATASUS) for the period 1996 to 2016 [24]. Mortality data were obtained from the 39 cities of the MRSP, restricted to only deaths related to cardiovascular and respiratory diseases (International Classification of Diseases—ICD-10: I00-J99) of people aged over 60 years, the threshold age for elderly by the Brazilian Elderly Status of 2003 [25].
The annual data of the elderly population separated by gender (female and male) from 1985 to 2020 were also obtained from the DATASUS website [24].

2.2.2. Historical Temperature and Future Simulations

In this study, daily data of maximum temperature observed and modeled were used. Observed data from the period 1996 to 2016 were obtained from the meteorological station of the Institute of Astronomy, Geophysics and Atmospheric sciences in University of Sao Paulo [26].
The climatic future simulations using the Eta-HADGEM2-ES model with 5 km resolution were extracted for the geographic coordinate of Sao Paulo capital at 23°32′56″ S latitude and 46°38′20″ W longitude. The simulations used in this study were generated by CPTEC/INPE (Center for Weather Forecast and Climatic Studies of the National Institute of Space Research) and made available in the PROJETA platform (Projections of climate change for South America regionalized by the Eta model) [27,28,29]. The daily maximum temperature data from climate model baseline were obtained for the period 1985 to 2005 and the climatic simulations in the scenarios RCP4.5 and RCP8.5 were obtained for the periods 2030 to 2050 and 2079 to 2099. These datasets available in PROJETA platform are already corrected by delta-change method.
Climate model baseline data were not available for the period 1996–2016 corresponding to our observed data, but the climate model baseline period has substantial overlap with our observed historical data time period.

2.3. Statistical Analysis

2.3.1. Identification of Heat Waves

The heat waves were identified in the warm period (September to March) using the definition given by Russo et al. [7], where a heat wave is defined as a period of at least three consecutive days with maximum temperatures above the threshold of the 90th percentile of the maximum daily temperature of the reference period. To calculate the relationship between exposure-response, the heat waves were identified based on the observed data (1996–2016). However, for comparison between historical and projected values, the heat wave statistics were calculated relative to the climate model baseline period of 1985–2005 (historical case and non-adaptation assumption described below). The threshold is defined as the 90th percentile of daily maxima, centered on a 31 day window. In addition to the 90th percentile, we also identified heat waves based on thresholds of 95th and 98th percentiles, because they are also thresholds used in studies to identify heat waves [6,12,30]. Hence, for a given day of year d, the threshold is the 90th, 95th and 98th percentile of the set of data Ad defined by:
A d = y = 1985 2005 i = d 15 d + 15 T y , i
where ∪ denotes the union of sets and Ty,i is the daily maximum temperature of the day i in the year y.
Although the actual mechanisms of adaptation are unknown, if we assume that humans adapt to rising temperatures with the same response to temperature distribution [12], the future heat wave thresholds would be defined using the same percentiles for maximum daily temperature (90th, 95th and 98th percentiles) in the period of 2030 to 2050 and of 2079 to 2099. Thus, in order to verify the impacts of future heat waves, we used the same methodology as Guo et al. [12]. Two assumptions on heat wave adaptation were herein considered:
(1)
non-adaptation: using current heat wave daily threshold (1985–2005), as presented in Equation (1), and:
(2)
hypothetical adaptation: heat wave daily threshold is recalculated with Equation (1) using the future 90th, 95th and 98th percentiles of maximum daily temperature during the period of 2030 to 2050 (the new climatological reference for the near future) and during the period of 2079 to 2099 (new climatological reference for the distant future). Those new references are used as indication of a complete adaptation, through six levels of adaptation, described in Section 1.

2.3.2. Projection of the Elderly Population of the MRSP

The projections of the elderly population separated by gender of the MRSP to be analyzed in this study were carried out for the period from 2021 to 2100 using Equation (2) [31].
P p r o j e c t e d = P   e r t
where Pprojected is the projected population on t, P is the current annual population, r is the growth rate of the elderly population and t is the period. The population growth rate in the future was based on projections of the elderly population separated by gender in Brazil by the United Nations World Population Prospects 2019 in the period 2021 to 2100, considering median variance in fertility and confidence interval of 95% [32].

2.3.3. Historical Heat-Wave Elderly Mortality Relationships

In order to quantify the impact of heat waves on the mortality of the elderly in the MRSP for the observed data (1996 to 2016), generalized linear models (GLM) with quasi-Poisson distribution are used. According to Gasparrini and Armstrong [6] the effects of heat during heat waves can be described as the sum of two contributions: the independent effects of daily air temperature levels (known as the main effects) and the effects added due to duration heat for several consecutive days. These contributions were analyzed by the results of the statistical models, the first contribution (main effects) being a function of exposure-response between maximum temperature and health, while the second contribution (added effects) is a function indicating heat waves days (HW = 1) and no heat waves days (HW = 0). An algebraic representation is given by Equation (3):
L o g | E ( Y i ) | = β 0 + β 1 H W + β 2 T C B m a x + β 3 D O W + β 4 n s ( T i m e ,   d f = 4 ) + β 5 n s ( Y e a r ,   d f = 3 )
where Yi is the mortality count, assuming that it follows a quasi-Poisson distribution for each day i. The main effect of heat on day i is described by the TCBmax that is a cross-basis function (from distributed lag non-linear model (DLNM)) of the time-lagged maximum temperature series, with a maximum lag of 10 days. To allow flexibility, TCBmax is specified as a two-dimensional spline function, defining a nonlinear lag distribution, where the main effect varies over the two dimensions of temperature and lag. The relationship in the temperature space is modeled by a B-spline with 6 degrees of freedom (df) and three internal knots placed at equally spaced values in the log scale. Changes in the shape along lags are modeled by a B-spline with 5 df, up to a maximum lag of 10 days [6]. HW is an indicator function for heat waves days or no. The remaining covariables include an indicator for day of the week, ranging from one to seven (DOW) and spline functions for year and time. Seasonality was controlled for using a natural cubic spline with 3 df for year. Long-term trend was controlled for using a natural cubic spline with 4 df for time. These adjustment terms follow an approach applied in previous studies to analyzes restricted to warm months [6,12].
The relative risk of the main effect is predicted between the median maximum temperature among heat-wave days versus the 75th percentile of annual maximum temperature distribution. This percentile of maximum temperature was chosen as the minimum mortality temperature, based on previous studies [6,33]. The added effect is estimated as the exponential of the coefficient for the indicator variable (HW).

2.3.4. Projection of Heat Wave-Related Annual Excess of Elderly Mortality

The expected excess mortality of female and male elderly people from cardiovascular and respiratory diseases during heat waves per year for each threshold and for each set of climate change scenarios (RCP4.5 and RCP8.5) was calculated for the baseline period (1985–2005) and projected for the near future (2030–2050) and distant future (2079–2099), using Equation (4) [34]:
H W E M = N × ( e β T 1 ) × H W N
N = P O P × M R
where HWEM is the number of heat wave-related excess deaths, N is the mean number of deaths in days in which heat waves do not occur, β is the coefficient estimated from Poisson regression, ∆T is the difference of median of maximum temperature between historical and future period, HWN is the number of annual heat wave days, POP is the annual population and MR is the average daily mortality rate on days in which historical heat waves do not occur.
For the non-adaptation assumption to heat waves, the excess elderly mortality was calculated by Equation (3) using the number of days of heat waves per year (HWN) in the near and distant future using the same values of the thresholds of 90th, 95th and 98th percentile of maximum temperature based on the reference period (1985–2005). For the adaptation assumption in the future, the HWN used was the number of days of heat waves calculated considering new thresholds for the future, based on the reference period of the near future (2030–2050) and the distant future (2079–2099) [12].

2.3.5. Software

All the main analyzes and graphs were made using the statistical environment R (version 4.0.0) [35]. Distributed lag nonlinear models are specified through the package dlnm (version 2.4.2). The heat waves were identified using the packages heatwaveR (version 0.4.4) and futureheatwav (version 1.0.3). The climate simulations can be obtained by the package EtaModelCC (version 0.8.7).
All data used and R codes can be found in Supplementary Materials, making the results obtained here reproducible.

3. Results

We analyzed the Metropolitan Region of São Paulo collectively for all 39 cities. The dataset includes 145,812 male elderly deaths and 158,945 female elderly deaths caused by cardiovascular diseases, and 60,939 male elderly deaths and 55,888 female elderly deaths caused by respiratory diseases over the entire period 1996–2016. Figure 1 presents the estimated and projected elderly population for the MRSP. The elderly population is projected to increase by the end of the century for both genders, increasing 142% by 2050 and 175% by 2100 in relation to 2020 (Figure 1).
Table 1 presents the annual characteristics of heat waves in the historical period, near future and distant future considering the RCP4.5 and RCP8.5 climate change scenarios and non-adaptation and adaptation assumptions. Such characteristics are the annual number of days of heat waves (HW), average duration and average intensity for each 90th, 95th and 98th percentile maximum temperature.
The projections for the annual heat waves in the 90th, 95th and 98th percentile show an increase in the number of days, duration and intensity of heat waves in the MRSP for the near future (2030–2050) and a greater increase in the distant future (2079–2099), if there is no adaptation. In this assumption, the projections show that the increase in the number of days, duration and intensity of heat waves is greatest in both periods under the RCP8.5 scenario, with a smaller increase under RCP4.5. Under the adaptation assumption, the projections show a decrease in the number of days and duration of heat waves in both scenarios and periods. On the other hand, in an adaptation assumption the heat wave intensity is highest in the three percentiles for maximum temperature (Table 1).
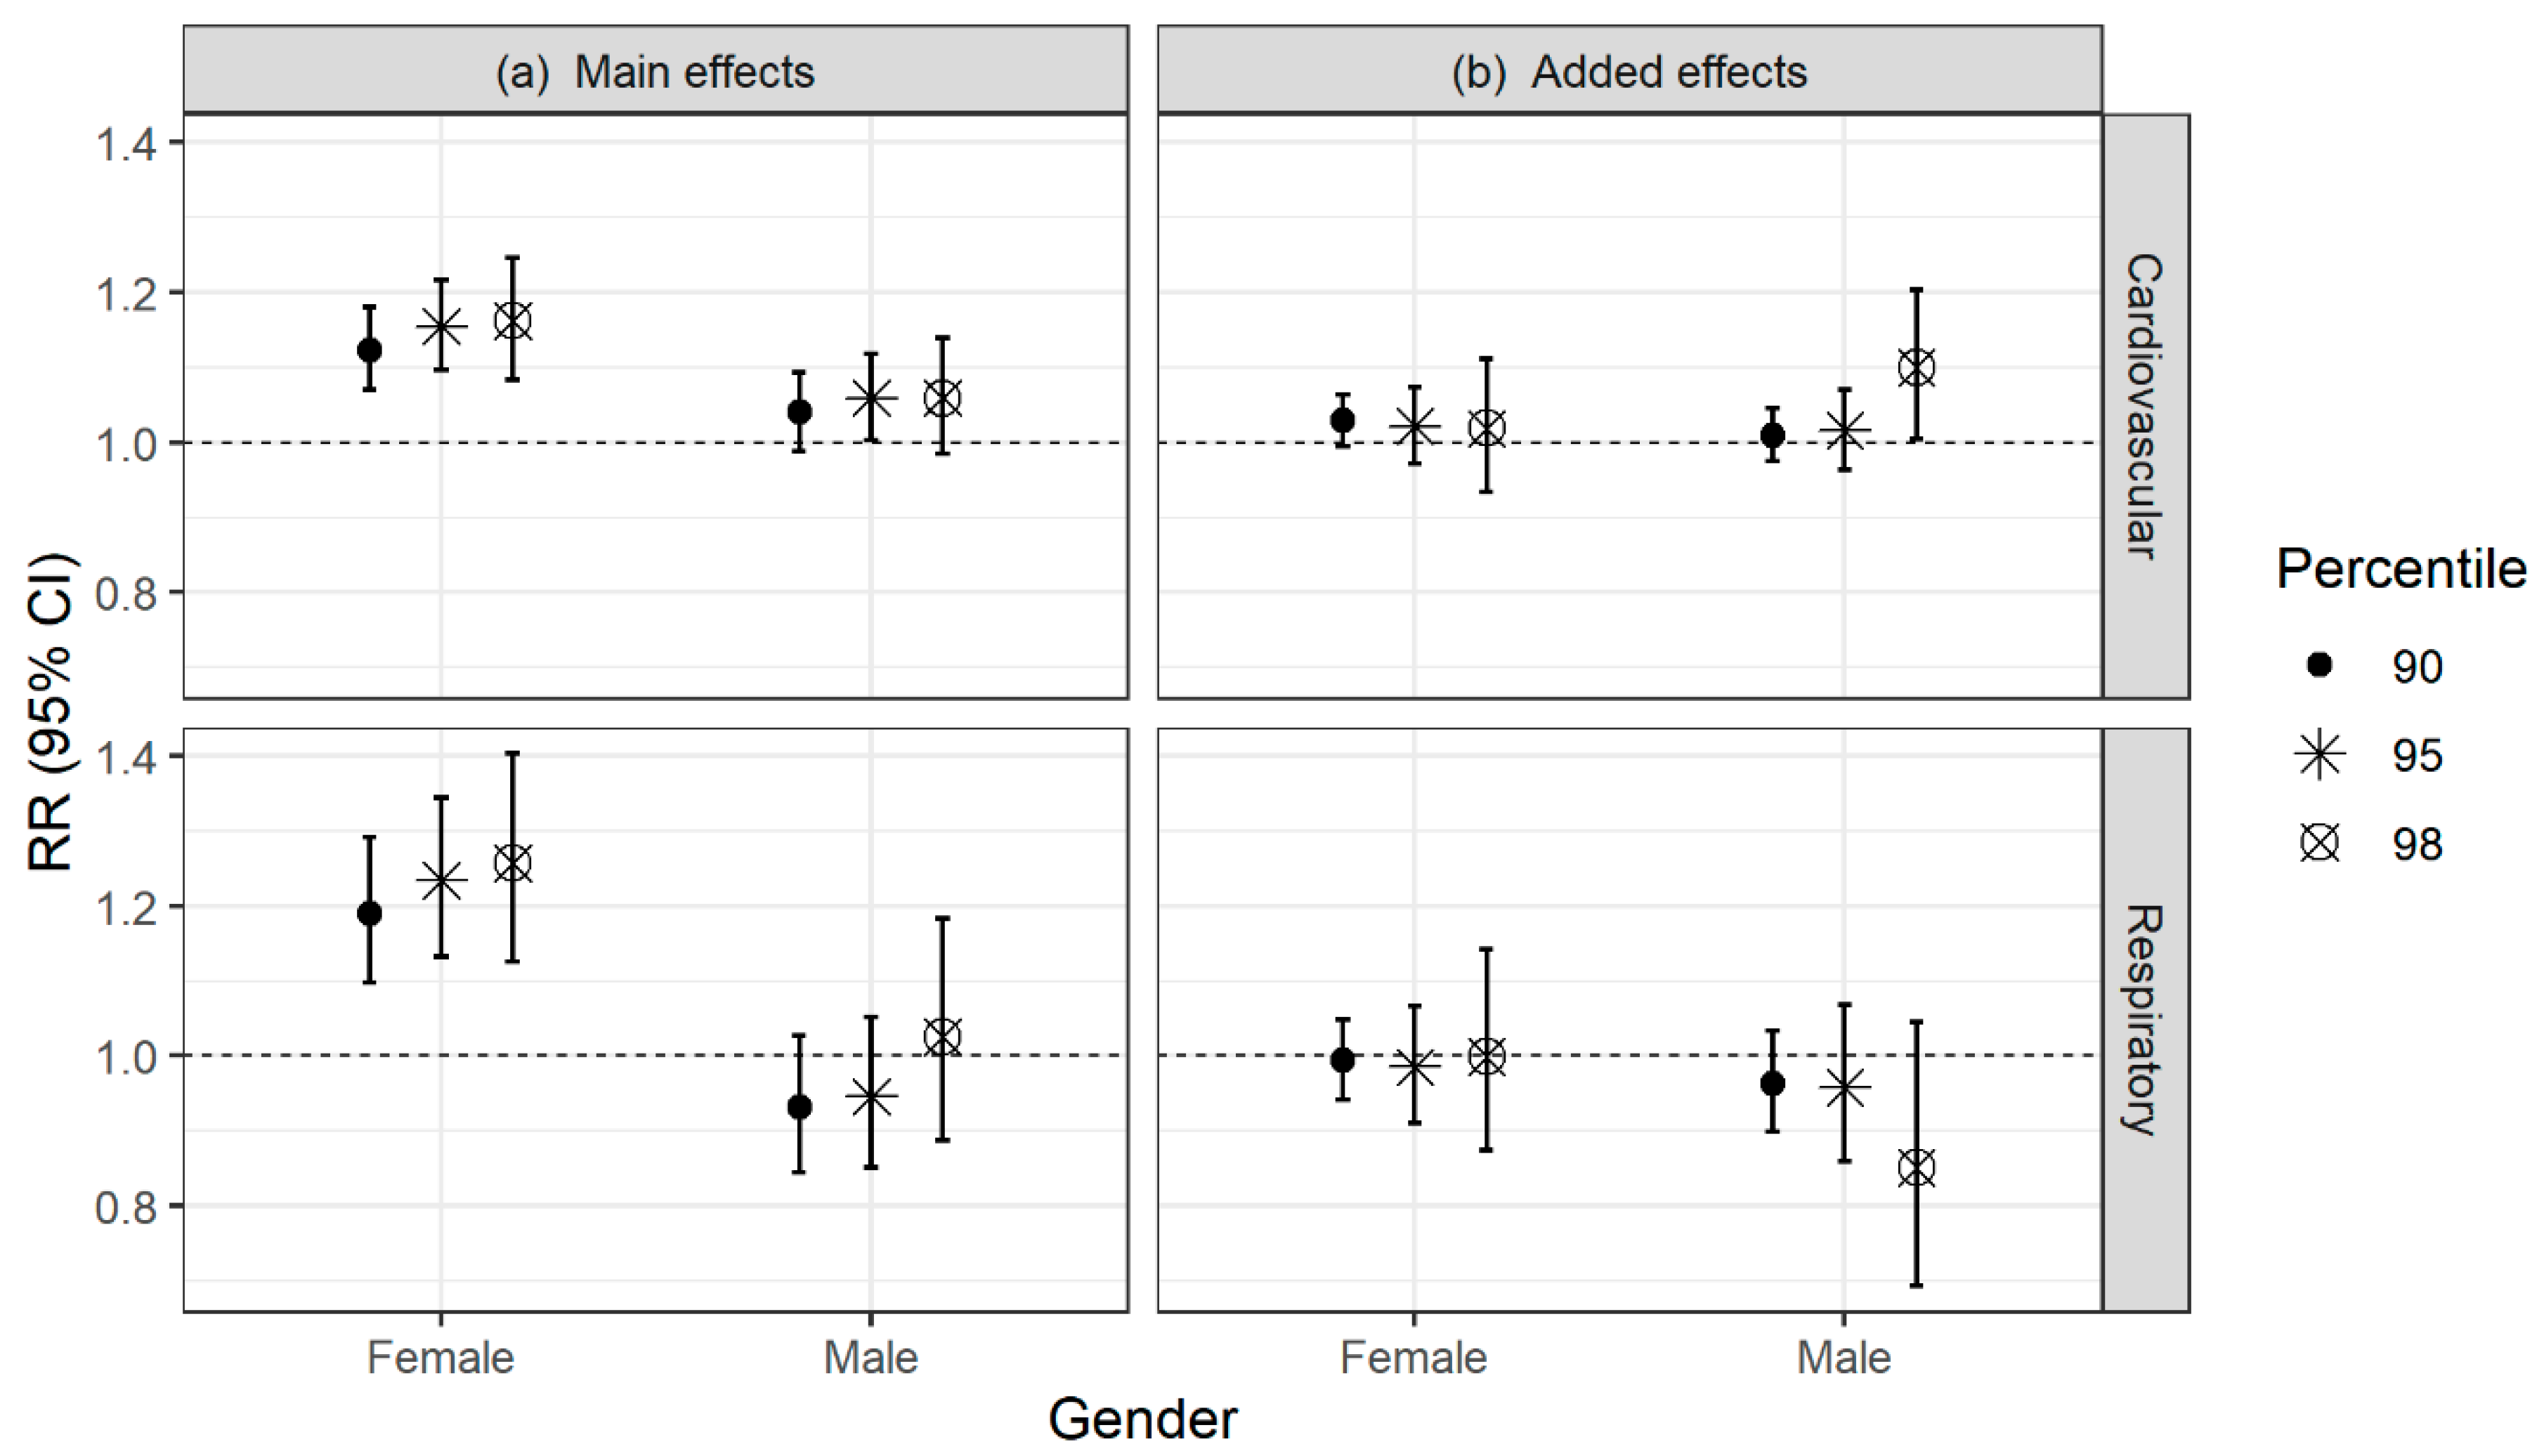
Figure 2 presents the overall historical relative risk values of elderly mortality related to heat waves from respiratory and cardiovascular diseases for the female and male genders over main effects (Figure 2a) and added effects (Figure 2b) of the heat, considering each of the 90th, 95th and 98th percentiles maximum temperature. The lag response curve (0 to 10 days) for main effects of heat wave is present in Figure S1.
In Figure 2, it is possible to observe that the added effect of heat is weak compared to the main effects. This suggests that the increased risk of mortality in the elderly during heat waves can be explained only by the main effect [6].
Elderly females present higher heat wave related mortality relative risk from both cardiovascular and respiratory diseases (Figure 2). However, the risk of mortality from respiratory diseases for this gender is even greater than that of cardiovascular diseases (RR = 1.26; 95% CI: 1.12–1.40). The opposite is observed for the elderly males, which, although the risk is relatively lower than for females, the relative risk of mortality is higher from cardiovascular disease, when we consider the main effects of heat (RR = 1.06; 95 % CI: 0.98–1.14). From respiratory diseases, the male gender only presented a mortality risk for extremely high temperatures (RR = 1.025; CI 95%: 0.88–1.18), i.e., more intense heat waves (98th percentile). Although the relative risk for males from respiratory diseases is not statistically significant, it can be clinically important, which will be considered in future analyzes.
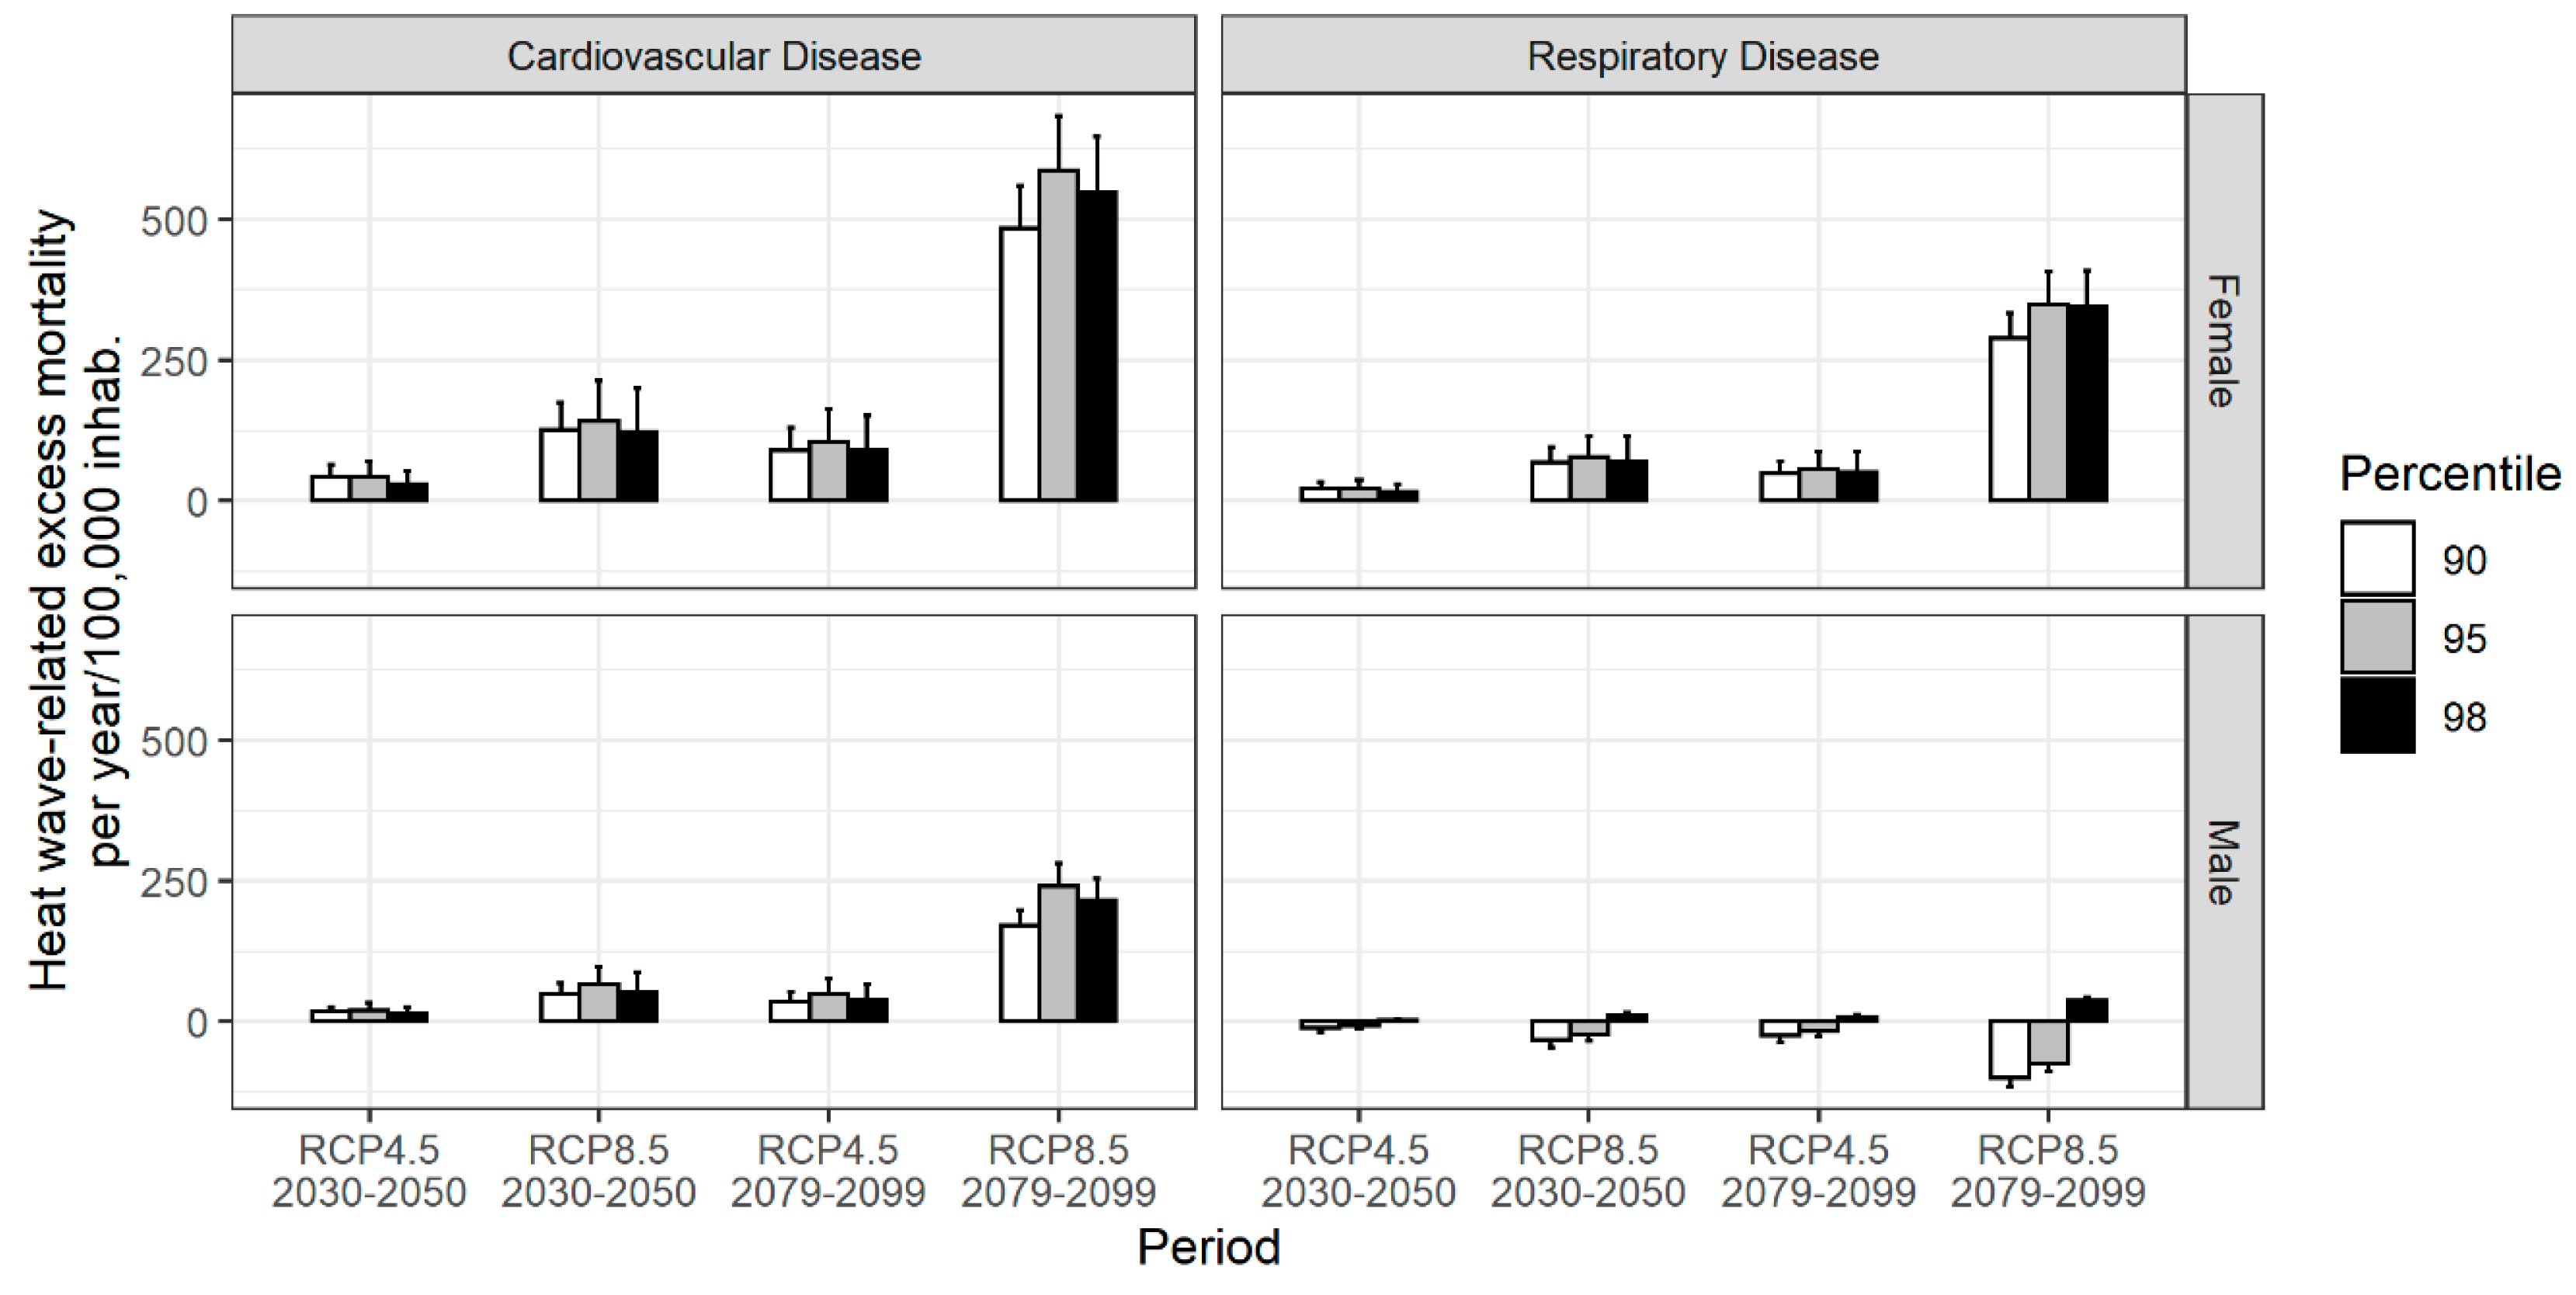
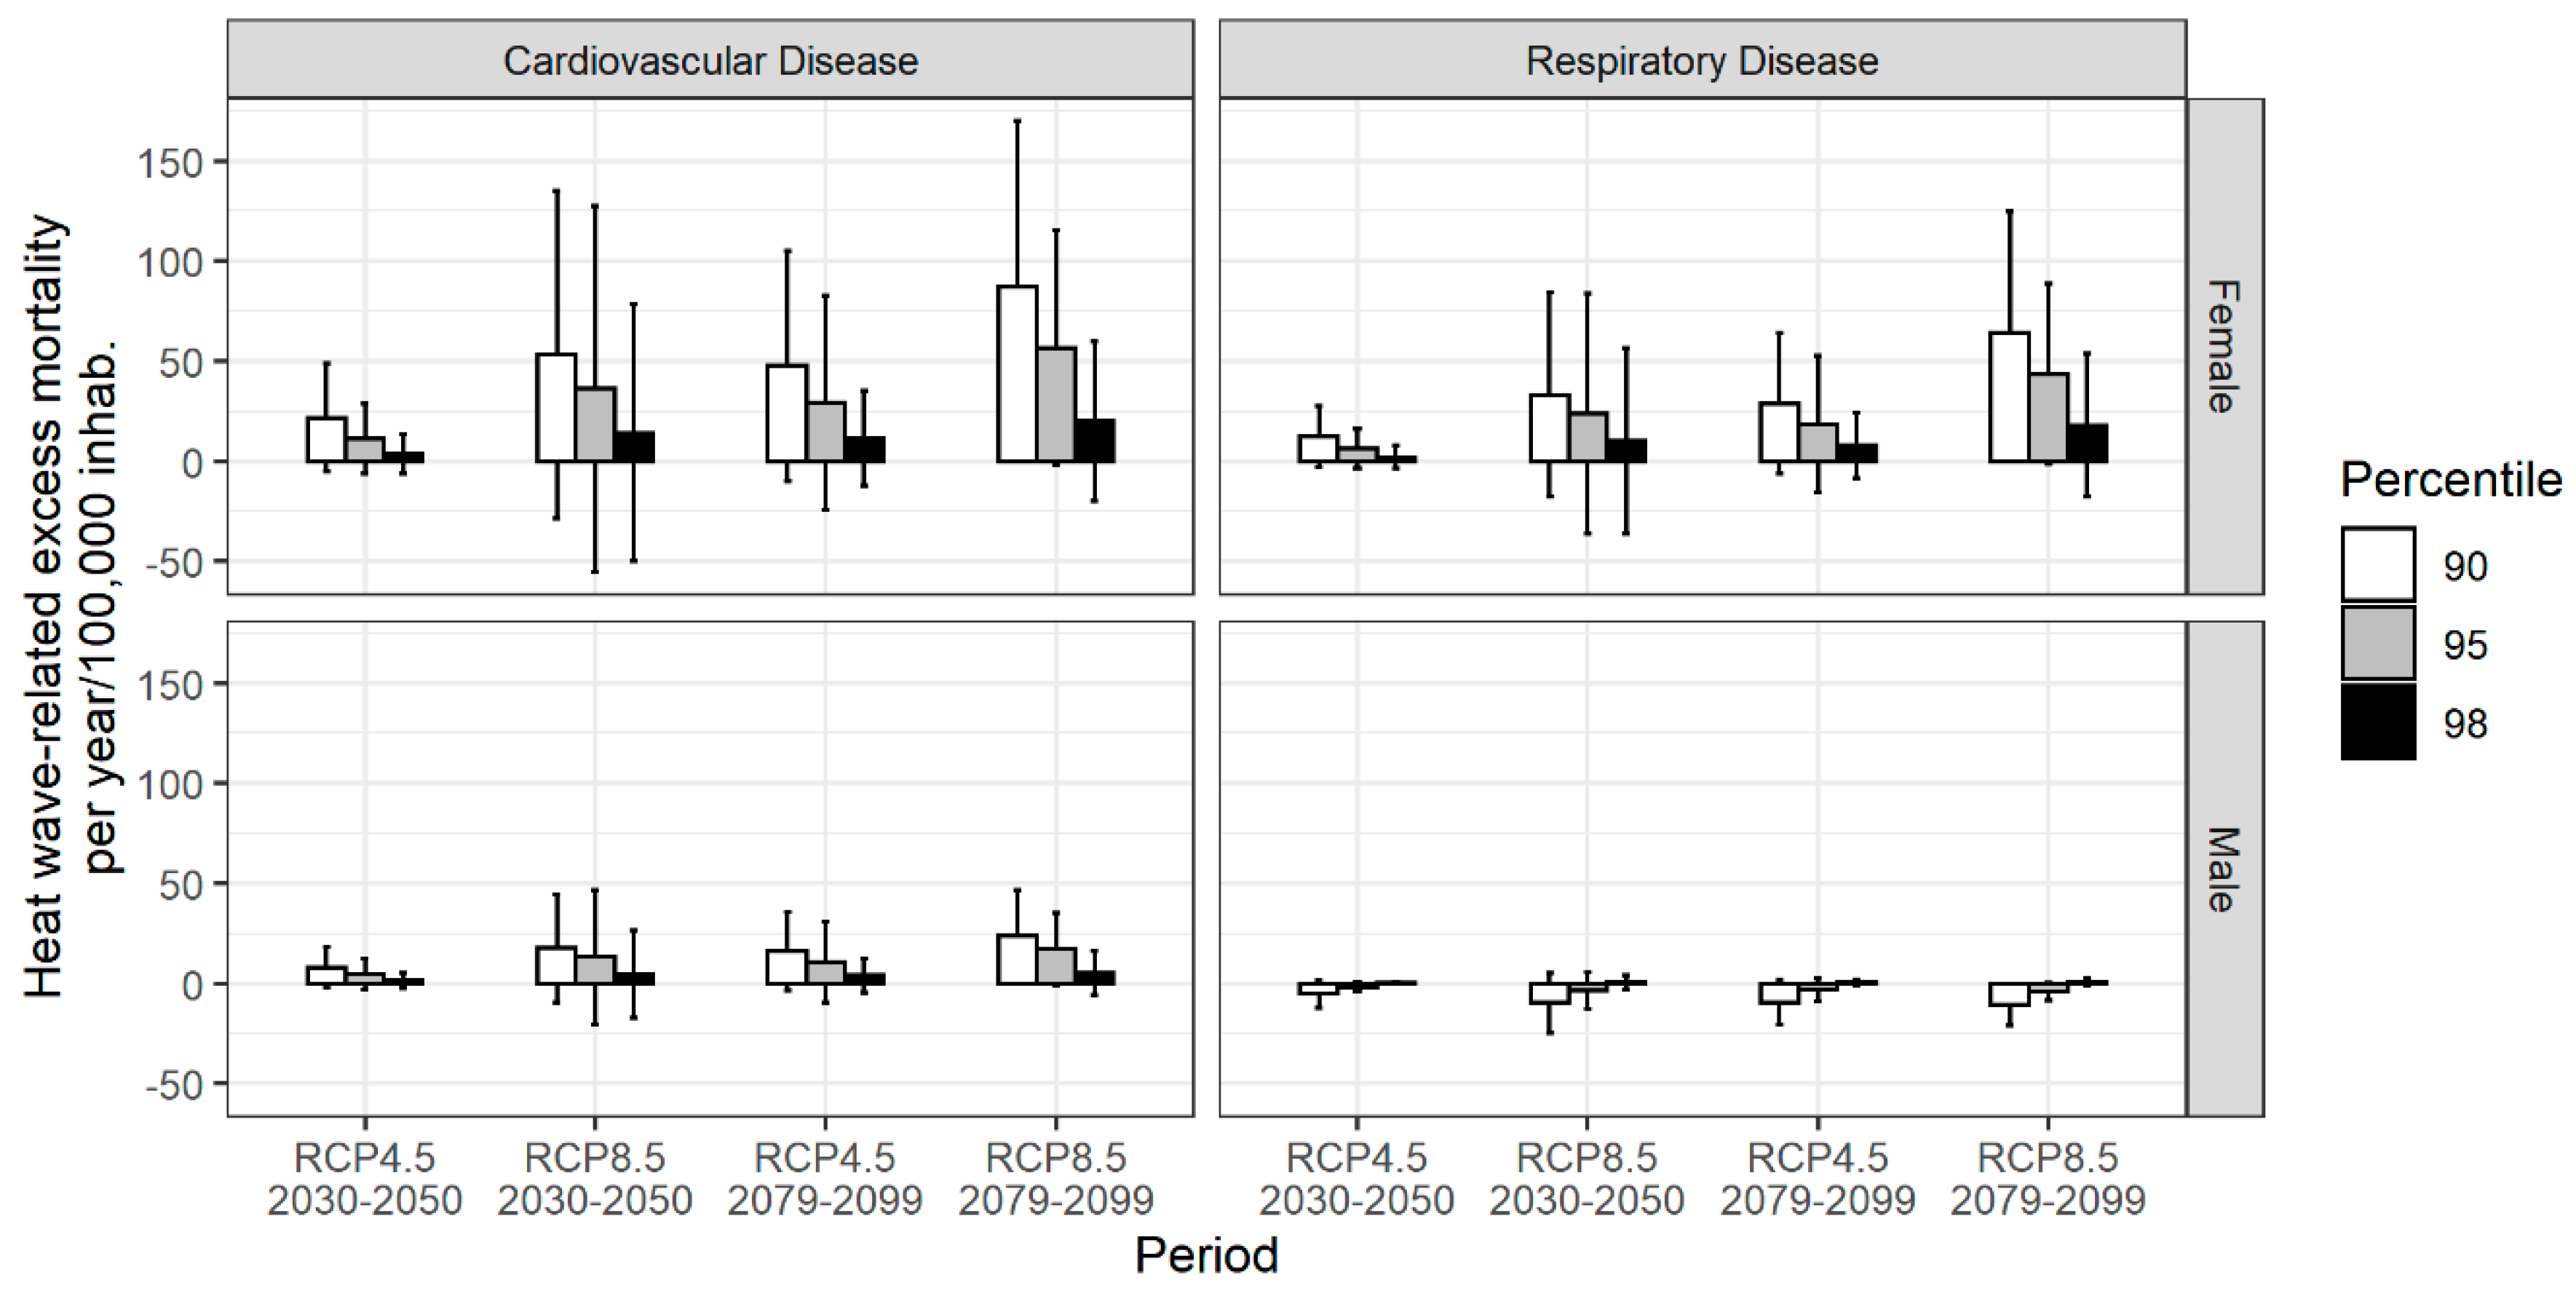
Considering only the main effects, Figure 3, Figure 4 and Figure 5 present the historical and projected heat wave-related annual excess mortality per 100,000 elderly inhabitants caused by cardiovascular and respiratory diseases and separated by gender. Figure 4 shows the annual excess mortality in the non-adaptation assumption and Figure 5 shows it in the adaptation assumption, for the future. The annual excess mortality was calculated considering the main effects of heat waves, due to increase in maximum temperature. The differences between the medians of the maximum temperatures in the historical period and future period (∆T) are present in Table S1.
In comparison to the historical period (Figure 3), if we do not allow any adaptation, heat wave-related excess of elderly mortality is expected to increase in the MRSP in both periods, but mainly in 2079–2099 (Figure 4). The RCP8.5 scenario is associated with a greater annual heat wave-related excess mortality than RCP4.5 scenario in the same period (Figure 4). The heat wave-related excess of elderly mortality will be higher for females than males from both cardiovascular and respiratory diseases. If we consider hypothetical adaptation to the 90th, 95th and 98th percentile maximum temperature, the heat wave-related excess of elderly mortality decreases in all periods and scenarios in comparison to non-adaptation assumption (Figure 5).

4. Discussion

The heat waves are associated with an increased risk of mortality in much of the world, mainly by cardiovascular and respiratory diseases [6,36,37]. According to the study by Song et al. [37], the mortality from respiratory diseases during heat waves increases by 93% in extreme cases of heat waves with the risks being highest for women. For Kenney et al. [38], in the elderly, the increased cardiovascular demand during heat waves is often fatal due to increased strain on an already compromised left ventricle. Peng et al. [39] studied 272 Chinese cities and found that heat waves could significantly increase risk for mortality from cardiopulmonary diseases.
In this study, we studied the influence of heat waves on elderly mortality due to respiratory and cardiovascular diseases in the MRSP, analyzing the historical situation and projections for the future considering climate change scenarios. In the historical analysis, our results suggest that most of the risk during heat waves is attributable to the increase in maximum daily temperatures, isolated or occurring with other hot days, the effect of which is greater than any additional effect [6]. The results show that the relative risks of mortality related to heat waves are highest in women in both diseases (Cardiovascular diseases: RR = 1.16, 95% CI: 1.08–1.24 and respiratory diseases: RR = 1.26, 95% CI: 1.12–1.40). The same is observed for the heat wave-related excess mortality in the historical and future period (Figure 4) in which the excess mortality is greater in elderly women than elderly men. Despite the relative risk being higher for elderly women with respiratory diseases, the projection of excess mortality in the future was higher for elderly women with cardiovascular diseases (Figure 4), this is because the mortality rate of elderly people (number of elderly deaths/elderly population) from cardiovascular diseases is greater than for respiratory diseases.
In relation to gender differences, our results are in agreement with the review study by Steen et al. [13] who analyzed studies of heat wave-related excess of elderly mortality in different regions of Europe. In the study by Steen et al. [13], elderly women were more vulnerable to heat waves than elderly men and the reasons can be diverse, such as: influences of age, biological differences and socio-cultural factors. As shown in Figure 1, the elderly female population in the MRSP is larger than the elderly male population, so the fact that women live longer than men makes them more vulnerable to heat waves, since aging is associated with increased mortality during these events [13,40]. Biological aspects also influence female vulnerability, since the ability to sweat and release heat is lower in elderly women due to low levels of physical conditioning, less capacity for acclimatization and a higher body fat percentage [13,40]. Another biological explanation is also found in hormonal changes and menopause that can adversely affect cardiovascular fitness and alter heat dissipation in elderly women [13,41].
In this study, future heat wave-related excess mortality was projected considering two assumptions, the first one that in the future the elderly will not adapt to the increased temperature, and the second that in the future, after adaptation interventions, these elderly people will be adapted to the new climate. Our projections show that in the future the number of annual heat wave-related excess of elderly mortality per 100,000 inhabitants will be higher than in the historical period for both non-adaptation and adaptation assumptions (Figure 4 and Figure 5). However, for the non-adaptation assumption, the number of annual mortality per 100,000 inhabitants will be much higher (on average 95 ± 149 deaths, varying more or less according to the scenario, disease, gender and period in the future (see Figure 4)). For the adaptation assumption, the number of annual mortalities will be on average one sixth of deaths of the non-adaptation assumption (Figure 5). In fact, this result is consistent because, with adaptation to the climate, the thermoregulatory system will be less sensitive to high temperatures and consequently the number of heat wave-related excess of elderly mortality caused by cardiovascular and respiratory diseases will be lower [42]. The study by Guo et al. [12] also showed that in the future there will be an increase in mortality related to heat waves in Brazil, especially in the case of non-adaptation to the climate, however Guo et al. [12] studied the influence of heat waves on all causes of mortality and all ages without distinction in different regions of the world, and our study focused on the mortality only of the elderly due to cardiovascular and respiratory diseases in the MRSP.
In Figure 3, Figure 4 and Figure 5 the heat wave-related excess mortality from respiratory diseases for elderly men increased only for the 98th percentile of the maximum temperature, because the relative historical risk only presented an increased risk for this percentile (Figure 3). Despite this, the relative risk is not significant, but we do not rule out the possibility of any clinical effect. Thus, it is noted that elderly men with respiratory diseases are impacted only by more intense heat waves, i.e., they are already more resistant to heat [13]. For this reason, with adaptation interventions in the future, mortality in this group tends to be zero, as shown in Figure 5.
Besides the uncertainly in the level of adaptation to climate change, other uncertainties such as the climate scenarios RCP4.5 and RCP8.5 were included in our study. In the case of non-adaptation to the climate, the annual excess elderly mortality due to cardiovascular and respiratory diseases was higher in the RCP 8.5 scenario, both in the near future (2030–2050) and in the distant future (2079–2099), than in the RCP4.5 scenario. The RCP8.5 scenario is the most pessimistic in relation to the emission of greenhouse gases and indicates the highest increase in air temperature in all climatic studies [29,43]. Studies have shown that in the future the mortality related to heat waves will be higher in the RCP8.5 scenario than compared to other climate change scenarios [12,39,44]. In the adaptation assumption, there is almost no difference between the scenarios.

5. Conclusions

The number of elderly people in the MRSP is increasing over time, and in the future, this population will double. This makes this study of great relevance to the MRSP, since the elderly in general have a weaker thermoregulatory system than the population as a whole, making them the most susceptible to increases in temperature, especially those with respiratory and cardiovascular diseases. According to the results of this study, in the future, due to climate change, there will be greater levels of heat wave-related mortality caused by cardiovascular diseases, especially in elderly women, in the non-adaptation assumption. Nevertheless, in order to reverse or minimize this scenario, adaptive measures by decision makers are necessary so that today’s youth are less vulnerable to the consequences of climate change in the future.

Supplementary Materials

The following are available online at https://www.mdpi.com/2073-4433/11/9/933/s1, Figure S1: Lag response curve for main effects of heat wave, Table S1: Difference between of median of maximum temperature in the historical period and future period (∆T), File 1 S1: Code R, File 2 S1: Observed data, File 3 S1: Population data; File 4 S1: Excess mortality data: Historical; File 5 S1: Excess mortality data: Non-adaptation; File 6 S1: Excess Mortality data: Adaptation.

Author Contributions

Conceptualization, F.R.D.; methodology, F.R.D.; data curation, F.R.D.; statistical analysis, F.R.D.; writing—original draft preparation, F.R.D.; writing—review and editing, F.R.D., F.L.T.G. and S.S.; visualization, F.R.D. and S.S.; supervision, F.L.T.G. All authors have read and agreed to the published version of the manuscript.

Funding

This research was funded by Sao Paulo Research Foundation—FAPESP (Process 2019/09879-1).

Acknowledgments

The authors would like to thank the Institute of Astronomy, Geophysics and Atmospheric Sciences of University of São Paulo for support in this study.

Conflicts of Interest

Authors declare no conflict of interest.

References

  1. Leite, J.C. Do mistério das eras do gelo às mudanças climáticas abruptas. Sci. Zudia 2015, 13, 811–839. [Google Scholar] [CrossRef] [Green Version]
  2. Oliveira, M.J.; Batista, G.M.M.; Carneiro, C.D.R.; Vecchia, F.A.Z. História geológica e Ciência do clima: Métodos e origens do estudo dos ciclos climáticos na Terra. Terræ 2015, 12, 3–26. [Google Scholar]
  3. IPCC. Climate Change 2014: Synthesis Report. In Contribution of Working Groups I, II and III to the Fifth Assessment Report of the Intergovernmental Panel on Climate Change; IPCC: Geneva, Switzerland, 2014; p. 151. [Google Scholar]
  4. Santos, J.O.; Santos, R.M.S.; Fernandes, A.A.; Souso, J.S.; Borges, M.G.B.; Ferreira, R.T.F.; Salgado, A.B. Os impactos produzidos pelas mudanças climáticas. ACSA 2013, 9, 9–16. [Google Scholar] [CrossRef]
  5. Robinson, P.J. On the Definition of a Heat Wave. J. Appl. Meteor. 2001, 40, 762–775. [Google Scholar] [CrossRef]
  6. Gasparrini, A.; Armstrong, B. The impact of heat waves on mortality. Epidemiology 2011, 22, 68–73. [Google Scholar] [CrossRef] [PubMed] [Green Version]
  7. Russo, S.; Dosio, A.; Graversen, R.G.; Sillmann, J.; Carrao, H.; Dunbar, M.B.; Singleton, A.; Montagna, P.; Barbola, P.; Vogt, J.V. Magnitude of extreme heat waves in present climate and their projection in a warming world. J. Geophys. Res. Atmos. 2014, 119, 12500–12512. [Google Scholar] [CrossRef] [Green Version]
  8. Astrõm, D.O.; Forsberg, B.; Rocklõv, J. Heat wave impact on morbidity and mortality in the elderly population: A review of recent studies. Maturitas 2011, 69, 99–105. [Google Scholar] [CrossRef]
  9. Guergova, S.; Dufour, A. Thermal sensitivity in the elderly: A review. Ageing Res. Rev. 2011, 10, 80–92. [Google Scholar] [CrossRef]
  10. WHO. World Health Organization. Available online: http://www.who.int/eportuguese/countries/bra/pt (accessed on 11 January 2020).
  11. Guo, Y.; Gasparrini, A.; Armstrong, B.G.; Tawatsupa, B.; Tobias, A.; Lavgne, E.; Coelho, M.S.Z.S.; Pan, X.; Kim, H.; Hashizume, M.; et al. Heat wave and mortality: A multicountry, multicommunity study. Environ. Health Perspect. 2017, 125, 1–11. [Google Scholar] [CrossRef] [Green Version]
  12. Guo, Y.; Gasparrini, A.; Li, S.; Sera, F.; Vicedo-Cabrera, A.M.; Coelho, M.S.Z.S.; Saldiva, P.H.N.; Lavigne, E.; Tawatsupa, B.; Punnasiri, K.; et al. Quantifying excess deaths related to heat waves under climate change scenarios: A multicountry time series modelling study. PLoS Med. 2018, 15, 1–17. [Google Scholar] [CrossRef]
  13. Steen, Y.V.; Ntarladima, A.; Grobbee, R.; Karsenberg, D.; Vaartjes, I. Sex differences in mortality after heat waves: Are elderly women at higher risk? Int. Arch. Occup. Env. Health 2019, 92, 37–48. [Google Scholar] [CrossRef] [PubMed]
  14. Nori-Sarma, A.; Anderson, G.B.; Rajiva, A.; Azhar, G.S.; Gupta, P.; Pednekar, M.S.; Son, Y.; Peng, R.D.; Bell, M.L. The impact of heat waves on mortality in Northwest India. Environ. Res. 2019, 176, 108546. [Google Scholar] [CrossRef] [PubMed]
  15. Royé, D.; Codesido, R.; Tobías, A.; Taracido, M. Heat wave intensity and daily mortality in four of the largest cities of Spain. Environ. Res. 2020, 182, 109027. [Google Scholar] [CrossRef] [PubMed]
  16. Lopes, R.J.; Fioravanti, C. Ondas de Calor: Mais Intensas, Longas e Frequentes. Available online: https://revistapesquisa.fapesp.br/ondas-de-calor-mais-intensas-longas-e-frequentes/ (accessed on 20 January 2019).
  17. Geirinhas, J.L.; Trigo, R.M.; Libonati, R.; Coelho, C.A.S.; Palmeira, A.C. Climatic and synoptic characterization of heat waves in Brazil. Int. J. Climatol. 2017, 38. [Google Scholar] [CrossRef]
  18. Guo, Y.; Barnett, A.G.; Tong, S. High temperatures-related elderly mortality varied greatly from year to year: Important information for heat-warning systems. Sci. Rep. 2012, 2, 830. [Google Scholar] [CrossRef] [Green Version]
  19. Pereira, R.H.M.; Carvalho, H.R.C.; Souza, P.H.G.F.; Camarano, A.A. Envelhecimento populacional, gratuidades no transporte público e seus efeitos sobre as tarifas na Região Metropolitana de São Paulo. Rev. Bras. Estud. Popul. 2015, 32, 101–120. [Google Scholar] [CrossRef] [Green Version]
  20. Wight, D.; Wimbush, E.; Jepson, R.; Doi, L. Six steps in quality intervention development (6SQuID). J. Epidemiol. Community Health 2016, 70, 520–525. [Google Scholar] [CrossRef] [Green Version]
  21. IBGE. Brazilian Institute of Geography and Statistics. Available online: www.ibge.gov.br (accessed on 20 January 2019).
  22. Kottek, M.; Grieser, J.; Beck, C.; Rudolf, B.; Rubel, F. World Map of the Köppen-Geiger Climate Classification Updated. Meteorol. Z. 2006, 15, 259–263. [Google Scholar] [CrossRef]
  23. Pell, M.; Finlayson, B.; Mcmahon, T. Updated World Map of the Köppen-Geiger Climate Classification. Hydrol. Earth Syst. Sci. Discuss. 2007, 11, 1633–1644. [Google Scholar] [CrossRef] [Green Version]
  24. DATASUS. Department of Informatics of the Brazilian Unified Health System. Available online: www.datasus.gov.br (accessed on 14 July 2019).
  25. Law nº 10741/2003: Brazilian Elderly Status. Available online: http://www.planalto.gov.br/ccivil_03/leis/2003/L10.741.htm (accessed on 10 January 2020).
  26. Meteorological Station of Institute of Astronomy, Geophysics and Atmospheric Sciences. University of São Paulo, Brazil. Available online: http://www.estacao.iag.usp.br (accessed on 5 June 2019).
  27. Projections of Climate Change for South America Regionalized by the Eta Model (PROJETA). Available online: https://projeta.cptec.inpe.br/ (accessed on 5 May 2019).
  28. Chou, S.C.; Lyra, A.; Mourão, C.; Dereczynski, C.; Pilotto, I.; Gomes, J.; Bustamante, J.; Tavares, P.; Silva, A.; Rodrigues, D.; et al. Evaluation of the Eta Simulations Nested in Three Global Climate Models. Am. J. Clim. Chang. 2014, 3, 438–454. [Google Scholar] [CrossRef] [Green Version]
  29. Lyra, A.; Tavares, P.; Chou, S.C.; Sueiro, G.; Dereczynski, C.P.; Sondermann, M.; Silva, A.; Marengo, J.; Giarolla, A. Climate change projections over three metropolitan regions in Southeast Brazil using the non-hydrostatic Eta regional climate model at 5-km resolution. Appl. Clim. 2018, 132, 663–682. [Google Scholar] [CrossRef]
  30. Zhang, L.; Zhang, Z.; Ye, T.; Zhou, M.; Wang, C.; Yin, P.; Hou, B. Mortality effects of heat waves vary by age and area: A multi-area study in China. Environ. Health 2018, 17, 54. [Google Scholar] [CrossRef] [PubMed] [Green Version]
  31. Siegel, J.S.; Swanson, D.A. The Methods and Materials of Demography, 2nd ed.; Elsevier Academic Press: San Diego, CA, USA, 2004; p. 835. [Google Scholar]
  32. United Nations World Population Prospects 2019. Available online: https://population.un.org/ (accessed on 14 April 2020).
  33. Curriero, F.C.; Heiner, K.S.; Samet, J.M.; Zeger, S.L.; Strug, L.; Patz, J.A. Temperature and mortality in 11 cities of the eastern United States. Am. J. Epidemiol. 2002, 155, 80–87. [Google Scholar] [CrossRef] [PubMed]
  34. Peng, R.D.; Bobb, J.F.; Tebaldi, C.; McDaniel, L.; Bell, M.L.; Dominici, F. Toward a quantitative estimate of future heat wave mortality under global climate change. Environ. Health Perspect. 2011, 119, 701–706. [Google Scholar] [CrossRef] [Green Version]
  35. R Development Core Team. R: A Language and Environment for Statistical Computing; R Foundation for Statistical Computing: Vienna, Austria, 2010. [Google Scholar]
  36. Campbell, S.; Remenyi, T.A.; White, C.J.; Johnston, F.H. Heatwave and health impact research: A global review. Health Place 2018, 53, 210–218. [Google Scholar] [CrossRef]
  37. Song, X.; Wang, S.; Li, T.; Tian, J.; Ding, G.; Wang, J.; Wang, J.; Shang, K. The impact of heat waves and cold spells on respiratory emergency department visits in Beijing, China. Sci. Total Environ. 2018, 1499–1505. [Google Scholar] [CrossRef]
  38. Kenney, W.L.; Craighead, D.H.; Alexander, L.M. Heat waves, aging, and human cardiovascular health. Med. Sci. Sports Exerc. 2014, 46, 1891–1899. [Google Scholar] [CrossRef] [Green Version]
  39. Peng, Y.; Renjie, C.; Lijun, W.; Cong, L.; Yue, N.; Weidong, W.; Yixuan, J.; Yunning, L.; Jiangmei, L.; Jinlei, Q.; et al. The added effects of heatwaves on cause-specific mortality: A Nationwide analysis in 272 Chinese cities. Environ. Int. 2018, 121, 898–905. [Google Scholar] [CrossRef]
  40. Kenney, W.L. A review of comparative responses of men and women to heat stress. Environ. Res. 1985, 37, 1–11. [Google Scholar] [CrossRef]
  41. Rosano, G.; Vitale, C.; Marazzi, G.; Volterrani, M. Menopause and cardiovascular disease: The evidence. Climacteric 2007, 10, 19–24. [Google Scholar] [CrossRef]
  42. Kondo, N.; Taylor, N.A.; Shibasaki, M.; Aoki, K.; Muhamed, A.M.C. Thermoregulatory Adaptation in Humans and Its Modifying Factors. Glob. Environ. Res. 2009, 13, 35–41. [Google Scholar]
  43. Kharin, V.V.; Zwiers, F.W.; Zhang, X.; Wehner, M. Changes in temperature and precipitation extremes in the CMIP5 ensemble. Clim. Chang. 2013, 119, 345–357. [Google Scholar] [CrossRef]
  44. Gasparrini, A.; Guo, Y.; Sera, F.; Vicedo-Cabrera, A.M.; Huber, V.; Tong, S.; Coelho, M.D.S.Z.S.; Saldiva, P.H.N.; Lavigne, E.; Correa, P.M.; et al. Projections of temperature-related excess mortality under climate change scenarios. Lancet Planet Health 2017, 1, e360–e367. [Google Scholar] [CrossRef]
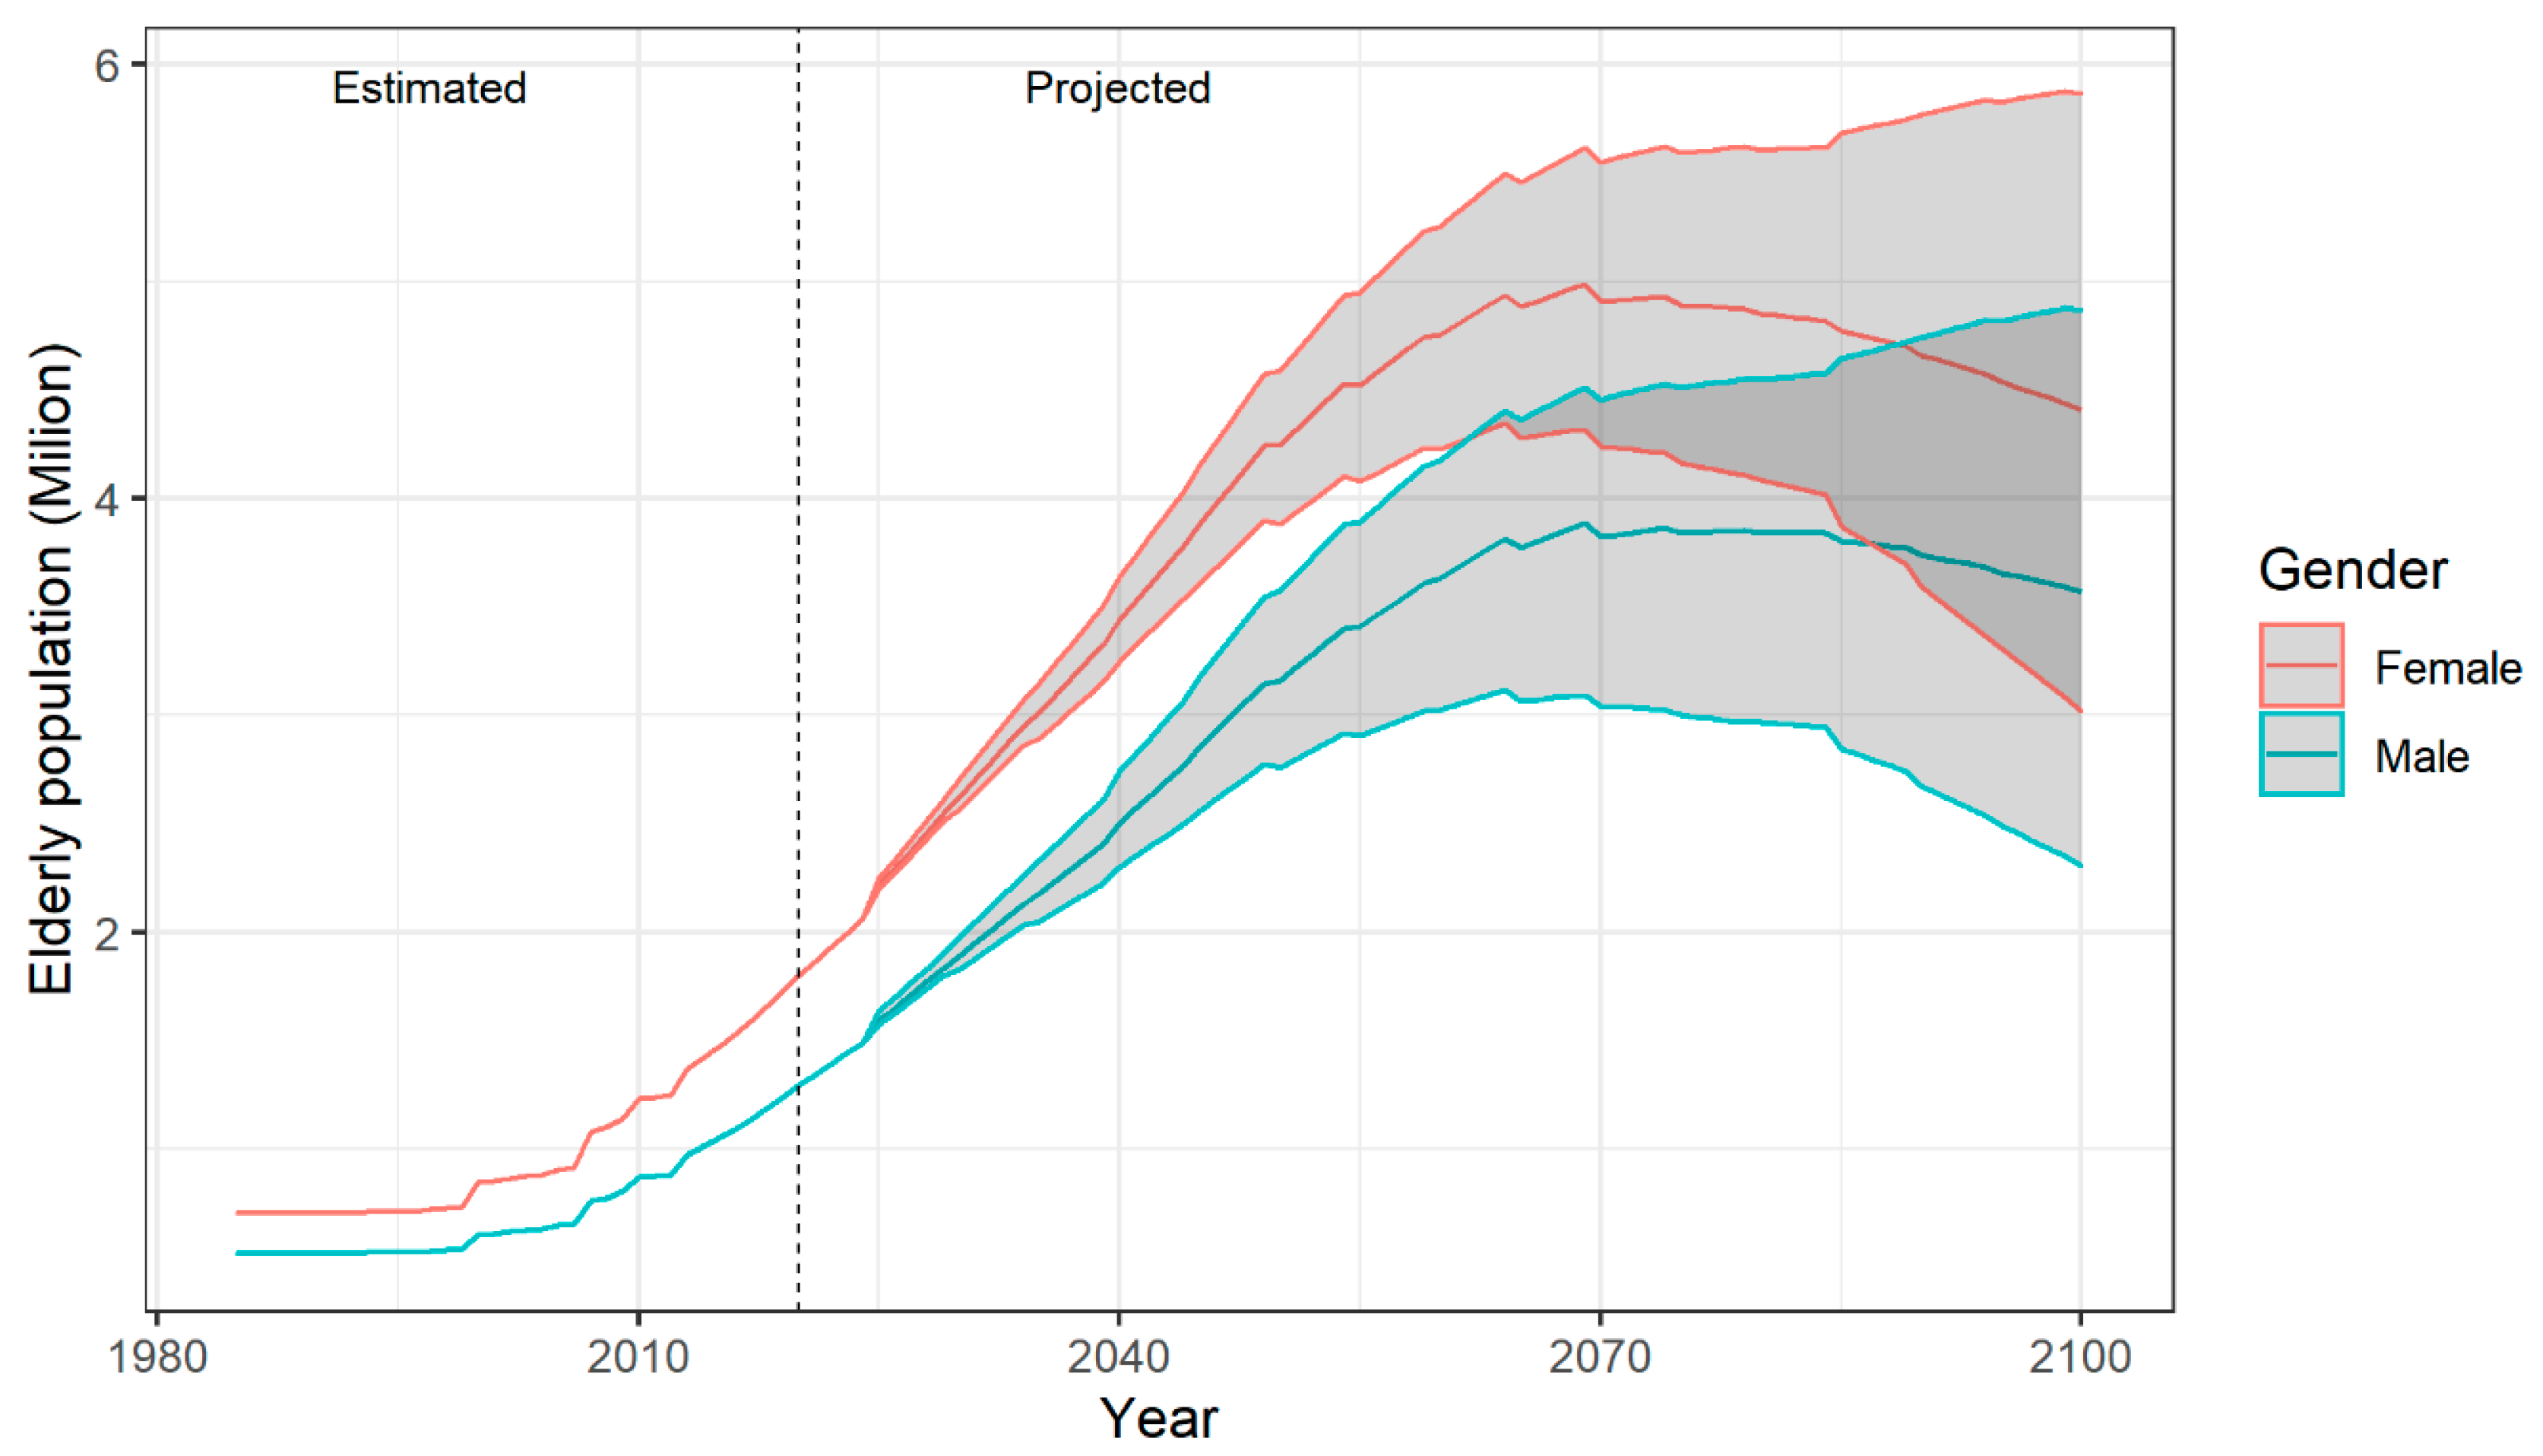
Figure 1. Elderly population in the Metropolitan Region of Sao Paulo (MRSP) by gender with the confidence interval of 95% (Shaded). The red color represents the female elderly population and the blue represents the male elderly population.
Atmosphere 11 00933 g001
Figure 2. Overall relative risk of heat wave-related mortality of elderly from cardiovascular and respiratory diseases by gender in the MRSP. Considering two contributions of heat: (a) Main effects and (b) Added effects. The different symbols represent the 90th, 95th and 98th percentiles of maximum temperature. The main effect is predict between the median maximum temperature among heat-wave days for each percentile 90th, 95th, 98th (33.6 °C, 34.4 °C and 35.15 °C, respectively) versus the 75th percentile of annual maximum temperature distribution (30.4 °C).
Atmosphere 11 00933 g002
Figure 3. Historical period (1985–2005): Heat wave-related excess mortality of elderly people per year in each 100,000 inhabitants from cardiovascular and respiratory diseases for female and male genders. The colors are percentiles of maximum temperature (90th, 95th and 98th).
Atmosphere 11 00933 g003
Figure 4. Heat wave-related excess mortality of elderly people per year in each 100,000 inhabitants from cardiovascular and respiratory diseases for female and male genders. Projections for near future (2030–2050) and distant future (2079–2099) under RCP4.5 and RCP8.5 climate change scenarios considering the non-adaptation assumption. The colors are percentiles of maximum temperature (90th, 95th and 98th).
Atmosphere 11 00933 g004
Figure 5. Heat wave-related excess mortality of elderly people per year in each 100,000 inhabitants from cardiovascular and respiratory diseases for female and male genders. Projections for near future (2030–2050) and distant future (2079–2099) under RCP4.5 and RCP8.5 climate change scenarios considering the adaptation assumption. The colors are percentiles of maximum temperature (90th, 95th and 98th).
Atmosphere 11 00933 g005
Table 1. Average annual characteristics of heat waves in the MRSP. (RCP: Representative Concentration Paths).
Case HistoricalPeriodScenarioHW (days)Duration (Days)Intensity (°C)
90th95th98th90th95th98th90th95th98th
1985–2005Model13 ± 124 ± 72 ± 36 ± 35 ± 24 ± 132.1 ± 1.432.5 ± 1.232.9 ± 1.2
Non-adaptation2030–2050RCP4.563 ± 3248 ± 3035 ± 287 ± 66 ± 66 ± 533.6 ± 1.834.2 ± 1.634.6 ± 1.5
RCP8.593 ± 4476 ± 4360 ± 428 ± 97 ± 87 ± 634.4 ± 2.534.9 ± 2.335.5 ± 2.1
2079–2099RCP4.5109 ± 4292 ± 4677 ± 4910 ± 126 ± 66 ± 534.8 ± 2.535.3 ± 2.335.7 ± 2.2
RCP8.5174 ± 27165 ± 28156 ± 2920 ± 2510 ± 1714 ± 1937.1 ± 3.437.4 ± 3.237.7 ± 3.1
Adaptation2030–2050RCP4.513 ± 164 ± 71 ± 46 ± 45 ± 44 ± 335.4 ± 1.836.5 ± 1.336.7 ± 1.1
RCP8.514 ± 175 ± 102 ± 46 ± 46 ± 34 ± 237.7 ± 2.038.9 ± 1.439.5 ± 1.3
2079–2099RCP4.514 ± 216 ± 142 ± 106 ± 55 ± 25 ± 238.4 ± 1.939.5 ± 1.840.1 ± 1.8
RCP8.510 ± 105 ± 51 ± 35 ± 24 ± 24 ± 242.0 ± 42.143.0 ± 1.743.9 ± 1.6