Abstract
In the Mediterranean region, climate change is likely to generate an increase in water demand and the deterioration of its quality. The adoption of precision viticulture and the best available techniques aiming at sustainable production, minimizing the impact on natural resources and reducing production costs, has therefore been a goal of winegrowers. In this work, the water footprint (WFP) in the wine sector was evaluated, from the vineyard to the bottle, through the implementation of a methodology based on field experiments and life cycle assessment (LCA) on two Portuguese case studies. Regarding direct water footprint, it ranged from 366 to 899 L/FU (0.75 L bottle), with green water being the most significant component, representing more than 50% of the overall water footprint. The approach used in the current study revealed that although more than 97.5% of the water footprint is associated with vineyard, the winery stage is responsible for more than 75% of the global warming potential indicator. A linear correlation between the carbon footprint and the indirect blue water footprint was also observed for both case studies. Climate change is expected to cause an earlier and prolonged water stress period, resulting in an increase of about 40% to 82% of blue WFP.
1. Introduction
The increasing demand for water and the pollution of freshwater resources, driven by urbanization, agriculture intensification and climate change, are the major concerns in the Mediterranean region. Climate change has a negative effect on this region and is expected to continue to have an adverse influence on the future environmental conditions [1]. The climate suitability for wine grapes’ cultivation is at greater risk than that of other crops due to both short-term climate variability and long-term climate changes [2]. In Portugal, significant trends for mean seasonal precipitation have decreased substantially in all seasons, excluding winter [3], and annual temperature has increased [4], which may intensify water demands. The increase in temperature combined with the decline in rainfall will raise irrigation water requirements, while water availability for irrigation will be lower [5]. In the South of Portugal, the thermal conditions and the water stress are causing the expansion of irrigated vineyards, now representing more than 50% of the cultivated area [6].
Considering that water is a limited resource, the concept of a water footprint (WFP) has gained interest in the scientific community. The WFP concept was developed by Hoekstra’s research group as an indicator that represents the freshwater resources needed to produce a unit of a product, corresponding to the volumetric measure of freshwater consumption and pollution impact [7,8]. Its calculation has been frequently done through the approach developed by the Water Footprint Network (WFN) through the water footprint assessment manual [8], where WFP is often represented as an aggregate number given by the sum of three water components: blue, green and grey water. Blue WFP refers to surface and groundwater resources that evaporate within the process, are incorporated into the product, returned to a different water body or water that does not return to the same water body in the same period. Green WFP corresponds to precipitation that is stored temporarily in the soil or remains on top of the soil or vegetation and, eventually, evaporates or transpires through plants. Grey WFP indicates the degree of freshwater pollution associated with each stage of the production process and is evaluated by the amount of fresh water needed to dilute one or more pollutants present in the return flow, so that, based on natural concentrations, a given water quality standard is achieved [8]. More recently, a new approach has emerged based on the life cycle assessment (LCA) methodology, which has framed the main concepts in the international standard on water footprint [9], in which water footprint is defined as “metric(s) that quantifies the potential environmental impacts related to water”. Both methodologies may include direct and indirect water use along supply chains and account for the consumption and degradation of freshwater, however they diverge in the way they deal with different water resources and water components, and in the approach of product sustainability [10]. The LCA methodology uses a large array of water footprint indicators, including those related to water scarcity, stress and quality, such as eutrophication, acidification and global warming or climate change [11].
The assessment of wine WFP from viticulture to the winemaking industry has been addressed by several authors (Table 1), in several regions and at different levels of temporal resolution, revealing the academy’s interest in this emerging topic. Although the water footprint concept was introduced as virtual water in 1997 by Allan [12], in the wine sector, most articles have been published in the last four years.

Table 1.
Reported studies on wine water footprint (WFP) determination.
Considering the countries of the New World, the first studies were observed in New Zealand, with WFP values between 667 and 860 L/FU (0.75 L bottle). In these case studies, the green water footprint represented 75–90% of the global WFP. In one of these studies, the authors analyzed only the direct, blue and green, water footprint, and found that about 91–92% of the WFP is related to the vineyard [14]. On the other hand, when they integrated direct and indirect water use, as well as the grey water footprint, they found that direct water use represented about 92–93% of the total WFP. Major variations were observed in the grey WFP, where authors reported values between 44 and 192 L/FU [15]. In California, a study carried out to evaluate the life cycle on wine grape production outlined important recommendations, such as the large effect that the productivity of the vineyards has on the observed variation between case studies [30]. The analysis of the wastewater from wineries throughout the production cycle was studied in Canada with the aim to determine the grey WFP in co-treatment at municipal wastewater treatment plants (WWTP). This study highlights that the vintage period was considered a hotspot as the wastewater quality levels could exceed regulatory requirements for WWTP discharges, even after treatment [31]. In Chile, the WFP was determined at four wineries, revealing WFP between 0.31 and 4.2 L/FU, with a variable distribution between the blue and grey WFP [16]. Civit et al. [17] provided information about the green and blue water footprint in five case studies in Argentina and found that the largest contribution was the blue water. This research highlighted pressurized irrigation systems in order to increase water use efficiency by 14%.
As far as the Old World wine countries are concerned, Italy has provided 40% of the reported studies on the water footprint in the wine sector. Two factors may contribute to this evidence: on the one hand, Italy is the country with the highest world wine production and, on the other hand, it is the only country in the world whose wine sustainability label is based on this indicator [32]. In Italy, wine WFP varied between 451 and 1193 L/FU, considering the winery and vineyard system as boundaries [21,25]. Most of the studies reported green WFP as the largest fraction of the global water footprint. Conversely, the ISO 14046 framework was followed in Spain, revealing that, in most vineyards, the blue water was the most important contributor to the overall water footprint, while the grey footprint was not evaluated [26].
In Portugal, the first study considering freshwater use in the wine chain was reported in 2014, but the results were inconclusive as they differed according to the method used and the impact category [10]. Other studies conducted in Portuguese wineries only considered the water consumption, characterizations of wastewater flows [33] or performed a sustainability evaluation of Portuguese wines based on the LCA methodology [34]. The impact of the wastewater treatment efficiency in the grey water footprint was recently assessed [27] but no holistic approach was given. The water footprint assessment was not evaluated at a wine farm level, regarding its temporal variability or its dependence on local factors.
In this study, an integrated methodology for water footprint sustainability analysis was developed to address the winery WFP of two Portuguese case studies located in Alentejo Region (NUTII), South of Portugal. The assessment of impacts and the identification of the most impactful processes in this sector are highlighted as hotspots, allowing to define adaptation strategies and thus overcoming the challenges of climate change related to water scarcity in the Mediterranean region. This study also aims at providing a useful tool for farmers, managers and decision-makers to support their decision on which management strategies should be adopted in order to improve wine chain sustainability.
2. Experiments
2.1. Case Studies
In the WineWATERFootprint Project, two case studies located in the South of Portugal were monitored with the purpose of assessing the WFP along the wine chain, at the level C of spatio-temporal resolution, which implies a monthly determination of water footprint components with primary data from the case studies, according to Hoekstra et al. [8], during 2017 and 2018. This study covered two wine growing regions (Lezíria do Tejo and Alentejo) under distinct climate conditions, which are exposed to extreme water scarcity and heat stress, and monitored the grapevine cultivar Tempranillo under surface drip irrigation. According to Köppen’s climate classification, the climate in both wine growing regions is temperate with dry and hot summer and wet winter—Csa [35]. For both locations, Figure 1 shows the monthly values for total precipitation, minimum temperature, mean minimum temperature, mean temperature, mean maximum temperature and maximum temperature, regarding the average of 1971–2000 years. In Figure 1, it is possible to observe that both places are characterized by hot and dry summers, with the precipitation occurring out of this season. When comparing both locations, case study II has higher maximum and mean temperatures, lower minimum temperatures and lower precipitation. Another relevant difference is the fact that case study I has a lower thermal amplitude due to a strong Atlantic influence. Case study I, located in Lezíria do Tejo wine region, has a production area of around 100 ha and a density of 3300 plants/ha in sandy soils, resulting in an annual average wine production of 612,000 L. The case study II (Alentejo Region), located in Alentejo wine region, has a production area of 210 ha and a density of 3000 plants/ha in clay soils, resulting in an annual average wine production of 1,100,000 L.
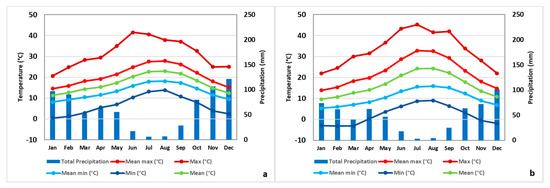
Figure 1.
Thirty-year (1971–2000) average temperature and precipitation for (a) case study I—Lezíria do Tejo and (b) case study II—Alentejo.
2.2. Methodology
In this study, two different approaches were adopted, regarding the methodology for WFP calculation: the methodology proposed by the Water Footprint Network for the quantification of the direct contribution for green, blue and grey water, based on direct data from the monitored case studies [8], and a cradle to gate LCA methodology for assessing in a broad way the wine sector sustainability and the various environmental impacts caused by wine production. The defined boundary conditions for both case studies were the vineyard and winery system, in a farm-winery model, with direct water assessment for vineyard and winery stage, following the WFN methodology. Regarding the sustainability assessment stage, direct and indirect water footprint were evaluated in order to achieve a more comprehensive analysis in the identification of hotspots.
With the use of both methodologies, it is expected to present a more complete discussion of the results, considering both direct and indirect water uses of the wine production and their overall impacts. In both approaches, the selected functional unit (FU) was a common wine bottle of 0.75 L.
2.2.1. Field Experiments in the Vineyard
According to Hoekstra et al. [8], the total WFP of a crop, namely at the vineyard (WFPtotal—Equation (1)) is the sum of the components green (WFPgreen—Equation (2)), blue (WFPblue—Equation (3)) and grey (WFPgrey—Equation (4)), usually in the case of agricultural products, expressed in m3·ton−1 or L·kg−1, with ETgreen (green water used on evapotranspiration), ETblue (blue water used on evapotranspiration) and PTwater (Phytosanitary Treatment water) in m3·ha−1 and the crop production (Yield) in ton·ha−1. PTwater refers to all the water used in phytosanitary treatments, comprising the washing of equipment.
The grey component of the WFP of a crop (WFPgrey—Equation (4)) was calculated from the total amount of the chemicals applied to the crop (Q), the leached fraction (α), the maximum permissible concentration (Cmax), the natural concentration of the product (Cnat) in the environment and crop production (Yield), through Equation (4), with Q in kg·ha−1, Cmax and Cnat in kg·m−3 and Yield in ton·ha−1. The pollutant selected for grey WFP calculation was nitrogen, in accordance with previous reported works [8,36]. Due to the impossibility of determining the leached fraction, it was assumed to correspond to 10% of the total nitrogen applied to the vineyard [36], the natural concentration of nitrogen was considered 0 kg·m−3 [8] and the maximum was 0.011 kg·m−3 according to Portuguese regulations [37].
Once the vineyard was submitted to a moderate water stress, for quality purposes, daily crop water use was estimated along all vegetative cycles according to the methodology proposed by Allen et al. [38], for the case of crop growth under non-optimal conditions. The FAO Irrigation and Drainage Paper No. 56 [38] method estimated the effect of climate on crop water requirements, considering the reference evapotranspiration (ETo) and the effect of the crop, by the crop coefficient (Kc). However, with this approach, the extrapolation of crop coefficients was not easy, mainly due to their dependence on management practices (distance between rows, soil cover, irrigation practices, etc.) [39]. According to Mekonnen and Hoekstra [13], the water stress coefficient Ks is calculated daily as a function of the maximum and actual available soil moisture in the root zone. However, the application of this methodology to perennial crops, such as vineyards, was especially critical due to their deep root systems which can reach several meters deep [40], making it difficult to monitor the available soil moisture as well as drainage and capillary flows. To overcome these limitations, we tried to improve the crop and stress coefficients’ estimates to optimize the crop water use calculations. A validation procedure was applied to the obtained results at different time scales (daily and whole season). The ETo was calculated according to the methodology of Allen et al. [38] using hourly meteorological data collected at the meteorological station located at both case studies.
Vineyard water use and daily evapotranspiration was estimated using the SIMDualKc [41], a software application for water balance computation and irrigation scheduling using the dual crop coefficient approach that was recently tested for sparse woody canopies [42]. This strategy seeks to more accurately estimate the impacts of factors such as the frequency of irrigation and precipitation. On the other hand, independent calculation of the two components of ETc (crop transpiration (T) and soil evaporation (Es)) allows aspects related only to T to be more correctly accounted for, such as the impact of water stress caused by low values of the matrix and osmotic potentials of soil water, important for grapevines, where deficit irrigation is mandatory. The SIMDualKc was fed with local meteorological data, observed dates of main developmental stages and total available soil water in the root zone (TWA, mm), estimated from the difference between the water content at field capacity (θFC m3·m−3) and at wilting point (θWP m3·m−3), multiplied by the rooting depth [m]. θFC and θWP were estimated from soil texture and bulk density. Crop height and width were measured in situ and basal crop coefficients (Kcb), namely the Kcb ini, Kcb mid and Kcb end, were estimated from functions of Vegetation Indexes (VI). Two VI were used in the (Equation (5)) Soil-Adjusted Vegetation Index (SAVI) and (Equation (6)) Normalized Difference Vegetation Index (NDVI) [43].
The NDVI (Equations (7) and (8)) and SAVI data were calculated at the vineyard scale from the spectral data of Sentinel-2 (European Space Agency) imagery obtained during the grapevine growing cycle, from red and near infra-red (NIR) bands using a correction factor (L) depending on vegetation densities. An L value of 0.5 was assumed, as is commonly used for vineyards [44]:
Kcb = 1.79 × SAVI − 0.08
Kcb = 1.44 × NDVI − 0.1
NDVI = (NIR − red)/(NIR + red)
SAVI = [(NIR − red)/(NIR + red) + L] × (1 + L)]
The SIMDualKc performance was evaluated comparing Ks estimated by the model with Ks derived from predawn leaf water potential measurements (Ypd), according to the stress function (Equation (9)), obtained for the same grape variety and under similar conditions [45].
Ks = 1.0011 exp (1.829 Ypd), r2 = 0.73
Finally, the adjusted crop evapotranspiration under non-standard conditions (ETc adj) was calculated from Equation (10), multiplying the basal crop coefficient by the water stress coefficient.
ETc adj = (Ks Kcb + Ke) ETo
Using a randomized design, 5 plants were selected in both case studies for crop parameters’ evaluation. The leaf area was measured during the growing cycle, according the methods and models proposed by Lopes and Pinto [46]. The field observations also include the fortnightly measurement of the pre-dawn leaf water potential (Ypd) from the beginning of June to the end of August, in two mature leaves per plant, using a pressure chamber. The yields of the vines were determined, and the pruning wood was weighted. A water meter, installed in selected vineyard rows, measured the irrigation water volumes, and the soil water content was continuously monitored using capacitance-based technology (EnviroSCAN, Sentek Sensor Technologies) from a 0.20 to 1 m depth.
In order to predict the effect of climate change on the water footprint of the vineyard, a simulation was made with the SimDualKc model [41] considering the A1B scenario defined by Jacob et al. [47]. The A1B scenario foresees, for the 2071–2100 period, an increase of 3.6 °C in the average temperature [47] and a statistically significant reduction of the mean seasonal precipitation of 40% in spring and autumn and 50% in summer [3]. Basal crop coefficients were assumed to be similar to those verified during this study.
The direct blue and grey water footprint components were determined monthly at the winery, following the methodology defined by Hoekstra et al. [8]. Beyond the determination of the wineries blue and grey water footprint, a diagnosis was performed on the implemented water use efficiency practices with the objective of correlating the impacts identified in the water footprint sustainability assessment with winery practices. This diagnosis was performed through observation (gemba walks) and a questionnaire. The questionnaire was developed from the literature [48,49] and adapted to the context of the target wineries. The questions comprised: (i) facility water use practices in process, cleaning, rinsing and sanitation, cooling and heating, restrooms and kitchens, landscaping and outdoor, (ii) leak-detection and repair, (iii) water reuse and (iv) capture and reuse of rainwater. The quality of the water used in the winery was also evaluated, according to Standard Methods [50].
The direct blue WFP of the product was determined by the sum of the blue WFP of each wine production process divided by the total amount of wine produced, according to Equation (11):
For each wine production process, the blue WFP components: water evaporation, water incorporation and return flow, were calculated according to Equation (12):
WFproc,blue = BlueWaterEvaporation + BlueWaterIncorporation + LostReturnflow [volume/time]
Since there is no incorporation of water in the product, this component is therefore considered to be nonexistent. Lost return flow accounts for the water that does not return to the natural water body in the same period of its usage and was therefore considered. This allows the simplification of Equation (12) once the blue water footprint component is only related with the evaporation occurring along winery activities and water that does not return to the natural water body, resulting in Equation (13):
WFproc,blue = BlueWaterEvaporation + LostReturnflow [volume/time]
Regarding the determination of BlueWaterEvaporation, the evaporation from the wastewater treatment plants was determined according to Penman [51], while evaporation inside the winery was considered negligible. The LostReturnflow was determined considering that it corresponds to the amount of water used for winery activities minus the amount of discharged and evaporated water, therefore representing the water that was collected but that did not evaporate or returned to the natural water body in the same period that it was used.
Regarding direct grey WFP, the produced wastewater and the efficiency of the treatment system were determined along the two years of monitoring. The physical-chemical analysis of the wastewater allowed the evaluation of the treatment efficiency and the determination of the limiting parameter used for grey WFP calculation. The pH, electrical conductivity, total suspended solids, chemical oxygen demand, biochemical oxygen demand, total nitrogen, polyphenols and total phosphorous were monitored, according to Standard Methods [50]. For accurate characterization of the wastewater and treatment efficiency, samples were collected at the reception pit (before treatment process) and treatment plant (treated effluent) twice a week during vintage and fortnightly or monthly in the rest of the year.
The grey WFP was determined by the total amount of water that is necessary to assimilate the load of pollutants based on natural background concentrations on the environment and water quality standards, according to Equation (14), with pollutant load (L) in grams, maximum allowed concentration (Cmax) in g·L−1 and the natural concentration (Cnat) in g·L−1.
The pollutant selected for grey WFP calculation corresponds to the pollutant that required the highest dilution volumes, according to its concentration on the discharged wastewater and the maximum allowed concentrations, according to Portuguese regulations. The assimilation capacity of the receiving water body has influence on grey WFP and was evaluated by the difference between the maximum allowable discharge concentration and the natural concentration of the concerned substance.
Wine production comprises different stages, which are grouped into harvest, post-harvest and bottling. Since in many wineries they take place in parallel, it becomes difficult to segregate flows across different production processes. To overcome this obstacle, the water consumption in the wineries was monitored in real time by a water meter, developed by the EddyHome Company. This solution not only collects water consumption data in real time, but also integrates features that enable data analysis and remote water cut, in case of leaks.
2.2.2. Sector Sustainability Assessment and Life Cycle Assessment Approach
Regarding the sustainability assessment of the wine production WFP, it was decided to follow the methodological framework defined by the ISO 14046 standard that reflects the conceptual structure of the LCA: goal and scope, inventory analysis, impacts assessment and interpretation. The system under study was limited to the vineyard and winery (winemaking + bottling + packing) stages, but also included many other indirect (upstream and downstream) processes such as energy production, fertilizer production and transport between packaging production (bottles, boxes and corks), wine production and distribution to the consumer, as shown in Figure 2.
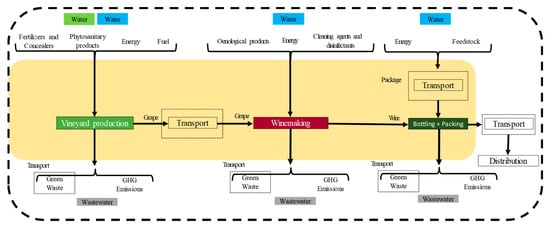
Figure 2.
Main processes in wine production and its most relevant inputs and outputs.
Regarding the life cycle inventory for the WFP of wine production, a survey using questionnaires was conducted to collect primary data from both the production of grapes in the vineyard and the production of wine in the wineries. These primary data were the initial source of information for the WFP inventory. When needed, other scientific research was considered as a source for inventory data [22,52].
Data collection is a significant and sensitive part of the assessment, mainly due to the difficulty in obtaining primary data in situ. Companies may often omit or change some important information in fear of legal actions or of losing proprietary information. Therefore, care should prevail in the interaction with the organizations and in the analysis of the data at this stage of the LCA.
The vineyard questionnaire was divided into: (i) general information about the vineyard, (ii) soil management practices, (iii) green management practices, (iv) irrigation system, (v) fertilization and correction, (vi) production control and pest management (phytosanitary products), (vii) pruning, (viii) grape harvest, (ix) energy consumed, (x) water consumption, (xi) maintenance of vehicles and other equipment, (xii) transport, (xiii) information on wastewater and (xiv) climate information. Regarding wine production in the winery, the questionnaire was separated into: (i) general characteristics of the winery, (ii) energy consumption, (iii) water consumption, (iv) use of cleaning agents and disinfectants, (v) oenological products, (vi) filling, labeling, packaging, palletizing and storage, (vii) information on wastewater, (viii) waste produced and (ix) maintenance of equipment used.
The main difficulty was to obtain accurate answers, including disaggregated data for each stage of the process. Once collected, data were validated against literature data, technical studies or by professionals in the area. Additionally, further validation has been carried out including mass balances, energy balances and/or comparative analysis of emission factors. Thus, values that do not fulfil the validation criteria were rejected, assuming null values or replacing with values from the literature [53].
For this WFP study, GaBi Professional Software (Thinkstep) was used to estimate the direct and indirect consumption of the WFP.
Finally, from an impact assessment perspective, the WFP profile was compiled for water consumption in each process and some environmental impact categories were addressed, calculating indicators concerning water consumption. For this same step, indicators were used to address both midpoint (single factors) and endpoint (multiple integrated factors).
Life cycle impact assessment (LCIA) builds on data from the product life cycle inventory, to address the impacts through specific environmental categories and indicators. There are several environmental impact categories that can be associated to wine production’s water footprint. In this study, we highlighted the following indicators: blue water, water scarcity index (WSI), acidification, eutrophication and global warming potential. Water scarcity index is calculated based on the local freshwater withdrawal/availability rate, and is often used as a characterization factor to assess water consumption in LCA and water footprint studies (Table 2). Characterization factors were based on the methodology proposed by the CML 2001 model [53] and updated to the 2016 data [54]. CML 2001 [53] is an impact assessment method that restricts quantitative modeling to early stages (midpoint categories) in the cause–effect chain to limit uncertainties.
Table 2.
Impact categories for quantitative and qualitative assessment of water consumption for wine production.
3. Results
3.1. Water Footprint in the Vineyard
Accumulated vineyard evapotranspiration and its components, estimated by the SIMDualKc model, are presented in Figure 3 for two very different years (2017 and 2018) at case study I (Lezíria do Tejo Region) and at case study II (Alentejo Region), the hottest and driest Portuguese wine region.
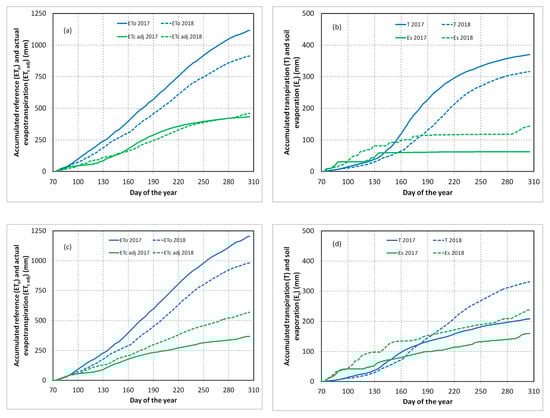
Figure 3.
Accumulated reference (ETo), actual evapotranspiration (ETc adj), transpiration (T) and soil evaporation (Es) at case study I (a,b), and at case study II (c,d), estimated by the SIMDualKc model for the vegetative cycles of 2017 and 2018.
When comparing the vegetative cycle in different years, for case study I, a reduction in ETo of about 200 mm was observed in 2018 due to cooler conditions and increased rainfall (98 and 231 mm during the vegetative cycle in 2017 and 2018, respectively), as observed in Figure 4. However, ETc adj was slightly higher in 2018 and, despite a slight decrease of T (17% higher in 2017), a significantly higher Es was verified (2.3 times greater in 2018). The same tendency was observed in case study II for ETo, with a reduction of 224 mm in 2018, due to the same reasons (117 and 332 mm during the vegetative cycle in 2017 and 2018, respectively), as observed in Figure 5. Nevertheless, in case study II, ETc adj presented significant differences in both years, with a T about 35% lower in 2017 than in 2018. This can be explained by the higher irrigation frequency in 2017, with lower amounts of water added each time, once, in 2018, the irrigation strategy was changed (lower frequency and higher irrigation amounts). Therefore, 56% and 25% of irrigation water was lost by evaporation from the soil surface during 2017 and 2018, respectively. When comparing the two different locations, it could be observed that the amount of rainfall during the vegetative cycle was higher in the driest region in both years (48% and 140% of normal values for 2017 and 2018, respectively). In case study I, rainfall during the vegetative cycle was 34% and 80% of 30 years average values for 2017 and 2018, respectively. Despite differences in absolute values, there was only a 7% reduction in ETo among case studies in both years.
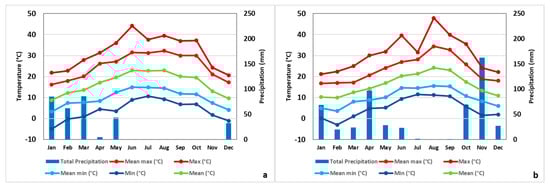
Figure 4.
Meteorological conditions at case study I—Lezíria do Tejo region for (a) 2017 and (b) 2018.
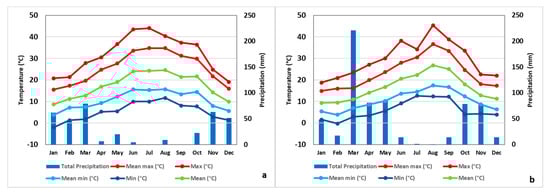
Figure 5.
Meteorological conditions at case study II—Alentejo region for (a) 2017 and (b) 2018.
Since deficit irrigation strategies are generally adopted for grape quality reasons [56,57], it is important to evaluate the water stress intensity. An important output of the SIMDualKc model is the stress coefficient (Ks), estimated at the daily scale. Therefore, this model could be a useful tool to evaluate the irrigation management, particularly in situations of deficit irrigation. Due to differences in rainfall and irrigation amounts, both the intensity of stress and the beginning of the stress period differed (Figure 6), being more severe and occurring earlier in 2017, as expected. In particular, at case study II, the stress intensity was excessive, reaching an average Ks of 0.2 during the maturation period, with minimum Ks of 0.13 before harvest. When comparing different locations, an earlier and faster decrease in Ks at case study II was observed, despite the fact that greater rainfall occurred at this location. This may be due to the smaller readily and total soil available water of this site, 58 and 115 mm respectively, and an inefficient irrigation management.
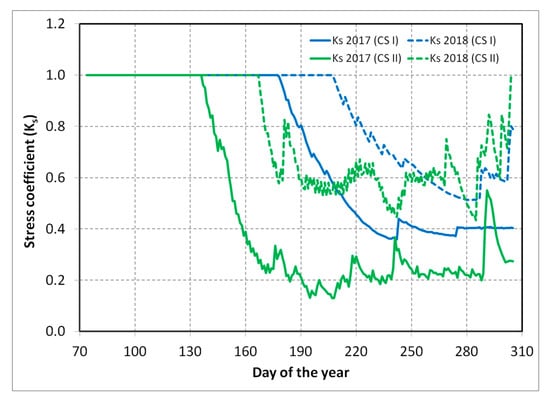
Figure 6.
Seasonal evolution of stress coefficients, estimated by the SIMDualKc model, at case study I and II, during the vegetative cycles of 2017 and 2018.
The suitability of the irrigation strategy followed can also be assessed by soil evaporation, in particular, that associated with irrigation, since a strategy with a higher number of irrigations (with a correspondent lower volume) would contribute to a higher water volume content at soil’s top layers, resulting in a higher soil evaporation. At case study I (sandy soil with a high hydraulic conductivity), the irrigation frequency was weekly and irrigation water lost by evaporation was about 8% in both years. At case study II (clay soil), the irrigation was carried out every two days with lower water amounts and around 56% and 25% of irrigation water was lost by soil evaporation in 2017 and 2018 respectively, contributing to a less efficient use of irrigation water. One can conclude that the model is capable of evaluating the irrigation scheduling, providing useful information to the farmer, supporting their decision based on predicted crop water stress.
For evaluation of SIMDualKc performance, in particular during the irrigation period, Ks were estimated by the model and then compared with Ks estimated by stress functions based in the predawn leaf water potential (data from case study I and both years) and a good correlation (r2 = 0.82) was found between the two estimates (Figure 7), which confirms the model suitability to estimate the induced stress by irrigation management and, at the same time, predict yield losses based on ETcadj assessment.
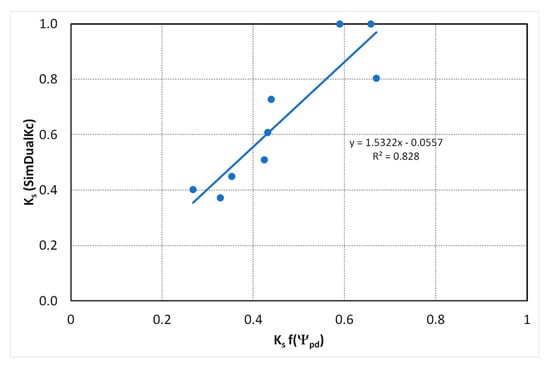
Figure 7.
Relationship between Ks derived from stress function obtained for Tempranillo variety and Ks calculated by the SIMDualKc. Data from case study I (2017 and 2018).
The monthly determination of grey WFP was performed for both years of monitoring and case studies (Figure 8 and Figure 9). For the determination of grey WFP, it was assumed that irrigation did not contribute to the leaching of nitrogen once the applied irrigation corresponded to a deficit irrigation that makes water percolation below root zone unlikely. The leached nitrogen was therefore considered to be proportional to the amount of rain throughout the year.
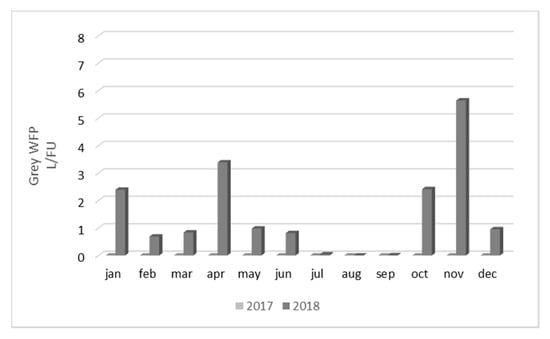
Figure 8.
Grey water footprint regarding case study I—Lezíria do Tejo region, for both monitoring years.
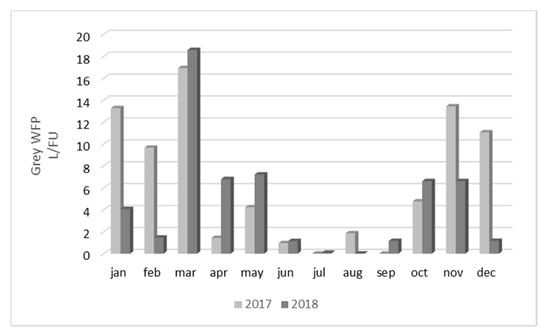
Figure 9.
Grey water footprint regarding case study II—Alentejo region, for both monitoring years.
Regarding case study I (Figure 8), in 2017, the grey WFP was not considered because no fertilizers were applied to the vineyard in the previous four years (including 2017) and, therefore, no residual nitrogen available to leach and cause grey WFP was assumed. In 2018, the grey WFP calculation was performed for every month and ranged from 0 L/FU, in months with no precipitation, to 5.65 L/FU in November, which corresponds to the month with the highest observed precipitation.
Regarding case study II (Figure 9), grey WFP calculation was performed for every month and ranged from 0 L/FU, in months with no precipitation, to 18.59 L/FU on March 2018, which corresponds to the month with the highest observed precipitation and, therefore, nitrogen leaching. In 2017, the determined grey WFP was 77.64 L/FU and in 2018, it was 54.96 L/FU. This corresponds to a decrease of about 29%, when comparing both years, and is mainly due to the higher production of 2018 since the nitrogen applied and leached fractions were the same.
Overall grey WFP accounts for about 4.6% of vineyard WFP, in case study I, and 8.7% and 7.1% of vineyard WFP in case study II, regarding 2017 and 2018, respectively.
Similar WFP were found in both years at case study I but, at case study II, a higher WF was found in 2017 due to two main reasons: very low yield and very high irrigation water applied (Table 3). In both case studies, the most relevant component of vineyard WFP was the green, representing on average 84% and 60% of the vineyard WFP respectively, for case study I and II. The blue WFP component is the second most relevant with an average of 13% and 32% of the vineyard WFP respectively, for case study I and II.
Table 3.
Vineyard direct water footprint components for case study I and case study II, in 2017 and 2018.
Regarding the effect of climate change on the water footprint, the simulation performed for the A1B scenario resulted in a strong increase in stress coefficients as well as in the vineyard blue WFP. This translates into an increase of blue WFP of about 40% in case study I and 82% in case study II, on average, resulting in a predicted increase of 5% and 22% of wine WFP respectively, for case study I and II. As the main consequences of this scenario, the following can be highlighted:
- An increase in accumulated ETo (during the vegetative cycle) of around 160 mm for case study I and 230 mm for case study II.
- An earlier (28 days for both cases) and prolonged water stress period.
- An increase in the intensity of stress coefficients: Ks will be 0.10 and 0.16 smaller at case study I and II, respectively.
- An increase of blue WFP of about 40% in case study I and 82% in case study II, on average, resulting in a predicted increase of 5% and 22% of wine WFP, for case study I and II, respectively.
3.2. Water Footprint in the Winery Stage
Direct blue water footprint was determined monthly through the estimation of the water evaporation and lost return flow. In Figure 10 and Figure 11, blue water footprint values throughout the year are shown, for case study I and II, respectively. For case study I, the comparison between the two years demonstrates that the cooler conditions and higher rainfall occurred in 2018, which led to a small decrease in evaporation and had no effect in blue WFP reduction. In fact, an increase of around 37% in blue WFP due to an august heatwave was verified, that induced an abnormal evaporation, and resulted in a decrease in production of around 30% (Figure 10).
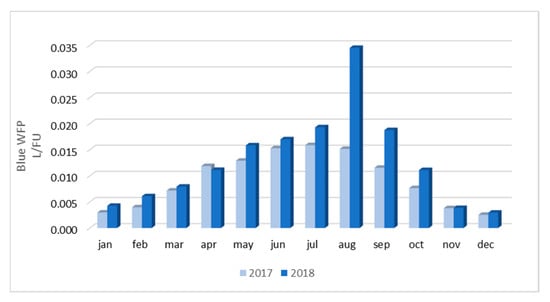
Figure 10.
Blue water footprint regarding case study I—Lezíria do Tejo region, for both years of monitoring.
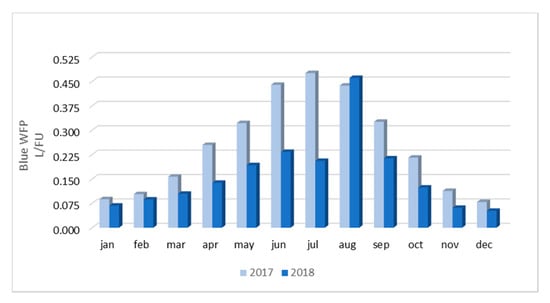
Figure 11.
Blue water footprint regarding case study II—Alentejo region, for both years of monitoring.
Regarding case study II, the results were different from case study I once, beyond the reduction of evaporation, an increase of around 35% in wine production resulted in a reduction of 42% of blue water footprint. This is easily observed in Figure 11, where a significant reduction of blue WFP is noticeable, when comparing 2018 with 2017. The only month which this pattern did not occur was August, as the same heatwave reported for the case study I caused an abnormal increase in evaporation and consequently, in blue WFP. The observed reduction in blue WFP was accomplished due to both the increase of 35% in wine production and the higher water use efficiency observed at the winery in 2018.
Overall, direct blue WFP ranged from 0.11 to 0.15 L of water per FU in case study I and 3.26 to 1.90 L of water per FU in case study II, regarding 2017 and 2018, respectively.
Regarding direct grey WFP, each case study presented a different situation. Case study I has a treatment system that allows the reutilization of the treated water, during vineyard irrigation periods, and the discharge at the natural water body, in the rest of the year. Case study II has a treatment system composed by evaporation lagoons that results in a zero discharge system. Grey WFP calculation was performed considering the chemical oxygen demand (COD) as the limiting pollutant once it was found as the pollutant that required the highest dilution volumes, according to its concentration at the treated effluent and maximum allowed discharged concentration. According to Portuguese legislation (DL 236/98) [58], the maximum allowed discharge concentration for the COD is 0.15 g·L−1, while the natural concentration was assumed to correspond to 0.00 g·L−1.
For case study I, the monthly value of grey WFP was determined considering the amount of effluent discharged and its characteristics (Figure 12). From May to October, there was no grey WFP once during this period, the effluent was used in vine irrigation (diluted with fresh water, with a final concentration of less than 2%), and was therefore considered as vineyard blue WFP.
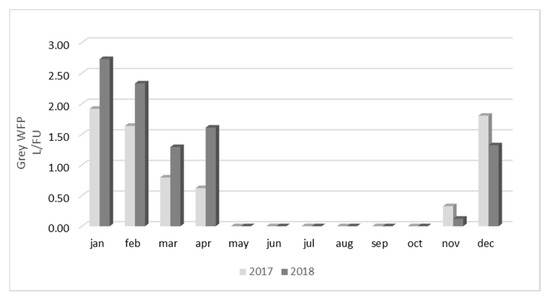
Figure 12.
Grey water footprint regarding case study I—Lezíria do Tejo region, for both years of monitoring.
Overall, direct grey WFP was 7.10 and 9.40 L of water per FU, regarding 2017 and 2018, respectively. When comparing winery grey WFP with the overall grey WFP, it is possible to verify that winery grey WFP corresponds to around 34% of the total grey WFP of wine production, for case study I and 2018. This means that winery grey WFP cannot be disregarded and that reduction measurements should be implemented whenever possible.
Regarding case study II, there was no determined grey WFP since there is no discharge of wastewater to the natural environment. The treatment system of case study II is composed by evaporation lagoons with an operative capacity that allows no discharge of effluent across the year. The water used in winery operations is therefore accounted in blue WFP once it will evaporate. This type of treatment system will produce an environment impact when, in the future, the retained solid particles are removed and disposed, but this process is outside the scope of this study and is therefore not accounted for.
When comparing vineyard and winery blue WFP, it is possible to verify that winery blue WFP corresponds to less than 1% of vineyard blue WFP, for case study I, and less than 1.5% of vineyard blue WFP for case study II (Table 4). This means that blue WFP reduction measures will have a greater impact on wine WFP if they are implemented on the vineyard, which does not take away the importance of the efforts that should be performed also at the winery. Overall, from the analysis of Table 4, it is possible to observe that vineyard stage of wine production has the highest impact on wine WFP, with higher values in all WFP components, and accounting for more than 97.5% of wine WFP.
Table 4.
Direct water footprint components for case study I and case study II, in 2017 and 2018.
3.3. LCA Indicators and Water Footprint Sustainability
In order to address the unsustainable use of global freshwater resources, many indicators are needed to better understand the impacts of production systems, their consumption patterns and to present a more transparent analysis. In the next sections, the main results related to the water availability LCA indicators are shown.
3.3.1. Indicators for Water Scarcity Assessment
Table 5 shows blue water footprint and Water Scarcity Index for both case studies calculated by the LCA methodology, considering direct and indirect WFP. Despite the differences between both indicators, Water Scarcity Index, based on withdrawal-to-availability ratio, followed a similar pattern to that found for blue water footprint. This indicator incorporates regional water stress characterization factors, taking into account water availability, use and seasonal/annual variation in precipitation. As expected, the results on blue WFP, obtained with the LCA approach (considering both direct and indirect blue water), were higher than those obtained with the WFN methodology (considering only direct blue water). The identification of the vineyard stage as the most impactful regarding the blue WFP component is consistent in both methodologies.
Table 5.
Wine water footprint components for both case studies and 2018.
In the vineyard stage, irrigation was the process that most influenced both indicators. In the winery stage, cleaning processes are those that contributed the most to the blue water footprint and WSI, representing 77.9% and 75.8% for case study I and case study II, respectively.
To complement the previous results, the relative contribution of different processes linked to the winery stage chain is also displayed (Figure 13). As we can see, cleaning process is the most relevant, but indirect processes have a weight of 43.6% for case study I and 32.5% for case study II.
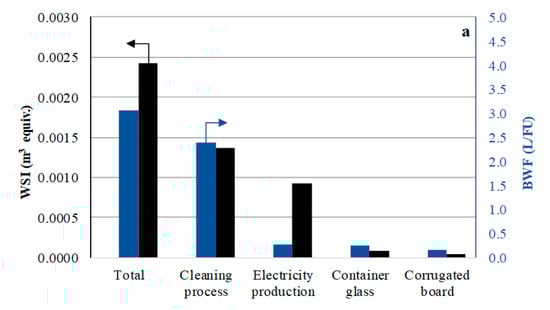
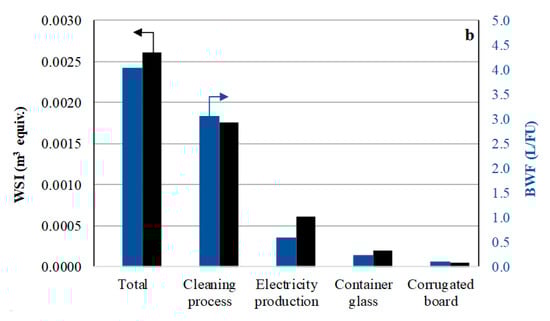
Figure 13.
Total blue water footprint (BWF) (■), water scarcity index (WSI) (■) and contribution of the different processes linked to the winery stage for (a) case study I and (b) case study II.
3.3.2. Indicators for Water Footprint Profile Assessment
Concerning the environmental impacts categories, Figure 14 shows the main results for acidification and eutrophication potential, including the contribution of the different processes of the wine production chain for both impact categories.
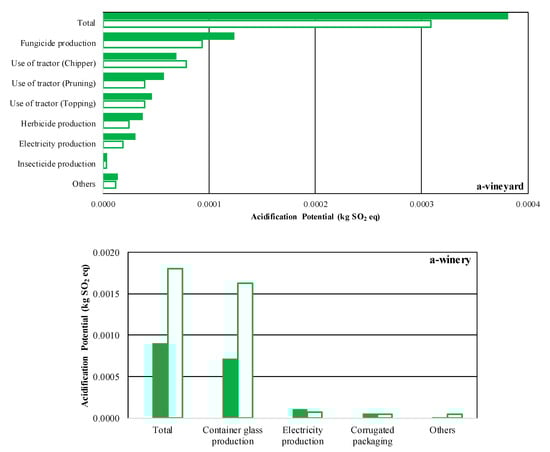
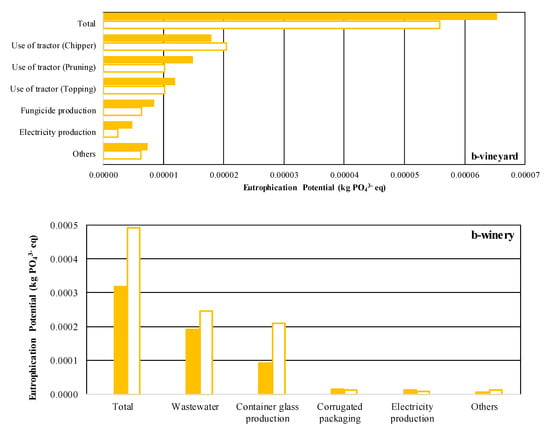
Figure 14.
Total results for the potential for (a) acidification and (b) eutrophication for the vineyard and winery stages in case study I (filled bars) and case study II (unfilled bars).
The total impact estimated for acidification was 1.28 g SO2 eq for case study I and 2.11 g SO2 eq for case study II. The impact on eutrophication was 0.38 and 0.55 g PO43− eq, for case study I and case study II, respectively.
Both case studies showed similar behaviors regarding the contribution of the processes to the acidification and eutrophication categories, highlighting the high contribution of indirect processes belonging to the winery stage. Production of glass bottles, a process indirectly linked to wine production, was identified as an important source of both impacts. The wastewater was the most relevant for eutrophication but had little effect on acidification.
With regard to vineyard, the consumption of fuels by agricultural machinery and the production of chemicals (pesticides and fungicides) were the main contributors for both impact categories. The relative contributions of both processes for acidification were 45.1% and 41.5% respectively, for case study I, and 50.8% and 39.2% respectively, for case study II. NOx emissions from fuel combustion were responsible for approximately 47% and 62% of the impacts of the acidification potential for the vineyard. In relation to eutrophication, interventions by tractors and the production of fungicides accounted for approximately 70% and 12% of the total impact, respectively.
The total magnitude of Greenhouse Gases (GHG) emissions was about 0.29 and 0.43 kg CO2 eq for case study I and II, respectively. In both cases, wineries have higher contributions than vineyards, about a factor of two for case study I and a factor of four for case study II. CO2 was the pollutant that most contributed to the global warming potential for production in both systems. The emissions of this pollutant were mainly due to the use of tractors in the vineyard, production of electricity, production of raw materials (e.g., pesticides, glass bottles, packaging) and the transport involved.
The results for this indicator can also be separated by processes that are directly and indirectly linked to the wine production chain. In this sense, in the present study, the impact due to upstream or downstream production processes was estimated at 93.1% (case study I) and 95.8% (case study II). The indirect processes included within the system boundary were the production of electricity, the production of pesticides and the production of raw materials, among others.
On average, the vineyard caused a total emission of 0.07 kg CO2 eq, to the global warming potential (0.08 kg CO2 eq corresponding to case study I and 0.06 kg CO2 eq to case study II), as shown in Figure 15. The processes that produced the greatest impacts on the vineyard were production of pesticides interventions with tractors and power generation. The vineyard of case study II is a more significant source of GHG.
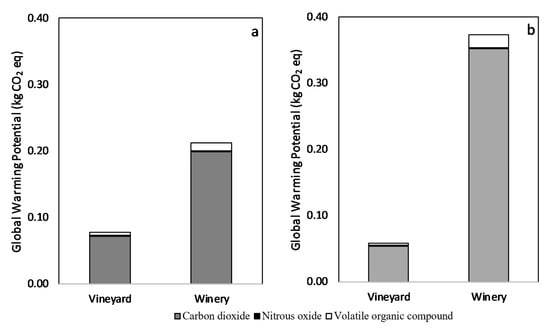
Figure 15.
Total results for carbon footprint in the vineyard and winery and the main pollutants for (a) case study I and (b) case study II for the year 2017.
The contribution of the winery stage (see Figure 16) for the total global warming potential was about 75% and 85% for case study I and case study II, respectively. In this stage, wine bottling and packaging processes represent about 50% for case study I and 75% for case study II of the total impact.
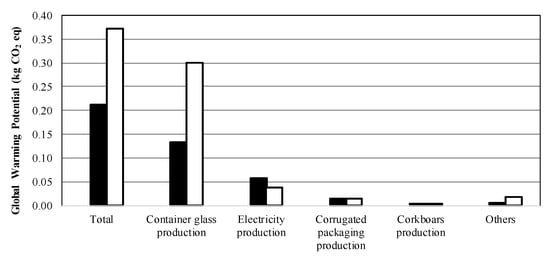
Figure 16.
Global warming potential values for the winery. Note: case study I (closed bars) and case study II (open bars) for the year 2017.
The correlation between carbon and water footprint was also investigated. Figure 17 shows a comparison between indirect blue water footprint (vineyard + winery) and global warming potential for the different processes involved in the wine production chain.
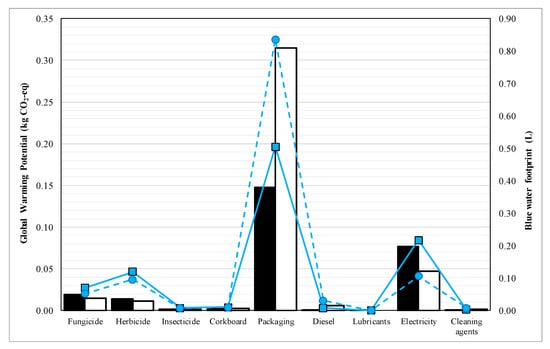
Figure 17.
Global warming potential (bars) versus blue water footprint (lines) for wine production in case study I (closed bars and solid line) and case study II (open bars and dashed line).
For the two case studies, there was a trend and a correlation between both indicators, demonstrating that when a process has a higher blue water footprint, it also has a higher contribution to global warming.
A linear correlation between the global warming potential (carbon footprint) and the indirect blue water footprint can be observed for both case studies in Figure 18. The results showed a good correlation for both case studies, with 97.2% and 99.3% for case study I and case study II, respectively. The values indicate a direct proportionality between the indicators for the processes involved.
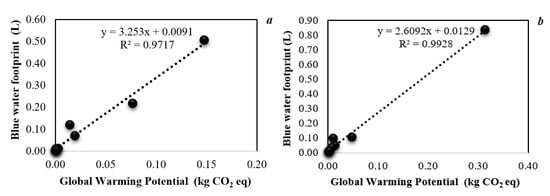
Figure 18.
Correlation between global warming potential and indirect blue water footprint for (a) case study I and (b) case study II.
4. Discussion
This study is an important improvement on previous work as it brings WFP calculation to the farm level, with case studies, giving more reliable data instead of assumption data from a regional point of view. This type of level C assessment allows the identification of constraints or hotspots that would not be noticeable at regional or national levels.
4.1. Direct Water Footprint in the Vineyard
The evaluation of WFP at the Mediterranean Basin, where the effects of climate change will be most pronounced [59], require accurate estimations of evapotranspiration (ET) and its components (T and Es). The validation of tools that allow the assessment of the sustainability of wine grapes’ production are therefore crucial for improving water management practices [60].
The FAO 56 methodology is recommended for evapotranspiration estimation [39]. Two calculation approaches can be used: the single and the dual crop coefficient approach. For row crops such as vineyards, soil surface has a determinant impact on energy balance and water status. Therefore, Es and T must be considered separately when predicting vineyard water requirements [61]. In this work, we followed the second approach using the SIMDualKc model [42]. This model has been used for annual crops [41,62] and wine grapes [63] and was able to estimate both Es and T based on a soil water balance simulation. By segregating ETc into both components, it is possible to better assess the irrigation management in terms of beneficial water use (T) and water losses (Es). Basal crop coefficients (Kcb) used in the SimDualKc Model, namely the Kcb ini, Kcb mid and Kcb end, were estimated from functions of Vegetation Indexes (VI). In fact, a correlation was found between the crop coefficient curve and the satellite-derived vegetation index, indicating the potential for modeling a crop coefficient as a function of the vegetation index [64]. This approach is particularly useful when applied at the irrigation sector level. Therefore, this information is greatly appreciated by the end users and can be provided in an easy-to-use manner and in near-real-time by using the improvements achieved with Geographic information Systems (GIS) [65]. The VI applied in this work (NDVI and SAVI) are the most commonly used VI to estimate actual Kc and Kcb [66], with SAVI being more adequate to evaluate the increase of high LAI (NDVI saturation problems) and NDVI more sensitive to soil background reflectance changes due to the moisture of the soil surface.
Another issue is the quantification of water stress intensity due to the deficit irrigation applied, once, in this situation, grapevine stomatal control assumes an important role on crop transpiration and accurate stress coefficients (Ks) are needed to quantify the impact of stomatal closure on actual ET. The SIMDualKc model features this capability to estimate crop stress induced by water shortage and, for vineyards, this proves to be a useful tool to assess the impacts of deficit irrigation strategies, aiming at quality improvement.
As referred to in the results, the most relevant component of vineyard WFP was the green followed by the blue. The distribution of ET water by the green and blue components is directly linked with the climate of the region. In this study, case study II presented a higher proportion of blue water use, in comparison with green, since it is located in the hottest and driest region of Portugal.
In the vineyard, it is common to determine grey WFP based on nitrate, which is widely considered as the major pollutant, but the use of this indicator as a regulatory police decision is not straight forward as it could lead to a conservative estimate of grey WFP in case there is a more problematic nutrient or pesticide. The most critical pollutant should therefore be identified in each case [19]. On grey WFP calculation, it was decided to follow the methodology of Hoekstra et al. [8], and therefore, considering that the natural concentration of nitrogen was 0 kg·m−3, this may result in an underestimation of vineyard grey WFP. Regarding vineyard activities, climate change is expected to strongly impact the wine production. The observed warming over the last fifty years in wine regions worldwide has benefited some regions by creating more suitable conditions while others have been challenged by increased heat and water stress [2]. That is the case of the two wine regions under study and assuming the A1B scenario, defined by Jacob et al. [47]. In fact, if the goal of the winegrower is to produce quality grapes, we can expect an increase of around 40 mm in irrigation water for both cases, with 83 and 300 mm being the total irrigation water to apply during the vegetative cycle, to case study I and II, respectively.
However, it is important to highlight that heat stress can also have important detrimental impacts in berry composition, in particular at the primary and secondary metabolites level, such as total acidity, aroma precursor profiles and phenolic composition [67,68], severely challenging the ability to produce quality wine. The number of expected days with maximum daily temperatures above 40 °C, for the period 2070–2100 used in the A1B scenario, will be about 15 for study I and 30 for case study II, with the absolute maximum temperatures approaching 50 °C. This increase in maximum temperatures will have a negative impact on photosynthesis and sunburn risks. Also, the cool night index (CI), an index developed as an indicator of night temperature conditions during maturation and strongly related with vintage quality (sugar, color, aroma) [69], will shift to the class of warm nights (>18 °C), reaching 18.6 and 20.2 °C, at case studies I and II, respectively.
4.2. Direct Water Footprint in the Winery
At the winery, WFP is related to the equipment and practices used, as well as the treatment efficiency of the wastewater treatment plant. Regarding grey WFP, usually the main component of WFP at the winery stage [27,70], it was noticeable that it has a high dependence on the wastewater treatment system, as well as its proper maintenance and management.
In case study I, there is an aerobic wastewater treatment system that allows its reuse in vineyard irrigation from May to November. During this period, the treated wastewater is incorporated into the irrigation system and used for vineyard irrigation, being accounted as vineyard blue WFP, while in the rest of the year, it is discharged into the water body. If the water quality standards are not met, this discharge will lead to a pollutant load and consequent grey WFP. Some authors considered that winery grey WFP was nonexistent or almost nonexistent [14,20,28], while other authors consider that winery grey WFP exists [16] and may be the most important component, if compared with the overall value of winery WFP [27,31,70]. For both monitored years, the grey WFP component was responsible for more than 98% of winery WFP, as was also observed by Pina et al. [70]. Regarding the blue WFP, and since there is no incorporation of water, the accounting is only for the evaporation of water in the wastewater treatment plant, which is almost insignificant given the low superficial area of the treatment system [10,21,27]. Overall, and when considering both monitored years, blue WFP corresponded to about 1.6% of winery WFP. An increase of 32% of winery WFP was also observed from 2017 to 2018 and was mostly related to the observed decrease in production (around 30%) that was caused by the atypical meteorological conditions of 2018.
In case study II, there is no grey WFP, in light of the typology of the treatment system. The existing treatment system consists of evaporation lagoons that allow the wastewater produced to be stored throughout the year without being discharged into the natural water body. In this case study, the water is evaporated in the lagoon (blue WFP), being dependent on the area of the lagoon and the atmospheric conditions. This means that blue WFP accounts for all the water used in winery activities, either considering evaporated water or the lost returned flow (when water is not evaporated but remains stored in the evaporation lagoons). Overall, winery WFP ranged from 3.3 L/FU in 2017 to 1.9 L/FU in 2018, corresponding only to blue WFP since there is no grey WFP component in case study II, as previously mentioned. The reduction of 42% in winery WFP was caused by the implementation of measures regarding water use efficiency combined with the higher wine production observed. In fact, the increase in wine production allowed a more efficient use of winery equipment that resulted in a decrease of around 28% of the annual water consumption while still increasing the wine production by 35%.
Regarding winery activities, climate change is not likely to produce significant changes in winery WFP due to its low dependence on meteorological conditions. Although it is expected to contribute to higher blue WFP, due to higher evaporation, blue WFP only represents less than 1% of wine WFP and its contribution will therefore be negligible.
Nevertheless, the assumptions used in the calculation of the water footprint present some weaknesses, since this methodology does not consider water consumption, but rather the transformation of fresh water into grey water. As the grey water calculation is done through the pollutant load (kg/day), this means that a winery that uses the best available practices regarding water use efficiency may have the same grey WFP value as other wineries that do not care about water use efficiency, as long as they produce the same pollutant load and work a similar amount of grapes. The authors consider that the introduction of a correction factor that considers the water consumption indexes of each winery would be an improvement for WFP calculation according to the WFN methodology.
4.3. Water Footprint Sustainability Assessment
As mentioned earlier, the water footprint sustainability assessment was based on water scarcity footprint and some of the most used LCA environmental impact categories. In general, based on two case studies of the Portuguese wine sector, it was possible to identify the most impactful processes for the environment (hotspots).
The blue water footprints obtained in our study were slightly lower than those obtained in other research, however, according to other studies, we can infer that there is still a margin to reduce the consumption and/or improve the efficiency of water use [14,19].
With regard to the contribution of viticulture to the environmental impacts, fuel consumption by agricultural machinery and the production of chemicals (fungicides and pesticides) were the most relevant processes, as found by Villanueva-Rey et al. [26]. This fact is a consequence of intensive mechanized agriculture that will need more environmentally friendly technological advances to make the sector environmentally sustainable or to increase the level of sustainability.
The contribution of wineries to acidification and global warming environmental impacts are mainly due to upstream or downstream processes, whose contribution was respectively estimated at around 92% and 81%, while for eutrophication, the direct processes presented a slightly greater contribution compared to indirect processes.
The indirect processes included within the system border were the production of electricity, the production of raw materials, the production of glass bottles and cardboard packaging. The results related to the acidification impact category were similar to those reported by Villanueva-Rey et al. [70] who reported values in the range of 0.60 to 5.04 g SO2 eq. In another study carried out in the region of Galicia (Spain), for a period from 2000 to 2009, Villanueva-Rey et al. [26] estimated values for acidification between 1.14 g SO2 eq (in 2004) and 3.25 g SO2 eq (in 2008). In relation to eutrophication, Villanueva-Rey et al. [71] obtained values ranging from 0.17 to 2.29 g PO43− eq for three different viticulture techniques implemented in Ribeiro (Spain).
In what concerns the global warming impact category, the results were within the lower range reported in the literature estimated by cradle to the gate LCA methodologies, in which the interval varies between 0.26 and 1.92 kg of CO2 eq [72]. Borsato et al. [25] estimated a contribution of 96.5% for upstream and downstream processes. The contribution of the winery stage for the global warming potential is similar to that reported by Fusi et al. [73] with a 56% contribution form bottling and wine packaging. For Iannone et al. [74], the winery was also the stage that most contributed to global warming potential.
The linear relationship between the indirect blue water footprint and carbon footprint show some complementarity between both concepts. Linearity was also found in other studies for carbon footprint and water footprint indicators. Bonamente et al. [21] reported correlation coefficient values of 90% and 92%, also indicating a good correlation between the two indicators. Rinaldi et al. [22] showed lower values, with a correlation coefficient between 70% and 73%. Although there are also differences between both concepts, since a carbon emission in one place can be offset by carbon emission reduction or sequestration in another place, one cannot reduce the local impact of water use in one place by saving water in another place. Reducing water footprint of a product, process or service can be part of any business environmental strategy aiming at reducing the carbon footprint. In general, the results showed that reducing water consumption and improving water use efficiency will introduce benefits in water availability and the environment.
4.4. Strategies to Mitigate Water Footprint
Efforts towards sustainability can be achieved throughout the different phases of the production process. With regard to viticulture stage, although the environmental impacts are a consequence of the mechanization of an increasingly intensive agriculture, it is possible to introduce more eco-efficient practices, such as establishing targets for the reduction of phytosanitary and fossil fuels. Results obtained from scenario analysis involving 10% reduction in the use of phytosanitary products and 20% of fossil fuels used in agricultural machinery showed environmental gains in all categories, especially in acidification and eutrophication potential, with a reduction of up to 30%. Other strategies leading to environmental gains at the vineyard stage can involve the use of biodiesel in agricultural machinery during operations [75], as well as technological changes in all agricultural machinery. Also, the predicted strong impacts of climate change will force other adaptation measures, in particular for case study II. Among them, we can highlight modifications in plant material (grapevine varieties, clones and rootstocks), vineyard management techniques (grapevine architecture, canopy management, rows orientation, shade nets, harvest dates, vineyard floor management, timing of harvest and irrigation) or site selection (altitude, aspect and soil water-holding capacity) [76]. As verified in this study, irrigation management techniques may have a significant impact on water loss and correspondent WFP. In case study II, the changes introduced in irrigation scheduling and duration (2018 year) allowed a 55% reduction on the amount of irrigation water loss by evaporation.
In relation to the winery, the aim of implementing best production practices is also to ensure a high level of environmental protection as a whole [77]. Although the wineries under study have implemented best production practices regarding efficient use of water, there are still opportunities for improvement, which have been identified as hotspots. Industries that focus on continuous improvement become more competitive over time by keeping advantages in their industry, but only if improvement efforts are made correctly. One of the weaknesses found was the lack of continuous training and awareness among operators. On the other hand, awareness signs for the efficient use of water, written procedures with the stages of the cleaning process, mention of the appropriate products and contact times are essential and are already in place. Some strategies that can be implemented regarding water use efficiency are: the adoption of dry cleaning before washing with water, the use of clean in place systems that allow the recovery of the cleaning solution, the use of pressure washer systems, reducing both water consumption and making the cleaning process more effective, the use of hot water that can reduce the amount of caustic soda needed and the separation and removal of solids larger than 0.5–1.0 mm, allowing the reduction of the organic load of the wastewater directly at the cleaning activities. The shorter the contact time between the solids and the wastewater, the lower the amount of organic load. Other relevant strategic measures can involve the use of renewable energy sources, the use of lighter glass bottles, reverse bottle logistics and other pollution prevention methods, for promoting more eco-efficient production systems. Scenario analysis performed in this study showed that the reduction in the weight of glass bottles by 30% results in a 5–7% reduction in the impact categories. Specifically, in the Global Warming category, to which glass production makes a high contribution, the reduction was 6% or 0.027 kg CO2-eq per bottle, which is equivalent to 27 tons of CO2-eq that will not be released into the atmosphere. Higher reductions were reported in other studies [78,79], where the adoption of 30% lighter glass bottles resulted in reductions of up to 11% for all impacts associated with the life cycle of a wine bottle. These advantages result from the lower use of energy and raw material for the production of the glass bottle, as well as reduced impacts in terms of transport.
Good baseline measures and continuous action will help to identify the effectiveness of ongoing efforts, allowing stakeholders to adapt to the challenges foreseen in climate change scenarios, where water scarcity is a reality.
5. Conclusions
Future impacts of climate change on the Mediterranean water resources are not favorable for the wine sector. In this study, an integrated methodology for WFP was applied to Portuguese case studies highlighting the most impactful processes and strategies to overcome the challenges of climate change along this value chain.
When comparing both case studies, it was possible to observe that edaphoclimatic conditions play a key role on global value of wine WFP, as well as in the distribution among its components. Green water was the most representative component of the overall WFP. When segregated values were analyzed, it was found that the vineyard comprises most of the WFP (98–99%) and the irrigation was the process that most influenced both blue WFP and WSI. Concerning the winery stage, cleaning process was the most relevant contributor to both WFP and WSI, followed by the indirect impact of electricity production. Nevertheless, the winery stage was responsible for more than 75% of the global warming potential indicator, where wine bottling and packaging processes represented the most impactful stage. This indicator reveals the importance of a more comprehensive impact assessment.
The predicted impact of climate change (A1B scenario) in the water footprint indicator evaluated by simulations revealed an increase of about 40% and 82% in blue WFP, resulting in an increase of wine WFP of 5% and 22%, regarding case study I and II, respectively. Since considerable reductions in rainfall and significant increase in air temperature are expected, the wine sector must take firm steps in the search and implementation of winning strategies in terms of consumption and efficient use of water.
The approach used in this study proved to be a useful tool for stakeholders as it uses a decision support methodology to evaluate water use performance and improve the sustainability of the wine chain. Also, this can be helpful to policy-makers to conceive funding mechanisms that benefit sustainable farmers towards improving wine sector performance.
Author Contributions
Data curation, P.O.e.S. and L.F.; Formal analysis, P.P., A.R., A.P. and A.C.R.; Investigation, J.S., A.G. (Artur Gonçalves), and H.M. (Helena Mira); Methodology, M.F., G.R., S.R., A.F., A.G. (Anabela Grifo) and A.O.; Software, M.D. and H.M. (Henrique Mamede); Validation, I.D.; Writing—original draft, A.S. and A.A.; Writing—review & editing, M.O. All authors have read and agreed to the published version of the manuscript.
Funding
This research was funded by Fundação para a Ciência e Tecnologia through the research units UID/AGR/04129/2020 (LEAF), UID/AGR/0690/2013 (CIMO) and UIDB/05183/2020 (MED), and was supported by WineWATERFootprint project: POCI-01-0145-FEDER-023360.
Acknowledgments
The authors would like to acknowledge the WineWaterFootprint project POCI-01-0145-FEDER-023360 for the financial support, as well as Universidade de Lisboa and Instituto Superior de Agronomia of Universidade de Lisboa for the PhD scholarship funding of Artur Saraiva.
Conflicts of Interest
The authors declare no conflict of interest.
References
- Smit, B.; Burton, I.; Klein, R.J.; Wandel, J. An anatomy of adaptation to climate change and variability. Clim. Chang. 2000, 45, 223–251. [Google Scholar] [CrossRef]
- Jones, G.V.; Alves, F. Impacts of climate change on wine production: A global overview and regional assessment in the Douro valley of Portugal. In Proceedings of the Global Conference on Global Warming, Lisbon, Portugal, 11–14 July 2011. [Google Scholar]
- Soares, P.M.; Cardoso, R.M.; Ferreira, J.J.; Miranda, P.M. Climate change and the Portuguese precipitation: ENSEMBLES regional climate models results. Clim. Dyn. 2015, 45, 1771–1787. [Google Scholar] [CrossRef]
- Paulo, A.A.; Rosa, R.D.; Pereira, L.S. Climate trends and behaviour of drought indices based on precipitation and evapotranspiration in Portugal. Nat. Hazards Earth Syst. Sci. 2011, 11, 1481–1491. [Google Scholar] [CrossRef]
- Hanjra, M.A.; Qureshi, M.E. Global water crisis and future food security in an era of climate change. Food Policy 2010, 35, 365–377. [Google Scholar] [CrossRef]
- Costa, J.M.; Vaz, M.; Escalona, J.; Egipto, R.; Lopes, C.; Medrano, H.; Chaves, M.M. Modern viticulture in southern Europe: Vulnerabilities and strategies for adaptation to water scarcity. Agric. Water Manag. 2016, 164, 5–18. [Google Scholar] [CrossRef]
- Hoekstra, A.; Hung, P.Q. Virtual water trade: A quantification of virtual water flows between nations in relation to international crop trade. Water Sci. Technol. 2002, 49, 203–209. [Google Scholar]
- Hoekstra, A.Y.; Chapagain, A.K.; Aldaya, M.M.; Mekonnen, M.M. The Water Footprint Assessment Manual Setting the Global Standard; Earthscan: London, UK, 2011. [Google Scholar]
- ISO 14046. Environmental Management-Water Footprint-Principles, Requirements and Guidelines; International Organization for Standardization: Geneva, Switzerland, 2014. [Google Scholar]
- Quinteiro, P.; Dias, A.C.; Pina, L.; Neto, B.; Ridoutt, B.G.; Arroja, L. Addressing the freshwater use of a Portuguese wine (‘vinho verde’) using different LCA methods. J. Clean. Prod. 2014, 68, 46–55. [Google Scholar] [CrossRef]
- Lovarelli, D.; Ingrao, C.; Fiala, M.; Bacenetti, J. Beyond the Water Footprint: A new framework proposal to assess freshwater environmental impact and consumption. J. Clean. Prod. 2018, 171, 4189–4199. [Google Scholar] [CrossRef]
- Allan, T. ‘Virtual Water’: A Long Term Solution for Water Short Middle Eastern Economies? British Association Festival of Science. In Proceedings of the Water and Development Session, Roger Stevens Lecture Theatre, University of Leeds, Leeds, UK, 9 September 1997. [Google Scholar]
- Mekonnen, M.M.; Hoekstra, A.Y. The green, blue and grey water footprint of crops and derived crop products. Hydrol. Earth Syst. Sci. 2011, 15, 1577–1600. [Google Scholar] [CrossRef]
- Herath, I.; Green, S.; Singh, R.; Horne, D.; van der Zijpp, S.; Clothier, B. Water footprinting of agricultural products: A hydrological assessment for the water footprint of New Zealand wines. J. Clean. Prod. 2013, 41, 232–243. [Google Scholar] [CrossRef]
- Herath, I.; Green, S.; Horne, D.; Singh, R.; McLaren, S.; Clothier, B. Water footprinting of agricultural products: Evaluation of different protocols using a case study of New Zealand wine. J. Clean. Prod. 2013, 44, 159–167. [Google Scholar] [CrossRef]
- Rutger, M. Water Footprint of Wine Production in Wineries in Chile: The Creation of a Water Footprint Calculator; Universidade MAYOR: Providencia, Chile, 2015; p. 29. [Google Scholar]
- Civit, B.; Piastrellini, R.; Curadelli, S.; Arena, A.P. The water consumed in the production of grapes for vinification (Vitis vinifera). Mapping the blue and green water footprint. Ecol. Indic. 2018, 85, 136–143. [Google Scholar] [CrossRef]
- Rulli, M.C.; D’Odorico, P. The water footprint of land grabbing. Geophys. Resrc. Let. 2013, 40, 6130–6135. [Google Scholar] [CrossRef]
- Lamastra, L.; Suciu, N.A.; Novelli, E.; Trevisan, M. A new approach to assessing the water footprint of wine: An Italian case study. Sci. Total Environ. 2014, 490, 748–756. [Google Scholar] [CrossRef] [PubMed]
- Bonamente, E.; Scrucca, F.; Asdrubali, F.; Cotana, F.; Presciutti, A. The water footprint of the wine industry: Implementation of an assessment methodology and application to a case study. Sustainability 2015, 7, 12190–12208. [Google Scholar] [CrossRef]
- Bonamente, E.; Scrucca, F.; Rinaldi, S.; Merico, M.C.; Asdrubali, F.; Lamastra, L. Environmental impact of an Italian wine bottle: Carbon and water footprint assessment. Sci. Total Environ. 2016, 560–561, 274–283. [Google Scholar] [CrossRef]
- Rinaldi, S.; Bonamente, E.; Scrucca, F.; Merico, M.C.; Asdrubali, F.; Costa, F. Water and carbon footprint of wine: Methodology review and application to a case study. Sustainability 2016, 8, 621. [Google Scholar] [CrossRef]
- Bartocci, P.; Fantozzi, P.; Fantozzi, F. Environmental impacto of Sagrantino and Grechetto grapes cultivation for wine and vinegar production in central Italy by means of Life Cycle Assessment, Carbon Footprint, Water Footprint, Ecological Footprint. J. Clean. Prod. 2017, 140, 569–580. [Google Scholar] [CrossRef]
- Miglietta, P.P.; Morrone, D.; Lamastra, L. Water footprint and economic water productivity of Italian wines with appellation of origin: Managing sustainability through an integrated approach. Sci. Total Environ. 2018, 633, 1180–1186. [Google Scholar] [CrossRef]
- Borsato, E.; Giubilato, E.; Zabeo, A.; Lamastra, L.; Criscione, P.; Tarolli, P.; Marinello, F.; Pizzol, L. Comparision of water-focused life cycle assessment and water footprint assessment: The case of an Italian wine. Sci. Total Environ. 2019, 666, 1220–1231. [Google Scholar] [CrossRef]
- Villanueva-Rey, P.; Quinteiro, P.; Vázquez-Rowe, I.; Rafael, S.; Arroja, L.; Moreira, M.T.; Feijoo, G.; Dias, A.C. Assessing water footprint in a wine appellation: A case study for Ribeiro in Galicia, Spain. J. Clean. Prod. 2018, 172, 2097–2107. [Google Scholar] [CrossRef]
- Saraiva, A.; Rodrigues, G.; Mamede, H.; Silvestre, J.; Dias, I.; Feliciano, M.; Oliveira e Silva, P.; Oliveira, M. The impact of the winery’s wastewater treatment system on the winery water footprint. Water Sci. Technol. 2019, 80, 1823–1831. [Google Scholar] [CrossRef] [PubMed]
- Ene, S.A.; Teodosiu, C.; Robu, B.; Volf, I. Water footprint assessment in the winemaking industry: A case study for a Romanian medium size production plant. J. Clean. Prod. 2013, 43, 122–135. [Google Scholar] [CrossRef]
- Bujdosó, B.; Waltner, I. Water footprint assessment of a winery and its vineyard. Hung. Agric. Res. 2017, 1, 10–13. [Google Scholar]
- Steenwerth, K.L.; Strong, E.B.; Greenhut, R.F. Life cycle greenhouse gas, energy, and water assessment of wine grape production in California. Int. J. Life Cycle Assess. 2015, 20, 1243–1253. [Google Scholar] [CrossRef]
- Johnson, M.B.; Mehrvar, M. An assessment of the grey water footprint of winery wastewater in the Niagara Region of Ontario, Canada. J. Clean. Prod. 2019, 214, 623–632. [Google Scholar] [CrossRef]
- Merli, R.; Preziosi, M.; Acampora, A. Sustainability experiences in the wine sector: Toward the development of an international indicators system. J. Clean. Prod. 2018, 172, 3791–3805. [Google Scholar] [CrossRef]
- Oliveira, M.; Duarte, E. Integrated approach to winery waste: Waste generation and data consolidation. Front. Environ. Sci. Eng. 2016, 10, 168–176. [Google Scholar] [CrossRef]
- Martins, A.A.; Araújo, A.R.; Graça, A.; Caetano, N.S.; Mata, T.M. Towards sustainable wine: Comparision of two Portuguese wines. J. Clean. Prod. 2018, 183, 662–676. [Google Scholar] [CrossRef]
- IPMA-Instituto Português do Mar e da Atmosfera. Available online: https://www.ipma.pt/pt/oclima/normais.clima/ (accessed on 21 August 2020).
- Chapagain, A.K.; Hoekstra, A.Y.; Savenije, H.H.G.; Gautam, R. The water footprint of cotton consumption: An assessment of the impact of worldwide consumption of cotton products on the water resources in the cotton producing countries. Ecol. Econ. 2006, 60, 186–203. [Google Scholar] [CrossRef]
- Decreto-Lei n.° 235/97 de 3 de setembro. In Diário da República n.°203/1997—I Série-A; Ministério do Ambiente: Lisboa, Portugal, 1997; Available online: https://dre.pt/pesquisa/-/search/107067/details/maximized (accessed on 31 July 2020).
- Allen, R.G.; Pereira, L.S.; Raes, D.; Smith, M. Crop Evapotranspiration and Guidelines for Computing Crop Water Requirements. In FAO Irrigation and Drainage Paper 56; FAO: Rome, Italy, 1998. [Google Scholar]
- Ferreira, M.I.; Silvestre, J.; Conceição, N.; Malheiro, A.C. Crop and stress coefficients in rainfed and deficit irrigation vineyards using sap flow techniques. Irrig. Sci. 2012, 30, 433–447. [Google Scholar] [CrossRef]
- Chaves, M.M.; Santos, P.; Souza, C.R.; Ortuño, M.F.; Rodrigues, M.L.; Lopes, C.M.; Maroco, J.P.; Pereira, J.S. Deficit irrigation in grapevine improves water-use efficiency while controlling vigour and production quality. Ann. Appl. Biol. 2007, 150, 137–151. [Google Scholar] [CrossRef]
- Rosa, R.D.; Paredes, P.; Rodrigues, G.C.; Alves, I.; Fernando, R.M.; Pereira, L.S.; Allen, R.G. Implementing the dual crop coefficient approach in interactive software. 1. Background and computational strategy. Agric. Water Manag. 2012, 103, 8–24. [Google Scholar] [CrossRef]
- Paço, T.A.; Paredes, P.; Pereira, L.S.; Silvestre, J.; Santos, F.S. Crop Coefficients and Transpiration of a SuperIntensive Arbequina Olive Orchard using the Dual KcApproach and the KcbComputation with the Fractionof Ground Cover and Height. Water 2019, 11, 383. [Google Scholar] [CrossRef]
- Campos, I.; Neale, C.M.U.; Calera, A.; Balbontín, C.; González-Piqueras, J. Assessing satellite-based basal crop coefficients for irrigated grapes (Vitis vinifera L.). Agric. Water Manag. 2010, 98, 45–54. [Google Scholar] [CrossRef]
- Rouse, J.W.; Haas, R.H.; Schell, J.A.; Deering, D.W. Monitoring vegetation systems in the Great Plains with ERTS. In Proceedings of the Earth Resources Technology Satellite Symposium NASA SP-351, Washington, DC, USA, 10–14 December 1973; Volume 1, pp. 309–317. [Google Scholar]
- Blanco-Cipollone, F.; Lourenço, S.; Silvestre, J.; Conceição, N.; Moñino, M.J.; Vivas, A.; Ferreira, M.I. Plant water status indicators for irrigation scheduling associated with iso- and anisohydric behavior: Vine and plum trees. Horticulturae 2017, 3, 47. [Google Scholar] [CrossRef]
- Lopes, C.; Pinto, P.A. Easy and accurate estimation of grapevine leaf area with simple mathematical models. Vitis 2005, 44, 55–61. [Google Scholar]
- Jacob, D.; Petersen, J.; Eggert, B.; Alias, A.; Christensen, O.B.; Bouwer, L.M.; Braun, A.; Colette, A.; Déque, M.; Georgievski, G.; et al. EURO-CORDEX: New high-resolution climate change projections for European impact research. Reg. Environ. Change 2014, 14, 563–578. [Google Scholar] [CrossRef]
- CSWA. Sustainable Water Management Handbook for Small Wineries; California Sustainable Winegrowing Alliance (CSWA): San Francisco, CA, USA, 2014. [Google Scholar]
- EPA. Lean & Water Toolkit; EPA-100-K-11-003; United States Environment Protection Agency (EPA): Washington, DC, USA, 2011; p. 108.
- APHA; AWWA; WEF. Standard Methods for the Examination of Water and Wastewater, 10th ed.; APHA, AWWA, WEF: Washington, DC, USA, 2006. [Google Scholar]
- Penman, H.L. Natural evaporation from open water, bare soil and grass. Proc. R. Soc. of Lond. Ser. A Math. Phys. Sci. 1948, 193, 120–145. [Google Scholar]
- Neto, B.; Dias, A.C.; Machado, M. Life cycle assessment of the supply chain of a Portuguese wine: From viticulture to distribution. Int. J. Life Cycle Assess. 2013, 18, 590–601. [Google Scholar] [CrossRef]
- Guinée, J.B.; Gorrée, M.; Heijungs, R.; Huppes, G.; Kleijn, R.; de Koning, A.; van Oers, L.; Wegener Sleeswijk, A.; Suh, S.; Udo de Haes, H.A.; et al. Handbook on Life Cycle Assessment-Operational Guide to the ISO Standards; I: LCA in perspective. IIa: Guide. IIb: Operational annex. III: Scientific background; Kluwer Academic Publishers: Dordrecht, The Netherlands, 2002; p. 692. ISBN 1-4020-0228-9. [Google Scholar]
- Guinée, J.B.; Gorrée, M.; Heijungs, R.; Huppes, G.; Kleijn, R.; Koning, A.D.; Huijbregts, M.A.J. LCA–An Operational Guide to the ISO-standards–Part 2b: Operational Annex (Final Report. May 2001): Institute of Environmental Science (CML) Faculty of Science; Leiden University: Leiden, The Netherlands, 2001. [Google Scholar]
- Pfister, S.; Koehler, A.; Hellweg, S. Assessing the Environmental Impacts of Freshwater Consumption in LCA. Environ. Sci. Technol. 2009, 43, 4098–4104. [Google Scholar] [CrossRef] [PubMed]
- Acevedo-Opazo, C.; Ortega-Farias, S.; Fuentes, S. Effects of grapevine (Vitis vinifera L.) water status on water consumption, vegetative growth and grape quality: An irrigation scheduling application to achieve regulated deficit irrigation. Agric. Water Manag. 2010, 97, 956–964. [Google Scholar] [CrossRef]
- Zarrouk, O.; Francisco, R.; Pinto-Marijuan, M.; Brossa, R.; Santos, R.R.; Pinheiro, C.; Costa, J.M.; Lopes, C.; Chaves, M.M. Impact of irrigation regime on berry development and flavonoids composition in Aragonez (Syn. Tempranillo) grapevine. Agric. Water Manag. 2012, 114, 18–29. [Google Scholar] [CrossRef]
- Decreto-Lei n.° 236/98 de 1 de agosto. In Diário da República n.° 176/1998—I Série-A; Ministério do Ambiente: Lisboa, Portugal, 1998; Available online: https://dre.pt/pesquisa/-/search/430457/details/maximized (accessed on 23 July 2020).
- Lionello, P.; Scarascia, L. The relation between climate change in the Mediterranean region and global warming. Reg Environ Change 2018, 18, 1481–1493. [Google Scholar] [CrossRef]
- Phogat, V.; Skewes, M.A.; McCarthy, M.G.; Cox, J.W. Evaluation of crop coefficients, water productivity, and water balance components for wine grapes irrigated at different deficit levels by a sub-surface drip. Agric. Water Manag. 2017, 180, 22–34. [Google Scholar] [CrossRef]
- Costa, J.M.; Egipto, R.; Silvestre, J.; Lopes, C.; Chaves, M. Chapter 10-Water and Heat Fluxes in Mediterranean Vineyards: Indicators and Relevance for Management. In Water Scarcity and Sustainable Agriculture in Semiarid Environment; Academic Press: Cambridge, MA, USA, 2018; pp. 219–245. [Google Scholar] [CrossRef]
- Paredes, P.; Rodrigues, G.C.; Alves, I.; Pereira, L.S. Partitioning evapotranspiration, yield prediction and economic returns of maize under various irrigation management strategies. Agric. Water Manag. 2014, 135, 27–39. [Google Scholar] [CrossRef]
- Fandiño, M.; Cancela, J.J.; Rey, B.J.; Martínez, E.M.; Rosa, R.G.; Pereira, L.S. Using the dual-Kc approach to model evapotranspiration of Albariño vineyards (Vitis vinifera L. cv. Albariño) with consideration of active ground cover. Agric. Water Manag. 2012, 112, 75–87. [Google Scholar] [CrossRef]
- Kamble, B.; Irmak, A.; Hubbard, K. Estimating Crop Coefficients Using Remote Sensing-Based Vegetation Index. Remote Sens. 2013, 5, 1588–1602. [Google Scholar] [CrossRef]
- Calera, A.; Campos, I.; Osann, A.; D’Urso, G.; Menenti, M. Remote sensing for crop water management: From ET modelling to services for the end users. Sensors 2017, 17, 1104. [Google Scholar] [CrossRef] [PubMed]
- Pôças, I.; Paço, T.A.; Paredes, P.; Cunha, M.; Pereira, L.S. Estimation of Actual Crop Coefficients Using Remotely Sensed Vegetation Indices and Soil Water Balance Modelled Data. Remote Sens. 2015, 7, 2373–2400. [Google Scholar] [CrossRef]
- Orduña, R.M. Climate change associated effects on grape and wine quality and production. Food Res. Int. 2010, 43, 1844–1855. [Google Scholar] [CrossRef]
- Salazar, P.C.; Aguirreolea, J.; Sánchez-Díaz, M.; Irigoyen, J.J.; Morales, F. Effects of climate change scenarios on Tempranillo grapevine (Vitis vinifera L.) ripening: Response to a combination of elevated CO2 and temperature, and moderate drought. Plant Soil 2010, 337, 179–191. [Google Scholar] [CrossRef]
- Tonietto, J.; Carbonneau, A.A. multicriteria climatic classification system for grape-growing regions worldwide. Agric. For. Meteorol. 2004, 124, 81–97. [Google Scholar] [CrossRef]
- Pina, L.; Dias, A.C.; Neto, B.; Arroja, L.; Quinteiro, P. The water footprint of wine production in Portugal: A case study on vinho verde. In Proceedings of the 6th International Conference on Industrial Ecology, Berkeley, CA, USA, 7–10 June 2011. [Google Scholar]
- Villanueva-Rey, P.; Vázquez-Rowe, I.; Moreira, M.T.; Feijoo, G. Comparative life cycle assessment in the wine sector: Biodynamic vs. conventional viticulture activities in NW Spain. J. Clean. Prod. 2014, 65, 330–341. [Google Scholar] [CrossRef]
- Rugani, B.; Vázquez-Rowe, I.; Benedetto, G.; Benetto, E. A comprehensive review of carbon footprint analysis as an extended environmental indicator in the wine sector. J. Clean. Prod. 2013, 54, 61–77. [Google Scholar] [CrossRef]
- Fusi, A.; Guidetti, R.; Benedetto, G. Delving into the environmental aspect of a Sardinian white wine: From partial to total life cycle assessment. Sci. Total Environ. 2014, 472, 989–1000. [Google Scholar] [CrossRef]
- Iannone, R.; Miranda, S.; Riemma, S.; De Marco, I. Improving environmental performances in wine production by a life cycle assessment analysis. J. Clean. Prod. 2016, 111, 172–180. [Google Scholar] [CrossRef]
- Benedetto, G. The Environmental Impact of a Sardinian Wine by Partial Life Cycle Assessment. Wine Econ. Policy 2013, 2, 33–41. [Google Scholar] [CrossRef]
- van Leeuwen, C.; Destrac-Irvine, A. Modified grape composition under climate change conditions requires adaptations in the vineyard. OENO One 2017, 51, 147–154. [Google Scholar] [CrossRef]
- IPCC. Climate Change: The Physical Science Basis. In Contribution of Working Group I to the Fifth Assessment Report of the Intergovernmental Panel on Climate Change; Stocker, T.F., Qin, D., Plattner, G.-K., Tignor, M., Allen, S.K., Boschung, J., Nauels, A., Xia, Y., Bex, V., Midgley, P.M., Eds.; Cambridge University Press: Cambridge, UK; New York, NY, USA, 2013; p. 1535. [Google Scholar]
- Point, E.; Tyedmers, P.; Naugler, C. Life Cycle Environmental Impacts of Wine Production and Consumption in Nova Scotia, Canada. J. Clean. Prod. 2012, 27, 11–20. [Google Scholar] [CrossRef]
- Amienyo, D.; Camilleri, C.; Azapagic, A. Environmental Impacts of Consumption of Australian Red Wine in the UK. J. Clean. Prod. 2014, 72, 110–119. [Google Scholar] [CrossRef]


© 2020 by the authors. Licensee MDPI, Basel, Switzerland. This article is an open access article distributed under the terms and conditions of the Creative Commons Attribution (CC BY) license (http://creativecommons.org/licenses/by/4.0/).