Article

Landslides Triggered by the May 2017 Extreme Rainfall Event in the East Coast Northeast of Brazil

by
Nikolai S. Espinoza
1,
Carlos A. C. dos Santos
1,*,
Madson T. Silva
1,
Helber B. Gomes
2,
Rosaria R. Ferreira
3,
Maria L. da Silva
3,
Cláudio M. Santos e Silva
3,
Cristiano P. de Oliveira
3,
João Medeiros
4,
Jason Giovannettone
5,
Venerando E. Amaro
6,
Celso A. G. Santos
7 and
Manoranjan Mishra
8
1
Academic Unit of Atmospheric Sciences, Federal University of Campina Grande, Campina Grande 58429-900, Paraíba, Brazil
2
Institute of Atmospheric Sciences, Federal University of Alagoas, Maceió 57072-900, Alagoas, Brazil
3
Department of Atmospheric and Climate Sciences, Federal University of Rio Grande do Norte, Natal 59064-720, Rio Grande do Norte, Brazil
4
Departament of Pyshics, Federal University of Rio Grande do Norte, Natal 59064-720, Rio Grande do Norte, Brazil
5
Dewberry, Fairfax, VA 22031, USA
6
Department of Civil Engineering, Federal University of Rio Grande do Norte, Natal 59064-720, Rio Grande do Norte, Brazil
7
Department of and Environmental Civil Engineering, Federal University of Paraíba, João Pessoa 58051-900, Paraíba, Brazil
8
Department of Natural Resource Management & Geoinformatics, Khallikote University, Ganjam, Berhampur 761008, Odisha, India
*
Author to whom correspondence should be addressed.
Atmosphere 2021, 12(10), 1261; https://doi.org/10.3390/atmos12101261
Submission received: 10 August 2021 / Revised: 18 September 2021 / Accepted: 22 September 2021 / Published: 27 September 2021
(This article belongs to the Section Meteorology)

Abstract

:
Given the increasing occurrence of landslides on the East Coast Northeast of Brazil (ECNEB), it is essential to understand its conditions and triggering factors because meteorological anomalies triggered by a landslide will threaten life and property in the region. In this sense, this research aimed to diagnose the meteorological conditions that triggered landslides in the ECNEB in May 2017, evaluate the terrain’s intrinsic conditions using elevation, slope, and susceptibility parameters and determine critical precipitation thresholds for the city with the highest number of landslide risk areas in the region. A dynamic downscaling experiment was carried out using the Regional Climate Model (RegCM) to verify the ability of this model to represent rainfall over the ECNEB. The results from the intrinsic factors showed that the ECNEB is highly susceptible to landslides with various high-risk sectors for landslides to the population. The extreme rainfall event was associated with the convergence of humidity at low levels over the ocean, which contributed to landslides in the ECNEB, mainly in the State of Pernambuco, where 67 landslides were registered. The RegCM numerical simulation underestimated the high daily rainfall signal seen on the Tropical Rainfall Measuring Mission satellite. It is suggested that sensitivity tests can be performed using other physical parameters to find the best model configuration for the ECNEB. This work recommends that exploring the relationship between precipitation and landslides will provide objective criteria for assessing risk areas by contributing to the predictability of disasters in this region.

1. Introduction

Analyses focused on the consequences of future climate change point to a trend that there may be an increase in the number of extreme rain or drought events in various susceptible areas of the Earth, especially in regions with high population density [1,2]. Therefore, it becomes relevant to understand which agents are triggering points for the cause of these extreme events (e.g., drought, floods, and landslides [3]) and to mitigate their effects.
In Brazil, rapid and disorderly urbanization mischaracterizes the natural landscapes, forcing low-income populations to occupy unfavorable geological-geomorphological areas for their livelihood. However, only 11.5% of all Brazilian municipalities have a Master Plan, basic instruments of urban development and expansion policy, or the Land Use and Occupation Law, which includes policy related to the prevention of landslides [4]. This combination of factors correlated with the absence of permanent public policies that prioritize disasters has increased the population’s vulnerability to floods and landslides.
Changes in the geographical space in East Coast Northeast of Brazil (ECNEB) cities have grown exponentially due to population growth and the migration of people searching for job opportunities [5,6]. Therefore, inadequate forms of urban occupation, mainly for residential purposes, have contributed decisively to transforming stable natural areas into high-risk sectors for landslides [7].
There are three main mechanisms for triggering landslides that can occur either singly or in combination: precipitation, seismic and volcanic activity [8]. The Brazilian Classification and Coding of Disasters groups potential threats to landslide incidents into four types: rockfall, topple, slides, and debris flows [9]. In the ECNEB, one of the main triggers of disasters is the erratic pattern of rainfall, where most events involving victims are related to landslides [10,11]
Landslide events recorded across the country demonstrate the need to improve the ability to monitor, predict and issue landslide alerts in advance to minimize related damage and protect human lives and properties [12,13]. In this context, the ECNEB is predisposed to disasters associated with landslides due to geological and geomorphological factors as well as the disorganized land occupation [10,14]. In the State of Pernambuco alone, 2147 risk areas for hydrometeorological disasters were evaluated, representing 39.2% of the total risk areas in the nine States of the ECNEB [15]. In 2019, 6 of the 185 districts of the State of Pernambuco had 29 deaths due to landslides [14].
According to [15], Jaboatão dos Guararapes had the highest rates of the population exposed to the risk of geo-hydrological disasters in the State of Pernambuco, with 188,026 inhabitants in risk areas. However, there is a gap in studies associated with assessing these extreme rain events and the associated landslide events in this region. The scientific community has responded by preparing effective studies linked to the triggering mechanisms to assist the alert and monitoring systems for disaster prevention [16,17]. Among these studies, the correlation between rainfall and landslide resulting from the exceedance of precipitation thresholds has been used in early warning systems [16,18].
The rain events recorded at the ECNEB can contribute to the increased vulnerability of the local population due to the social and economic damage caused by floods and landslides. The occurrence of extreme rainfall at the ECNEB may be due to spatial and temporal anomalies in meteorological systems and changes found in large-scale atmospheric circulation. These anomalies and changes occur through changes in El Niño Southern Oscillation (ENSO), induced by ocean-atmosphere interactions over the Pacific Ocean and through inter-hemispheric sea surface temperature gradients in the Atlantic [19,20,21].
The increase in the frequency and magnitude of disasters related to landslides in the ECNEB during the rainy season demonstrates the importance of conducting studies in these high-risk areas that are vulnerable to extreme events. However, there is insufficient research on the analysis of triggering agents for disasters of this type in Brazil [22]. Some ECNEB municipalities, such as Jaboatão dos Guararapes, located in the State of Pernambuco, present risk management strategies related to landslides in urban areas [14]. The need is to develop a more effective monitoring and alert system that predicts geo-hydrological risks and communicates in the local language before these extreme events take place.
Thus, this study aimed to diagnose the meteorological conditions that triggered the occurrence of landslides in several municipalities of the ECNEB in May 2017, evaluate the intrinsic conditions of the terrain through elevation, slope, and susceptibility parameters, and determine critical precipitation thresholds for the city with the highest number of landslide risk areas in the region. Between 23 to 30 May 2017, the ECNEB recorded heavy and persistent rains, causing numerous disruptions to the population, including deaths, landslides, floods, and house destruction, as well as dam ruptures. Furthermore, an evaluation of the rainfall that occurred during this episode was performed using a simulation with a regional climate model to examine the pattern of spatial behavior and, as a result, assist in identifying the active meteorological system.

2. Materials and Methods

2.1. Study Area

The ECNEB, also known as Zona da Mata, comprises the coastal strip extending from the east of the State of Rio Grande do Norte (5°11′46″ S; 35°27′13″ W) to the south of Bahia (16°18′44″ S; 39°03′04″ W) (Figure 1a). The region’s relief covers the distal portion of the Sertaneja depression and is represented by low-lying plains and sedimentary rocks (Barreiras Formation) of the Tertiary age, forming low-lying plateaus below 100 m of elevation. These geomorphological features are erosive remnants detached from inland source areas and dissected by watersheds flowing seaward, and most end up as active or abandoned seacliffs [23]. The ECNEB is considered to be the most urbanized and industrialized area in the Northeast region of Brazil (NEB), with high anthropic action caused by the dense concentration of the largest cities and industrial (mainly sugarcane agro-industries) centers [24] (Figure 1c).
From Figure 1, the climate region “Af” is identified mainly along the coast in the State of Bahia in the strip containing the Marine Plains and Coastal Tablelands, exhibiting a transition climate with rainy summers to the south and rainy winters to the north, without a defined dry season. The climate region “Am” is registered on the coast of Alagoas, Paraíba, and Pernambuco and is characterized by a monsoon climate. Finally, the climate region “Aw” is characterized by a rainy summer season on the southern coast of the ECNEB, while “As” is characterized by a winter rainy season along the northern coast of the ECNEB, from [24].
According to the Köppen classification criterion, the ECNEB has a tropical climate (A—Tropical Zone), where average temperatures vary between 24 °C and 27 °C (Figure 2), with four climate categories prevailing (Figure 1b). About 50% of annual precipitation accumulation at the ECNEB occurs within the April–July period [25], with portions of the region receiving rainfall amounts above 1.200 mm annually (Figure 2).
The frequency and intensity of extreme rainfall events in the ECNEB are related to natural climate variability linked to El Niño and La Niña events and variations in meteorological systems that can cause intense precipitation [26,27]. The main meteorological system capable of generating precipitation in the ECNEB is attributed to the propagation of convective clouds from West Africa to the Tropical Atlantic, known as Easterly Wave Disturbances (EWDs) [28]. In the State of Bahia, the Cold Fronts (CFs) can reach the lower latitudes and produce organized convection in the Southern Hemisphere’s winter [29]. In the ECNEB, precipitation values are also associated with the Intertropical Convergence Zone (ITCZ) displacement during April [30]. Additionally, the Upper Tropospheric Cyclonic Vortex (UTCV), Mesoscale Convective Complexes (MCCs), and the maximum convergence of southeast trade winds with the land breeze at different times of the year can favor significant accumulations of rain in the region [31,32]. In the autumn and winter seasons, precipitation is also induced by contrasting temperatures between the mainland and the Atlantic Ocean.
Conditions of vulnerability to natural hazards were present at the ECNEB, mainly driven by extreme rain events that can cause floods and landslides, resulting in material damage and sometimes loss of human life [11]. Over the years, the ECNEB has experienced the occurrence of these events, as in the cases of EWDs that occurred in 2006 in the State of Bahia [33], State of Pernambuco in 2010 [34], and State of Rio Grande do Norte in 2014 [35]. Moreover, there is evidence that these disasters have become more frequent in recent years, aggravating the region’s geo-hydrological problems [36].

2.2. Data and Methods

In order to carry out this study, information that allowed us to identify the predisposition to landslides in the study area, evaluate the relationship between rain and landslides, verify the atmospheric conditions of the extreme rain event in the ECNEB and examine the ability of the Regional Climate Model (RegCM) to represent extreme event rainfall was used. The following is a summary of the information required to complete this study.

2.2.1. Predisposition to Landslides in the Study Area

Initially, to identify the susceptible areas in the ECNEB, the mapping of susceptibility to landslides carried out by the Brazilian Institute of Geography and Statistics (IBGE) compatible with the scale of 1:1,000,000 was used [37]. The mapping was generated using the geology, geomorphology, pedology, and vegetation databases produced by IBGE over twenty years. In addition, information from the Monitoring of Land Cover and Land Use of Brazil 2014 to 2016, on the scale of 1:1,000,000, from the IBGE, was also used to recognize the land use and land cover (LULC) in the Brazilian territory, as well as information from the Pluviometric Atlas of Brazil, prepared by the Brazil Geological Survey (CPRM), on a scale of 1:5,000,000 to understand rainfall (average annual rainfall).
In order to integrate these databases, which are characterized by substantially different origins and incompatible geographic units, the thematic information was added to the IBGE Statistical Grid, in which the country is divided into cells of 1 × 1 km2. Thus, weights were assigned to the variables for each database according to the degrees of potential for landslides [37]. The final product that resulted from this mapping in the current study is provided in shapefile vector format (.shp); a cutout for ECNEB using a Geographic Information System (GIS) was made to show the area of coverage, along with the susceptibility class, of the landslides that occurred in the extreme rain event in May 2017.
In order to identify the areas at high risk to landslides at the municipal scale, the reports of mapping the sectorization of high and very high-risk to mass movements, and floods produced by the CPRM were used (see http://geoportal.cprm.gov.br/desastres/ accessed on 20 April 2020). The mapping was accomplished using an integrated model in a GIS environment and made use of a wide range of data and products ranging from the zoning of susceptibility to processes in the physical environment, with emphasis given to those processes potentially generating natural hazards. These reports indicate the neighborhoods and streets where they are located, the type of mass movement, number of people at risk, number of properties at risk, degree of risk (high or very high), in addition to information that shows evidence of instability.
In addition, the elevation and slope parameters were extracted from the Digital Elevation Model (DEM) of the Shuttle Radar Topographic Mission v4.1 (SRTM v4.1) in a GIS environment, which is available for South America with a spatial resolution of about 90 m (http://cgiarcsi.community/ accessed on 15 May 2020) [38]. The SRTM v4.1 was used to prepare maps of elevation and slope, which are two major conditioning factors for the occurrence of landslides, on a spatial scale of 1:1,000,000 in the ECNEB.

2.2.2. Relationship between Rain and Landslides

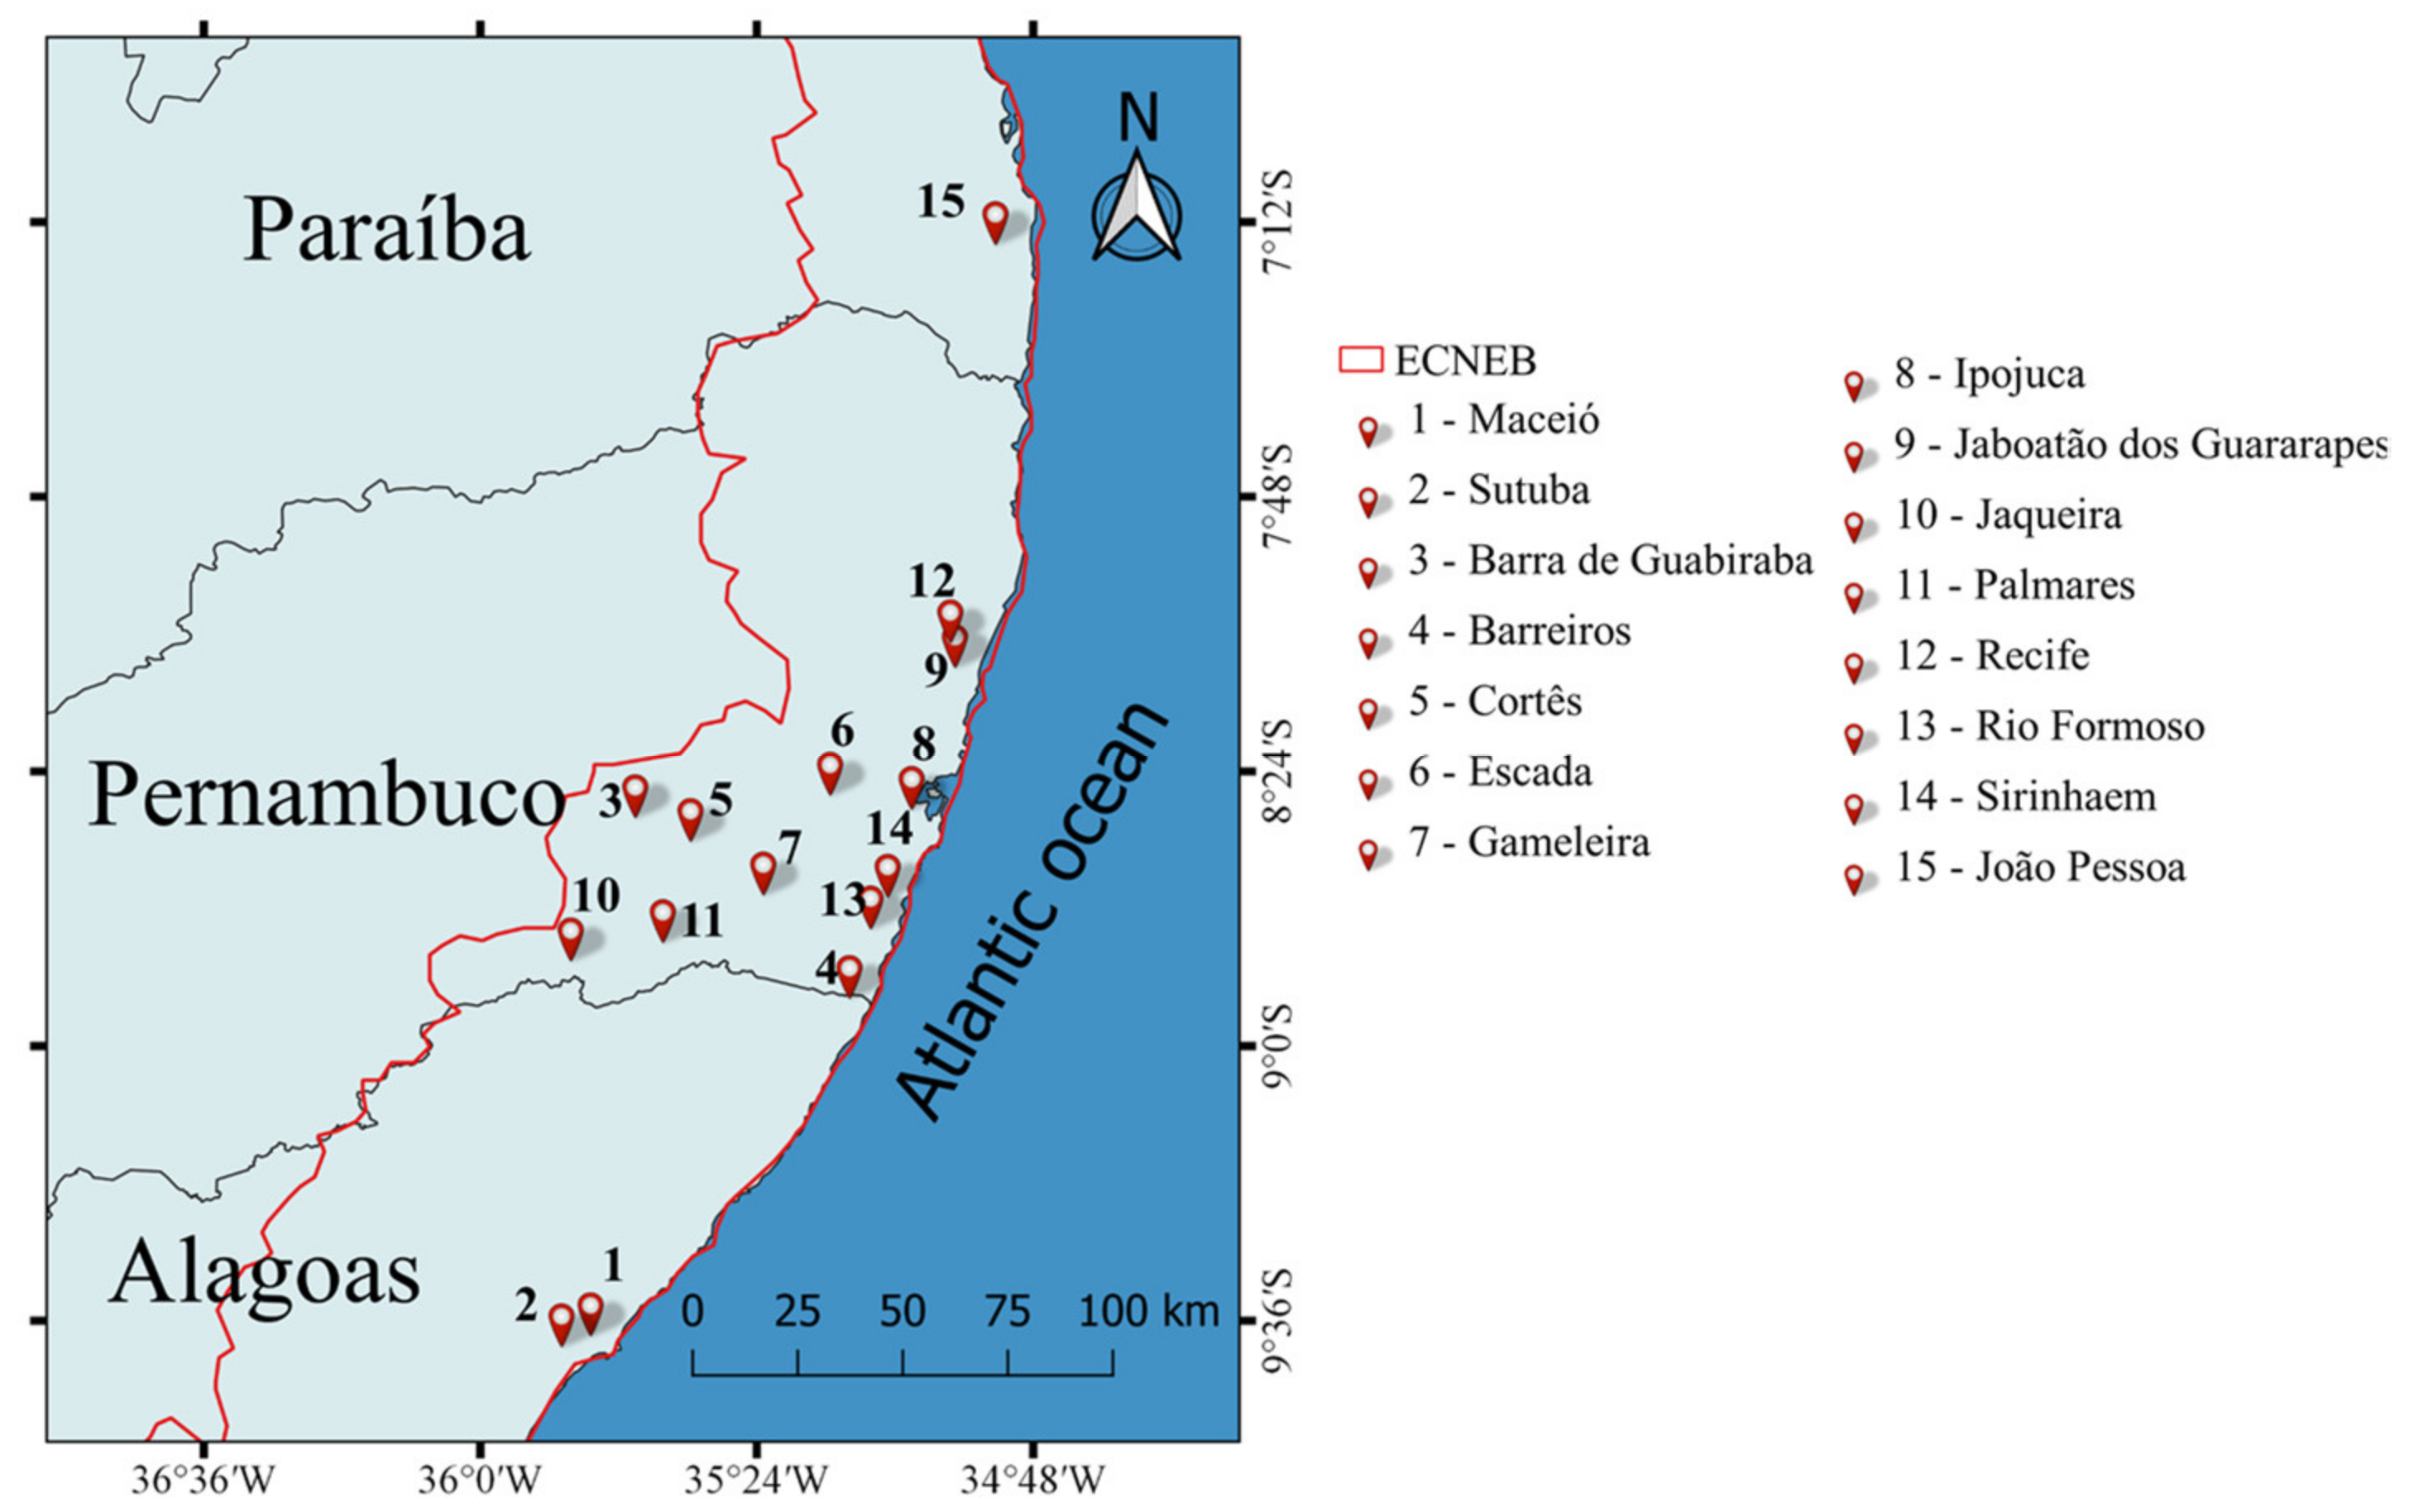
The survey of landslide data was carried out through reports and bulletins of records of occurrence and alert for the municipalities located in the ECNEB (Figure 3), made available by the National Center for Monitoring and Natural Disaster Alerts (CEMADEN). In addition, rainfall measurements from the CEMADEN Natural Disaster Monitoring Network were used (http://cemaden.gov.br/mapainterativo/ accessed on 10 June 2020). The data from this network are relevant for measuring the amount and intensity of rainfall that can trigger landslides and floods and assisting in developing different levels of alert. Rain gauges provide data at a frequency of every 10 min; this data was processed as hourly data and converted into Brasilia Local Time (UTC–3); the results were finally presented as daily accumulation.
In order to calculate the rainfall thresholds, data on landslides and precipitation from the municipality of Jaboatão dos Guararapes were used from January 2016 to December 2020; this particular city was used because it experienced the highest number of landslide cases in the 5-year study period.
In order to assess the dependence of landslides on precipitation measurements, the empirical precipitation threshold approach proposed by [39] to determine thresholds for the occurrence of landslides based on daily precipitation was used. This approach uses the relationships between intensity and duration (ID) as well as between the accumulated precipitation of events and their duration (ED). Criteria for filtering cases were established, separating rain events with and without the occurrence of landslides. The thresholds ID and ED were produced using the daily accumulated rainfall through the most common equations found in the literature, for which the threshold curve is assumed from:
I = α D β ;   for   ( ID )
E = α D β ;   for   ( ED )
where I is the rainfall mean intensity (mm/day), D is the duration of the rainfall event (day), E is the accumulated precipitation of the rain event, α is a scaling parameter (the intercept), and β is the shape parameter that controls the slope of the threshold curve.

2.2.3. Atmospheric Conditions of the Extreme Rain Event

Meteorological systems act as precursors to natural disasters in Brazil; thus, it is important to determine the characteristics of these atmospheric processes through the analysis of spatial fields of atmospheric variables. Therefore, the main information (bulletins, precipitation data, satellite images, radar products, and reanalysis data) was used to diagnose the events related to the occurrence of landslides within the ECNEB. The landslide and precipitation data were obtained from the CEMADEN database from 23 to 31 May 2017.
  • Reanalysis data
For analyzing atmospheric conditions, hourly data from the European Centre for Medium-Range Weather Forecasts (ECMWF) were used for the fifth-generation climate reanalysis data set [40], with a spatial resolution of 0.25° × 0.25° for May 2017. The variables used were zonal (u) and meridional (v) wind components, vertical speed (w), Vertically Integrated Moisture Flux Convergence (VIMFC), Outgoing Longwave Radiation (OLR), and wind divergence.
b.
Satellite images
The interpretation of satellite images allows an analysis of the extent, intensity, and temporal evolution of the meteorological system involved. In this sense, images of brightness temperature were used in the spectral band 12.3 µm of the infrared (channel 15) onboard the geostationary satellite GOES-16 with a spatial resolution of 2 km provided by the Environmental Satellite Division of the Weather Forecast Center and Climate Studies (DAS/CPTEC/INPE).
c.
Weather radar
The weather radar information makes it possible to estimate precipitation intensity, displacement speed, and the precipitating cell’s vertical extent. In this study, volumetric data from the double polarization meteorological radar from Maceió and Natal cities, from the Meteorological Radars project of CEMADEN/MCTI, were used to perform hydrometeorological monitoring and obtain necessary information for possible disasters associated with extreme rainfall in different regions of Brazil. Volumetric scans had a repetition interval of 10 min with a range of 250 km from the measured reflectivity variables. In addition, the analyses of the measured variables were displayed in fields for visualization through products such as the Constant Altitude Plan Position Indicator (CAPPI), which is typically used to analyze the reflectivity at a specific altitude.
d.
TRMM data
The data used to generate spatial maps of the rain that occurred at the ECNEB were obtained from the rainfall estimate made by the 3B42 version 7 algorithm of the Tropical Rainfall Measuring Mission (TRMM) satellite [41] and available at https://giovanni.gsfc.nasa.gov, accessed on 30 March 2020. These data have a spatial resolution of 0.25° × 0.25° and a temporal resolution of 3 h. Researchers [42] analyzed the TRMM data in comparison with data from 267 rain gauges in the region; they showed the consistency of the satellite data. Research [43] also confirmed that TRMM estimates are viable alternatives for water resources studies.

2.2.4. Numerical Simulation

In this study, a dynamic downscaling experiment was carried out using the Regional Climate Model (RegCM) version 4.7 [44] to verify the sensitivity of this model in representing the rain over the ECNEB during May 2017 and to assess its capability to predict the occurrence of rains that may contribute to landslides in the ECNEB. It is worth highlighting that studies that used Regional Climate Models to perform dynamic downscaling proved to be adequate to reproduce the region’s local scale [45,46,47].
The numerical simulation was performed using the ECMWF reanalysis as an initial large-scale condition, specifically the EIN15 product available at http://climadods.ictp.it/regcm4/EIN15 accessed on 17 January 2021. The RegCM was run in association with Community Land Model 4.5 [44,48] for the South Tropical Atlantic Ocean and the NEB region domain. The simulation domain was configured to have 220 × 270 grid points (49.5° W–20.5°W and 20° S–4.5° N), with 23 vertical levels of sigma pressure, non-hydrostatic dynamic core, and 12 km horizontal resolution from 1 April to 30 June 2017. Table 1 presents a summary of the parameterization schemes defined for the numerical experiment.

2.2.5. Statistical Analysis

Statistical metrics were used to evaluate the RegCM model’s performance at the ECNEB compared with observational rainfall data estimated by the TRMM satellite using the 3B42 algorithm. The following measures were used: mean square error (RMSE) and BIAS [57].

3. Results and Discussion

3.1. Assessment of Landslide Susceptibility

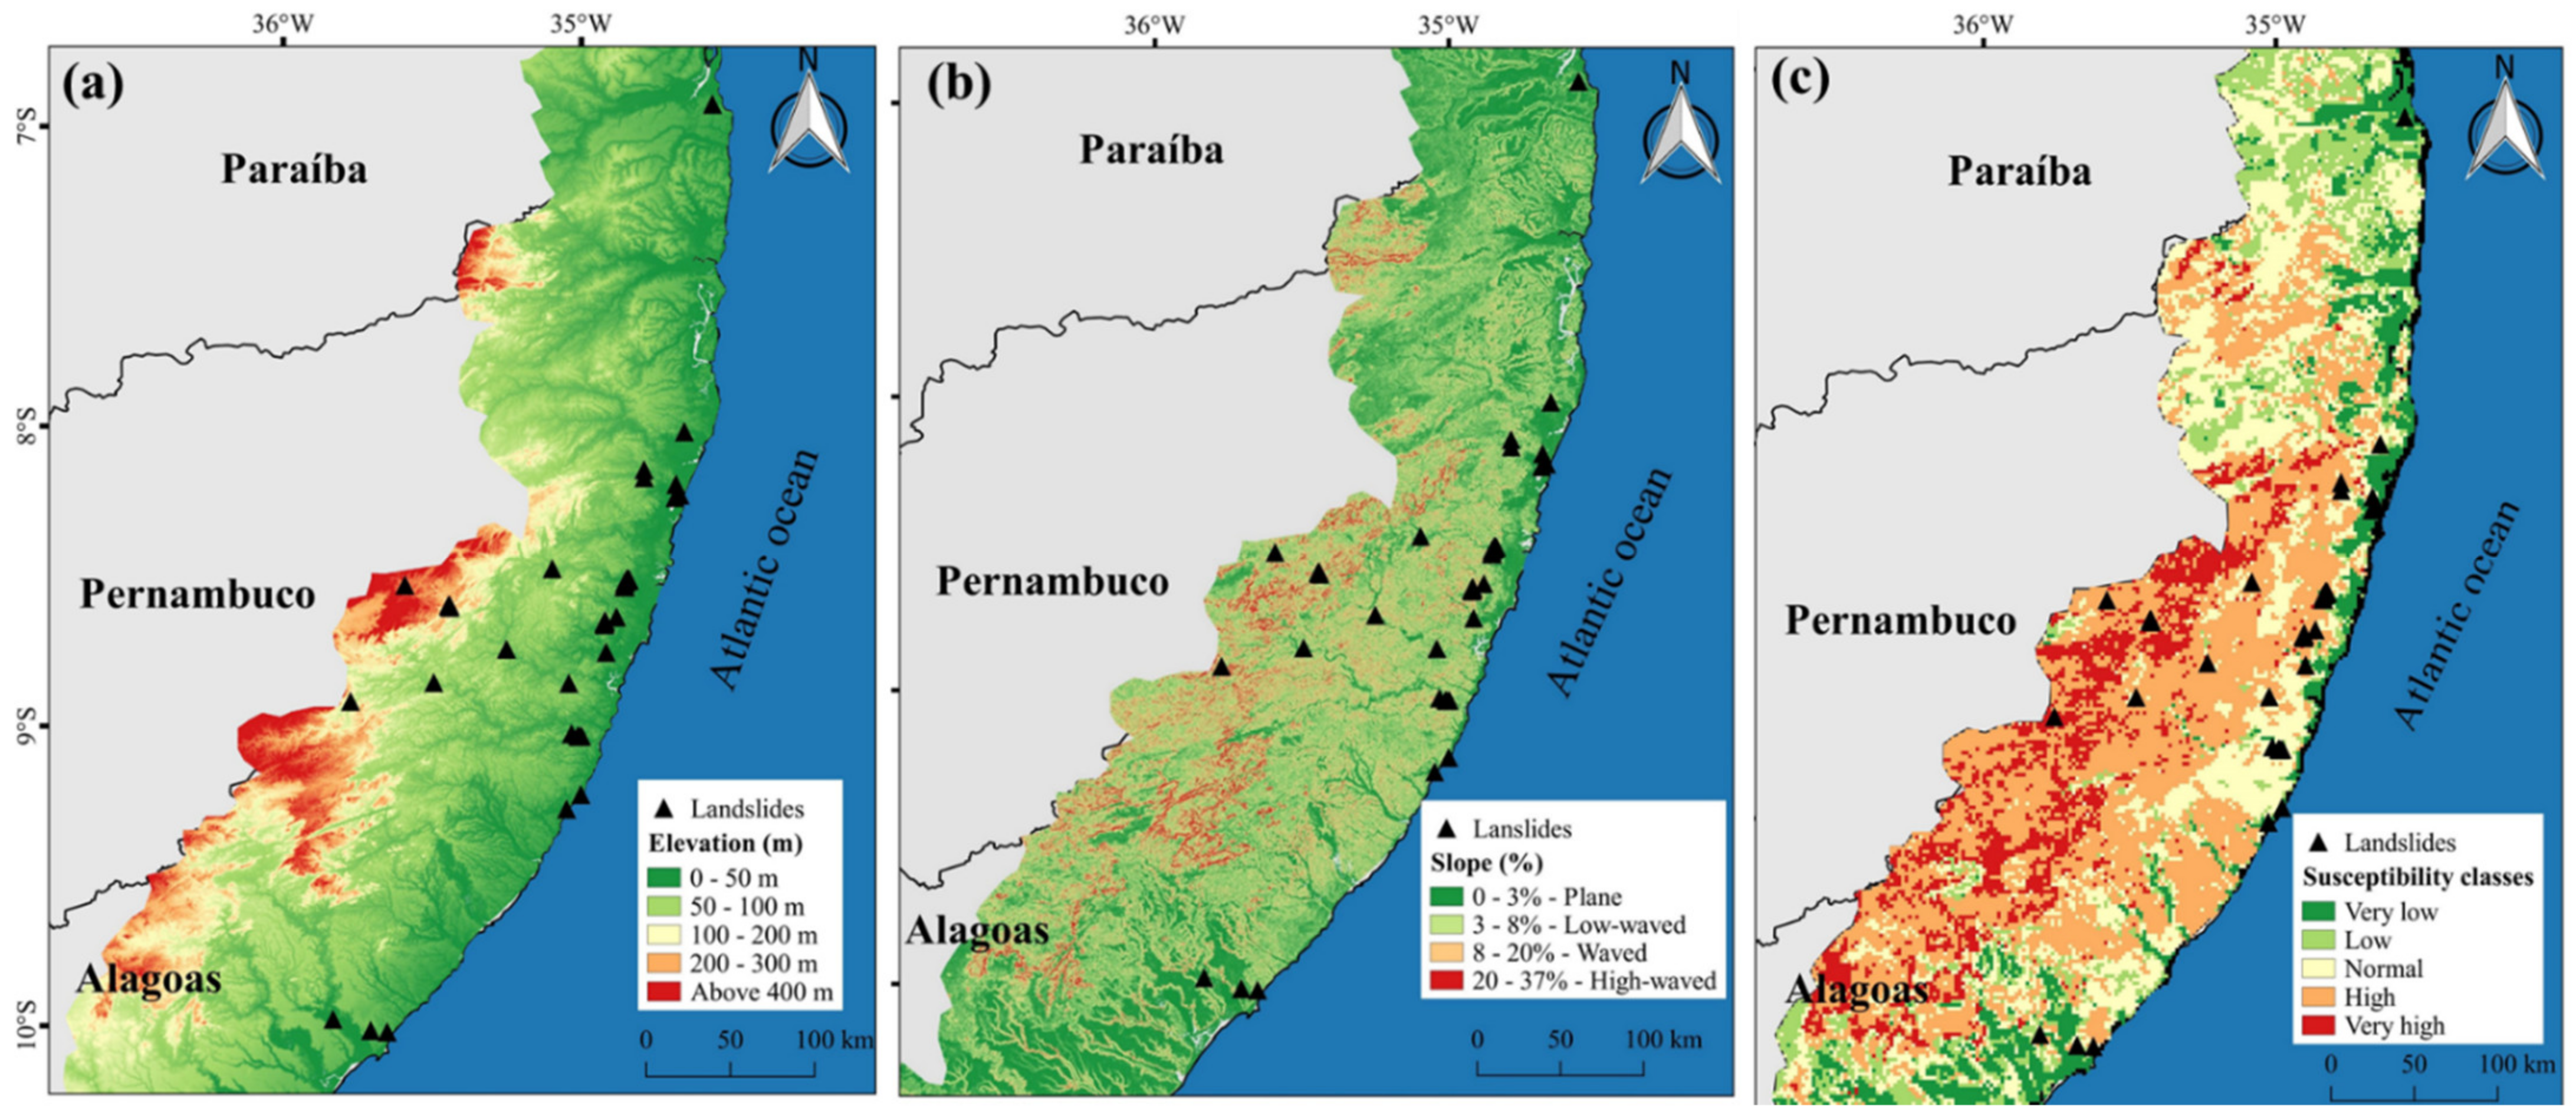
The extreme rainfall event used in this study which occurred at the ECNEB in May 2017, affected several ECNEB municipalities, mainly in the State of Pernambuco, and brought drastic consequences for the population such as deaths, landslides, destruction of homes, and floods [58]. In nine days, from 24 to 31 May, 71 landslides were registered in ECNEB, i.e., one in Paraíba, three events in Alagoas, and 67 landslides in Pernambuco (Figure 4). It is observed that the largest number of events was identified in the State of Pernambuco, where, according to the susceptibility classes in Figure 4c, there is a high degree of potential for the occurrence of landslides. In addition, most of the landslides were observed at altitudes below 100 m and with flat to gently undulating relief (Figure 4a,b). However, a greater probability of these events is expected in areas with a high elevation and a strongly undulating slope.
The landslides were observed in sixteen ECNEB cities, 1 in Paraíba, 2 in Alagoas, and 12 in Pernambuco. The greatest numbers of landslides were verified in the cities of Ipojuca with 44 landslides, Jaboatão dos Guararapes with 6 landslides, Cortês with 5 landslides, and Barreiros with 4 landslides (Table A1).
Currently, the ECNEB has several landslide high-risk sectors, with 346 high-risk sectors related to landslides according to the last risk mapping carried out by CPRM (Figure 5). Of these cities, the one with the highest number of high-risk sectors for landslides was Jaboatão dos Guararapes, with 178 risk sectors.
In these sectors, the modification of slopes for the construction of houses and the removal of vegetation cover has contributed to increasing the population’s vulnerability to the occurrence of disasters involving landslides [36]. Thus, the combination of natural processes and those induced by human actions can increase the risks existing in densely populated areas. Furthermore, due to the conditions in these locations (cracks in the ground, landslide scars, among others), destructive landslide events can occur during heavy and prolonged rain (Figure 6).

3.2. Precipitation Thresholds in Jaboatão dos Guararapes

In this study, rainfall thresholds were established to assess the relevance of rainfall to landslide events recorded in Jaboatão dos Guararapes, using the relationship between the amount of accumulated rainfall of the event and its duration ED and the rainfall intensity and duration ID (Figure 7). In all, 34 rain events were identified that resulted in 88 landslide occurrences, showing that in some cases only a single rain event was responsible for more than one occurrence in the city.
The ED and ID thresholds showed that short and long-duration rain events favor the occurrence of landslides in Jaboatão dos Guararapes (Figure 7), with the greatest constancy observed in shorter periods (D ≤ 10 days) for rain events above the threshold. This observation, indicating the best association of short periods with the occurrence of landslides, had similar results for different areas subject to landslides in other regions, showing that an accumulated rainfall of 3 days is sufficient to cause instability [10,59].
Analyzing the ED graph, it was found that the accumulated precipitation of landslide events above the threshold ranged from 80 to 900 mm (Figure 7a), where the greatest amounts of accumulated rain were observed in events with longer duration. For example, the greatest amount of precipitation accumulated during a landslide event was 920 mm, in 59 days prior to the occurrence. In the case of a shorter duration event, an accumulated rainfall of 120 mm in 2 days was recorded. Regarding the ID threshold, it can be seen that the cases of landslides with longer duration had lower intensity values in relation to events with a shorter duration (Figure 7b). In addition, the intensity above the threshold ranged from 15 to 62 mm/day, with the intensity closer to 20 mm/day being the one that most contributed to the occurrence of landslides.
In both analyses, the threshold curves showed similar performance. However, the data fit the relationship between the amount of accumulated rain and the duration (ED) better, evidenced by the R2 of 0.94 (Figure 7a) and indicating that the variation in duration values explains 94% of the variation in accumulated precipitation values. According to [60], the ED thresholds’ satisfactory performance is because the two variables are not dependent on each other, unlike the ID thresholds where the rainfall intensity depends on the rainfall duration. It should be noted that it is possible to observe points below the threshold associated with landslides. In this case, other factors may have contributed to the occurrence, such as sewage systems and water leakage on the slope.

3.3. Synoptic Analysis Associated with Triggering Factors for Landslides

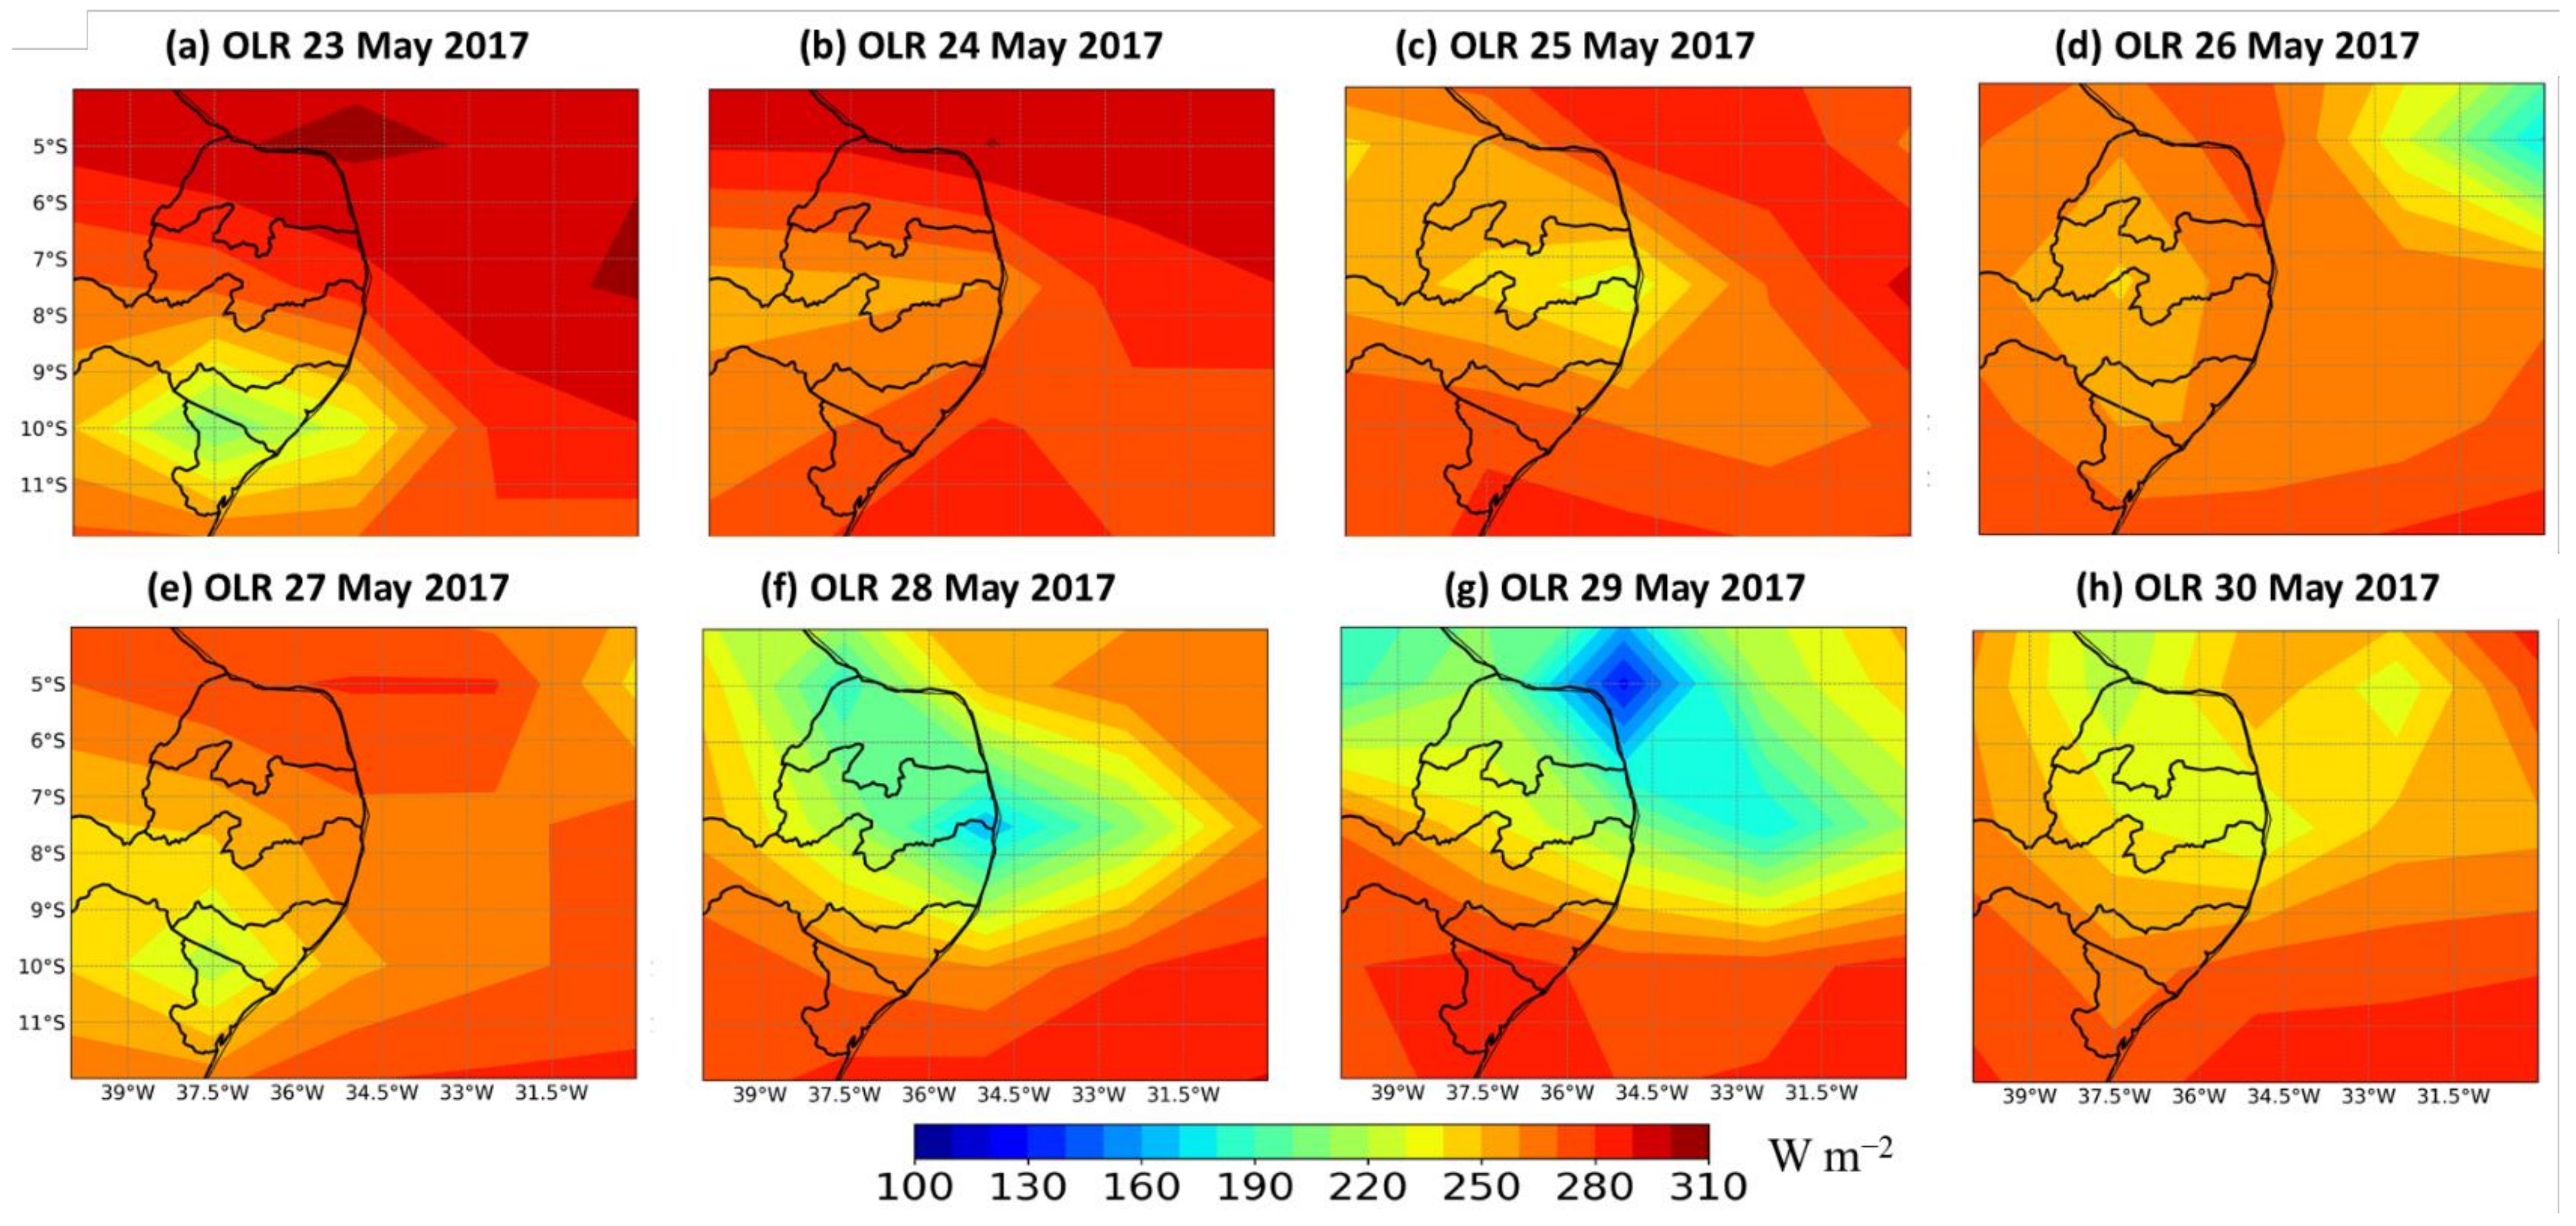
Figure 8 and Figure 9 show the OLR (W m−2) spatial variation and the temporal evolution of clouds through images from the GOES-16 satellite and the infrared channel through the brightness temperature over ECNEB. The atmospheric characteristics that occurred from 23 to 30 May indicate that there were conditions of instability since 23 May on the adjacent ocean, mainly on the State of Alagoas. The field of OLR shows an accentuated range with values below 240 W m−2 (Figure 8a), resulting in an accumulation of 22.4 mm in Maceió and 25.8 mm in Satuba (~10° S; 36° W) (Table A1). It was previously discovered that OLR ≤ 220 W m−2 is associated with deep convection over the tropics and shallow convective clouds are a characteristic of subtropical anticyclonic regions, where the OLR has values above 260 W m−2 [61].
Despite noting a decrease in cloudiness with a top of −20 °C on 24 May (Figure 9b), the convection remained actively associated with the presence of warm clouds [21] that resulted in significant accumulations of stratiform rain. The Maceió radar showed reflectivity values of about 40 dBZ (Figure 10a), indicating a moderate rain intensity. In Maceió, 90.4 mm of rain was observed in one day, and one landslide event was reported (Table A1).
On 25 May (06:00 a.m. Local Time), there was an intensification of the convective cloudiness with a cloud top temperature of near −50 °C on the coast of Pernambuco (Figure 9c). The convection remained active throughout the day, as it did at night; an extensive area with convective cloudiness over the continent was observed. In some municipalities, the daily rainfall was above 50 mm; for example, Barreiros registered 78.4 mm of rainfall and four landslide events. On 26 and 27 May (Figure 9d,e), the convective system weakened. However, there remained significant rain values in some locations (Table A1).
Beginning on 28 May, the cloudiness again intensified with an increase in the spatial extent of convection areas on the coast of Pernambuco and Paraíba (Figure 9f). The low OLR values (<200 W m−2) indicated the presence of deep atmospheric convection with a reflectivity of 45 dBZ (Figure 10c), which contributed to the high precipitation over the cities in Pernambuco with values above 100 mm in 10 municipalities (Table A1). In addition, 28 May was considered the most active day regarding landslides (21 occurrences), with Ipojuca being the most affected.
In the following days (29 and 30 May), there was a convection shift to the north of the ECNEB (Figure 9g,h), resulting in high rainfall in the State of Paraíba that caused a landslide on 29 May in João Pessoa (Table A1). This situation shows that the landslides can also be related to the accumulated rainfall from previous days, which influences the soil saturation processes [13,62].
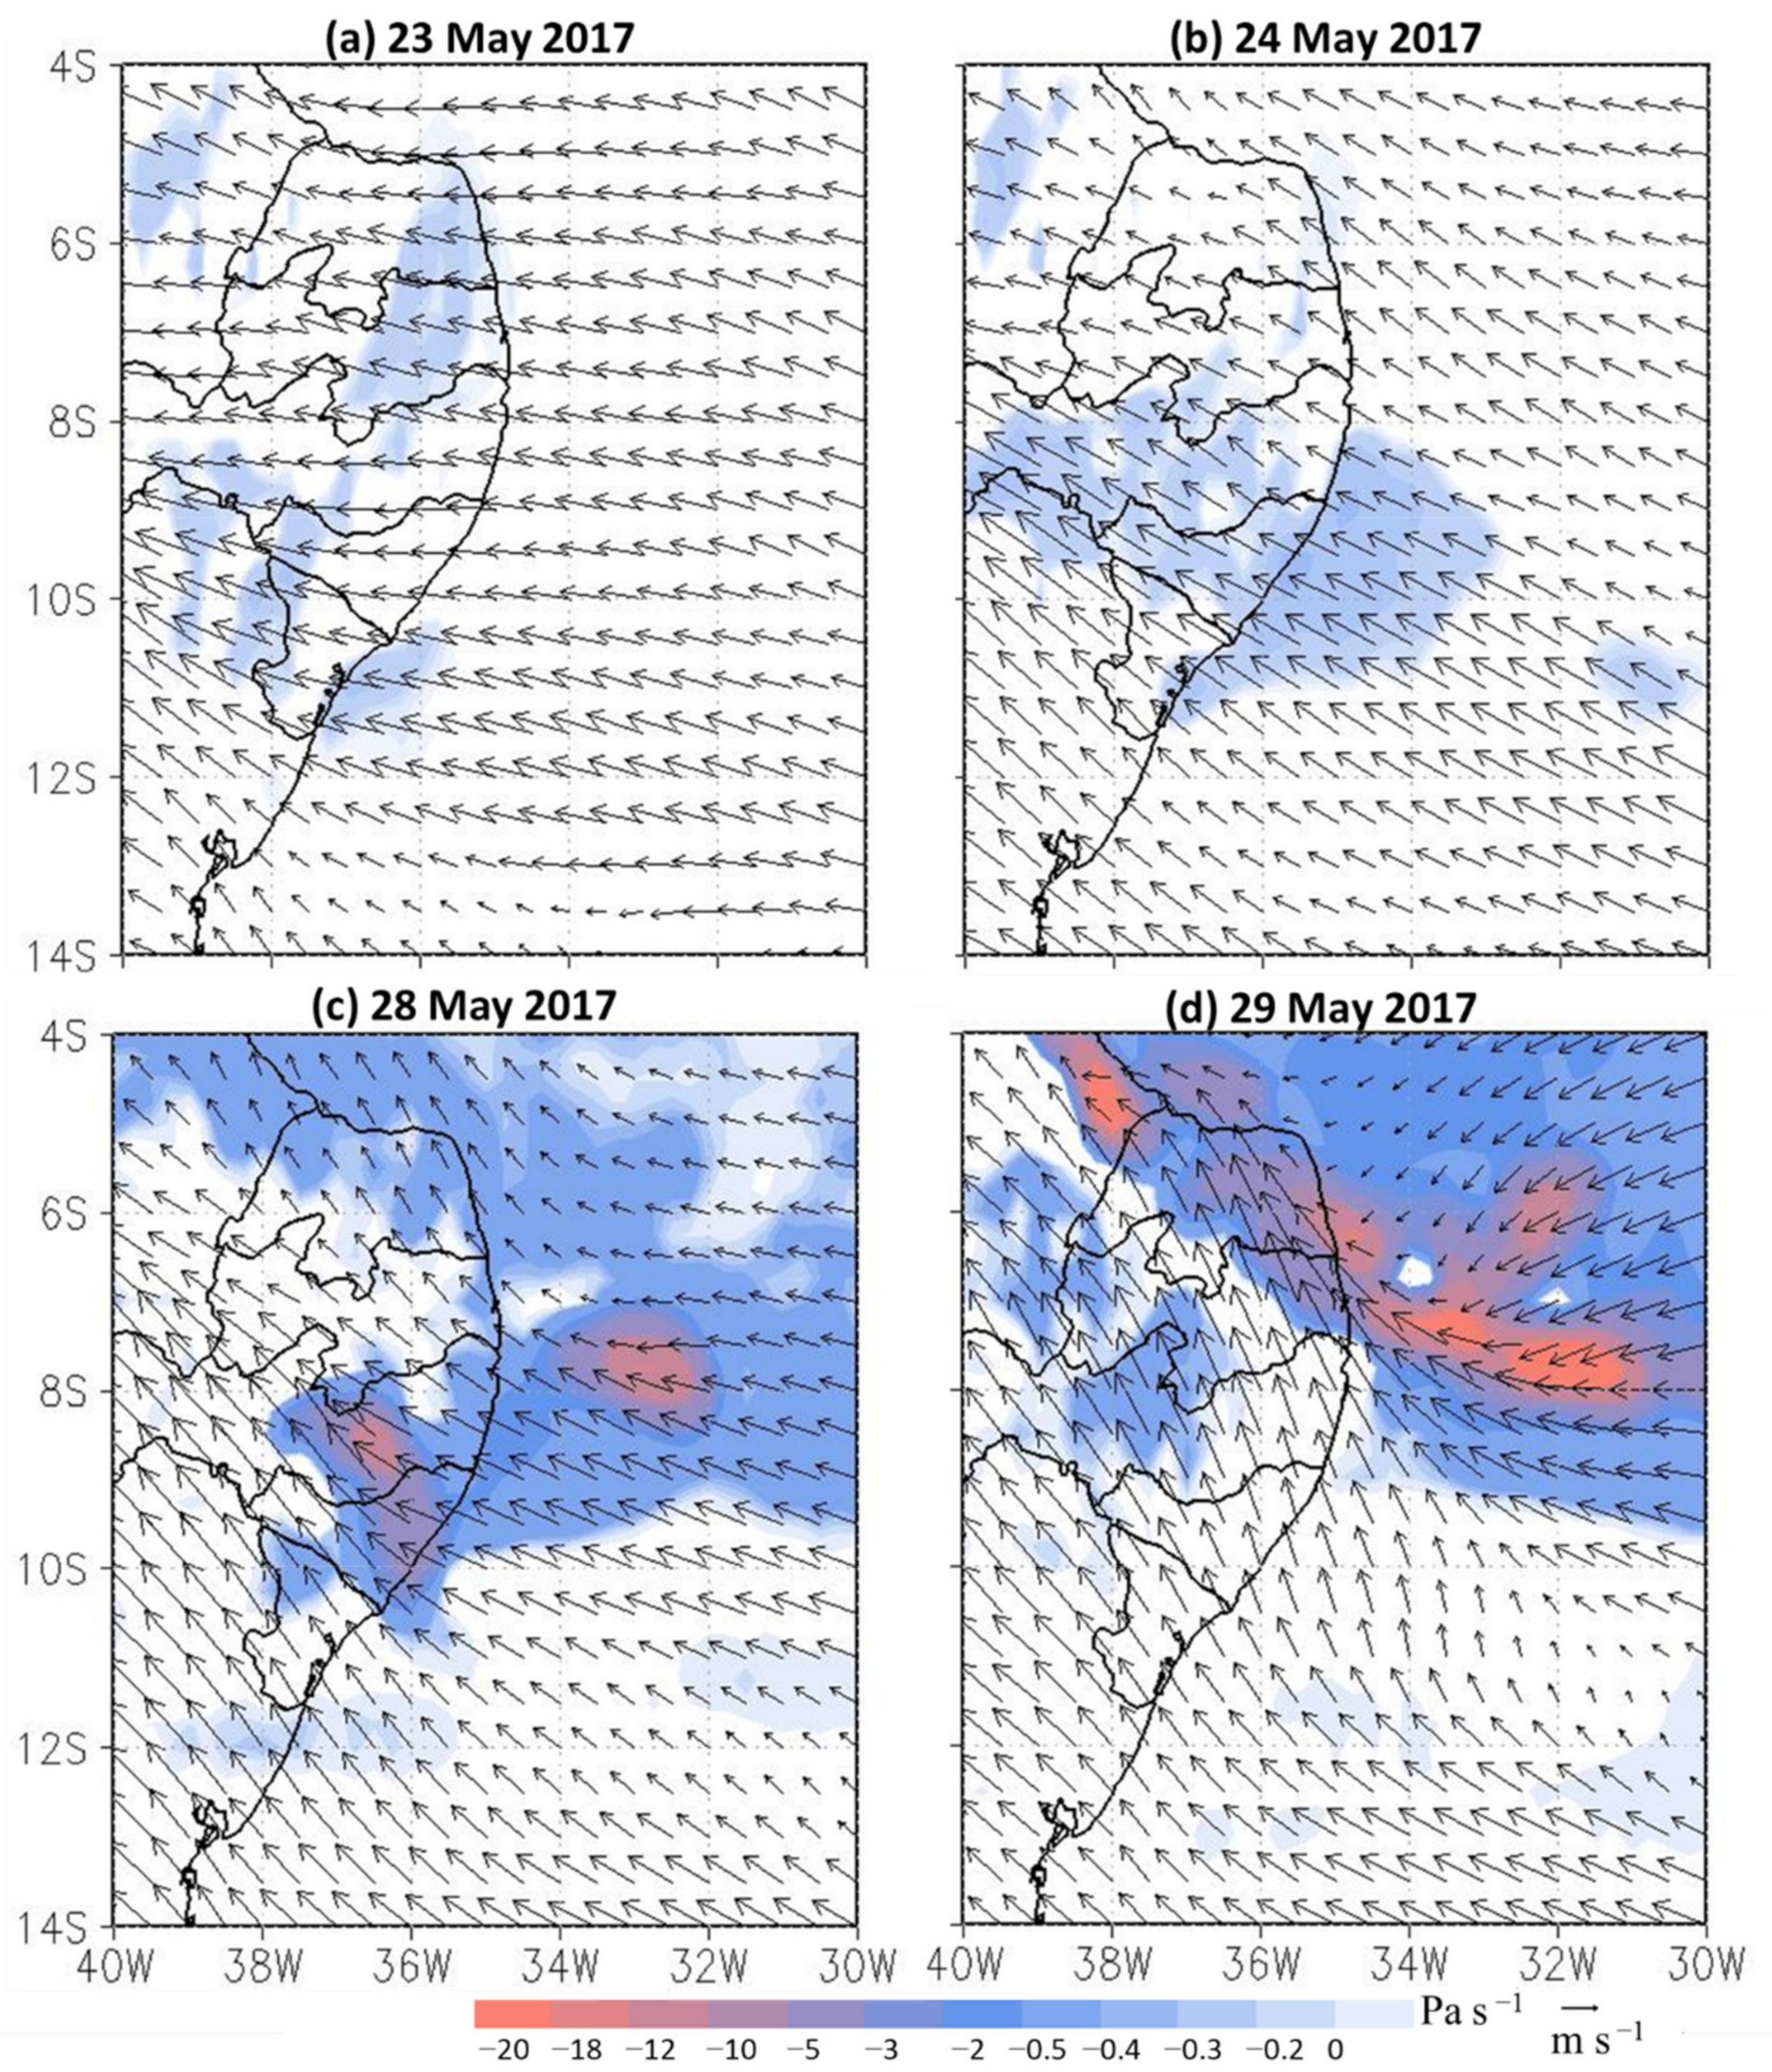
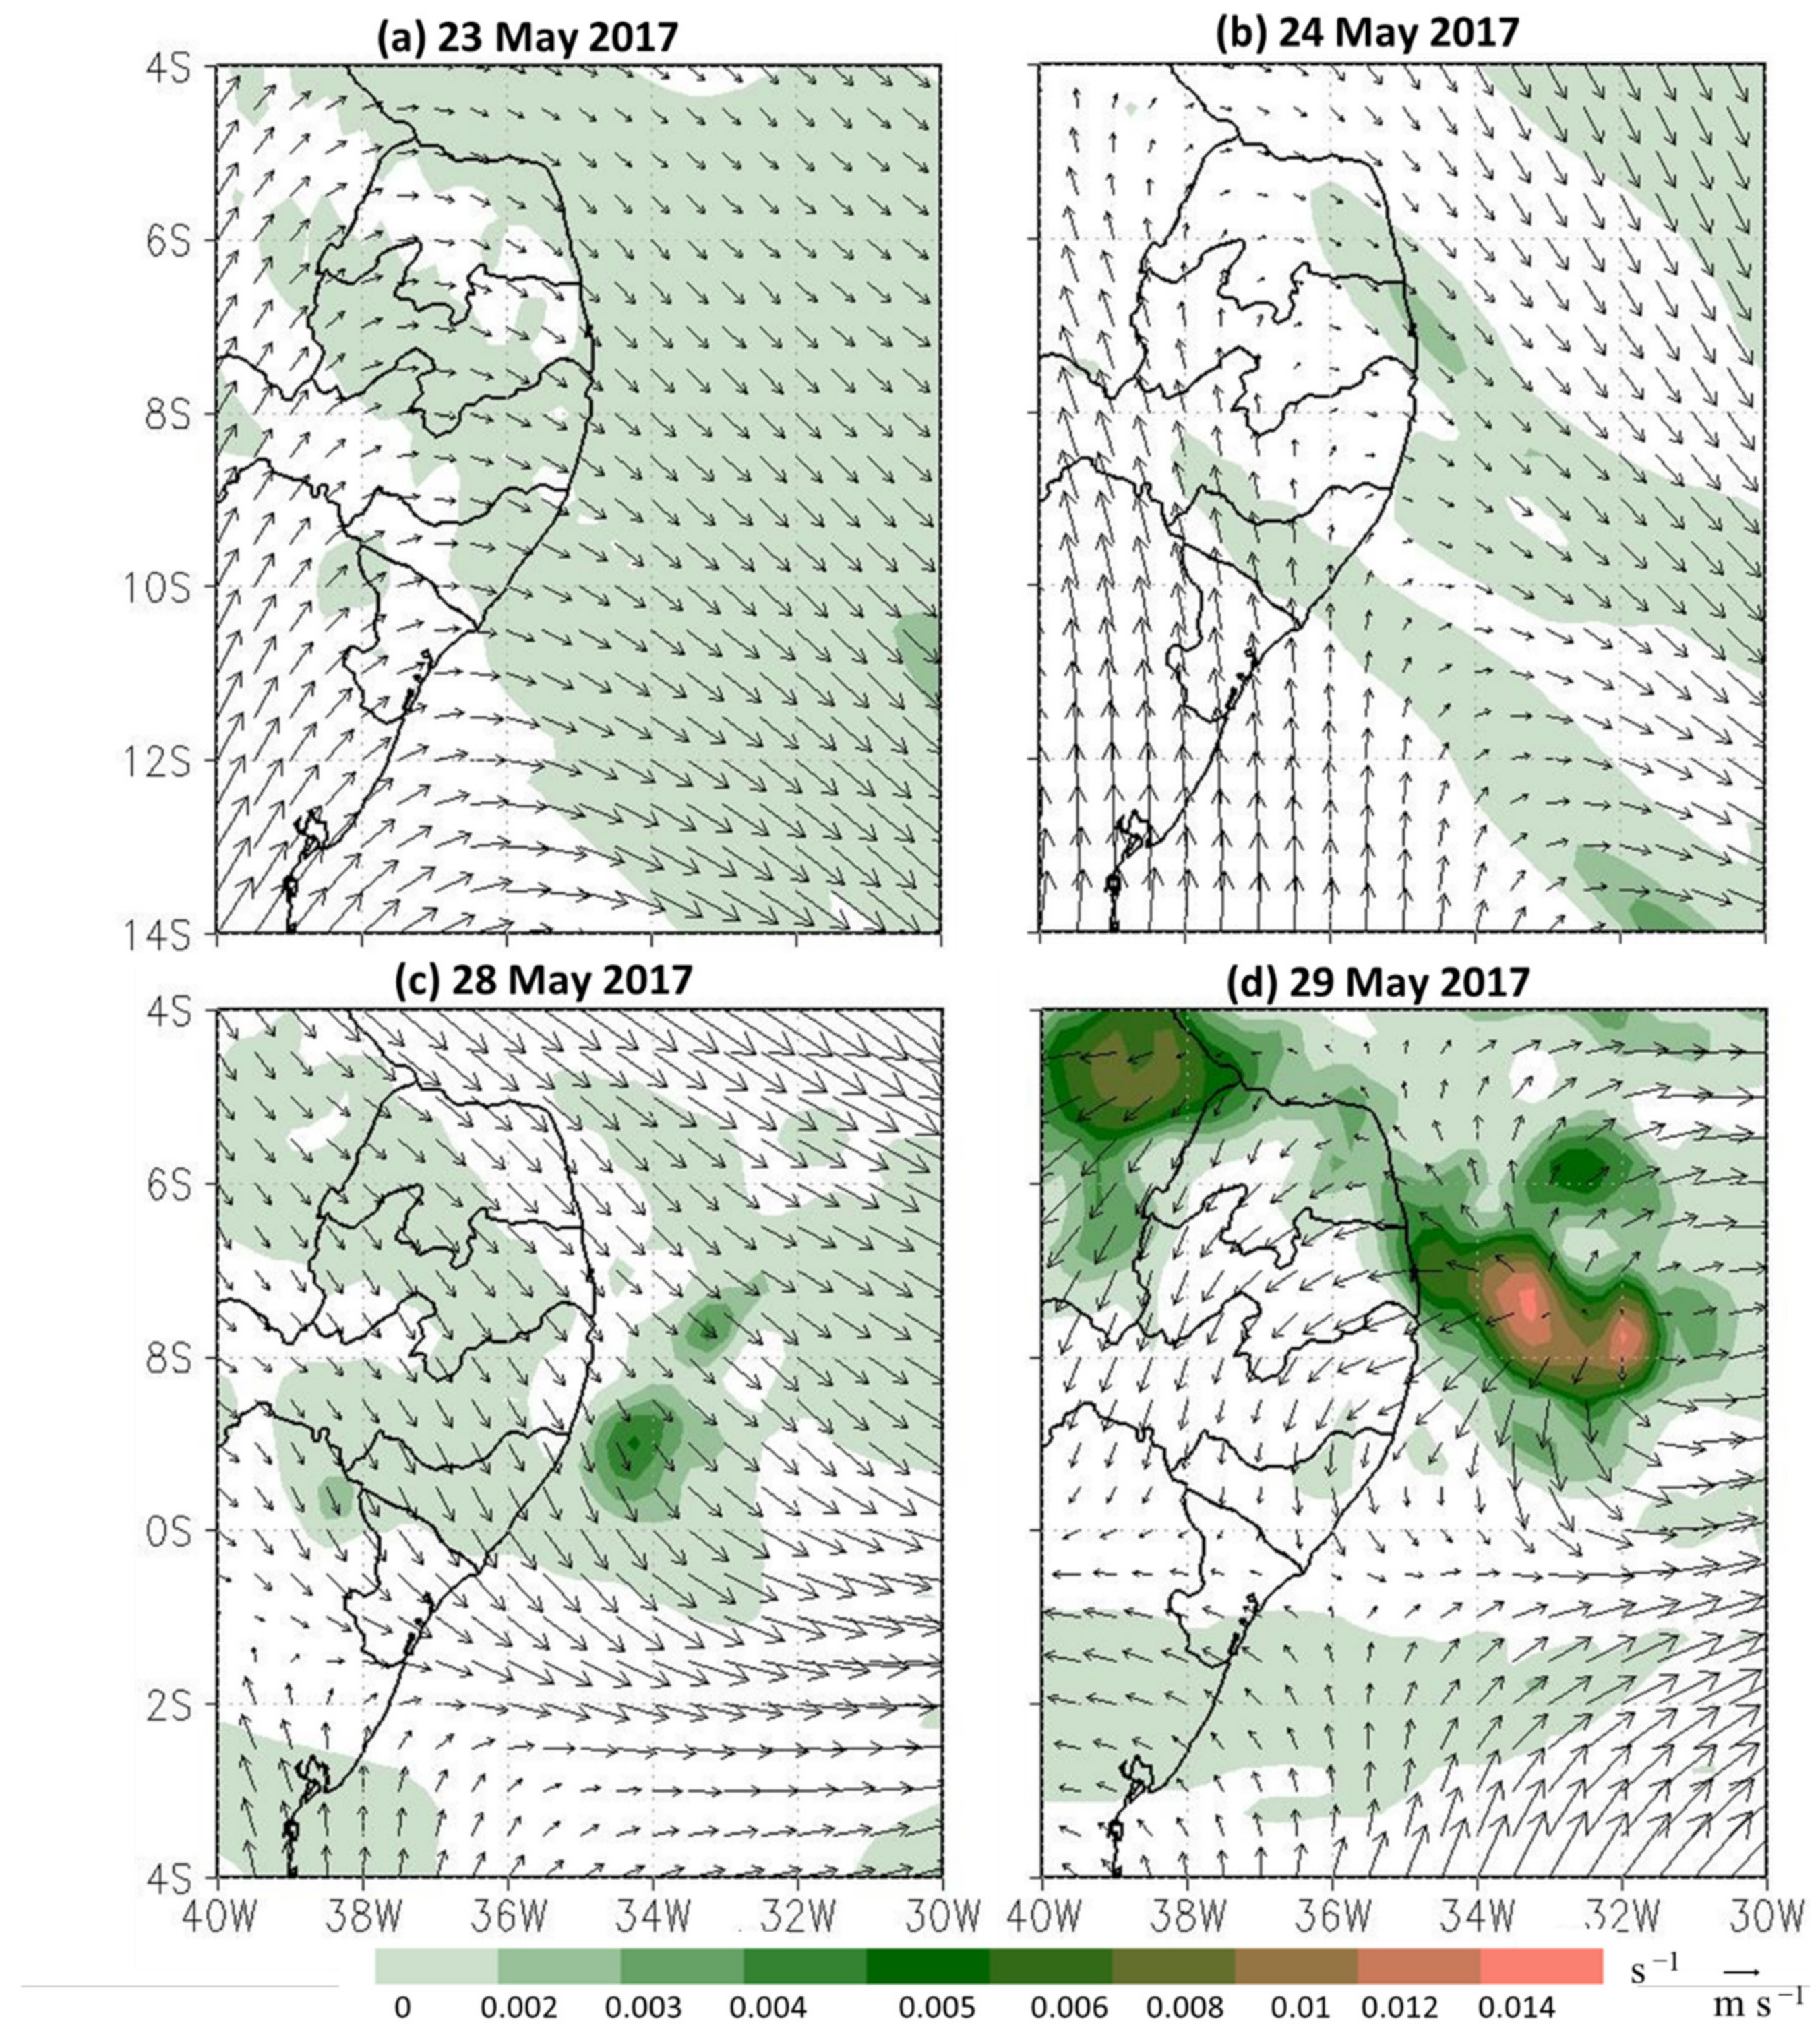
At the beginning of the convective activity at the ECNEB, areas with vertical upward movement over the Atlantic Ocean (~9° S, 32° W; 11° S, 36° W) at 500 hPa were identified (Figure 11b). In those areas, the increase in the wind vector at 850 hPa shows that the flow had accelerated towards the continent (Figure 11b). On 28 and 29 May, the regions of upward movement intensified over the adjacent ocean, where the convection areas were concentrated between latitudes 10° N and 6° S (Figure 11c,d).
Areas of instability on the surface were associated with high-level wind divergence (Figure 12). Therefore, it is possible to observe that the ECNEB was characterized by regions of ascending air and divergence at high levels, where on 23 and 24 May there was a diffluent wind flow at 200 hPa (Figure 12a,b). It was also observed that the nuclei of divergence at high levels intensified, mainly on 28 and 29 May (Figure 12c,d) due to the upward movements of moist air on the surface.
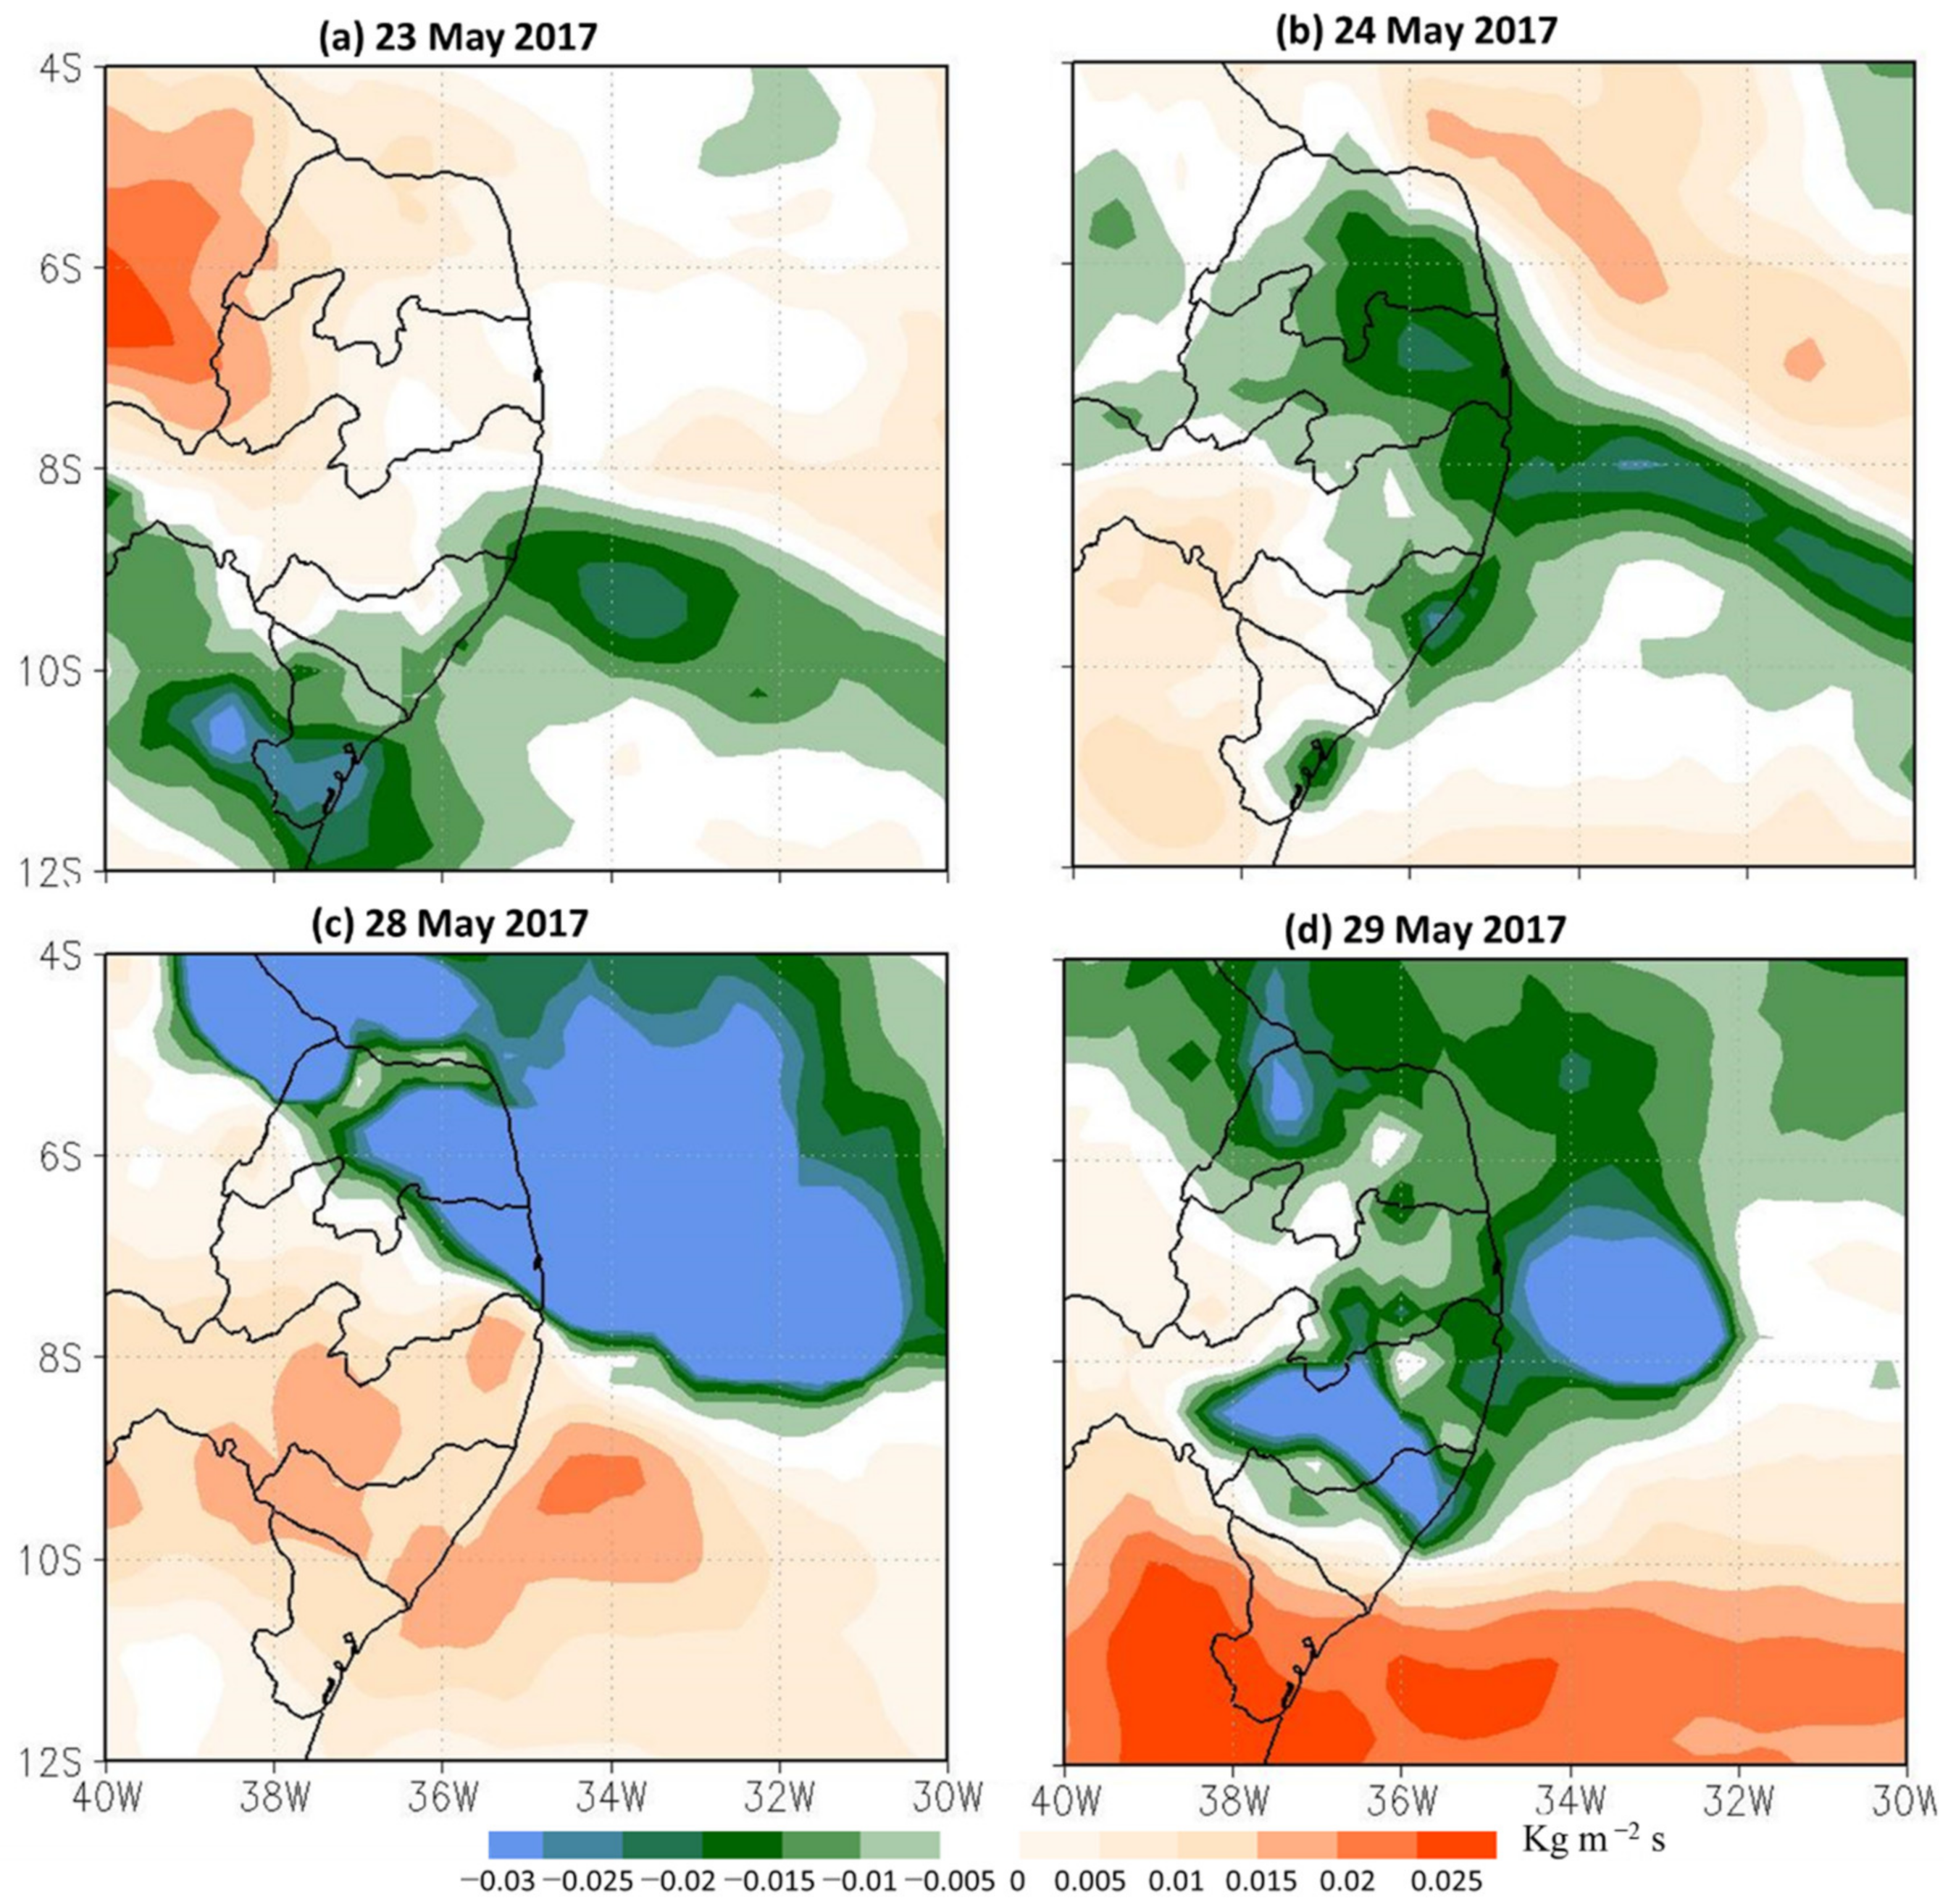
The accelerated wind flow may have favored an increase in moisture transport that was concentrated on the continent, which contributed to the instability in the last days of rain (Figure 13). This divergence pattern at high levels shows that atmospheric circulation at the ECNEB was favored by the convergence of moisture fluxes close to the surface (Figure 13c,d), resulting in significant rain during the meteorological system action.
In general, the meteorological conditions developed at the ECNEB from 23 to 31 May induced several landslides, and the cause may be due to the increase in the convergence of the ocean moisture fluxes at low levels. It is worth noting that extreme rainfall events like this at the ECNEB cannot always originate from meso- or large-scale meteorological systems that act in the region [35,63,64]. However, features related to southern autumn and winter, such as the intensification of the South Atlantic Subtropical Anticyclone, the convergence of trade winds, and daytime convection, can serve as mechanisms for forming storm clouds along the coast [65,66].

3.4. Rainfall Analysis via Numerical Modeling

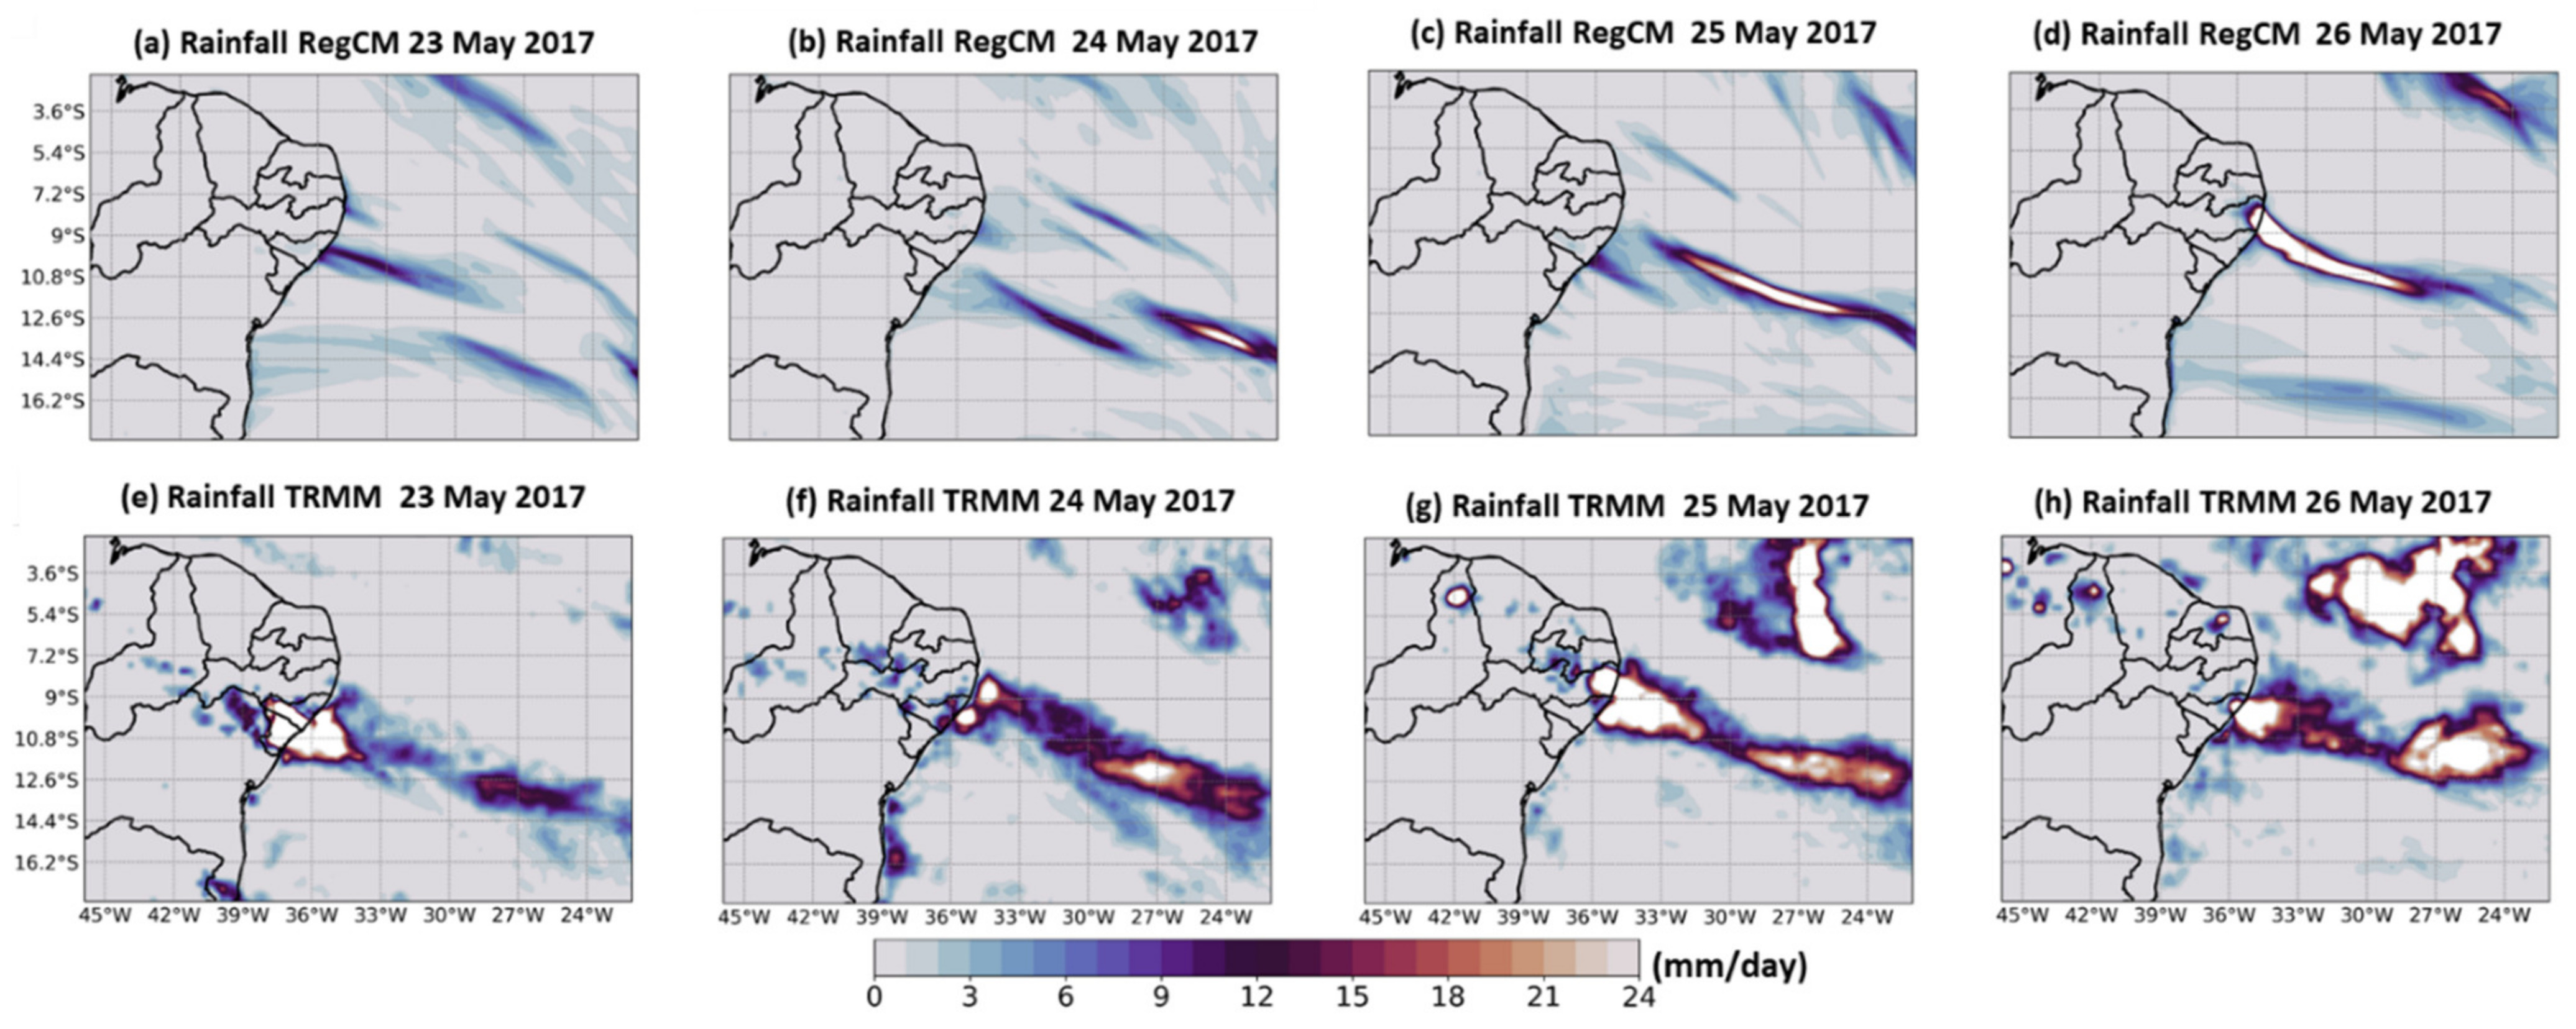
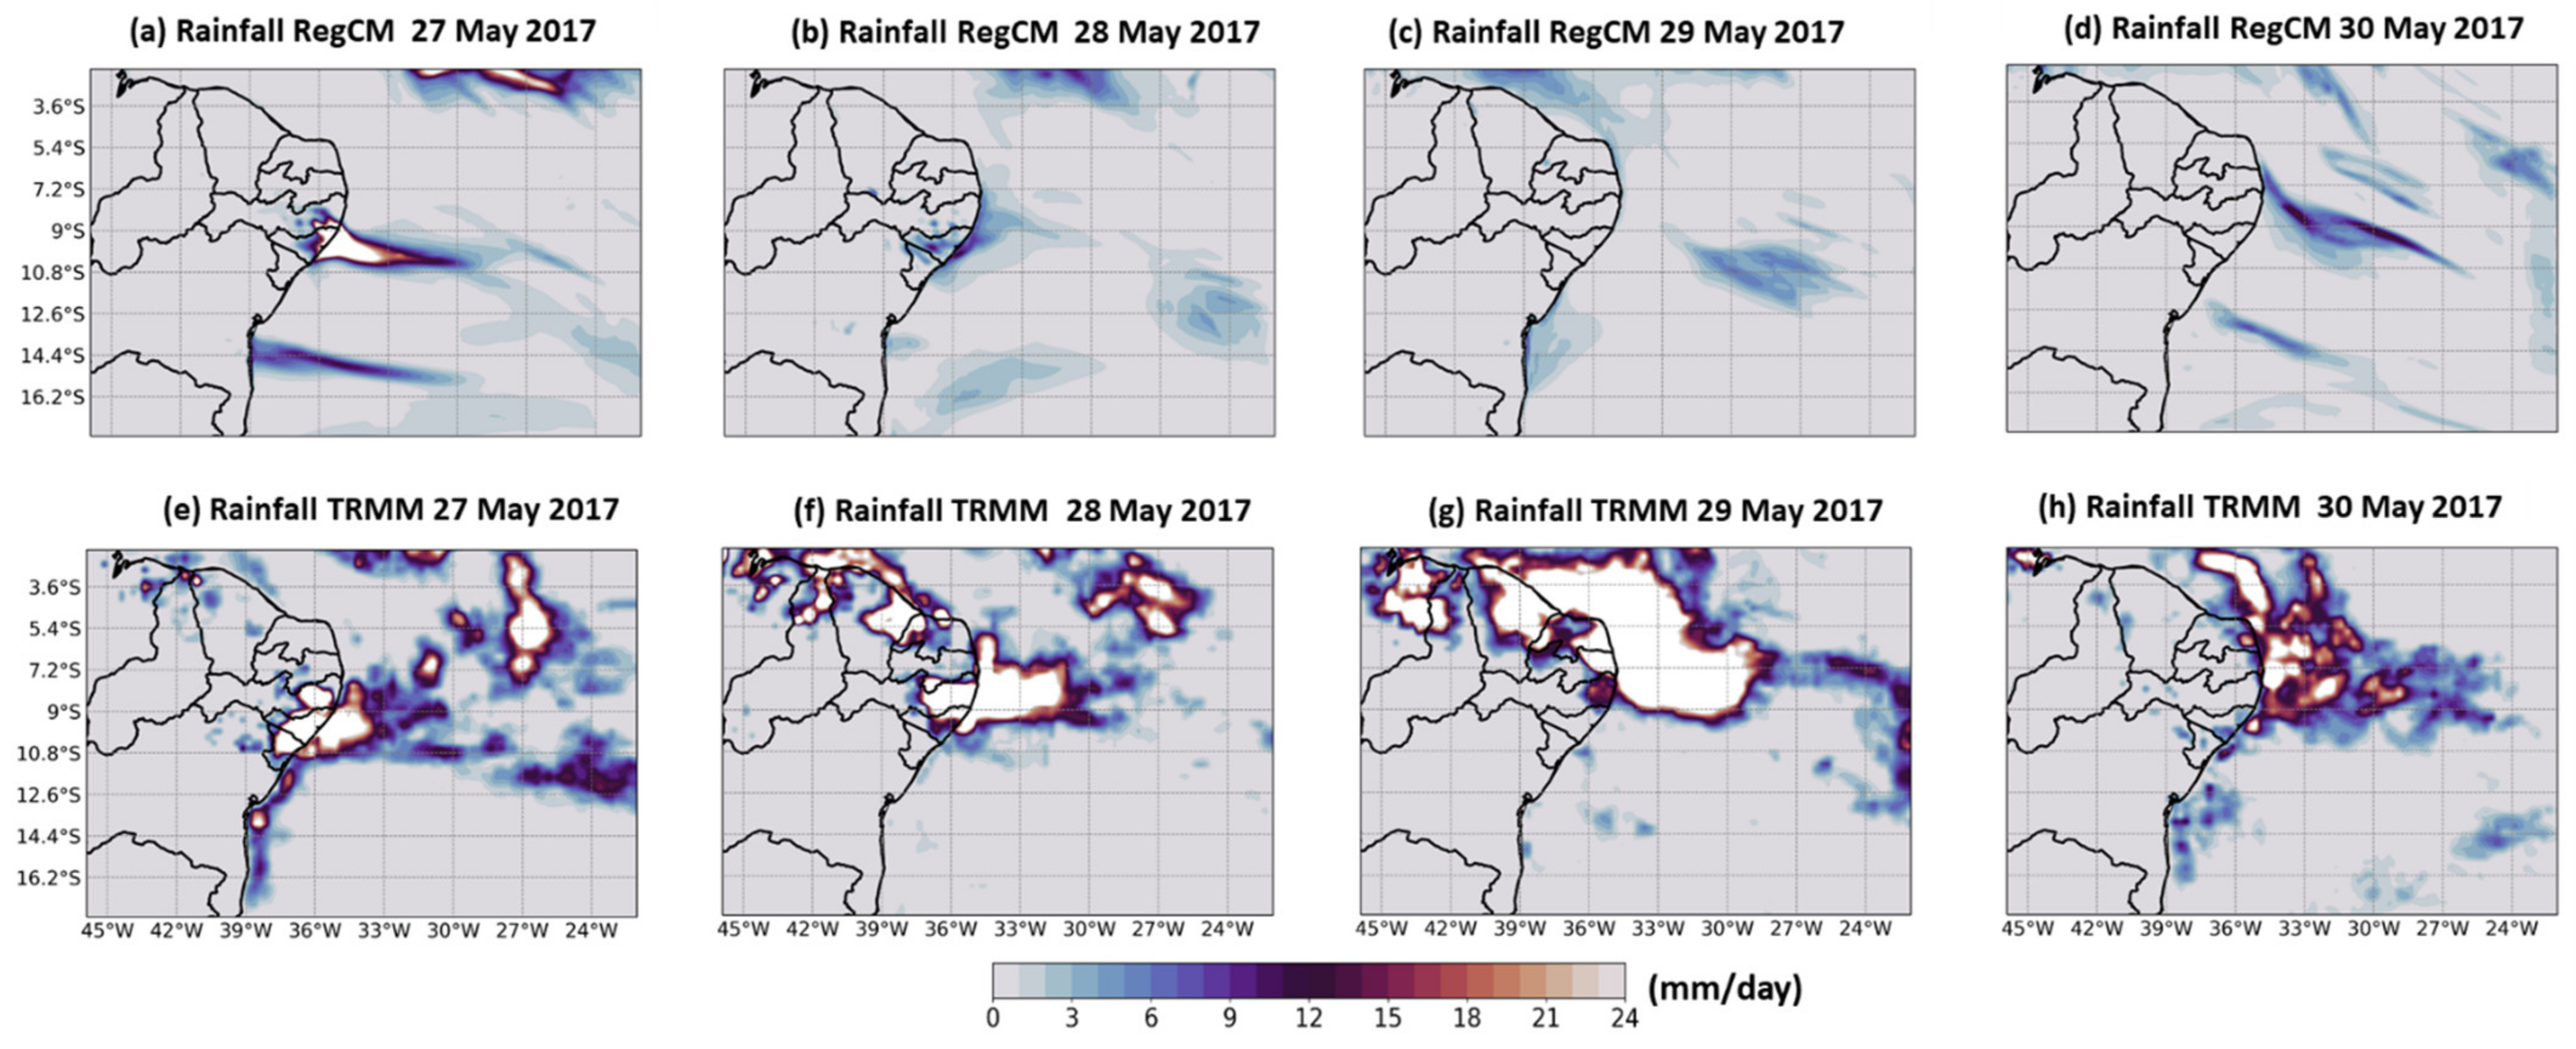
The spatial rainfall results at the ECNEB were evaluated using the RegCM regional model and compared to the rainfall estimated by the TRMM satellites 3B42v7 algorithm, which corresponds to observational data accumulated from 23 to 26 May (Figure 14) and from the 26 to 30 May (Figure 15).
It is noted that the RegCM model managed to capture the spatial pattern of rainfall over the ocean and the continent, mainly in the 7–10° S and 33–36° W sector, where the landslide events were triggered by the rain (Figure 14 and Figure 15). However, the high rainfall identified by the TRMM satellite was underestimated by the numerical simulation of RegCM, as the daily accumulated values were below 8 mm/day (Figure 14e–h and Figure 15e–h). An exception was observed on 26 and 27 May, when accumulation was found to be greater than 20 mm/day, which was in agreement with satellite observations (Figure 14h and Figure 15e).
Figure 16 presents a statistical evaluation of bias, and the root mean squared error (RMSE) of the rainfall over the ECNEB simulated by RegCM and observed through the TRMM satellite. It is possible to notice that the model underestimates precipitation during the eight days of precipitation resulting in the high accumulated rainfall. Thus, it is observed that in the domain of 7–10° S and 33–36° W, there is a negative bias core (Figure 16a) associated with the model’s performance during the simulation, where the biggest deviations in relation to observation according to the RMSE estimates (above 50 mm/day) are also seen (Figure 16b).
From 28 May (Figure 15f), it was found that the areas with daily rainfall above 20 mm/day were concentrated on the northern part of the NEB (above 5° S) and were more evidenced by the TRMM satellite. In this sense, it is seen that RegCM was deficient in simulating these maximum volumes, mainly from 28 to 30 May (Figure 15b–d). Furthermore, studies that previously evaluated the performance of simulations in the scope of regional climate on NEB [67] showed that this model might present inaccuracies in simulating the aspects of positioning and intensity of rainfall associated with large-scale dynamics as in the area of the ITCZ [68]. Thus, it is possible that in the area north of the NEB, the daily rainfall is underestimated during the simulations, which can be associated with potential inaccuracies in their cumulus parameterization options for the equatorial region.
In general, the simulations with the RegCM model had a moderate performance regarding the spatial representation of the rainfall that occurred at the ECNEB due to difficulties in capturing rainfall intensity associated with the meteorological system acting in the region. However, as extreme rainfall leads to an increase in landslides [11,69], there must be methodologies and tools that can predict the atmospheric conditions associated with these cases to help in decision-making to mitigate these effects. Thus, after performing parametric and sensitivity tests, simulations with the RegCM model on a regional scale may appear as an alternative to predict in advance these events of heavy rainfall on the ECNEB.

4. Conclusions

This study evaluated an extreme rain event that caused several landslides in the ECNEB in May 2017 and showed that the region needs actions that can increase the ability to predict the threat of landslides triggered by rain. The investigation of the conditioning factors intrinsic to the terrain, elevation, slope, and susceptibility maps, allowed the identification of the most vulnerable areas to this kind of disaster in the ECNEB. It was verified that the State of Pernambuco presented the greatest vulnerability to landslides induced by extreme rainfall events in the region. The precipitation thresholds calculated in the study highlight the importance of analyzing the daily precipitation and the accumulated rain from previous days, mainly from the last 10 days before landslides. Precipitation thresholds will help guide the disaster management in the state to establish the minimum rainfall conditions responsible for triggering landslides and could serve as a reference for future analyses. Thus, this relationship between precipitation and landslides may help to structure a monitoring and early warning system for this type of threat.
An investigation of the meteorological aspects showed well-known atmospheric circulation patterns within the ECNEB regional dynamic climatology, which can be predicted by regional numerical models a few days in advance. However, it was observed that the regional model RegCM had a moderate performance in the ECNEB and underestimated rainfall intensity. Thus, it is suggested that new parametric tests be performed to improve the quality of the atmospheric representation in the ECNEB.
Finally, analyzing the relationship between landslides and precipitation via empirical studies can help to determine critical rainfall parameters that can serve as tools in geo-hydrological risk management, enhancing disaster prevention and mitigation actions. In addition, the integration of reanalysis data, satellite and weather radar database, and regional numerical models can help improve the quality of predictive data for the effective management of landslide monitoring and warning systems in the ECNEB.

Author Contributions

Conceptualization, N.S.E. and C.A.C.d.S.; Data curation, C.A.C.d.S., H.B.G. and R.R.F.; Formal analysis, N.S.E., C.A.C.d.S., M.T.S., C.P.d.O., J.M., J.G., V.E.A., C.A.G.S. and M.M.; Funding acquisition, C.A.C.d.S.; Investigation, N.S.E. and C.A.C.d.S.; Methodology, N.S.E., M.T.S, H.B.G., R.R.F., M.L.d.S., C.M.S.e.S., C.P.d.O. and M.M.; Project administration, C.A.C.d.S.; Software, N.S.E.; Supervision, C.A.C.d.S.; Validation, J.M. and J.G.; Writing—original draft, N.S.E., H.B.G. and R.R.F.; Writing—review & editing, N.S.E., C.A.C.d.S., M.T.S., H.B.G., R.R.F., M.L.d.S., C.M.S.e.S., C.P.d.O., J.M., J.G., V.E.A., C.A.G.S. and M.M. All authors have read and agreed to the published version of the manuscript.

Funding

The authors would like to thank the Coordination for the Improvement of Higher Education Personnel (CAPES) for the scholarship provided to the first author (Process No. 88882.145747/2017-01) linked to the Pro-Alerts—Finance Code 001 (Grant Nos. 88887.091737/2014-01 and 88887.123949/2015-00). The second author acknowledges the National Council for Scientific and Technological Development (CNPq) for the Research Productivity Grant (Process No. 304493/2019-8).

Institutional Review Board Statement

Not applicable.

Informed Consent Statement

Not applicable.

Data Availability Statement

CPRM data is available from http://geoportal.cprm.gov.br (accessed on 20 April 2020). SRTM v4.1 data is available from http://cgiarcsi.community/ (accessed on 15 May 2020). ERA5 reanalysis da-ta is available from https://cds.climate.copernicus.eu/ (accessed on 27 February 2020). CEMADEN rainfall stations data can be accessed from the http://cemaden.gov.br/mapainterativo/ (accessed on 10 June 2020). Satellite images is available from http://satelite.cptec.inpe.br/home/index.jsp (accessed on 2 February 2020). TRMM data can be accessed from the https://giovanni.gsfc.nasa.gov (accessed on 30 March 2020). ECMWF reanalysis data is available from http://climadods.ictp.it/regcm4/EIN15 (accessed on 17 January 2021). Other data presented in this study are available on request from the corresponding author.

Acknowledgments

We are also grateful to the National Center for Monitoring and Natural Disaster Alerts (CEMADEN) for obtaining meteorological and landslide data.

Conflicts of Interest

The authors declare no conflict of interest.

Appendix A

Table A1. Accumulated daily rainfall (mm) recorded by CEMADEN rain gauges from 24 to 31 May 2017. Values in parentheses correspond to landslide events.
City05/2305/2405/2505/2605/2705/2805/2905/3005/31Total (mm)
Barra de Guabiraba7.213.053.68.573.8169.6 (1)3.81.68.0331.9
Barreiros12.139.078.5 (4)22.078.2121.31.61.440.4382.4
Cortês5.317.952.914.899.9158.0 (5)2.61.821.2369.0
Escada7.741.732.210.151.8120.2 (1)3.60.446.8307.4
Gameleira6.520.767.215.499.9221.8 (1)0.24.532.1461.8
Ipojuca10.270.942.67.936.6182.0 (8)4.6 (15)2.4 (11)59.5 (10)406.5
Jaboatão dos Guararapes021.922.60.625.738.045.1 (6)1.8103.4259.1
Jaqueira1.419.938.014.053.9144.5 (1)2.66.19.7288.7
João Pessoa0000018.4126.2 (1)4.82.4151.8
Maceió22.490.4 (1)23.4112.282.454.2 (1)0.86.825.6395.8
Palmares3.419.444.316.474.3130.5 (1)2.42.612.5302.4
Recife1.09.517.9 1.09.238.051.53.666.2 (1)203.2
Rio Formoso21.129.699.8 25.094.3298.3 (1)5.40.860.3613.8
Satuba25.884.524.9136.5106.6 (1)20.41.47.345.6453.0
Sirinhaém20.461.157.913.223.4288.2 (1)3.76.966.2520.6

References

  1. Intergovernmental Panel on Climate Change (IPCC). Climate Change 2013–The Physical Science Basis: Working Group I Contribution to the Fifth Assessment Report of the Intergovernmental Panel on Climate Change; Cambridge University Press: Cambridge, UK, 2014. [Google Scholar] [CrossRef]
  2. Donat, M.G.; Lowry, A.L.; Alexander, L.V.; O’Gorman, P.A.; Maher, N. More extreme precipitation in the world’s dry and wet regions. Nat. Clim. Chang. 2016, 6, 508–513. [Google Scholar] [CrossRef]
  3. Gariano, S.L.; Guzetti, F. Landslides in a changing climate. Earth Sci. Rev. 2016, 162, 227–252. [Google Scholar] [CrossRef] [Green Version]
  4. Instituto Brasileiro de Geografia e Estatística (IBGE). Perfil dos Municípios Brasileiros: 2018; IBGE: Rio de Janeiro, Brazil, 2019. [Google Scholar]
  5. Barbieri, A.F.; Domingues, E.; Queiroz, B.L.; Ruiz, R.M.; Rigotti, J.I.; Carvalho, J.A.M.; Resende, M.F. Climate change and population migration in Brazil’s Northeast: Scenarios for 2025–2050. Popul. Environ. 2010, 31, 344–370. [Google Scholar] [CrossRef]
  6. Amaral, E.F.L. Brazil: Internal migration. Encycl. Glob. Hum. Migr. 2013, 1–7. [Google Scholar] [CrossRef]
  7. Assis, M.C.A.; Saito, S.M.; Alvalá, R.C.S.; Stenner, C.; Pinho, G.; Nobre, C.A.; Fonseca, M.R.S.; Santos, C.; Amadeu, P.; Silva, D.; et al. Estimation of exposed population to landslides and floods risk areas in Brazil, on an intra-urban scale. Int. J. Disaster Risk Reduct. 2018, 31, 449–459. [Google Scholar] [CrossRef]
  8. Highland, L.M.; Bobrowsky, P. The Landslide Handbook—A Guide to Understanding Landslides; United States Geological Survey: Reston, VA, USA, 2008. [Google Scholar] [CrossRef]
  9. Centro Universitário de Estudos e Pesquisas sobre Desastres (CEPED). Atlas Brasileiro de Desastres Naturais: 1991 a 2012, Volume Brasil; Universidade Federal de Santa Catarina: Florianópolis, Brazil, 2013. [Google Scholar]
  10. Bandeira, A.P.N.; Coutinho, R.Q. Critical rainfall parameters: Proposed landslide warning system for the metropolitan region of Recife, PE, Brazil. Soil Rocks 2015, 38, 27–48. [Google Scholar]
  11. Comin, A.N.; Justino, F.; Pezzi, L. Extreme rainfall event in the Northeast coast of Brazil: A numerical sensitivity study. Meteorol. Atmos. Phys. 2021, 133, 141–162. [Google Scholar] [CrossRef]
  12. Ávila, A.; Justino, F.; Wilson, A.; Bromwich, D.; Amorim, M. Recent precipitation trends, flash foods and landslides in southern Brazil. Environ. Res. Lett. 2017, 11, 1–13. [Google Scholar] [CrossRef]
  13. Metodiev, D.; Andrade, M.R.M.; Mendes, R.M.; Moraes, M.A.E.; Konig, T.; Bortolozo, C.A.; Bernardes, T.; Luiz, R.A.F.; Coelho, J.O.M. Correlation between rainfall and mass movements in north coast region of São Paulo State, Brazil for 2014–2018. Int. J. Geosci. 2018, 9, 669–679. [Google Scholar] [CrossRef] [Green Version]
  14. Coutinho, R.Q.; Lucena, R.; Henrique, H.M. Disaster risk governance: Institutional vulnerability assessment with emphasis on non-structural measures in the municipality of Jaboatão dos Guararapes, Pernambuco (PE), Brazil. Disaster Prev. Manag. 2020, 29, 1–33. [Google Scholar] [CrossRef]
  15. Instituto Brasileiro de Geografia e Estatística (IBGE). População em Áreas de Risco Brasil; IBGE: Rio de Janeiro, Brazil, 2018. [Google Scholar]
  16. Naidu, S.; Sajinkumar, K.S.; Oommen, T.; Anuja, V.J.; Samuel, R.A.; Muraleedharan, C. Early warning system for shallow landslides using rainfall threshold and slope stability analysis. Geosci Front. 2018, 9, 1871–1882. [Google Scholar] [CrossRef]
  17. Marchezini, V.; Mourão, C.; Scofield, G.; Metodiev, D.; Flores, S.S.L. Sistemas comunitários de alerta de risco de desastres associados a inundações e deslizamentos: Aspectos teóricos e metodológicos. Rev. Estud. Latinoam. Sobre Reducción Riesgo Desastres 2020, 4, 36–56. [Google Scholar]
  18. Segoni, S.; Piciullo, L.; Gariano, S.L. A review of the recent literature on rainfall thresholds for landslide occurrence. Landslides 2018, 15, 1483–1501. [Google Scholar] [CrossRef]
  19. Moura, A.D.; Shukla, J. On the dynamics droughts in Northeast Brazil: Observations, theory and numerical experiments with a general circulation mode. J. Atmos. Sci. 1981, 38, 2653–2675. [Google Scholar] [CrossRef] [Green Version]
  20. Oliveira, P.T.; Santos e Silva, C.M.; Lima, K.C. Climatology and trend analysis of extreme precipitation in subregions of Northeast Brazil. Theor. Appl. Climatol. 2016, 130, 77–90. [Google Scholar] [CrossRef]
  21. Palharini, R.S.A.; Vila, D.A. Climatological behavior of precipitating clouds in the Northeast region of Brazil. Adv. Meteorol. 2017, 2017, 1–12. [Google Scholar] [CrossRef]
  22. Damasceno, A.D.O.; Cardoso, A. Discussão sobre limiares críticos de precipitação na gestão de riscos a movimentos de massa no Brasil. In Proceedings of the 16th Congresso Nacional de Geotecnia, Ponta Delgada, Portugal, 27–30 May 2018; pp. 1–13. [Google Scholar]
  23. Peulvast, J.P.; Sales, V.C.; Bezerra, F.H.R.; Betard, F. Landforms and Neotectonics in the Equatorial Passive Margin of Brazil. Geo. Acta 2006, 19, 51–71. [Google Scholar] [CrossRef]
  24. Junior, E.P. Industrial dynamics and urbanization in the Northeast of Brazil. Mercator 2015, 14, 63–81. [Google Scholar] [CrossRef]
  25. Rao, V.B.; Lima, M.C.; Franchito, S.H. Seasonal and interannual variations of rainfall over eastern Northeast Brazil. J. Clim. 1993, 6, 1754–1763. [Google Scholar] [CrossRef]
  26. Grimm, A.M.; Tedeschi, R.G. ENSO and extreme rainfall events in South America. J. Clim. 2009, 22, 1589–1609. [Google Scholar] [CrossRef]
  27. Painel Brasileiro de Mudanças Climáticas (PBMC). 2014–Base Científica das Mudanças Climáticas. Contribuição do Grupo de Trabalho 1 do Painel Brasileiro de Mudanças Climáticas ao Primeiro Relatório de Avaliação Nacional Sobre Mudanças Climáticas; Universidade Federal do Rio de Janeiro: Rio de Janeiro, Brazil, 2014. [Google Scholar]
  28. Gomes, H.B.; Ambrizzi, T.; Herdies, D.L.; Hodges, K.; Silva, B.F.P.; Dias, P.L.S.; Silva, M.C.L.; Gomes, H. Climatology of easterly wave disturbances over the tropical South Atlantic. Clim. Dyn. 2019, 53, 1393–1411. [Google Scholar] [CrossRef] [Green Version]
  29. Kousky, V.E. Frontal influences on Northeast Brazil. Mon. Weather Rev. 1979, 107, 1140–1153. [Google Scholar] [CrossRef] [Green Version]
  30. Utida, G.; Cruz, F.; Etourneau, J.; Bouloubassi, I.; Schefuß, E.; Vuille, M.; Novello, V.F.; Prado, L.F.; Sifeddine, A.; Klein, V. Tropical South Atlantic influence on Northeastern Brazil precipitation and ITZC displacement during the past 2300 years. Sci. Rep. 2019, 9, 1–8. [Google Scholar] [CrossRef]
  31. Repinaldo, H.F.B.; Fedorova, N.; Levit, S.W.; Repinaldo, C.R.R. Upper Tropospheric Cyclonic Vortex and Brazilian Northeast Jet Stream over Alagoas State: Circulation patterns and rainfall. Rev. Bras. Meteorol. 2020, 35, 745–754. [Google Scholar] [CrossRef]
  32. Lyra, M.J.A.; Fedorova, N.; Levit, S.W.; Freitas, I.G.F. Características dos Complexos Convectivos de Mesoescala. Rev. Bras. Meteorol. 2020, 35, 727–734. [Google Scholar] [CrossRef]
  33. Santos, A.H.M.; Aragão, M.R.S.; Correia, M.F.; Araujo, H.A.; Silva, A.B. Distúrbio Ondulatório de Leste e seus impactos na cidade de Salvador. Rev. Bras. Meteorol. 2012, 27, 355–364. [Google Scholar] [CrossRef] [Green Version]
  34. Machado, C.C.C.; Nóbrega, R.S.; Oliveira, T.H.; Alves, K.M.A.S. Distúrbio Ondulatório de Leste como condicionante a eventos extremos de precipitação em Pernambuco. Rev. Bras. Climatol. 2012, 8. [Google Scholar] [CrossRef] [Green Version]
  35. Neves, D.J.D.; Alcântara, C.R.; Souza, E.P. Estudo de caso de um distúrbio ondulatório de leste sobre o Estados do Rio Grande do Norte, Brasil. Rev. Bras. Meteorol. 2016, 31, 490–505. [Google Scholar] [CrossRef] [Green Version]
  36. Debortoli, N.S.; Camarinha, P.I.M.; Marengo, J.A.; Rodrigues, R.R. An index of Brazil’s vulnerability to expected increases in natural flash flooding and landslide disasters in the context of climate change. Nat. Hazards 2017, 86, 557–582. [Google Scholar] [CrossRef]
  37. Instituto Brasileiro de Geografia e Estatística (IBGE). Suscetibilidade a Deslizamentos do Brasil: Primeira Aproximação; IBGE: Rio de Janeiro, Brazil, 2019. [Google Scholar]
  38. Jarvis, A.; Reuter, H.I.; Nelson, A.; Guevara, E. Hole-Filled SRTM for the Globe Version 4. CGIAR-CSI SRTM 90 m Database. 2008. Available online: http://srtm.csi.cgiar.org/ (accessed on 7 March 2021).
  39. Guzetti, F.; Peruccacci, S.; Rossi, M.; Stark, C.P. Rainfall thresholds for the initiation of landslides in Central and Southern Europe. Meteorol. Atmos. Phys. 2007, 98, 239–267. [Google Scholar] [CrossRef]
  40. Hersbach, H.; Bell, B.; Berrisford, P.; Berrisford, P.; Hirahara, S.; Horányi, A.; Muñoz-Sabater, J.; Nicolas, J.; Peubey, C.; Radu, R.; et al. The ERA5 global reanalysis. Q. J. R. Meteorol. Soc. 2020, 146, 1999–2049. [Google Scholar] [CrossRef]
  41. Kummerow, C.; Simpson, J.; Thiele, O.; Barnes, W.; Chang, A.S.; Adler, R.; Olson, W.S. The status of the tropical rainfall measuring mission (TRMM) after two years in orbit. J. Appl. Meteorol. 2000, 39, 1965–1982. [Google Scholar] [CrossRef]
  42. Santos, C.A.G.; Brasil Neto, R.M.; da Silva, R.M.; Santos, D.C. Innovative approach for geospatial drought severity classification: A case study of Paraíba state, Brazil. Stoch. Environ. Res. Risk Assess. 2019, 33, 545–562. [Google Scholar] [CrossRef] [Green Version]
  43. Santos, C.A.G.; Brasil Neto, R.M.; da Silva, R.M.; Costa, S.G.F. Cluster analysis applied to spatiotemporal variability of monthly precipitation over Paraíba state using Tropical Rainfall Measuring Mission (TRMM) data. Remote Sens. 2019, 11, 637. [Google Scholar] [CrossRef] [Green Version]
  44. Kumar, D.; Rai, P.; Dimri, A.P. Investigating Indian summer monsoon in coupled regional land-atmosphere downscaling experiments using RegCM4. Clim. Dyn. 2020, 54, 2959–2980. [Google Scholar] [CrossRef]
  45. Torma, C.; Giorgi, F.; Coppola, E. Added value of regional climate modeling over areas characterized by complex terrain-Precipitation over the Alps: Added value of RCM over complex terrain. J. Geophys. Res. 2015, 120, 3957–3972. [Google Scholar] [CrossRef]
  46. Lopart, M.; da Rocha, R.P.; Reboita, M.; Cuadra, S. Sensitivity of simulated South America climate to the land surface schemes in RegCM4. Clim. Dyn. 2017, 49, 3975–3987. [Google Scholar] [CrossRef] [Green Version]
  47. Ambrizzi, T.; Reboita, M.S.; da Rocha, R.P.; Llopart, M. The state-of-the-art and fundamental aspects of regional climate modeling in South America. Ann. N. Y. Acad. Sci. 2019, 1436, 98–120. [Google Scholar] [CrossRef]
  48. Oleson, K.; Dai, Y.; Bonan, G.B.; Bosilovichm, M.; Dickinson, R.; Dirmeyer, P.; Hoffman, F.; Houser, P.; Levis, S.; Niu, G.-Y. Technical Description of the Community (CLM) Land Model; NCAR Tech Note; National Center for Atmospheric Research: Boulder, CO, USA, 2004. [Google Scholar] [CrossRef]
  49. Marbaix, P.; Gallée, H.; Brasseur, O.; van Ypersele, J. Lateral boundary conditions in regional climate models: A detailed study of the relaxation procedure. Mon. Weather Rev. 2003, 131, 461–479. [Google Scholar] [CrossRef]
  50. Holtslag, A.A.M.; de Brujin, E.I.F.; Pan, H.L. A high resolution air mass transformation model for short-range weather forecasting. Mon. Weather Rev. 1990, 1118, 1561–1575. [Google Scholar] [CrossRef]
  51. Tiedtke, M. A comprehensive mass flux scheme for cumulus parameterization in large-scale models. Mon. Weather Rev. 1989, 117, 1779–1800. [Google Scholar] [CrossRef] [Green Version]
  52. Tiedtke, M. Representation of clouds in large-scale models. Mon. Weather Rev. 1993, 121, 3040–3061. [Google Scholar] [CrossRef] [Green Version]
  53. Emanuel, K.A. A scheme for representing cumulus convection in large-scales models. J. Atmos. Sci. 1991, 48, 2313–2329. [Google Scholar] [CrossRef]
  54. Pal, J.S.; Small, E.E.; Eltahir, E.A.B. Simulation of regional-scale water and energy budgets: Representation of subgrid cloud and precipitation process within RegCM. J. Geophys. Res. 2000, 105, 29579–29594. [Google Scholar] [CrossRef] [Green Version]
  55. Zeng, X.; Zhao, M.; Dickinson, R.E. Intercomparison of bulk aerodynamic algorithms for the computation of sea surface fluxes using TOGA COARE and TAO data. J. Clim. 1998, 11, 2628–2644. [Google Scholar] [CrossRef]
  56. Mlawer, E.J.; Taubman, S.J.; Brown, P.D.; Iacono, M.J.; Clough, S.A. Radiative transfer for inhomogeneous atmospheres: RRTM, a validated correlated-k model for the longwave. J. Geophys. Res. 1997, 102, 16663–16682. [Google Scholar] [CrossRef] [Green Version]
  57. Wilks, D.S. Statistical Methods in the Atmospheric Sciences, 3rd ed.; Academic Press: Amsterdam, The Netherlands, 2011. [Google Scholar]
  58. Centro de Previsão de Tempo e Estudos Climáticos (CPTEC). Evento de Chuva Intensa em Parte do Nordeste do País: Caso Ocorrido no Leste do Nordeste em Maio de 2017; CPTEC: Cachoeira Paulista, Brazil, 2017. [Google Scholar]
  59. Lee, W.Y.; Park, S.K.; Sung, H.H. The optimal rainfall thresholds and probabilistic rainfall conditions for a landslide Early Warming System for Chuncheon, Republic of Korea. Landslides 2021, 18, 1721–1739. [Google Scholar] [CrossRef]
  60. Gariano, S.L.; Brunetti, M.T.; Melillo, M.; Peruccacci, S. How much does the rainfall temporal resolution affect rainfall thresholds for landslide triggering? Nat. Hazards 2020, 100, 655–670. [Google Scholar] [CrossRef] [Green Version]
  61. Sandeep, S.; Stordal, F. Use of daily Outgoing Longwave Radiation (OLR) data in detecting precipitation extremes in tropics. Remote Sens. Lett. 2013, 4, 570–578. [Google Scholar] [CrossRef]
  62. Mendes, R.M.; Filho, M.V.; Bertoldo, M.A.; Silva, M.F. Estudo de limiares críticos de chuva deflagradores de deslizamentos no município de São José dos Campos/SP, Brasil. Territorium 2015, 22, 119–129. [Google Scholar] [CrossRef]
  63. Gomes, H.B.; Ambrizzi, T.; Herdies, D.L.; Hodges, K.; Silva, B.F.P. Easterly waves disturbances over Northeast Brazil: An observational analysis. Adv. Meteorol. 2015, 10, 1–20. [Google Scholar] [CrossRef] [Green Version]
  64. Ferreira, R.R.; Souza, E.P. Aspectos termodinâmicos de um vórtice ciclônico de altos níveis sobre a região Nordeste do Brasil: Um estudo de caso. Anuário Inst. Geociências 2019, 42, 504–513. [Google Scholar] [CrossRef]
  65. Reboita, M.S.; Ambrizzi, T.; Silva, B.A.; Pinheiro, R.F.; Rocha, R.P. The South Atlantic Subtropical Anticyclone: Present and future climate. Front. Earth Sci. 2019, 7, 1–15. [Google Scholar] [CrossRef] [Green Version]
  66. Gilliland, J.M.; Keim, B.D. Surface wind speed: Trend and climatology of Brazil from 1980–2014. Int. J. Climatol. 2017, 38, 1060–1073. [Google Scholar] [CrossRef]
  67. Medeiros, F.J.; de Oliveira, C.P.; Santos e Silva, C.M.; Medeiros, J. Numerical simulation of the circulation and tropical teleconnection mechanisms of a severe drought event (2012–2016) in Northeastern Brazil. Clim. Dyn. 2020, 54, 4043–4057. [Google Scholar] [CrossRef]
  68. Santos e Silva, C.M.; Silva, A.; Oliveira, P.; Lima, K.C. Dynamical downscaling of the precipitation Northeast Brazil with a regional climate model during contrasting years. Atmos. Sci. Lett. 2014, 15, 50–57. [Google Scholar] [CrossRef]
  69. Alheiros, M.M.; Filho, O.A. Landslides and coastal erosion hazards in Brazil. Int. Geol. Rev. 1997, 39, 756–763. [Google Scholar] [CrossRef]
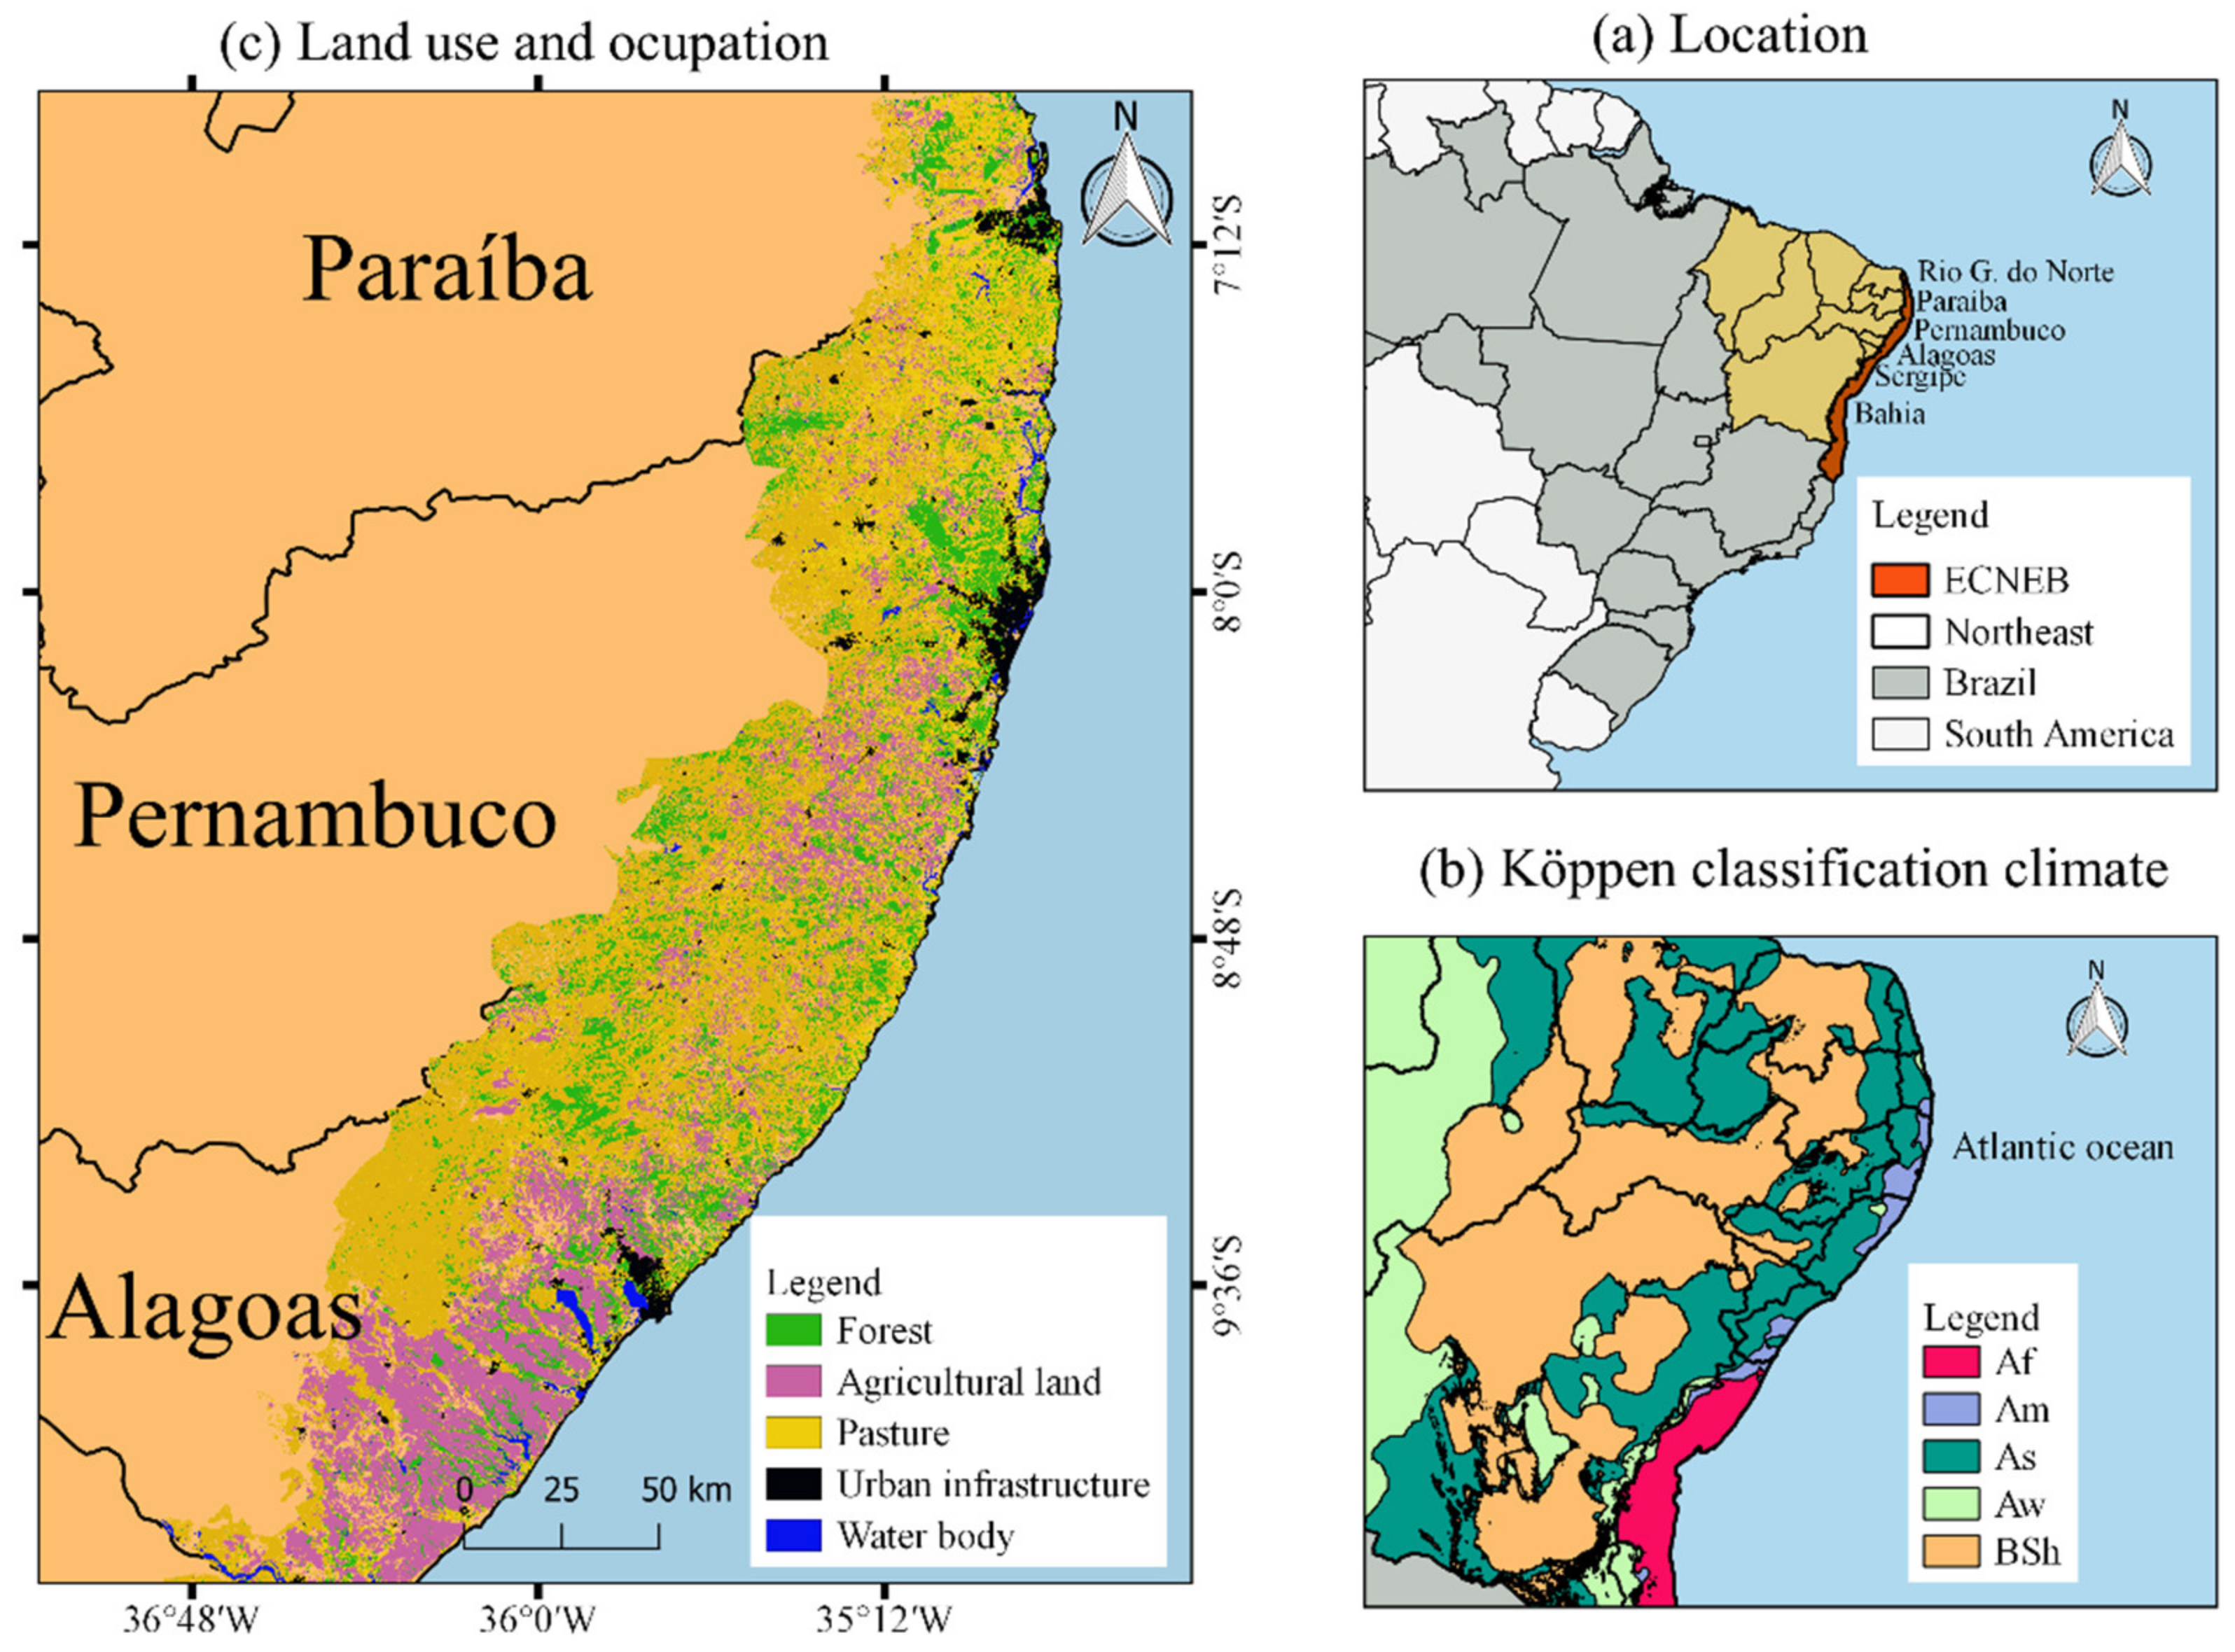
Figure 1. (a) Location of the study area, (b) Köppen climate classification and (c) land use/land cover map on the north coast of the ECNEB.
Atmosphere 12 01261 g001
Figure 2. Annual distribution of the mean temperature and rainfall of the ECNEB for the monthly historical series from 1981 to 2010.
Atmosphere 12 01261 g002
Figure 3. Location of CEMADEN rainfall stations.
Atmosphere 12 01261 g003
Figure 4. Spatial distribution of elevation (a), slope (b), and susceptibility (c) in the ECNEB municipalities. The black triangular points represent the landslides recorded in the period from 23 to 30 May 2017.
Atmosphere 12 01261 g004
Figure 5. Number of high-risk sectors for landslides in municipalities located in ECNEB.
Atmosphere 12 01261 g005
Figure 6. Residences built in high-risk areas subject to landslide events in the cities of Ipojuca (a), João Pessoa (b), Jaboatão dos Guararapes (c) and Maceió (d). Source: CPRM (2020).
Atmosphere 12 01261 g006
Figure 7. (a) Rainfall threshold ED and (b) rainfall threshold ID from daily rainfall data for the municipality of Jaboatão dos Guararapes. Blue dots represent rains that did not cause landslides, and red dots represent rains related to landslides.
Atmosphere 12 01261 g007
Figure 8. Outgoing Longwave Radiation (OLR) fields (W m−2) from 23 May 2017 to 30 May 2017 at the ECNEB during the action of the rainfall system. The information corresponds to 23 (a), 24 (b), 25 (c), 26 (d), 27 (e), 28 (f), 29 (g) and 30 (h) May 2017.
Atmosphere 12 01261 g008
Figure 9. GOES-16 satellite images in the cloud top channel and highlighted for the period from 23 to 30 May 2017 at the ECNEB during the action of the rainfall system. The information corresponds to 23 (a), 24 (b), 25 (c), 26 (d), 27 (e), 28 (f), 29 (g) and 30 (h) May 2017.
Atmosphere 12 01261 g009
Figure 10. Reflectivity of the meteorological radars of Maceió (ac) and Natal (d) using the CAPPI product of 3 km for the 24 (a), 25 (b), 28 (c), and 29 (d) May 2017.
Atmosphere 12 01261 g010
Figure 11. Average daily fields of vertical speed (shaded) at the vertical level of 700 hPa (Pa s−1) and average wind flow in the current line at the level of 850 hPa (m s−1). The information corresponds to 24 (a), 25 (b), 28 (c), and 29 (d) May 2017.
Atmosphere 12 01261 g011
Figure 12. Average daily wind divergence fields (shaded) at the vertical level of 200 hPa (m s−1) and wind flow in the current line at the level of 200 hPa. The information corresponds to 24 (a), 25 (b), 28 (c), and 29 (d) May 2017.
Atmosphere 12 01261 g012
Figure 13. Average daily fields of vertically integrated moisture flux convergence (kg m−2 s). The information corresponds to 24 (a), 25 (b), 28 (c), and 29 (d) May 2017.
Atmosphere 12 01261 g013
Figure 14. Spatial patterns of daily rainfall at the ECNEB during the period from 23 to 26 May 2017. The images (ad) correspond to rainfall simulated by the RegCM model. The images (eh) correspond to the rainfall obtained by the TRMM satellite.
Atmosphere 12 01261 g014
Figure 15. Spatial patterns of daily rainfall at the ECNEB during the period from 27 to 30 May 2017. The images (ad) correspond to rainfall simulated by the RegCM model. The images (eh) correspond to the rainfall obtained by the TRMM satellite.
Atmosphere 12 01261 g015
Figure 16. (a) Distribution of the bias resulting from the statistical analysis between the rainfall simulated by the RegCM model and the TRMM satellite’s observation. (b) The distribution of the RMSE resulted from the statistical analysis between the rain simulated by the RegCM model and the TRMM satellite’s rainfall.
Atmosphere 12 01261 g016
Table 1. Parameters used in the physics of the RegCM model.
ConfigurationParameter
Grid spacing12 km
Scheme of lateral boundary conditionsRelaxation and exponential technique, [49]
PBL schemeHoltslag PBL, [50]
Cumulus convection scheme (mainland)[51,52]
Cumulus convection scheme (ocean)[53]
Moisture schemeExplicit humidity SUBEX, [54]
Ocean flow scheme[55]
Zeng model roughness formula(0.0065 × ustar × ustar)/egrav
Radiation schemeRRTM, [56]
Globdatparamssttyp
Globdatparamdattyp
ERA15
ERA15
Publisher’s Note: MDPI stays neutral with regard to jurisdictional claims in published maps and institutional affiliations.