Abstract
The spatiotemporal patterns and trends of shortwave global irradiance (SWGI) are a crucial factor affecting not only the climate but also sectors of the economy. In this work, the ERA5-Land reanalysis dataset is employed and evaluated against in situ measurements from a dense network of surface stations operated by the National Observatory of Athens over Greece, revealing a good agreement between the two datasets. Then, the spatiotemporal variability of SWGI is investigated over the Euro-Mediterranean region (10° W–42° E and 30° N–52° N) for a 40-year period (1981–2020). SWGI exhibits a smooth latitudinal variability from north to south of −5.4 W/m2/degree on an annual scale, while it varies significantly on a seasonal basis and is almost four times lower in the winter than in the summer. The SWGI trend during the analyzed period was found to be positive and statistically significant at the 95% confidence level. Spring and summer are the periods where positive and the strongest rates of SWGI trends are evident, while in the winter and autumn, negative or neutral trends were found. The increasing SWGI trend shows a slowdown during the beginning of the 2000s in all seasons, except autumn. The SWGI trend decreases by about −0.06 W/m2/decade every 100 m of elevation increase.
1. Introduction
Shortwave global irradiance (SWGI), the irradiance from direct sunlight and diffuse sky radiation that reaches the Earth’s surface (with a wavelength range 300–3000 nm), plays a primary role in the Earth’s climate system, as it is a key component of the surface energy balance. It has significant implications for hydrological components (e.g., evaporation), plant photosynthesis, carbon cycle, cloud formation, climate, and climate change [1,2,3,4]. In addition, SWGI constitutes a renewable source of energy; thus, the accurate analysis of its trends is critical for the siting and operation of renewable energy plants [5]. Hence, in recent decades, high priority has been placed on understanding the changes in SWGI, as they have profound environmental, societal, and economic implications.
In order to better understand SWGI, it is important to have as many observations available as possible. Such observations may come from either in situ measurements or satellite platforms, which have better coverage than ground-based observations. These two methods may complete each other so as to provide improved datasets. On the other hand, atmospheric modeling is a widely used alternative since SWGI is a main component of numerical weather prediction models. The main drawback of these model-based datasets is that they cannot always reproduce local conditions in different locations.
The various studies analyzing long-term records of surface radiation measurements suggest a widespread decrease in surface solar radiation between the 1950s and 1980s (‘‘dimming’’, e.g., [6,7,8,9,10,11,12,13,14,15,16]), with a partial recovery after 1980 at many locations (‘‘brightening’’, e.g., [8,9,10,11,12,13,14,15,16,17,18,19,20]). There are some indications for an ‘‘early brightening’’ in the first part of the 20th century (e.g., [10,13,21]). In Europe, the timing of the transition from dimming to brightening has been reported around the mid-1980s (e.g., Ohmura [13]; Norris and Wild [12]). On the other hand, Perdigao et al. [14], using ERA-40 reanalysis, found that the transition occurred around the early 1970s over the Iberian Peninsula. Additionally, Kambezidis et al. [18], using monthly re-analysis datasets from the Modern Era Retrospective-Analysis for Research and Applications, did not find a reversal from dimming to brightening during 1980s in the Mediterranean basin. Nevertheless, all of the studies agreed that after 1980, there is an overall brightening period (e.g., Sanchez-Lorenzo et al. [22]; Calbo et al. [20]; Sanchez-Lorenzo et al. [19]) over Europe although the magnitude of this increasing trend is dependent on the analyzed period, the study area, and the selected SWGI dataset in each study. A detailed presentation analysing the magnitude of the SWGI in relation to the examined period and the selected dataset in various regions of Europe is depicted in Table 1.

Table 1.
Annual trends (W/m2 per decade) over Euro-Mediterranean area. Bold values indicate significance at the 95% confidence level.
On a seasonal scale, Manara et al. [10] pointed out that the brightening period is particularly pronounced in autumn, while in winter, the seasonal trend is negative (not statistically significant) in northwest Italy during the period of 1990–2016. Furthermore, Chiacchio and Wild [7] and Sanchez-Lorentzo et al. [22] showed a pronounced increasing tendency in spring over Europe. Additionally, Kambezidis et al. [22] found an increasing SWGI trend over the Mediterranean, which is the largest in spring. On the other hand, Perdigao et al. [14] and Bais et al. [6] reported that the maximum positive SWGI trend is observed in summer. The seasonal SWGI trends found in previous studies are presented in Table 2. These interannual and seasonal variations are a complex issue that has been attributed to either direct and indirect aerosol effects or to cloud fluctuations [13].
Table 2.
Summary of seasonal SWGI trends for various locations in Europe. Bold values indicate significance at the 95% confidence level.
Despite the fact that the SWGI climatology is a well-documented field of research, only a few studies have investigated the temporal evolution of SWGI beyond 2000 [16,17,18,23,24] and especially during the 2010s over Europe. These studies have reported that there is an indication of stabilization or a slowdown of the upward trend in SWGI during the beginning of the 2000s [6,16,18,21,25,26]. Thus, there is lack of detailed knowledge regarding SWGI trends over the last decade, which motivated the present study.
The present study has a twofold objective. First, we investigate the ability of the ERA5-Land database to represent the actual SWGI measured by ground-based stations and to reproduce local conditions in different areas (e.g., continental, seaside, islands, etc.) over the Greek territory.
Second, we provide a long-term analysis of the patterns and trends of SWGI for the Euro-Mediterranean region, which compared to the existing literature, (a) has a more recent time span, as it covers the last decade, (b) provides a long term overview of SWGI (1981–2020), and (c) is of enhanced spatial resolution since it is based on ERA5-Land reanalysis dataset with a 9 km spatial resolution, compared to the 31 km of ERA5 or 80 km spatial resolutions of the ERA-Interim data sets.
2. Materials and Methods
In this paper, data form ground measurements (for the period 2010–2019) and data from ERA5-Land re-Analysis (for the period 1981–2020) were used. First, these data were used to validate the ability of ERA5-Land to represent the local conditions of SWGI. Secondly, analysis regarding (a) annual and seasonal spatiotemporal distribution, (b) annual and seasonal trends, and (c) the validation of SWGI with elevation were performed based on ERA5-Land. The workflow chart of the analysis conducted in this paper is presented in Figure 1, while details about the datasets and methodology used are given in next Section 2.1, Section 2.2 and Section 2.3.
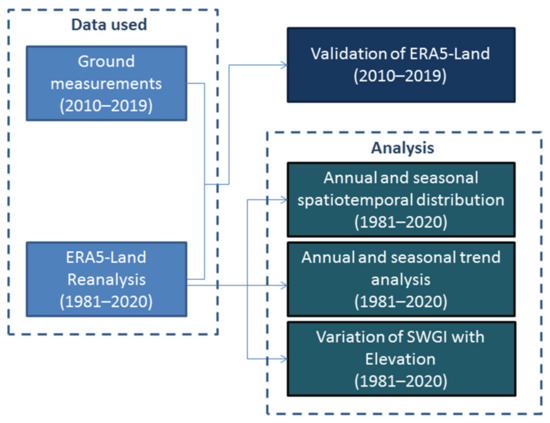
Figure 1.
Workflow chart of the conducted analysis.
2.1. Ground-Based Measurements
Observations provided by surface networks of meteorological stations are necessary for model validation and verification (e.g., Kotroni and Lagouvardos [28]; Akylas et al. [29]). Figure 2 shows the locations of the surface weather stations that were used to evaluate the ERA5-Land dataset. Indeed, from the ~100 surface weather stations that are equipped with solar sensors, we selected those that have the longest time-series available (as the network has grown during the last 15 years), had no data gaps, presented no drift, and were distributed across Greece so as to cover different geographical regions from north to south, with various geomorphological characteristics (coastal, continental and insular areas). Hourly data are provided by the dense network of automated surface meteorological stations operated by the METEO unit at the National Observatory of Athens [30]. The validation period spans 2010–2019. The evaluation is restricted to shortwave global irradiance as measured by the selected ground stations.
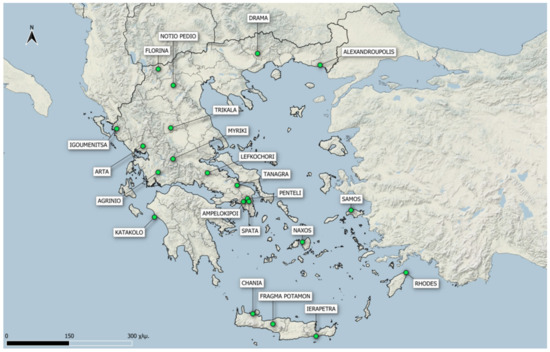
Figure 2.
The network of meteorological stations used in this study.
The weather station type that was used was the Davis Vantage Pro2, whichmeasures ambient air temperature, relative humidity, wind speed and direction, rainfall, atmospheric pressure, and solar and UV radiation. It also measures indoor air temperature and humidity at the location of the station’s console/datalogger and calculates a suite of bioclimatic indices and derived meteorological parameters. Table 3 provides the technical characteristics of the various sensors incorporated within each station [31,32].
Table 3.
Technical characteristics of the weather station used in NOAAN [30].
2.2. ERA5-Land Re-Analysis Dataset
The ERA5-Land is a global atmospheric reanalysis dataset produced by the European Centre for Medium-Range Weather Forecast’s (ECMWF) and has data data available from 1981 [33], providing a consistent view of the evolution of land variables. It has an enhanced resolution of 0.1° × 0.1° compared to ERA5 climate reanalysis (31 km resolution), while the temporal frequency of the model output is hourly. ERA5-Land has been produced by implementing a series of improvements with respect to ERA5 (representing the land component). The shortwave radiative variables were computed by the Fouquart and Bonnel [33] scheme using a six-band shortwave parameterization model. The variable used in this study was the “surface solar radiation downwards” from the ERA5-Land dataset, which is available to download from https://cds.climate.copernicus.eu/ (accessed on 25 October 2021) [33]. The surface solar radiation downwards represents the shortwave irradiation (in units of J/m2) that is accumulated over a time period of 24 h. The daily mean SWGI values (in units of W/m2) were calculated by dividing surface solar radiation downwards by 86,400 s (i.e., the length of a day in seconds).
2.3. Methods
The comparison between the ERA5-Land data and the measurements from the meteorological stations was performed by using common statistical indices, such as bias, absolute bias, and root mean square error (RMSE). The grid (model) points were the nearest neighbours to the stations. The descriptions of those indices are provided below:
- Bias or mean error (ME) of forecasted-model values:
- Absolute bias or mean absolute error (MAE): the absolute mean value of the above differences.
- Root mean square error (RMSE):
- Mean percentage error (MPE): the computed average of mean errors by which forecasts of a model differ from actual values of the quantity being forecast.
- Mean absolute percentage error (MAPE): the computed average of mean absolute errors by which forecasts of a model differ from actual values of the quantity being forecast.
Here obs(i) denotes the recorded (observed) value by each meteorological station at time i for(i) the respective ERA5-Land value of the one nearest to the meteorological station grid point and k the size of the sample (the number of observations that are available for each station).
For the climatology and trend analysis of the SWGI, a much larger area than the area of validation was used that covered the wider Mediterranean and Southern Europe, extending from 10 W to 42 E and from 30 N to 52 N. The annual and seasonal mean values were computed using the ERA5-Land mean daily values of SWGI for the period from 1981 to 2020 in a grid resolution of 0.1° × 0.1°. Annual and seasonal anomalies were calculated as the difference between the corresponding value and the climatic average values by considering the period 1981–2020 as the reference period. The seasons were defined according to the World Meteorological Organization (WMO) i.e., winter (December–January–February), spring (March–April–May), summer (June–July–August,) and autumn (September–October–November).
The slope of the trends was estimated using the Theil–Sen method [33,34], and the statistical significance was assessed using the Mann–Kendall non-parametric test [34,35] at the 95% confidence level. The slope (b) of a trend in sample data could be estimated as follows:
where xt and xt* are the sequential data series at the interval t and t* (t > t*). The Mann–Kendall test confirms the existence of a positive or negative trend for a given confidence level and has been widely used in previous studies (e.g., [2,36]), as it has a lot of advantages. The Mann–Kendall test does not require that the data are normally distributed, and it is not affected by missing data, by outliers, or by the length of the time series. Specifically, for a time series containing a set of observations (xi, xj), the Mann–Kendall test is given by
where
The value of Mann–Kendall test ZMK is computed by
with
Where q is the number of tied groups, and tp is the number of observations in the pth group. The value of ZMK (Equation (7)) determines if there is a monotonic trend at the time-series. A monotonic trend, which is significant at the 95% confident level, is accepted if |ZMK| ≥ 1.96. A positive value in Equation (6) indicates that there is a positive trend in the observations and vice versa.
3. Results
3.1. Validation of ERA5-Land SWGI
In order to evaluate the ability of ERA5-Land to represent SWGI, radiation measurements from meteorological stations located in different geographical areas of Greece were employed, as described in Section 2.1.
In the frame of the present work, the comparisons were performed on a seasonal basis and are presented in Figure 3, Figure 4, Figure 5, Figure 6. During the winter, ME ranged from 5–38 W/m2, MAE ranged from 27 to 47 W/m2, and RMSE ranged from 37–79 W/m2; MPE ranged from 11–40%, and MAPE ranged from 30–42% In the spring, the deviations increased for ME (23–57 W/m2), for MAE (54–78 W/m2), and for RMSE (74–123 W/m2) and decreased for MPE (4–22%) and MAPE (21%–35%). During summer, the statistical scores were similar to the ones for spring, and more specifically, ME ranged from 7 to 56 W/m2, MAE ranged from 39 to 74 W/m2, and RMSE ranged from 51 to 124 W/m2, but MPE reduced to 0–19%, and MAPE reduced to 14–26%. Finally, during autumn, ME values were between 1 and 37 W/m2, MAE values ranged from 34 to 55 W/m2, RMSE ranged from 45 to 96 W/m2, MPE ranged from −5% to 18%, and MAPE ranged from 20% to 37%. In Sianturi et al. [37], the ERA5 (31 km horizontal resolution) and MERRA2 (approximately 50 km horizontal resolution) reanalysis data were evaluated against in situ measurements. The results showed that for ERA5, the model overestimates SWGI, which is in agreement with our results. The aforementioned study focused over an area of islands in Indonesia (which is closer to the Earth’s equator than Greece, so larger absolute deviations are to be expected), and the statistical indices for MAE revealed higher deviations (50–96 W/m2) than our study did for the Greek islands (49–79 W/m2). The values of the statistical measures of the present study are close to the ones presented by Perdigao et al. [15], who compared the downscaled output of the Weather Research and Forecasting model (WRF) using NCEP/NCAR reanalysis data at a 5 km horizontal resolution against ground station measurements for the areas of Portugal and Spain.
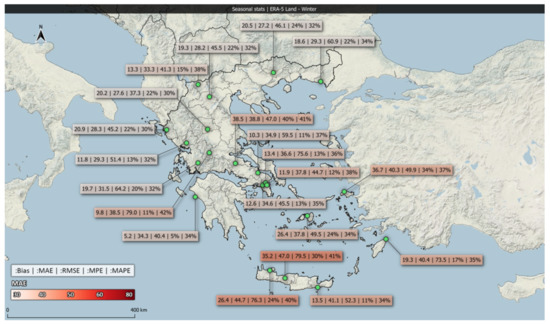
Figure 3.
Bias (W/m2), MAE (W/m2), RMSE (W/m2), and MPE and MAPE (both ranging from 0 to 1 for better visualization) between ERA5-Land and surface observations for winter (DJF) in the Greek area.
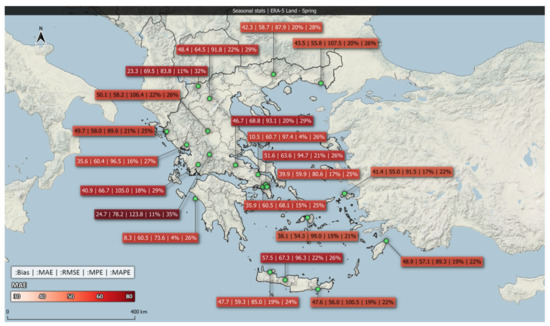
Figure 4.
Bias (W/m2), MAE (W/m2), RMSE (W/m2), and MPE and MAPE (both ranging from 0 to 1 for better visualization) between ERA5-Land and surface observations for spring (MAM) in the Greek area.
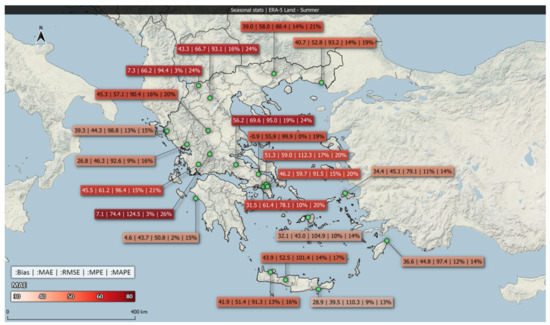
Figure 5.
Bias (W/m2), MAE (W/m2), RMSE (W/m2), and MPE and MAPE (both ranging from 0 to 1 for better visualization) between ERA5-Land and surface observations for summer (JJA) in the Greek area.
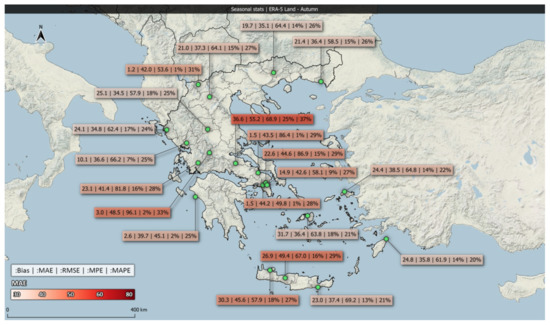
Figure 6.
Bias (W/m2), MAE (W/m2), RMSE (W/m2), and MPE and MAPE (both ranging from 0 to 1 for better visualization) between ERA5-Land and surface observations for autumn (SON) in the Greek area.
Inspection of the spatial variability of the statistical scores revealed that the calculated MAEs are lower in the northern parts of Greece (27–42 W/m2 during winter and autumn, 55–70 W/m2 in spring and summer) and gradually increase when moving southwards (37–49 W/m2 during winter and autumn, 55–67 W/m2 in spring and 40–61 W/m2 in summer). The calculated MAE also increases from the west (27–34 W/m2 during the winter, from 58–66 W/m2 in the spring, from 44–61 W/m2 during the summer, and from 34–41 W/m2 in the autumn) to the east (27–47 W/m2 during the winter, 55–78 W/m2 in the spring, 40–74 W/m2 during the summer, and 35–55 W/m2 in the autumn).
During the spring, the errors are higher and are distributed more evenly around Greece (Figure 4). This result is in agreement with Perdigao et al. [15], where the statistics for the area of the Iberian Peninsula reveal higher deviations during spring and summer. In the present analysis, during the summer months, higher differences are found in the mainland stations, while at the coastal and island areas, they are lower (Figure 5). This fact may be attributed to the atmospheric thermal instability during summer, which mainly occurs over the Greek peninsula at around noon, causing increased cloud cover compared to other areas. This localized summertime instability cannot be easily reproduced by the model at the available resolution (9 km × 9 km). In autumn, MAEs and RMSEs are lower than they are in spring, but they are also evenly distributed around the area of Greece (Figure 6). It should be noted that as expected, during spring and summer, the values of SWGI are higher because of the longer duration of the daylight as well as the lower cloud cover duration. Finally, we have to note that the stations that are close to large cities such as Athens are much more affected by smog, scattering and absorbing more aerosols than other stations on the islands.
In addition to the above statistics, we also present the scatter plots (with the relevant trendlines) for three representative stations at different areas of Greece, one in the northern part (Notio Pedio Kozani), the second in the central Greece (Spata), and the third inthe southeast (island of Rhodes) (Figure 7). There is a good correlation between observational and ERA5-Land points, which confirms the good quality of the model data.
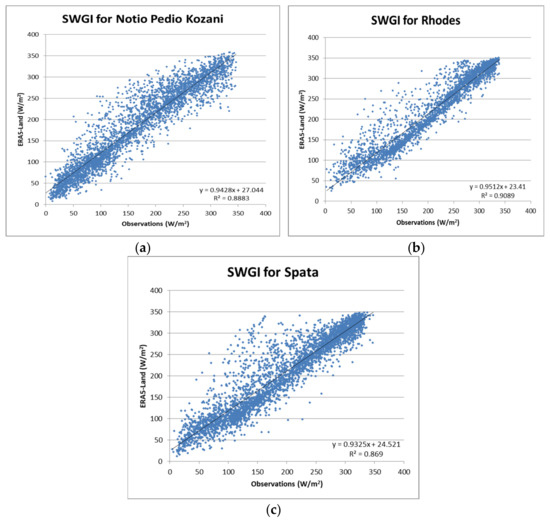
Figure 7.
Scatter plots for the entire period of validation at the points of Notio Pedio Kozani (a), Rhodes (b) and Spata (c).
Here, we should note that the results from the presented validation suffer from the fact that in situ observations have been compared to gridded model data that are representative of an area that is 10 km × 10 km. Observational and model time-series are both valuable depending on their availability, quality, homogeneity, and representativeness. Keeping in mind the limitations of each source of data, in the following, a climatological analysis of SWGI is presented based on the ERA5-Land reanalysis data, which is a very recent data set with higher resolution than previously available reanalysis provided in the literature.
3.2. Annual and Seasonal Average Distribution
Figure 8 shows the spatial distribution of multiyear mean SWGI (in W/m2) in the extended Mediterranean area from 1981 to 2020 acquired from ERA5-Land reanalysis data. The multiyear mean of SWGI was computed from mean daily values in a grid resolution of 0.1° × 0.1°. The multiyear mean SWGI shows a latitudinal gradient from north to south, ranging from 100 W/m2 in the northern regions to 260 W/m2 in the southern regions, corresponding to a spatial average value of 177 W/m2. The annual latitudinal gradient from south to north is −5.4 W/m2 per degree (Figure 9).
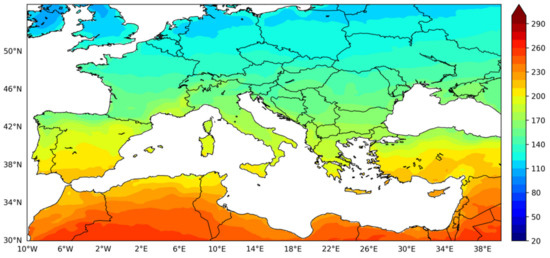
Figure 8.
Mean annual SWGI (W/m2) over Euro-Mediterranean region from ERA5-Land calculated for the period 1981–2020.
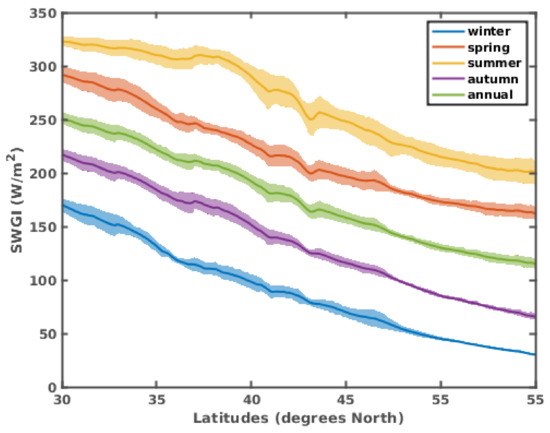
Figure 9.
Latitudinal variability of SWGI over Euro-Mediterranean region for the period 1981–2020 from ERA5-Land. The shaded regions represent the spatial standard deviation.
The mean values of SWGI are in line with previous studies over Europe. Specifically, Alexandri et al. [17] studied the eastern Mediterranean region using satellite data from 1983 to 2013 and found mean SWGI values greater than 250 W/m2 in southern Africa, while in Greece and Turkey, the mean SWGI ranged from 150 to 220 W/m2. Perdigao et al. [14,15], using data obtained from the WRF model for the period of 1950–2010 and reanalysis data from ERA-40, found SWGI ranging from 150 to 250 W/m2 over the Iberian Peninsula. The calculated mean values in the present study are consistent with those obtained from the analysis of observational data throughout Europe. Specifically, Sanchez-Lorenzo et al. [19] analysed data from 47 surface stations over the entire European region from 1983 to 2005 and found that the mean annual SWGI ranged from 87 to 174 W/m2, while Ohmura [13], who used observational data for the surface station in Davos, Switzerland, reported that the annual SWGI in the period from 1990–2005 ranged from 140 to 180 W/m2, which compares well with the respective values in the same region in our analysis, which range from 150 to 175 during the same period (not shown).
The seasonal spatial distribution of SWGI (in W/m2) are depicted in Figure 10. As it was expected, the seasonal mean of SWGI reaches the minimum values in winter (mean spatial average: 89 W/m2) and the maximum values in summer (mean spatial average: 265 W/m2). The month with the lowest SWGI values is December (mean spatial average: 70 W/m2), while the months with the highest SWGI values are June and July (mean spatial average: 275 and 273 W/m2, respectively) due to the high solar elevation and decrease in cloudiness over the Mediterranean [18]. The interannual variability of the mean SWGI in spring and summer are similar to the annual series, as these seasons contribute 68% to the annual mean SWGI, which is in line with other studies (e.g., Alexandri et al. [18]; Perdigao et al. [15]).
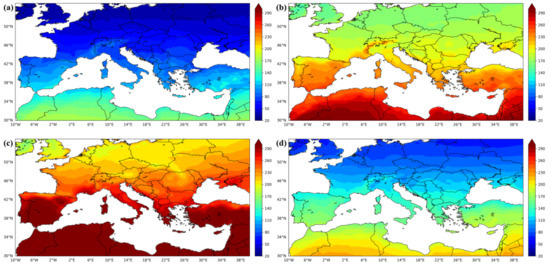
Figure 10.
Mean seasonal SWGI (W/m2) over Euro-Mediterranean region for the period 1981–2020 from ERA5-Land for (a) winter (DJF); (b) spring (MAM); (c) summer (JJA); and (d) autumn (SON).
In the winter, the mean SWGI ranges from 28 W/m2 in North and central Europe to 180 W/m2 in African regions. Spring, as a transition period to the maximum mean SWGI values of the summer, exhibits increased mean SWGI values that range from 144 W/m2 in the United Kingdom to 303 W/m2 in Algeria. In summer, the mean SWGI values reach their maxima in all regions, showing an increase of 200% compared to winter. In autumn, the mean SWGI is reduced by 50% compared to summer. The mean SWGI seasonal values are in line with other studies provided in the literature focusing on the European region. Specifically, Alexandri et al. [17] found average values of SWGI over the eastern Mediterranean of 100.3 W/m2 in winter, 230.5 W/m2 in spring, 309.6 W/m2 in summer, and 168.9 W/m2 in autumn within a period cover 1983–2013. Additionally, they attributed the highest/lowest values of the mean SWGI over the southern/northern parts of the eastern Mediterranean to the lower/higher latitudes and cloudiness. Furthermore, Perdigao et al. [15] studied the SWGI seasonality over the Iberian Peninsula and found the average values of 75–125 W/m2 in winter, ~230 W/m2 in spring, ~320 W/m2 in summer, and ~180 W/m2 in autumn in the period from 1950 to 2010.
The interannual variability of SWGI, in all seasons, shows a latitudinal gradient from north to south as the spatial distribution of the multiyear mean of SWGI (Figure 10). The latitudinal gradient is −5.6, −5.2, −4.9, and −6.1 W/m2 per degree towards the North in winter, spring, summer, and autumn, respectively (Figure 9).
3.3. Annual and Seasonal SWGI Trend
The interannual variability of SWGI has been linked to changes in aerosols (e.g., Silveira et al. [38]; Kazadzis et al. [9]; Nabat et al. [11]; Folini and Wild [8]), in the cloud cover (e.g., Sanchez-Lorenzo et al. [22]; Chiacchio and Wild [7]) as well as to changes in the cloud types and optical cloud properties (Hatzianastassiou et al. [39]). Aerosols influence solar radiation in two ways: directly, by reflecting incoming sunlight (e.g., by sulfate and sulfuric acid particles), and indirectly, by changing the number of cloud condensation nuclei particles. Indeed, as aerosols act as cloud condensation nuclei particles, the increasing aerosol load increase the average number and size of the cloud droplets and hence, affect the scattering properties and cloud albedo [12]. Thus, the reason for the interannual variation of SWGI is a complex problem, which is still subject to ongoing research (e.g., Sfica et al. [40]; Chiacchio and Wild [7]).
Figure 11 shows the annual trend of SWGI in the extended Mediterranean area along with the statistical significance at the 95% level, which was estimated over the period from 1981–2020 from the ERA5-Land data. Overall, the annual SWGI trend ranges from −0.9 to 4.5 W/m2 per decade (mean regional value 1.7 W/m2 per decade, as shown in Table 4) and is characterized by positive values almost throughout the entire study area. It must be highlighted that regions near the Mediterranean Sea, such as Greece, Croatia, Albania, Turkey, Italy, Spain, and northern African countries, for which higher values of mean SWGI were depicted (Figure 8), are associated with lower values of positive annual trend values (Figure 11). In contrast, in Central Europe, the positive annual SWGI trend is higher and ranges from 1.8 to 4.5 W/m2 per decade, except in Great Britain, which exhibits lower trend values that are comparable to those in the southeastern Mediterranean. The highest trend values are observed in the northeastern part of the study area (region between 46° N to 53° N and 26° E to 40° E). Almost neutral to negative trend values (but not statistically significant) are observed in some limited areas over Greece, Turkey, and in Algeria. The spatial distribution of the annual SWGI trend is consistent with previous studies performed in various regions of Europe, e.g., in Spain [14], in Switzerland and Germany [26], and in Central Europe [22], although the magnitude of these trends is dependent on both the study area and the analysed period. Table 1 summarizes some of the results of previous studies dealing with the SWGI trends over various regions in Europe.
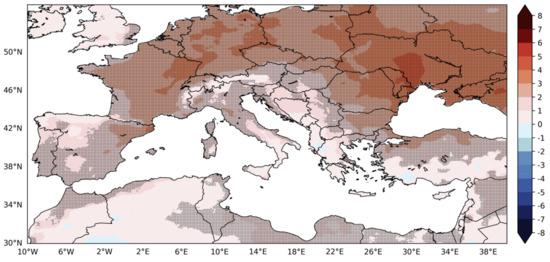
Figure 11.
Annual SWGI trends (W/m2 per decade) for the period from 1981–2020 from ERA5-Land. Dots indicate significant trends at the 95% level. The annual trends are expressed as anomalies from the 1981–2020 mean.
Table 4.
Annual and seasonal trends (W/m2 per decade) over Euro-Mediterranean area. Bold values indicate significance at the 95% confidence level.
The increasing trend of SWGI is in line with the reduction of sulfate emissions and other anthropogenic aerosols since 1980 [41,42,43] and the observed decrease of aerosol optical depth (AOD) reported in many studies (e.g., Founda et al. [44]; Nabat et al. [45]; Zerefos et al. [46]; Ruckstul et al. [27]; Mishchenko et al. [47]). The spatial distribution of SWGI trends reveals that the brightening period presents geographical variations. The Euro-Mediterranean “hot spot” occurs in the northeastern part of the study area, which is in accordance with other studies (e.g., Sanchez-Lorenzo et al. [22]; Kambezidis et al. [18]; Chiacchio and Wild [7]). Indeed, in Eastern Europe, anthropogenic emissions were strongly reduced in the late 1980s [41], while reductions in Western Europe started in the 1980s. Additionally, Chiacchio et al. [48] found that the annual change in sulfate AOD for Europe was −69%, while Western Europe had a decline of 63%, and Eastern Europe had a maximum of 75% for the period from 1985–2007. Moreover, Sfica et al. [40] showed that the cloud cover decreased over Central Europe during the period of 1981–2014 and that the maximum decline occurred in the east of Europe.
It is worth mentioning that the southern part of Europe has lower SWGI trends compared to Central Europe, which could be attributed to the higher AOD values found in southern Europe [6,49,50]. Kazadzis et al. [9] found that the brightening trend of Athens (Greece) is lower than the reported SWGI trends around Europe for the period from 1980–2012. Furthermore, Kambezidis et al. [18] reported higher rates of SWGI increase over the western Mediterranean in comparison to the eastern part for the period of 1979–2012.
Figure 12 shows the spatial distribution of the seasonal SWGI trends during the period of 1981–2020. In winter, the SWGI trends range from −4.0 to 1.8 W/m2 per decade, while negative trend values prevail in the area of study, except in some sub regions south of 42° N and over Great Britain. However, the SWGI trend is not statistically significant in most of the region (87% of the whole area). During this season, the highest negative trend is calculated, which is in agreement with Sanchez-Lorenzo et al. [16]. In spring, the sign of the SWGI trend becomes positive, ranging from 0 to 7.4 W/m2 per decade, with the exception of small regions in Algeria and Spain, where the trend is slightly negative. The SWGI trend is higher in Central Europe, with the maxima occurring in the area north of the Black Sea and on the border between France and Germany. Increased positive trends are found in the summer in the regions of Central Europe where the maximum annual values range from 2.4 to 10.1 W/m2 per decade (in the continental European region north of 49 N). In areas such as Great Britain, Cyprus, Israel, and part of the Algeria–Morocco region, slightly negative trend values are observed, but they are not statistically significant. In autumn, a more neutral to positive SWGI trend prevails in most of the study area (70% of the area). Slightly negative values are found mainly in the Balkan Peninsula and in the Algeria–Morocco region. It should be noted that this trend is statistically significant in very few areas (10% of the whole area) in autumn. Overall, the seasonal variability is in line with previous studies reported by Sanchez-Lorenzo et al. [16,22] and Chiacchio and Wild [7], who found that spring and summer are the seasons with positive and the strongest rates of SWGI trends, while in winter, there is a tendency for negative or neutral trends, and in autumn, the trends are weaker, with a tendency for negative rates over the European region. Table 2 summarizes the results of previous studies dealing with the seasonal SWGI trends over various regions in Europe.
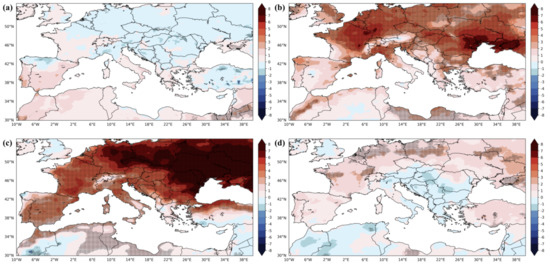
Figure 12.
Seasonal SWGI trends (W/m2 per decade) for the period 1981–2020 from ERA5-Land for (a) winter (DJF); (b) spring (MAM); (c) summer (JJA); and (d) autumn (SON). Dots indicate significant trends at the 95% level. The seasonal trends are expressed as anomalies from the 1981–2020 mean.
In previous studies, the strongest increase in the SWGI trend values were reported in spring [7,16,22], in autumn [10], and in summer [6,14], while in the present study, the maximum positive trend is found in summer. The magnitude of the trends found in previous studies is dependent on various parameters such as the used dataset, the selected studied region, the length of the analysed period, and the selected reference period used to compute the anomaly. Nevertheless, the maximum SWGI trend found in the present study is observed in regions where the maximum decline of aerosols in summer has been reported in previous studies (e.g., Filonchyk et al. [51]; Parding et al. [52]).
Chiacchio et al. [48] found that the temporal decrease in AOD correlates well with the increase in spring and summer mean SWGI, but it does not explain the trends found in SWGI during winter and autumn. Chiacchio and Wild [7] proposed that during winter and autumn, the North Atlantic Oscillation (NAO) and the associated cloud cover could be contributing to the decadal changes in SWGI. Indeed, partial warming in Europe in the last few decades has been attributed to a positive NAO trend [53]. Furthermore, Sfica et al. [40] showed that in the warm season (from May to September), the occurrence and intensity of the Azores High had slightly decreasing ridges during the period of 1981–2014, resulting in a reduction in the cloud cover over Eastern Europe. During the cold season (from November to March), the increasing trend of an anticyclonic circulation over Eastern Europe induced the blocking of the Mediterranean cyclones along their track over the Balkan Peninsula, resulting in less cloudiness over the eastern part of Europe and enhanced cloudiness over the southern part of the continent. Indeed, in autumn, the contrasting trend between the east and west Mediterranean is pronounced (Figure 12d).
Figure 13 and Figure 14 show the mean annual and seasonal series of the SWGI, which have been regionally averaged for the entire study area, together with a smoothed line obtained with a 5 year Gaussian low-pass filter and with the trend lines, which have been calculated for the periods 1981–2000 and 2001–2020. As it was expected, the annual SWGI time series show positive trends (brightening) during 1981–2020, with a statistically significant increase of +1.7 W/m2 per decade. Interestingly, the smoothed time series of SWGI shows a local maximum near 2000, followed by a small decline between 2000 and 2010. Indeed, the SWGI trend over 1981–2000 is almost twice as large as the SWGI trend from 2001–2020 (Table 4). This is in line with previous studies, which reported indications of less distinct solar brightening after 2000 compared to the 1990s [6,21,26] or stabilizing SWGI [16,18,25,54]. The transition of solar dimming to brightening in Europe during the 1980s was mainly attributed to the sharp decrease of aerosols (e.g., Streets et al. [43]). The largest decrease in the concentrations of anthropogenic aerosols occurred before 2000 (e.g., Stjern et al. [55]; Ruckstuhl et al. [27]); thus, the AOD and its impact on solar radiation could not have changed dramatically after 2000. Indeed, Wild et al. [23]), who compared sunshine duration data with the average surface solar radiation from 2000 to 2005, argued that decreases in cloudiness rather than in aerosol concentration have primarily affecting the SWGI trend in Europe since 2000.
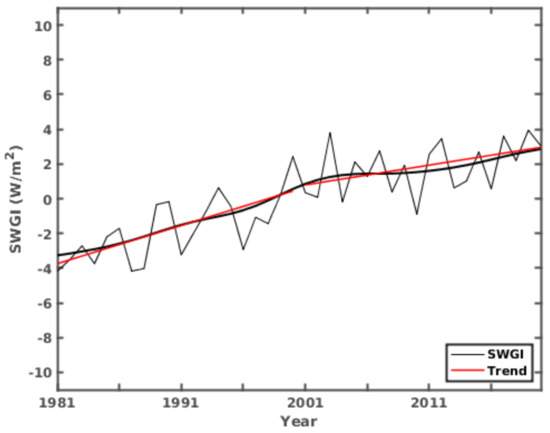
Figure 13.
Temporal variation of the composite annual SWGI averaged in the Euro-Mediterranean area from ERA5-Land dataset for the 1981–2020 period (grey line) plotted together with a 5-year Gaussian low-pass filter (black thick line) and trend lines for the periods 1981–2000 and 2001–2020 (red lines). The SWGI series is expressed as anomalies from the 1981–2020 mean.
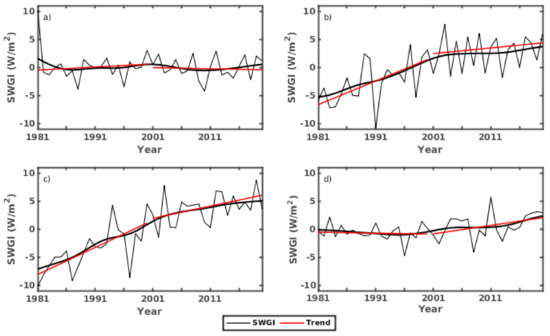
Figure 14.
Temporal variation of the composite annual SWGI averaged in the Euro-Mediterranean area from ERA5-Land dataset for the 1981–2020 period (grey line) plotted together with a 5 year Gaussian low-pass filter (black thick line) and trend lines for the periods 1981–2000 and 2001–2020 (red lines) for (a) winter (DJF); (b) spring (MAM); (c) summer (JJA); and (d) autumn (SON). The SWGI series is expressed as anomalies from the 1981–2020 mean.
In winter, the SWGI trend is close to zero (0.5 W/m2 per decade), with an indication for a slight overall decrease; however, it is non-significant at the 95% confidence level. The spring and summer SWGI time series shows a strong and significant upward SWGI trend throughout the whole period (+2.5 and +3.6 W/m2 per decade, respectively) and shows a similar evolution to the annual time series. Interestingly, SWGI trends over the period from1981–2000 for spring and summer are almost 4 and 2 times greater than the SWGI trends over 2001–2020 (Table 4), respectively. In both seasons, the mean SWGI temporal evolution (filtered time series) shows a peak near 2000 followed by a period with little change. In autumn, the SWGI series show a slight overall increase of +0.6 W/m2 per decade, which is significant at the 95% confidence level.
3.4. Variation of SWGI Trend with Elevation
In developed regions such as Europe, trends in aerosol concentrations are influenced by anthropogenic emissions, which mostly originate from areas close to sea level. As a consequence, AOD trends and their associated SWGI trends are lower in mountainous areas than they are in low-elevated areas (e.g., Stjern et al. [55]; Dong et al. [56]). Conversely, the higher frequency of thick orographic clouds over mountains shields a significant fraction of the solar radiation, contributing to local minima at mountainous areas [17]. For the present analysis, the SWGI trend values were paired with the gridded elevation fields (Figure 15). The resulting number of pairs was divided into 25 bins (with equal number of pairs), and for each bin, the mean SWGI trend was estimated. The box and whisker plots presented in Figure 15 provide information for the distribution of the median, lower (10% and 25%), and upper (75% and 90%) percentiles of the SWGI trend for various bins of the elevation. The annual SWGI trend decreases by about 0.06 W/m2 per decade for every 100 m of increase in elevation. It is worth mentioning that the evolution of the SWGI trend shows a slightly increasing trend for those grid-points located at elevations lower than 200 m and a decreasing trend for grid-points located at elevations higher than 200 m. A similar behavior is observed on seasonal scales, especially in spring and summer, where the variation of the SWGI trend with elevation shows that the trend decreases by about −0.06 (spring) and −0.21 W/m2 per decade (summer) for every 100 m of increase in elevation (Figure 16). In winter, the trend in SWGI increases slightly, (+0.03 W/m2 per decade every 100 m), while in autumn, the trend decreases slightly (−0.01 W/m2 per decade every 100 m). All of the aforementioned trends are statistically significant at the 95% level. These findings are in line with Manara et al. [10], Zeng et al. [57], and Philipona [58], who also found an overall decreasing SWGI trend with elevation.
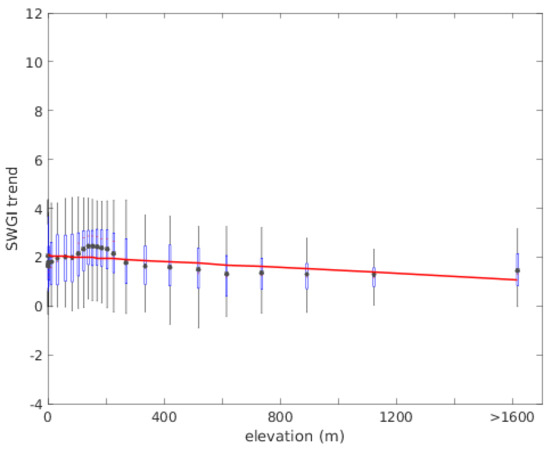
Figure 15.
Box and whiskers plot of the SWGI annual trend (W/m2 per decade), mean annual trend (black star), and the trend line (red line) for various bins of the elevation. The lower boundary of the box indicates the 25th percentile, the red line within the box marks the median, and the upper boundary of the box indicates the 75th percentile. Whiskers above and below the box indicate the 90th and 10th percentiles.
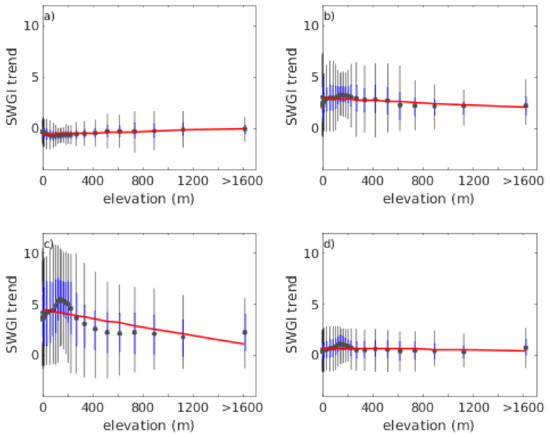
Figure 16.
Box and whiskers plot of the SWGI seasonal trend (W/m2 per decade), mean trend (black star), and the trend line (red line) for various bins of the elevation for (a) winter (DJF); (b) spring (MAM); (c) summer (JJA); and (d) autumn (SON). The lower boundary of the box indicates the 25th percentile, and the red line within the box marks the median and the upper boundary of the box indicates the 75th percentile. Whiskers above and below the box indicate the 90th and 10th percentiles.
4. Discussion and Concluding Remarks
In this paper, a climatological and trend analysis of SWGI in the Euro-Mediterranean area (10 W–42 E and 30 N–52 N) was performed. For this purpose, we used the ERA5-Land reanalysis dataset from the period of 1981–2020 with an enhanced resolution of 0.1° × 0.1°. The comparison of this dataset with observational data provided by a network of surface weather stations in Greece showed a relatively good ability to represent the SWGI in the ERA5-Land dataset, with MAE ranging from 30–50 W/m2 during the autumn and winter periods and rising to 50–70 W/m2 in spring and summer. These values appear to be more accurate than those presented in other similar studies (which have used ERA5 data) for other areas (e.g., Indonesia in Sianturi et al. [29], Iberian Peninsula in Perdigao et al. [30]).
The suitability of using the ERA-5 land data set for this climatological analysis is further supported by the high correlations between this dataset and the observational dataset. Further, in order to support the suitability of the ERA-5 land dataset for the trend analysis provided in this work, we note that the comparison of trends between the observational and model data sets showed the same slopes and similar trend values for the validation period (not shown). Thus, there is confidence that the trend slopes discussed in this analysis are correct in terms of sign, while the values might deviate from those of an observational network. Although the validation area is restricted over Greece for the purposes of this study, we assume that the statistics are similar over the much larger area used for the climatology and trend analysis. This is supported by the fact that the statistics over Greece are comparable to those provided in the literature over other areas of the studied domain. Nevertheless, the aforementioned limitations should be taken into account when exploring the results of the present work.
Analysis of the annual patterns of SWGI over the area revealed a latitudinal variability from north to south of −5.4 W/m2 per degree. The mean spatial average value of SWGI is 177 W/m2. The seasonal mean of SWGI reaches the minimum values in winter (89 W/m2), while spring and summer contribute 68% to the annual mean SWGI. The maximum mean SWGI values in summer found in the present study are consistent with previous SWGI studies SWGI (e.g., Alexandri et al. [18]; Perdigao et al. [15]) and AOD values reported in previous studies (e.g., Filonchyk et al. [51]; Parding et al. [52]). Indeed, Parding et al. [52] linked the highest AODs values in summer to the high relative humidity and temperature, which contribute to the hygroscopic growth of thin aerosols [59] and strengthen photochemical reactions, leading to the formation of secondary aerosols [60]. In general, high AOD values in spring and summer are associated with the intensification of anthropogenic aerosol emissions from crop biomass burning [61], forest fires [52], and dust transported from remote sources (e.g., Saharan dust) [62,63].
The SWGI trend analysis revealed an overall positive trend (brightening) for the period of 1981–2020, with a mean regional value of 1.7 W/m2 per decade. The spatial analysis revealed that the brightening period presents geographical variations. The highest SWGI trend appears in Central Europe, especially in the northeastern part of the study area, with values reaching up to 4.5 W/m2 per decade. Almost neutral to negative trend values are observed in some limited regions of Greece, Turkey, and in Algeria, although these trends are not statistically significant. The spatial pattern of the SWGI trend is strongly related to the reductions of anthropogenic aerosol emissions in the 1980s in Europe (e.g., Nabat et al. [17]; Chiacchio et al. [17]) and the decreasing cloud cover over the inner European continent (e.g., Sfica et al. [17]; Mateos et al. [3]; Hatzianastassiou et al. [3]).
On a seasonal level, spring and summer are the seasons with the highest positive SWGI trend, while in winter, there is a tendency for negative or neutral trends, and in autumn, the trends are slightly positive or neutral over the Euro-Mediterranean region. Previous studies have indicated that the brightening in spring and summer is possibly associated to the temporal evolution of AOD (e.g., Chiacchio et al. [3]), while the trends in winter and autumn could be attributed to cloud cover variation (Chiacchio and Wild [7]). In this study, the largest positive SWGI trends were found in summer and not in spring or autumn, as reported in previous studies [7,10,16,22]. Nevertheless, it must be highlighted that the magnitude of the trend is strongly dependent on various parameters such as the length of the analysed period and the selected reference period used to compute the anomaly. Moreover, the maximum SWGI trend found in the present study is in line with the maximum decline of aerosols in summer in previous studies [51,52]. Interestingly, the increasing SWGI trend shows a slowdown during the beginning of the 2000s in all seasons, except autumn, confirming the reported indications of previous studies (e.g., Kambezidis et al. [7]; Wild et al. [23]). This slowdown in the increasing SWGI trend has been attributed to the cloud cover beyond 2000 [23] and not to aerosol variability [6]. The analyses of the dependence of trends in SWGI on elevation revealed that the SWGI trend decreases about −0.06 W/m2 per decade (p value ≤ 0.05) for every 100 m of increase in elevation. This finding is in line with previous studies that have found a decreasing AOD trend with elevation (e.g., Dong et al. [56]). This elevational gradient is negative in all seasons, except in autumn. The largest negative gradient is found in summer.
The present study provides an update on SWGI trends for Europe by extending previous analyses beyond the year 2010 and using reanalysis datasets with a better resolution than those used in the past. Interestingly, it has been shown that the solar dimming masked the greenhouse effect up until 1980s, while the subsequent brightening contributed to global warming (Wild et al. [64]). Future investigation should seek to disentangle the contribution of cloudiness and aerosol emissions to the variability of SWGI. Additionally, the contribution of each type of cloud (high, mid, and low) to the variations of SWGI should be investigated. This would lead to a better understanding of the complex interactions between aerosols, cloud cover, and irradiance and their influence on climate change.
Author Contributions
Conceptualization, E.G., G.E., K.L., and V.K.; data curation, E.G., G.E., K.L., and V.K.; formal analysis, E.G. and G.E.; investigation, E.G. and G.E.; methodology, E.G., G.E., K.L., and V.K.; resources, K.L. and V.K.; software, E.G., G.E., K.L., and V.K.; supervision, K.L. and V.K.; validation, E.G., G.E., K.L., and V.K.; visualization, E.G. and G.E.; writing—original draft, E.G. and G.E.; writing—review and editing, E.G., G.E., K.L., and V.K. All authors have read and agreed to the published version of the manuscript. The authors confirm the copyright of the figures and tables in the manuscript.
Funding
This research received no external funding.
Institutional Review Board Statement
Not applicable.
Data Availability Statement
The raw ERA5-Land data required to reproduce these findings are available to download from https://cds.climate.copernicus.eu/ (accessed on 25 October 2021). The raw data of the observations and all of the datasets generated during the current study are available from the corresponding author upon reasonable request.
Acknowledgments
The results contain modified Copernicus Climate Change Service information from 2021. Neither the European Commission nor ECMWF is responsible for any use that may be made of the Copernicus information or the data it contains. Muñoz-Sabater et al., (2019), was downloaded from the Copernicus Climate Change Service (C3S) Climate Data Store. We would like to thank George Kyros for preparing Figure 1 and Figure 3, Figure 4, Figure 5, Figure 6.
Conflicts of Interest
The authors declare no conflict of interest.
References
- Jahani, B.; Dinpashoh, Y.; Wild, M. Dimming in Iran since the 2000s and the potential underlying causes. Int. J. Clim. 2018, 38, 1543–1559. [Google Scholar] [CrossRef]
- Manara, V.; Brunetti, M.; Maugeri, M.; Sanchez-Lorenzo, A.; Wild, M. Sunshine duration and global radiation trends in Italy (1959–2013): To what extent do they agree? J. Geophys. Res. Atmos. 2017, 122, 4312–4331. [Google Scholar] [CrossRef]
- Saccone, S.; Federico, C.; Bernardi, G. Localization of the gene-richest and the gene-poorest isochores in the interphase nuclei of mammals and birds. Gene 2002, 300, 169–178. [Google Scholar] [CrossRef]
- Wild, M. Enlightening Global Dimming and Brightening. Bull. Am. Meteorol. Soc. 2012, 93, 27–37. [Google Scholar] [CrossRef]
- Wild, M.; Folini, D.; Henschel, F.; Fischer, N.; Müller, B. Projections of long-term changes in solar radiation based on CMIP5 climate models and their influence on energy yields of photovoltaic systems. Sol. Energy 2015, 116, 12–24. [Google Scholar] [CrossRef]
- Bais, A.F.; Drosoglou, T.; Meleti, C.; Tourpali, K.; Kouremeti, N. Changes in surface shortwave solar irradiance from 1993 to 2011 at Thessaloniki (Greece). Int. J. Clim. 2012, 33, 2871–2876. [Google Scholar] [CrossRef]
- Chiacchio, M.; Wild, M. Influence of NAO and clouds on long-term seasonal variations of surface solar radiation in Europe. J. Geophys. Res. Space Phys. 2010, 115. [Google Scholar] [CrossRef]
- Folini, D.; Wild, M. Aerosol emissions and dimming/brightening in Europe: Sensitivity studies with ECHAM5-HAM. J. Geophys. Res. Space Phys. 2011, 116. [Google Scholar] [CrossRef]
- Kazadzis, S.; Founda, D.; Psiloglou, B.E.; Kambezidis, H.; Mihalopoulos, N.; Sanchez-Lorenzo, A.; Meleti, C.; Raptis, P.I.; Pierros, F.; Nabat, P. Long-term series and trends in surface solar radiation in Athens, Greece. Atmos. Chem. Phys. Discuss. 2018, 18, 2395–2411. [Google Scholar] [CrossRef]
- Manara, V.; Bassi, M.; Brunetti, M.; Cagnazzi, B.; Maugeri, M. 1990–2016 surface solar radiation variability and trend over the Piedmont region (northwest Italy). Theor. Appl. Clim. 2019, 136, 849–862. [Google Scholar] [CrossRef]
- Nabat, P.; Somot, S.; Mallet, M.; Sanchez-Lorenzo, A.; Wild, M. Contribution of anthropogenic sulfate aerosols to the changing Euro-Mediterranean climate since 1980. Geophys. Res. Lett. 2014, 41, 5605–5611. [Google Scholar] [CrossRef]
- Norris, J.R.; Wild, M. Trends in aerosol radiative effects over Europe inferred from observed cloud cover, solar “dimming,” and solar “brightening”. J. Geophys. Res. Space Phys. 2007, 112. [Google Scholar] [CrossRef]
- Ohmura, A. Observed decadal variations in surface solar radiation and their causes. J. Geophys. Res. Space Phys. 2009, 114. [Google Scholar] [CrossRef]
- Perdigão, J.C.; Salgado, R.; Costa, M.J.; Dasari, H.P.; Sanchez-Lorenzo, A. Variability and trends of downward surface global solar radiation over the Iberian Peninsula based on ERA-40 reanalysis. Int. J. Clim. 2016, 36, 3917–3933. [Google Scholar] [CrossRef]
- Perdigão, J.; Salgado, R.; Magarreiro, C.; Soares, P.M.; Costa, M.J.; Dasari, H.P. An Iberian climatology of solar radiation obtained from WRF regional climate simulations for 1950–2010 period. Atmos. Res. 2017, 198, 151–162. [Google Scholar] [CrossRef]
- Sanchez-Lorenzo, A.; Wild, M.; Brunetti, M.; Guijarro, J.A.; Hakuba, M.Z.; Calbo, J.; Mystakidis, S.; Bartok, B. Reassessment and update of long-term trends in downward surface shortwave radiation over Europe (1939–2012). J. Geophys. Res. Atmos. 2015, 120, 9555–9569. [Google Scholar] [CrossRef]
- Alexandri, G.; Georgoulias, A.; Meleti, C.; Balis, D.; Kourtidis, K.; Sanchez-Lorenzo, A.; Trentmann, J.; Zanis, P. A high resolution satellite view of surface solar radiation over the climatically sensitive region of Eastern Mediterranean. Atmos. Res. 2017, 188, 107–121. [Google Scholar] [CrossRef]
- Kambezidis, H.; Kaskaoutis, D.; Kalliampakos, G.; Rashki, A.; Wild, M. The solar dimming/brightening effect over the Mediterranean Basin in the period 1979–2012. J. Atmos. Sol. Terr. Phys. 2016, 150–151, 31–46. [Google Scholar] [CrossRef]
- Sanchez-Lorenzo, A.; Wild, M.; Trentmann, J. Validation and stability assessment of the monthly mean CM SAF surface solar radiation dataset over Europe against a homogenized surface dataset (1983–2005). Remote. Sens. Environ. 2013, 134, 355–366. [Google Scholar] [CrossRef]
- Calbó, J.; González, J.-A.; Sanchez-Lorenzo, A. Building global and diffuse solar radiation series and assessing decadal trends in Girona (NE Iberian Peninsula). Theor. Appl. Clim. 2017, 129, 1003–1015. [Google Scholar] [CrossRef]
- Wild, M. Global dimming and brightening: A review. J. Geophys. Res. Space Phys. 2009, 114. [Google Scholar] [CrossRef]
- Sanchez-Lorenzo, A.; Enriquez-Alonso, A.; Wild, M.; Trentmann, J.; Vicente-Serrano, S.M.; Sanchez-Romero, A.; Posselt, R.; Hakuba, M.Z. Trends in downward surface solar radiation from satellites and ground observations over Europe during 1983–2010. Remote Sens. Environ. 2017, 189, 108–117. [Google Scholar] [CrossRef]
- Wild, M.; Trüssel, B.; Ohmura, A.; Long, C.N.; König-Langlo, G.; Dutton, E.G.; Tsvetkov, A. Global dimming and brightening: An update beyond 2000. J. Geophys. Res. Space Phys. 2009, 114. [Google Scholar] [CrossRef]
- Hatzianastassiou, N.; Ioannidis, E.; Korras-Carraca, M.-B.; Gavrouzou, M.; Papadimas, C.D.; Matsoukas, C.; Benas, N.; Fotiadi, A.; Wild, M.; Vardavas, I. Global Dimming and Brightening Features during the First Decade of the 21st Century. Atmosphere 2020, 11, 308. [Google Scholar] [CrossRef]
- Hatzianastassiou, N.; Papadimas, C.D.; Matsoukas, C.; Pavlakis, K.; Fotiadi, A.; Wild, M.; Vardavas, I. Recent regional surface solar radiation dimming and brightening patterns: Inter-hemispherical asymmetry and a dimming in the Southern Hemisphere. Atmos. Sci. Lett. 2012, 13, 43–48. [Google Scholar] [CrossRef]
- Philipona, R.; Behrens, K.; Ruckstuhl, C. How declining aerosols and rising greenhouse gases forced rapid warming in Europe since the 1980s. Geophys. Res. Lett. 2009, 36. [Google Scholar] [CrossRef]
- Ruckstuhl, C.; Philipona, R.; Behrens, K.; Coen, M.C.; Dürr, B.; Heimo, A.; Mätzler, C.; Nyeki, S.; Ohmura, A.; Vuilleumier, L.; et al. Aerosol and cloud effects on solar brightening and the recent rapid warming. Geophys. Res. Lett. 2008, 35. [Google Scholar] [CrossRef]
- Kotroni, V.; Lagouvardos, K. Evaluation of MM5 High-Resolution Real-Time Forecasts over the Urban Area of Athens, Greece. J. Appl. Meteorol. 2004, 43, 1666–1678. [Google Scholar] [CrossRef]
- Akylas, E.; Kotroni, V.; Lagouvardos, K. Sensitivity of high-resolution operational weather forecasts to the choice of the planetary boundary layer scheme. Atmos. Res. 2007, 84, 49–57. [Google Scholar] [CrossRef]
- Lagouvardos, K.; Kotroni, V.; Bezes, A.; Koletsis, I.; Kopania, T.; Lykoudis, S.; Mazarakis, N.; Papagiannaki, K.; Vougioukas, S. The automatic weather stations NOANN network of the National Observatory of Athens: Operation and database. Geosci. Data J. 2017, 4, 4–16. [Google Scholar] [CrossRef]
- Davis Instruments, Vantage Pro2 Solar Radiation Sensor. Available online: https://cdn.shopify.com/s/files/1/0515/5992/3873/files/6450_SS.pdf (accessed on 23 October 2021).
- Davis Instruments, Vantage Pro2 Console User Manual. Available online: https://support.davisinstruments.com/article/y4cq28mflh-manual-optional-ac-charger-kit-for-vantage-connect-hd-solar-power-kit-6710 (accessed on 23 October 2021).
- Muñoz Sabater, J. ERA5-Land hourly data from 1981 to present. Copernicus Climate Change Service (C3S) Climate Data Store (CDS). Earth Syst. Sci. Data 2021, 13, 4349–4383. [Google Scholar]
- Theil, H. A Rank-Invariant Method of Linear and Polynomial Regression Analysis BT-Henri Theil’s Contributions to Economics and Econometrics: Econometric Theory and Methodology; Raj, B., Koerts, J., Eds.; Springer: Dordrecht, The Netherlands, 1992; pp. 345–381. ISBN 978-94-011-2546-8. [Google Scholar]
- Kendall, M.G. Rank Correlation Methods; Griffin: London, UK, 1975; ISBN 0852641990/9780852641996. [Google Scholar]
- Zuluaga, C.F.; Avila-Diaz, A.; Justino, F.B.; Wilson, A.B. Climatology and trends of downward shortwave radiation over Brazil. Atmos. Res. 2021, 250, 105347. [Google Scholar] [CrossRef]
- Sianturi, Y.; Marjuki Sartika, K. Evaluation of ERA5 and MERRA2 reanalyses to estimate solar irradiance using ground observations over Indonesia region. In Proceedings of the AIP Conference Proceedings; AIP Publishing LLC: Melville, NY, USA, 2020; Volume 2223, p. 020002. [Google Scholar]
- Silveira, C.; Martins, A.; Gouveia, S.; Scotto, M.; Miranda, A.; Monteiro, A. The Role of the Atmospheric Aerosol in Weather Forecasts for the Iberian Peninsula: Investigating the Direct Effects Using the WRF-Chem Model. Atmosphere 2021, 12, 288. [Google Scholar] [CrossRef]
- Hatzianastassiou, N.; Matsoukas, C.; Fotiadi, A.; Pavlakis, K.G.; Drakakis, E.; Hatzidimitriou, D.; Vardavas, I. Global distribution of Earth’s surface shortwave radiation budget. Atmos. Chem. Phys. Discuss. 2005, 5, 2847–2867. [Google Scholar] [CrossRef]
- Sfîcă, L.; Beck, C.; Nita, A.; Voiculescu, M.; Birsan, M.; Philipp, A. Cloud cover changes driven by atmospheric circulation in Europe during the last decades. Int. J. Clim. 2021, 41, E2211–E2230. [Google Scholar] [CrossRef]
- Vestreng, V.; Myhre, G.; Fagerli, H.; Reis, S.; Tarrasón, L. Twenty-five years of continuous sulphur dioxide emission reduction in Europe. Atmos. Chem. Phys. Discuss. 2007, 7, 3663–3681. [Google Scholar] [CrossRef]
- Berglen, T.F.; Myhre, G.; Isaksen, I.S.; Vestreng, V.; Smith, S.J. Sulphate trends in Europe: Are we able to model the recent observed decrease. Tellus B Chem. Phys. Meteorol. 2007, 59, 773–786. [Google Scholar] [CrossRef]
- Streets, D.G.; Wu, Y.; Chin, M. Two-decadal aerosol trends as a likely explanation of the global dimming/brightening transition. Geophys. Res. Lett. 2006, 33, 2–5. [Google Scholar] [CrossRef]
- Founda, D.; Kazadzis, S.; Mihalopoulos, N.; Gerasopoulos, E.; Lianou, M.; Raptis, P.I. Long-term visibility variation in Athens (1931–2013): A proxy for local and regional atmospheric aerosol loads. Atmos. Chem. Phys. Discuss. 2016, 16, 11219–11236. [Google Scholar] [CrossRef]
- Nabat, P.; Somot, S.; Mallet, M.; Chiapello, I.; Morcrette, J.J.; Solmon, F.; Szopa, S.; Dulac, F.; Collins, W.; Ghan, S.; et al. A 4-D climatology (1979–2009) of the monthly tropospheric aerosol optical depth distribution over the Mediterranean region from a comparative evaluation and blending of remote sensing and model products. Atmos. Meas. Tech. 2013, 6, 1287–1314. [Google Scholar] [CrossRef]
- Zerefos, C.S.; Eleftheratos, K.; Meleti, C.; Kazadzis, S.; Romanou, A.; Ichoku, C.; Tselioudis, G.; Bais, A. Solar dimming and brightening over Thessaloniki, Greece, and Beijing, China. Tellus B Chem. Phys. Meteorol. 2009, 61, 657–665. [Google Scholar] [CrossRef]
- Mishchenko, M.I.; Geogdzhayev, I.V.; Rossow, W.B.; Cairns, B.; Carlson, B.E.; Lacis, A.A.; Liu, L.; Travis, L.D. Long-Term Satellite Record Reveals Likely Recent Aerosol Trend. Science 2007, 315, 1543. [Google Scholar] [CrossRef]
- Chiacchio, M.; Ewen, T.; Wild, M.; Chin, M.; Diehl, T. Decadal variability of aerosol optical depth in Europe and its relationship to the temporal shift of the North Atlantic Oscillation in the realm of dimming and brightening. J. Geophys. Res. Space Phys. 2011, 116. [Google Scholar] [CrossRef]
- Papadimas, C.D.; Hatzianastassiou, N.; Mihalopoulos, N.; Querol, X.; Vardavas, I. Spatial and temporal variability in aerosol properties over the Mediterranean basin based on 6-year (2000–2006) MODIS data. J. Geophys. Res. Space Phys. 2008, 113, 11205. [Google Scholar] [CrossRef]
- Matthias, V.; Balis, D.; Bösenberg, J.; Eixmann, R.; Iarlori, M.; Komguem, L.; Mattis, I.; Papayannis, A.; Pappalardo, G.; Perrone, M.R.; et al. Vertical aerosol distribution over Europe: Statistical analysis of Raman lidar data from 10 European Aerosol Research Lidar Network (EARLINET) stations. J. Geophys. Res. Space Phys. 2004, 109. [Google Scholar] [CrossRef]
- Filonchyk, M.; Hurynovich, V.; Yan, H. Trends in aerosol optical properties over Eastern Europe based on MODIS-Aqua. Geosci. Front. 2020, 11, 2169–2181. [Google Scholar] [CrossRef]
- Parding, K.; Olseth, J.A.; Dagestad, K.F.; Liepert, B.G. Decadal variability of clouds, solar radiation and temperature at a high-latitude coastal site in Norway. Tellus B Chem. Phys. Meteorol. 2014, 66. [Google Scholar] [CrossRef]
- Trigo, R.M.; Osborn, T.J.; Corte-Real, J.M. The North Atlantic Oscillation influence on Europe. Clim. Res. 2002, 20, 9–17. [Google Scholar] [CrossRef]
- Vautard, R.; Yiou, P.; van Oldenborgh, G.J. Decline of fog, mist and haze in Europe over the past 30 years. Nat. Geosci. 2009, 2, 115–119. [Google Scholar] [CrossRef]
- Stjern, C.W.; Stohl, A.; Kristjánsson, J.E. Have aerosols affected trends in visibility and precipitation in Europe? J. Geophys. Res. Space Phys. 2011, 116. [Google Scholar] [CrossRef]
- Dong, Z.; Li, Z.; Yu, X.; Cribb, M.; Li, X.; Dai, J. Opposite long-term trends in aerosols between low and high altitudes: A testimony to the aerosol–PBL feedback. Atmos. Chem. Phys. Discuss. 2017, 17, 7997–8009. [Google Scholar] [CrossRef]
- Zeng, Z.; Chen, A.; Ciais, P.; Li, Y.; Li, L.Z.X.; Vautard, R.; Zhou, L.; Yang, H.; Huang, M.; Piao, S. Gases Induced Warming-Elevation Relationship. Geophys. Res. Lett. 2015, 42, 4563–4572. [Google Scholar] [CrossRef]
- Philipona, R. Greenhouse warming and solar brightening in and around the Alps. Int. J. Clim. 2013, 33, 1530–1537. [Google Scholar] [CrossRef]
- Wang, Y.; Wu, Z.; Ma, N.; Wu, Y.; Zeng, L.; Zhao, C.; Wiedensohler, A. Statistical analysis and parameterization of the hygroscopic growth of the sub-micrometer urban background aerosol in Beijing. Atmos. Environ. 2018, 175, 184–191. [Google Scholar] [CrossRef]
- Filonchyk, M.; Hurynovich, V.; Yan, H.; Zhou, L.; Gusev, A. Climatology of aerosol optical depth over Eastern Europe based on 19 years (2000–2018) MODIS TERRA data. Int. J. Clim. 2019, 40, 3531–3549. [Google Scholar] [CrossRef]
- Sitnov, S.A. Spatial-temporal variability of the aerosol optical thickness over the central part of European Russia from MODIS data. Izv. Atmos. Ocean. Phys. 2011, 47, 584–602. [Google Scholar] [CrossRef]
- Shao, Y.; Wyrwoll, K.-H.; Chappell, A.; Huang, J.; Lin, Z.; McTainsh, G.H.; Mikami, M.; Tanaka, T.Y.; Wang, X.; Yoon, S. Dust cycle: An emerging core theme in Earth system science. Aeolian Res. 2011, 2, 181–204. [Google Scholar] [CrossRef]
- Calidonna, C.R.; Avolio, E.; Gullì, D.; Ammoscato, I.; De Pino, M.; Donateo, A.; Feudo, T.L. Five Years of Dust Episodes at the Southern Italy GAW Regional Coastal Mediterranean Observatory: Multisensors and Modeling Analysis. Atmosphere 2020, 11, 456. [Google Scholar] [CrossRef]
- Wild, M.; Ohmura, A.; Makowski, K. Impact of global dimming and brightening on global warming. Geophys. Res. Lett. 2007, 34. [Google Scholar] [CrossRef]


Publisher’s Note: MDPI stays neutral with regard to jurisdictional claims in published maps and institutional affiliations. |
© 2021 by the authors. Licensee MDPI, Basel, Switzerland. This article is an open access article distributed under the terms and conditions of the Creative Commons Attribution (CC BY) license (https://creativecommons.org/licenses/by/4.0/).