1. Introduction
Coal contains trace quantities of naturally occurring radionuclides from the uranium and thorium decay series and
40K. According to the United Nations Scientific Committee on the Effects of Atomic Radiation [
1] the average concentrations of natural radionuclides in coal are 35 Bq/kg for
238U (16–110 Bq/kg); 35 Bq/kg for
226Ra (17–60 Bq/kg); 30 Bq/kg for
232Th (11–64 Bq/kg) and 400 Bq/kg for
40K (range 40–850 Bq/kg). Depending on the geological formation of coal and the composition in organic matter, the concentration of the radionuclides in coal and consequently in fly ashes can vary through a wide range of values.
When coal is burnt, the organic constituents are removed while minerals and trace quantities of naturally occurring radionuclides and radioactive decay products remain in ash. Most of them accumulate in fly and bottom ash, where the concentration of uranium and thorium can be up to ten times higher than the typical values for burnt coal. In contrast, for other radionuclides, such as
210Pb and
40K, the magnitude of the enrichment in fly ash can be much higher. Therefore, coal combustion leads to an increase in the concentration of these radionuclides in slags and fly ash, which may be released into the atmosphere and deposited on the ground surface [
2,
3]. Emissions from coal-fired power plants also contain certain toxic trace metals.
Approximately 10% of the original volume of coal will result in the formation of ash, which is composed of fly ash (74%), bottom ash (20%) and boiler slag (6%). The filtration systems will retain the vast majority of the produced ashes. Depending on the efficiency of these systems, a small fraction of the fly ash, typically between 2 and 5%, are released into the atmosphere. Coal-fired power plants equipped with electrostatic precipitators release less than 1% of fly ash [
4]. Still, a considerable amount of fly ash particles may be released into the atmosphere due to the high rate of coal combustion every year, although from 2018 to 2020, the EU reduced its consumption of hard coal and brown coal by a third [
3,
5].
During the last two decades, several authors studied the magnitude of coal-fired power plants’ contribution to environmental pollution. Concerning the influence of these emissions in natural radioactivity, the results from these studies are not unanimous and cannot be interpreted as a general conclusion for all coal-fired power plants [
1,
2,
6,
7,
8,
9,
10,
11,
12,
13,
14,
15]. Some studies have reported a possible influence on the level of natural radioactivity in the surrounding environment [
8,
9,
16], while others have not [
6,
7].
In some studies, it was demonstrated that coal use for electric power generation might result in much higher concentrations of radionuclides in the air. The major component of the risk is the release of fine particles [
10]. In addition, according to the experimental results, the influence of the impact of coal-fired power plants on the background radiation level in its vicinity was confirmed qualitatively and quantitatively by [
1]. Other interesting findings were reported by [
11] as no significant enhancement of radionuclides in the surface soil was observed at the points of maximum deposition of combustion gases, located from 4.3 to 13 km away depending on the considered coal-fired power plant. However, an increase of
40K,
226Ra and
232Th in the surface soils was observed in the first kilometre from two coal-fired power plants suggesting that these radionuclides were released in particulate form. The activities of one artificial and six natural radionuclides were measured by collecting 67 surface soil samples around a coal-fired power plant in Spain [
2]. The results showed similar activities to the natural background levels. Another study on the radiological impact of a coal-fired power plant in Spain determined the activity concentrations of coal, ash, mine wastes and sediments. The results demonstrated the distribution and mobility of these elements through the environment, where a potential risk of contamination could be detected [
13].
The activity concentration of natural radionuclides released into the atmosphere from a coal-fired power plant varies considerably, depending on the quality and composition of the feed coal, the temperature of combustion, the efficiency of the emission control equipment, etc. [
10,
13,
15].
Therefore, marked differences should be expected between the by-products produced and the amount of activity discharged per unit of energy produced from different coal-fired power plants. On the other hand, the evaluation of radioactive elements in the composition of fly and bottom ash was not mandatory until the transposition of the European Directive 2013/59/Euratom in each Member State. Consequently, the prediction of dispersion and mobility of these elements in the environment after their release and disposal is based on limited data, and the radiological impact from the exposure to these radioactive elements is unknown as their concentration will vary from location to location.
For decades, coal has been the primary source of electricity generation. The production of electricity from coal is one of the primary sources of CO
2 emissions. In addition, coal power plants are also responsible for significant emissions of NO
X, SO
2 and particulate matter, which contribute significantly to air pollution and severely impact human health and the environment (e.g., through acidification from acid rain). Some of the direct health effects evidenced by scientific studies include the progression of cardiovascular diseases and an association with an increase in total mortality due to long-term exposure to PM
2.5. Futhermore, prolonged exposure to NO
2 can cause damage to the respiratory tract and is associated with increased symptoms of bronchitis and asthma, lung function impairment, and lung cancer and exposure to SO
2 has been associated with an increase in asthma and chronic bronchitis, as well as with a decrease in lung function and bronchial inflammation [
17]. Nevertheless, the air pollution and the health effects generated by the CO
2, NO
X, and SO
2 emissions into the air have been widely studied and therefore were not the focus of this study [
18].
This work aimed to study the spatial distribution of natural radioactivity around a coal-fired power plant, the dispersion of particulate matter and the spatial variability of heavy metals in soil. The data analysis was performed using geostatistical mapping tools based on ordinary kriging methods and nonparametric statistical methods in some cases. Previously developed works were taken into consideration to structure a methodology to evaluate the contribution from the coal power plant activities to the natural radioactivity, enrichment of heavy metals and particulate matter.
The selected coal plant went offline on January 2021, leaving just one coal power station in operation, scheduled for closure in November 2021. The closure was anticipated in two years, followed by a decision of the owner company (EDP) to accelerate the phase-out of coal as a natural consequence of the energy transition process (and part of the EDP group’s decarbonisation strategy), in line with European carbon neutral targets and the country’s national energy and climate plan, which emphasises renewable energy sources.
2. Materials and Methods
2.1. Study Area
The coal-fired power plant is located near a dense urban area on the southwestern coastline of Portugal. The nearest town, Sines, can be found at 6 km north-west of the power plant, where there are approximately 18,300 inhabitants. The region is characterised by a typical Mediterranean climate (moderate to warm temperatures) with influences from the Atlantic Ocean. The geology of the area is marked by shales, sandstone, limestone, clay, conglomerate and quartzite.
The power plant is located in a large industrial site (ZILS-Sines Industrial and Logistics Zone) that covers approximately 2000 hectares and is occupied by more than 14 active industrial plants. The coal-fired power plant was the only one fueled by coal. It was in operation for the last 40 years with four identical coal-fired units, each with an electrical energy output of 314 MWe and two stacks with a height of 225 m. The power plant was operated by the Portuguese Electricity Company (EDP, Lisbon, Portugal) and consumed bituminous coal as the primary fuel. It had a storage capacity of 1.35 million tons of coal.
The efficiency of the filtration system has been improved, and the emissions into the atmosphere decreased over the years. On the other hand, as the burnt coal was imported from different countries, the concentration of the radionuclides in the coal and consequently in ash was highly variable. The annual consumption of coal and the fly ash and bottom slag sent to landfill for disposal (property of EDP) are represented in
Table 1.
The strategy of the company has been to promote the beneficially reuse of these residues through their valorisation. In 2019, it was possible to reuse a much higher quantity of bottom slag than the produced, contributing to the reduction of the environmental liability of the landfill. In the last few years, the sale of fly ash increased, and in 2019 it was possible to sell almost all of the fly ash produced (157,253 tons).
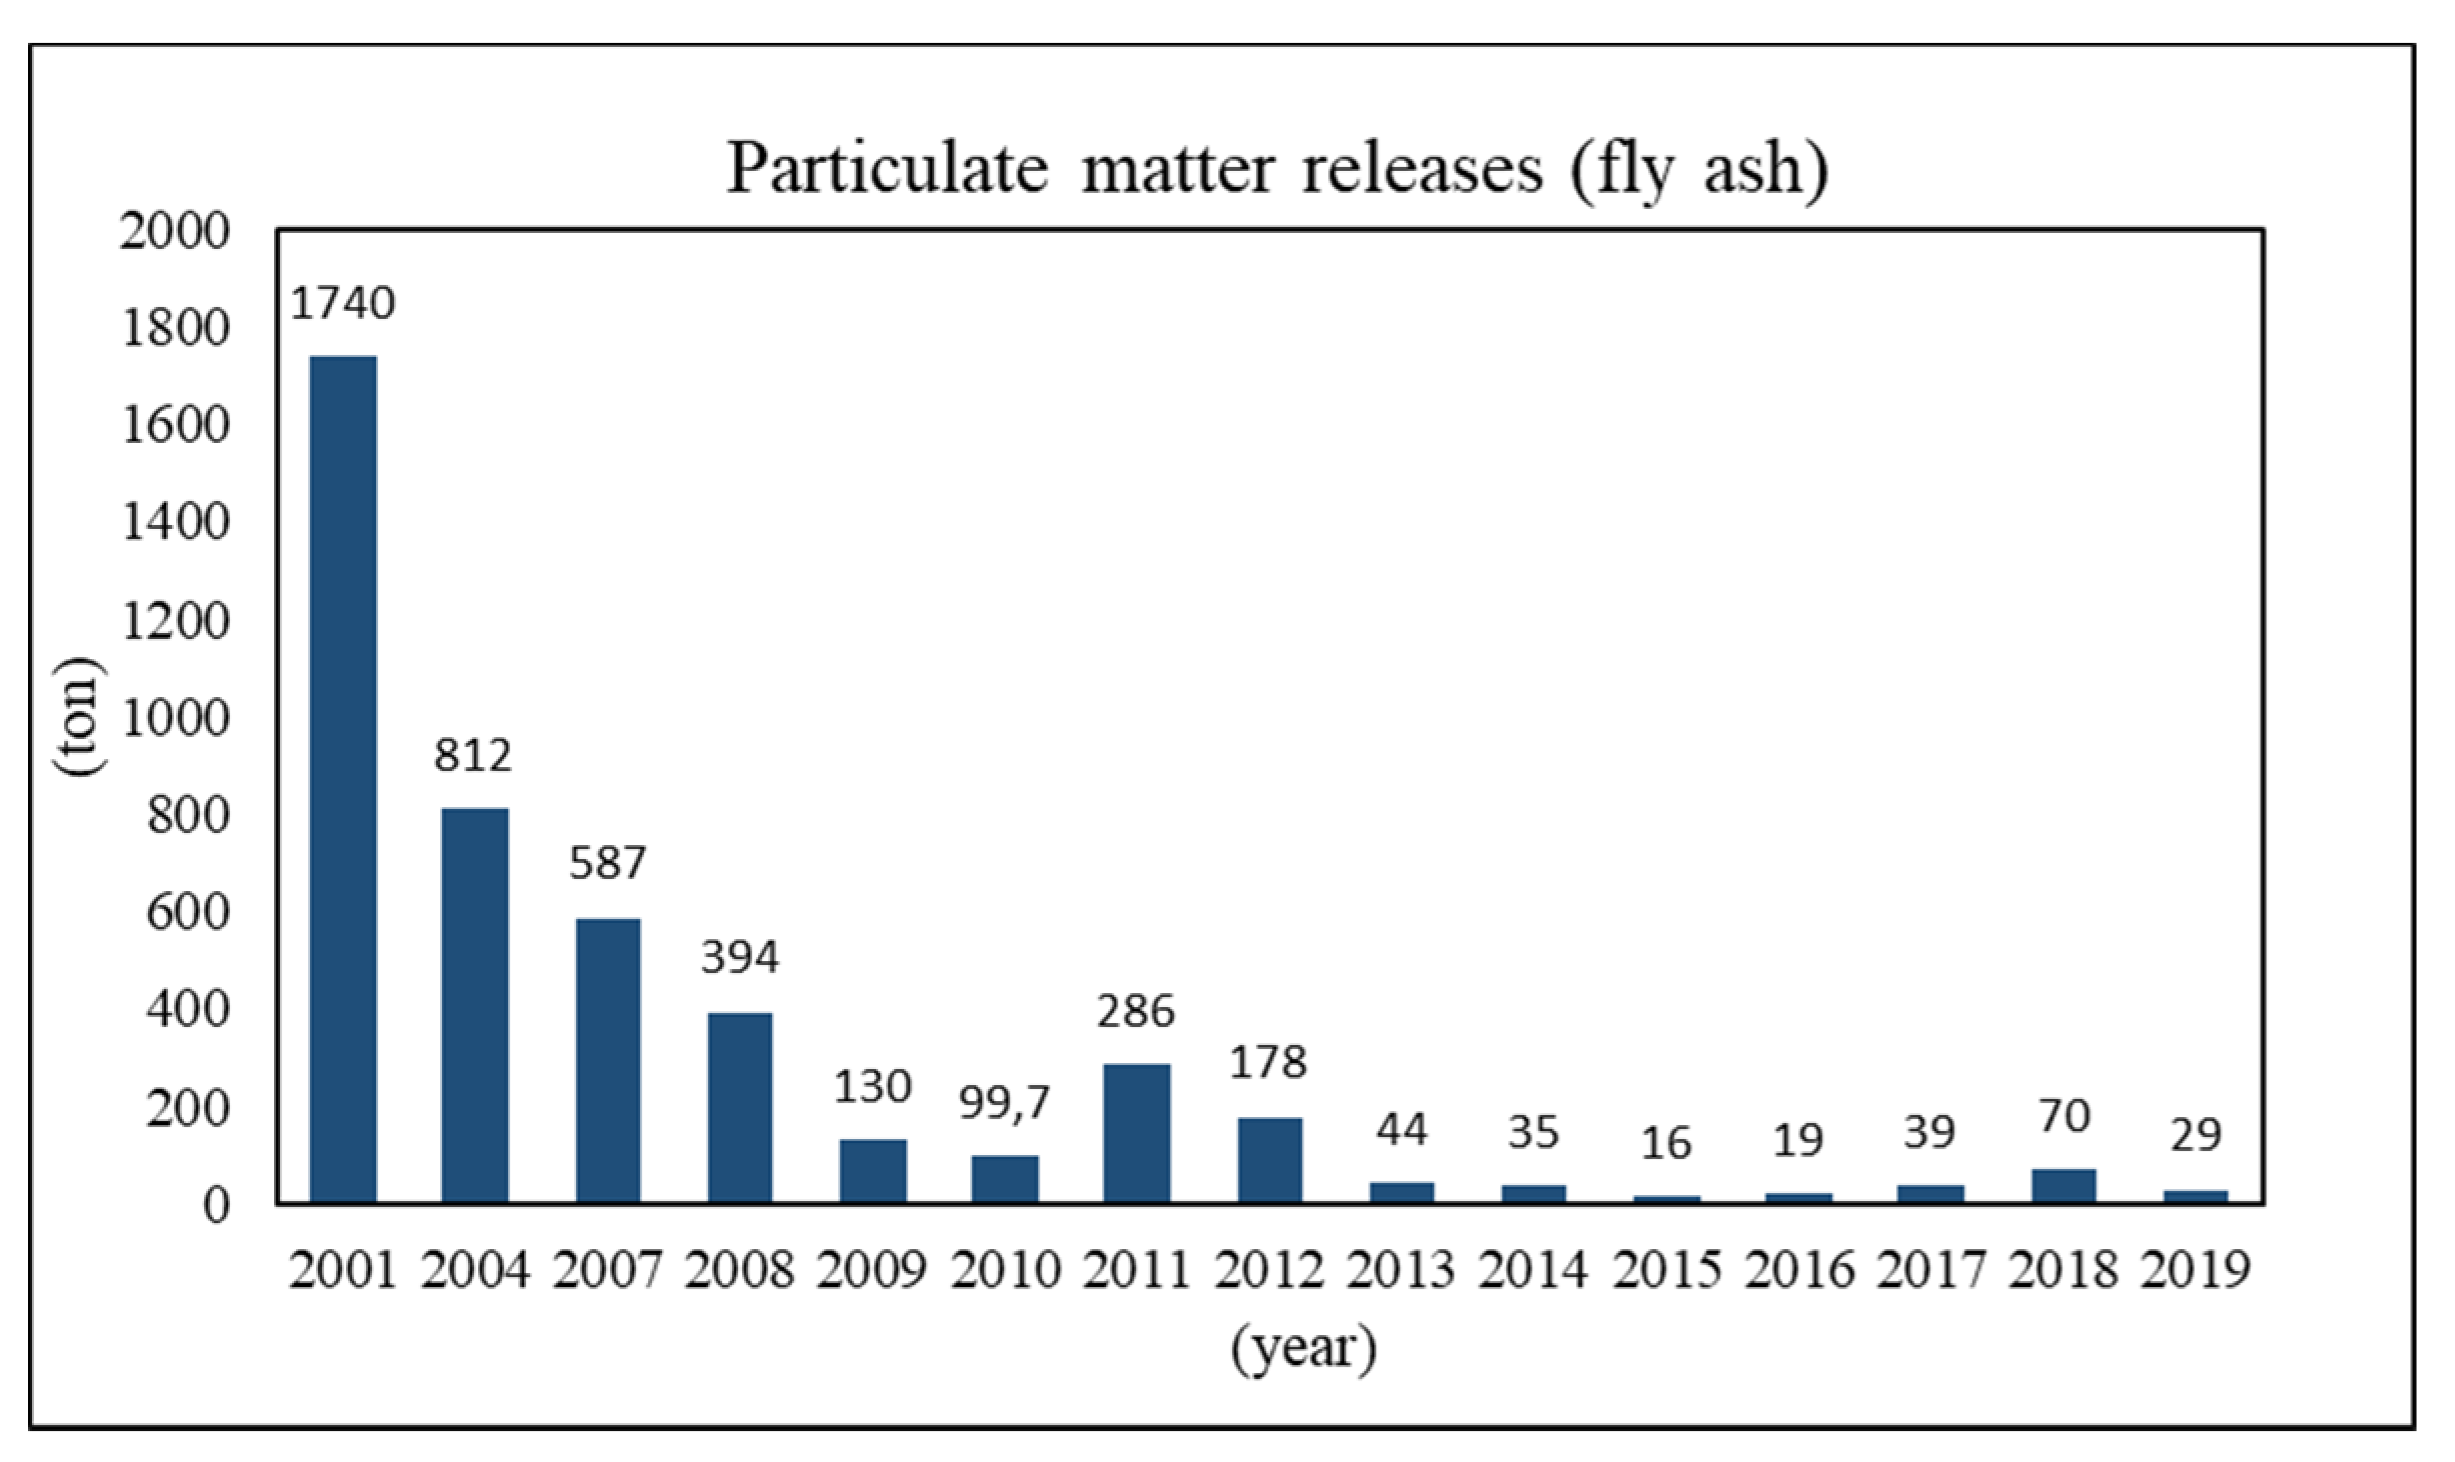
The database “European Pollutant Release and Transfer Register” used to present data on this particular emission source (2001–2012). The data refers to heavy metals and particulate matter (fly ash). Since 2012, the EDP has published a yearly report with data on the atmospheric emissions from this coal-fired power plant (
Figure 1).
The general trend for the atmospheric releases of particulate matter shows a significant decrease over the years. However, the amount released almost tripled from 2010 to 2011 and increased from 2016 up to 2018. This variation of the particulate matter emissions is directly related to the higher or lower electricity production in the respective year.
2.2. Measurement Locations
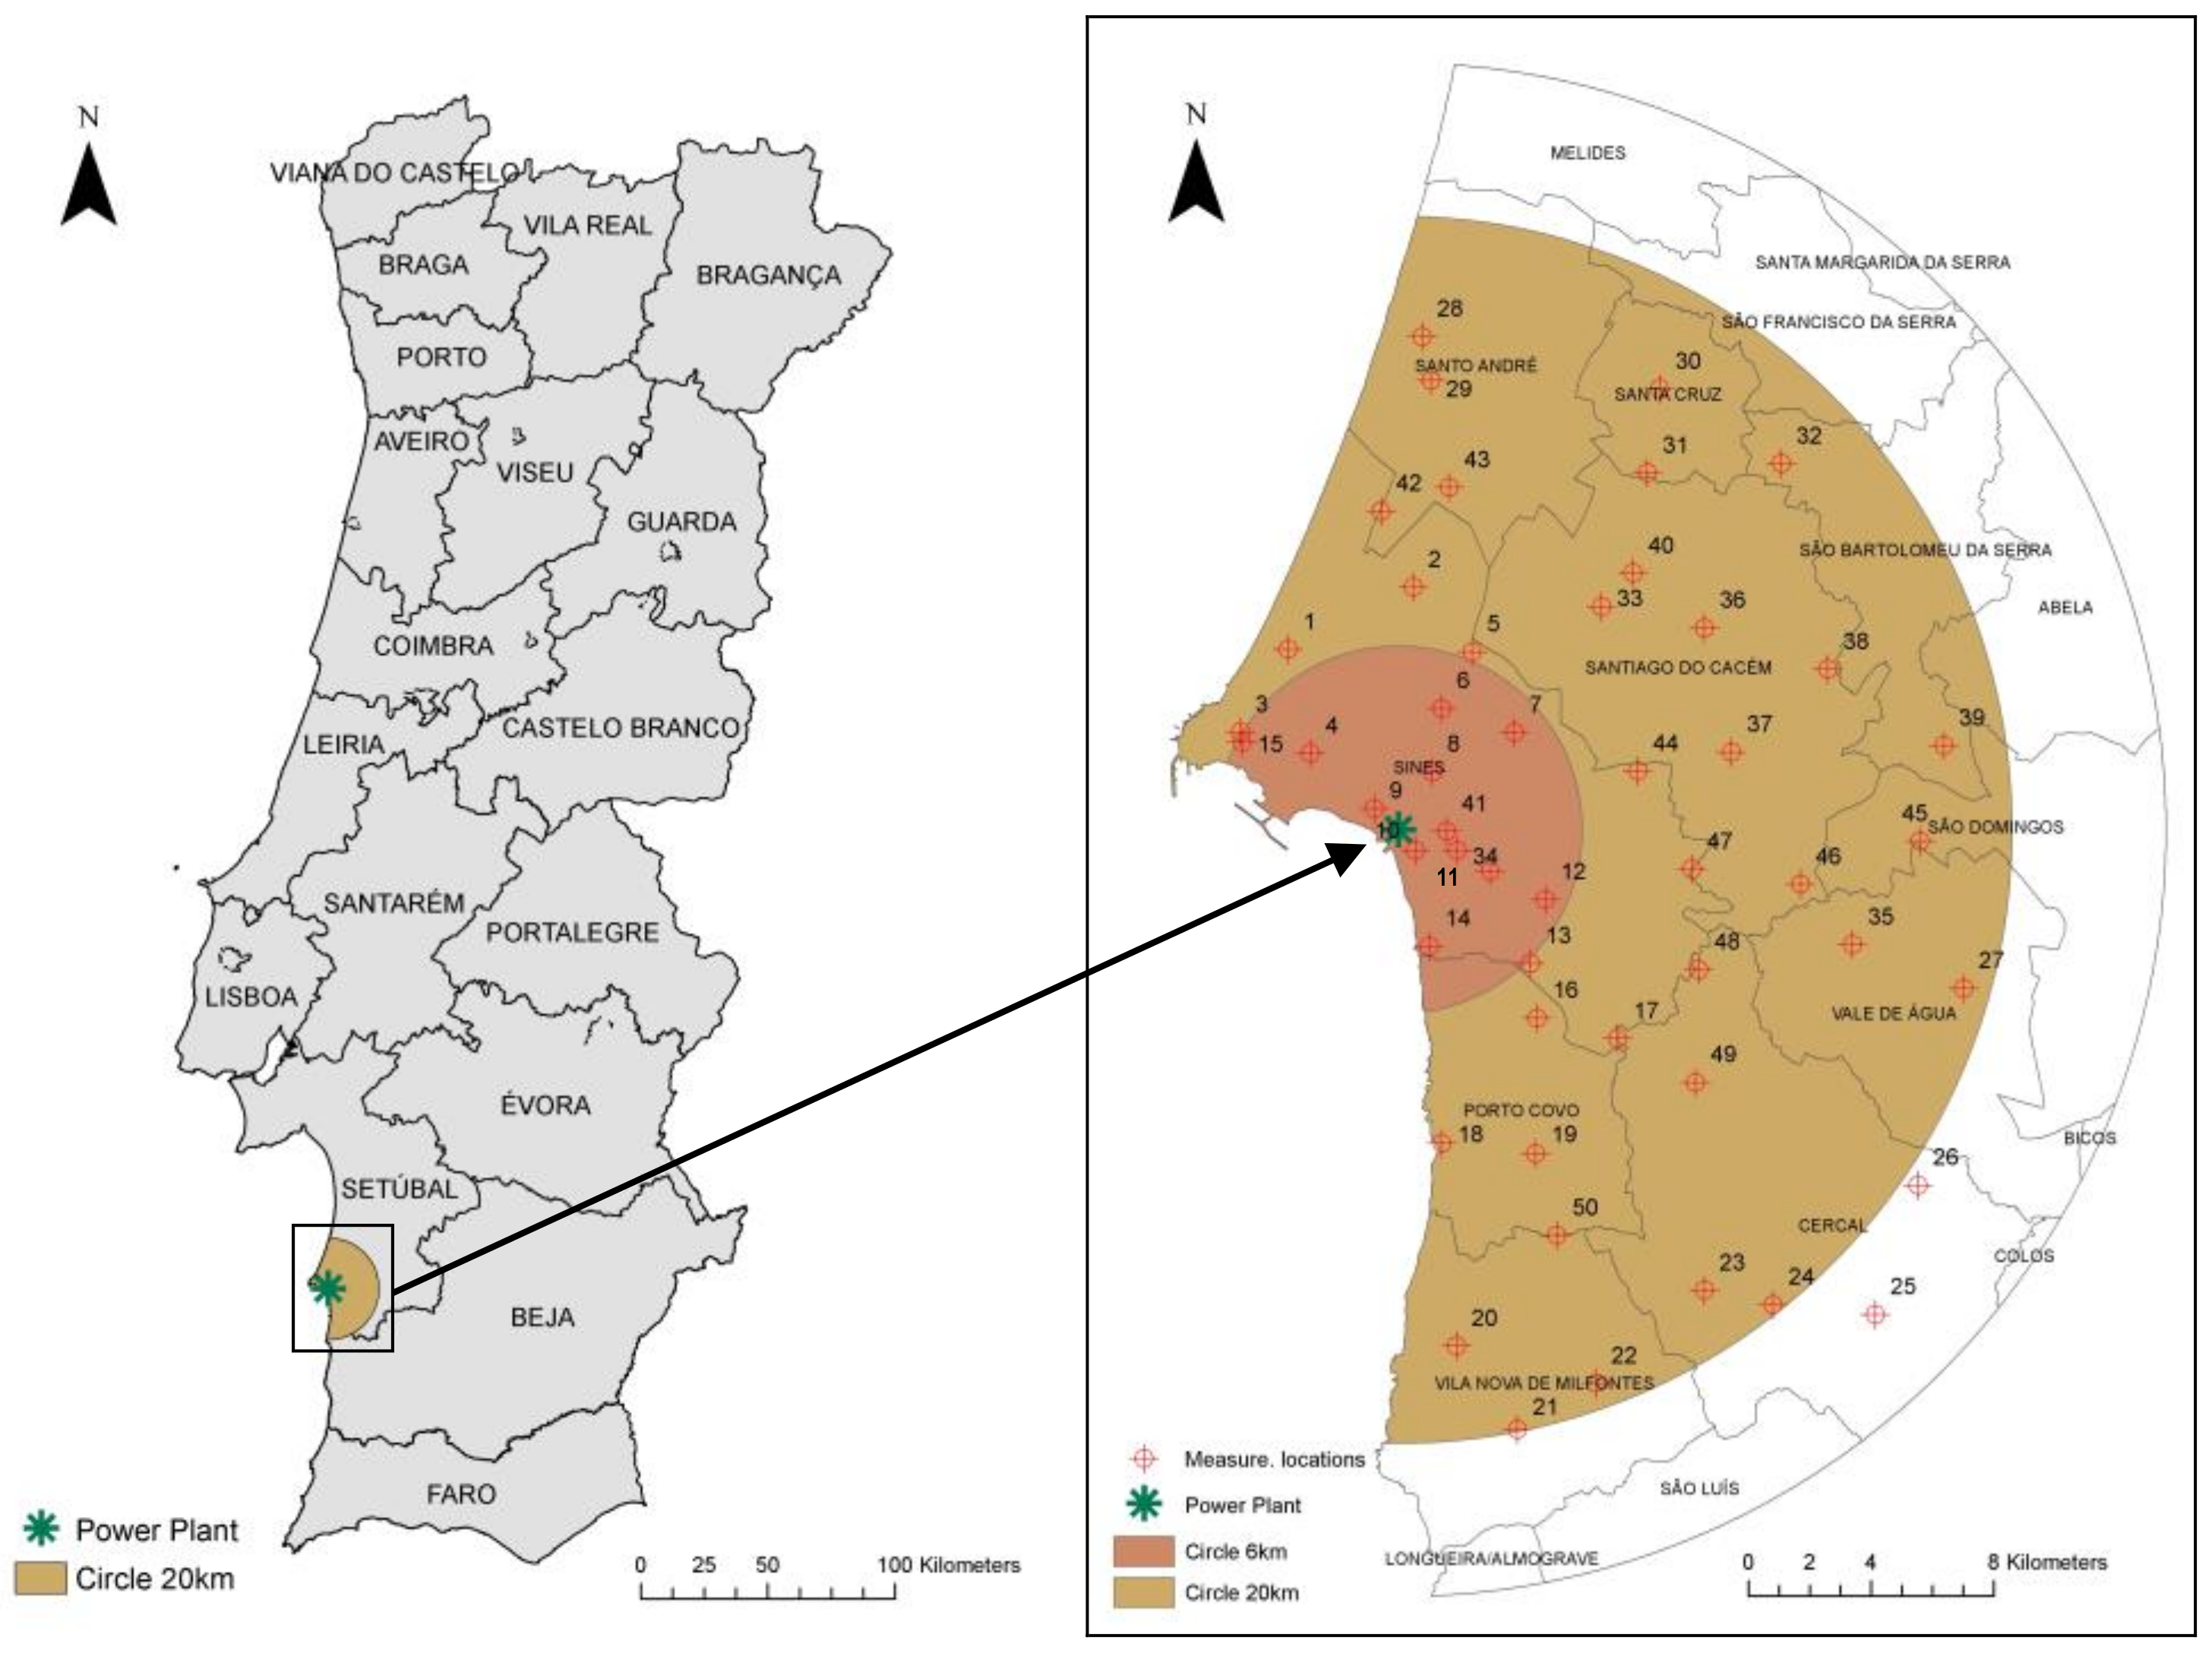
The study area was delimited to a 20 km circle around the coal power plant centred in the stacks. The measurements were carried out at fifty locations, as shown in
Figure 2.
Approximately 15 urban and suburban sampling points (SP) were established within a radius of 6-km around the coal fire-power plant (SP3 to SP15, SP34 and SP41). The other 35 were set between 6 and 20 km from the power plant (SP1, SP2, SP16 to SP33, and SP35 to SP40 and SP42 to SP50). A total of ten measurement points was defined as control (SP21, SP22, SP25, SP26, SP27, SP28, SP30, SP32, SP39 and SP45) in areas where the influence of the power plant emissions is expected to be inexistent [
19,
20]. Both areas were defined, taking for reference the stacks, considering the wind direction, velocity and frequency, to assess the possible exposure of a population living up to 20 km from the source.
The Portuguese Environmental Agency (APA) is responsible for the radiological surveillance of the environment in Portugal. The data collected between 2010 and 2019 for ambient gamma radiation dose rate corresponds to the natural radioactive background of each site where the measurement was taken. This natural radioactive background varies according to local geology and altitude. For the Sines region, the measured value by APA is 86 nSv/h, on average, which was considered the natural background of the study area.
The measurement points were defined applying the “systematic random sampling” procedure [
21], taking into consideration the height of the stacks, the distance from residential areas, accessibility to the locations and local climatological features (wind direction, frequency and velocity).
The wind predominantly comes from the N-NW sector in this region, with an annual frequency of 20%. There is a significant change of this frequency in the autumn season, indicating that the prevailing wind direction is from N to S (frequency of 34.5%). Lower frequencies are associated with S-SW (8%), N-NE (10%) and S-SE (10%) sectors.
The wind velocity is relatively constant with long calm periods; stronger winds occur in the N-NW sector with maximum rates during the winter season. The annual average of wind velocity ranges between 3 and 6 m/s; higher speeds are associated with the N-NW, S-SE, S-SW and W-SW sectors (6.0 m/s, on average), while lower velocities are associated with E-NE (3 m/s) and E-SW sectors (4 m/s).
2.3. Field Site Measurements and Analytical Methods
Measurements and sampling campaigns for dust fallout, metals and radioactive elements were carried out in the study area twice a year. The results presented in this work refer to the field campaigns between March and April (SC1) and between September and October of the same year (SC2). The prevailing wind direction during these two sampling periods was from N-NW and N-NE, respectively.
For natural radioactivity, the in-situ measurements were conducted using a gamma-ray spectrometer and a scintillometer detector counter within the 20 km circle area.
The in-situ concentration of metals in surface soil was carried out with a portable analytical X-ray dispersive energy fluorescence spectrometer (XRF).
The deposition flux of dust fallout was assessed with a passive method, following the French standard NF X43-007 (1973; 2008).
A few measurements were performed outside the study area, in the dominant wind direction and the opposite direction, for the control scenario in case there is a significant enrichment of the environmental pollution at long distances from the stacks.
2.3.1. In-Situ Gamma Spectrometry
The concentrations of natural radionuclides were determined using a high purity germanium detector (HPGe). The HPGe type, a Broad Energy Germanium Detector (Canberra Falcon BEGe), covers an energy range from 20 keV to 3 MeV. Energy and efficiency calibrations were done using an Eu-152 source.
Genie 2000 and ISOCS/LabSOCS (mathematical efficiency calibration) software from Canberra’s were used for qualitative and quantitative analysis. The gamma spectra were acquired during 5000 s for in-situ measurements, as well as for the calibration procedure, with the detector facing downwards at 1 m above the ground. Gamma energy lines were matched at several levels to a library of possible isotopes resulting from naturally occurring radioactive materials (Dinis et al., 2013).
The quantitative results were obtained by ISOCS/LabSOCS software after configuration for field measurements. The gamma-emitting daughters of the radium and thorium decay chains were used as the basis for determining the activity concentrations, which were considered to be in secular equilibrium with their parent,
226Ra and
232Th, respectively. The
226Ra activity was evaluated from the weighted mean of the activities of the photopeaks of
214Pb and
214Bi (295 keV, 352 keV, 609 keV and 1765 keV). The activity of
232Th was determined from one photopeak of
228Ac (911.2 keV) and two photopeaks of
208Tl (583.1 and 2614.5 keV), and
40K activity was determined from its 1460.8 keV gamma line [
22]. The minimum detection activity (MDA) for the above detecting system was 17.3 Bq/kg, 4.2 Bq/kg and 5.1 Bq/kg for
40K,
226Ra and
232Th, respectively. The uncertainty of the measured activity concentration was estimated to be 3 to 6%.
It is generally assumed that the deposition of fallout from anthropogenic sources varies with soil depth. As such, for in-situ gamma spectrometry measurements, it was considered that no erosional processes or human activities such as ploughing had disturbed the site. Furthermore, only the activity concentration of radionuclides in the 30 cm of the soils are responsible for the gamma rays detected by the equipment. Therefore, the measurements of the ambient dose rate are related only to the activity concentration in this part of the soil profile.
2.3.2. Total Gamma Radiation and Gamma Dose Rates
Total gamma radiation was measured 1 m above the ground using a sodium iodide scintillation detector (Saphymo-SRAT SPP2 NF). The accuracy of the NaI(Tl) (sodium iodide activated with thallium) scintillometer is ±10%, and the operation range for gamma radiation is from 0.02 to 30 µSv/h.
The gamma radiation measured with this detector is expressed in counts per second (cps). The calibration line of the equipment allows converting counts per second (cps) into milliRöentgen per hour (mR/hr). The cps unit indicates the quantity of radioactivity, while the mR/hr unit describes radiation exposure and is defined as the amount of gamma radiation that will produce one unit of electrostatic charge in one cubic centimetre of dry air. The concept of exposure is now rarely used in radiation protection but is usually reserved for expressing the output of radiation sources. The SI unit of exposure is Coulomb per kilogram (C.kg
−1) [
23,
24,
25].
The correspondence between cps and mR/h, directly indicated by the graphic printed in the equipment, refers to the energy of gamma radiation from a Cobalt 60 source (60Co). For average energy detected different from 1.25 MeV (60Co average gamma-emitting energy), the value read directly from the correspondence line must be multiplied by a coefficient factor, K, to correct the dosage strength from other sources than 60Co. The average energy from the primary gamma rays of the 238U (351.92 keV, 609.32 keV, and 1764.49 keV), 232Th (2614.53 keV, 238.63 keV, and 583.19 keV) and 40K (1460.83 keV) was used to adjust a correction factor of 0.78 (for average energy of 1.17 MeV).
2.3.3. Total Gamma Radiations and Gamma Dose Rates
The concentration of metals in soils around the coal-fired-power plant was also assessed in-situ. A portable analytical X-ray dispersive energy fluorescence spectrometer (XRF) was used. Two measurements were performed at each sampling location. Approximately 20 elements were registered at each location: Al, As, Ba, Ca, Cd, Cr, Cu, Fe, K, Hg, Mo, Mn, Na, Pb, Rb, S, Sr, Ti, Zn and Zr. Metal contents in soils were compared with legal limits for the maximum concentration according to soil use: agricultural, residential and industrial.
2.3.4. Sampling and Monitoring Dust Fallout
To determine the deposition flux of dust fallout and its potential spatial heterogeneity, airborne atmospheric dust was collected by a passive system following the French standard NF X43-007 (1973; 2008). A month period was chosen to calculate the deposition flux. In this case, 13 dust sedimentation plates were placed inside the inner circle around the plant, and 27 others were placed in the outer subarea, at about 3 m above the ground. This height above the ground was adopted to assure that the collectors were recovered after the collecting period without being damaged.
2.4. Data Analytical Tools
2.4.1. Geostatistical Approach
Different techniques have been applied to assess the variability of pollutants concentration in the environment. In particular, geostatistics has been widely applied in investigating and mapping the spatial variability of radionuclides and heavy metals in the environment: air, water, soil, etc. [
2,
16,
26,
27,
28,
29,
30,
31,
32,
33,
34,
35].
Geostatistic is based on the theory of a regionalised variable exhibiting a particular structure of spatial correlation, and it was defined by [
36] as “the application of probabilistic methods to regionalised variables” in order to characterise that spatial structure.
Typical regionalised variables are functions describing variables that have geographic distributions exhibiting spatial continuity. Geostatistic can be used to obtain the spatial correlation of variables (the spatial similarity between the samples), providing also a quantitative basis for interpolating unknown points at unsampled locations.
There are many different kriging algorithms, depending on the chosen model for the trend of the random function, and many of them are reviewed in [
26] with references to soil applications. In this work, only the geostatistical interpolation method, known as ordinary kriging, was applied to create the prediction map of the spatial dispersion of the environmental pollution around the coal-fired power plant.
For the data analysis, it was used the SPSS (Statistics 28), for descriptive statistical parameters, and the geostatistical analysis was performed with the software Surfer (Golden Software Surfer 8.0).
2.4.2. Nonparametric Approach
By definition, nonparametric statistics encompasses statistical methods that are not constrained by assumptions about the underlying distribution of data. Consequently, they can easily accommodate data that have a wide range of variance and can be used with both quantitative and qualitative data. It can be contrasted with parametric statistics, which makes explicit assumptions about the distribution of observed data and which uses the data to estimate parameters of that distribution.
Two nonparametric tests were used to analyse the statistical difference between the data collected in two sampling campaigns (beginning of spring and end of summer): the Rank correlation coefficient (τ) and the Mann-Whitney U test.
The Rank correlation coefficient (τ) evaluates the degree of correlation (degree of similarity) between two independent variables using ranks of the data rather than the raw data to calculate the correlation [
37]. There are several advantages in using this correlation coefficient: (i) it is a nonparametric technique, so it is unaffected by the distribution of the population; (ii) as it is operated on the ranks of the data, it is relatively insensitive to outliers, and there is no requirement that the data be collected over regularly spaced intervals; (iii) it can be used with very small sample sizes and (iv) it is simple to apply. The main disadvantage is that there is a loss of information when the data are converted to ranks (Gauthier, 2001). The numerical value of the correlation coefficient (τ) ranges between −1 and +1. Therefore, this coefficient was used to determine whether there is a similarity between data collected in SC1 versus data collected in SC2 through the calculation of the degree correlation τ (a statistically significant difference) between these two sampling events. The purpose was to analyse if there is a significant variation of the results between the two sampling campaigns. The atmospheric emissions from the coal-fired power plant have periodic fluctuations as the production is often suspended over the year to meet energy sources shares (thermoelectric, hydro and wind power). This situation was verified in the deposition flux of collected particulate matter in the second sampling campaign. The quantity of deposited material was much lower than in any other campaign [
38]. During this sampling period (March and April), the coal plant was not working at full power, which means lower emission rates.
The Mann-Whitney U test is used to detect whether two or more samples come from the same distribution or test whether medians between comparison groups are different, under the assumption that the shapes of the underlying distributions are the same. This test allows drawing different conclusions about the data depending on the assumptions made about its distribution. The findings can range from merely stating whether the two populations differ to determining differences in medians between groups.
3. Results and Discussion
3.1. Total Gamma Radiation and Dose Rates
Readings of total counts per second were recorded at every sampling location, and gamma exposure rate (mR/h) was obtained through the adopted correction factor. Outdoor gamma absorbed doses (nGy/h) were calculated using the relation 1 μR/h = 8.7 nGy/h, which comes from the definition of Röentgen [
39,
40,
41]. The cosmic ray contribution was stripped from the in-situ measurements as proposed in the report of [
42]. The results of gamma dose rates are presented in
Table 2 for the arithmetic mean (AM), median (MD), standard deviation (SD) and values range (Min-Max) of both campaigns (SC1 and SC2).
The results between SC1 and SC2 are very similar, and this was also verified in the following field campaigns where an r-square coefficient equal or higher than 0.96 was obtained. On average, the obtained results for the dose rate (nGy/h) are slightly higher than the values reported by APA [
43] and taken as the background.
The distribution which best describes the data, in particular the shape of the distribution, often indicates which statistical test would be most suitable for analysing the data [
44]. In this way, the frequency distribution of both data sets was tested against a normal and a log-normal distribution by the Kolmogorov-Smirnov test (significance level
p > 0.05).
The K-S normality test should be rejected for a confidence level of 5% (p = 0.047 < 0.05 for SC1 and p = 0.001 < 0.05 for SC2) showing that both data sets are not normally distributed. Nevertheless, the K-S test could not be rejected for a log-normal distribution of SC1 data set (p = 0.2 > 0.05).
The calculated coefficient (τ) for the correlation between data from SC1 and SC2 was 0.86. To test the significance of this result at the 95% probability level, this value must be compared with a critical one τcrit = 0.191 (samples of size n = 50, given value of α = 0.05, two tails). Since the calculated value of 0.86 exceeds the critical value, we can conclude that the correlation is significant at the 95% probability level, meaning a strong agreement or high similarity between the two data sets.
For the nonparametric Mann-Whitney U and considering 5% level in a two-tail test, the null hypothesis states that the samples (measurements) were drawn from populations with the same distribution (Median SC1 = Median SC2). In this situation, the test is used to determine whether there is a statistical difference between dose rates in SC1 versus dose rates in SC2. The results of this test indicate that the null hypothesis cannot be rejected if the p-value given by the test (0.697) is >α (0.05) or if the calculated value Z (−0.390) is lower than the critical value (Zcrit = 1.96) at 5% level, two tails. At this level of significance, we cannot reject the null hypothesis meaning that there is no difference in the medians of the two sets of measurements, and these were drawn from the same populations with equal distribution. In conclusion, there is no statistical difference between the two sampling campaigns for natural radioactivity.
3.2. Particulate Matter Dispersion and Deposition
The deposition flux was calculated according to the standard NF X43-007 and is presented in
Table 3 and
Table 4 for each one of the sampling campaigns. The distance between the sampling points and the stacks, as well as their orientation, is also presented.
For both areas, the flux deposition is much lower in SC2 where an r-square coefficient of −0.39 was obtained within the 20 km area but an r-square of 0.72 was obtained for the 6 km area. The lower deposition flux obtained for SC2 may be explained because the coal plant was not in operation in 17 out of 28 fully sampling days.
The results also showed high variability among the sampling points for both areas. The minimum, average and maximum deposition flux values per month for the 40 sampling points are presented in
Table 5.
The meteorological conditions, atmospheric stability, particle size, and stack height are the main parameters that influence the dispersion of solid particles and the dispersion through the atmosphere [
45]. The extent and rate of dispersion are related to atmospheric turbulence, which in turn depends on the atmosphere’s stability. When the atmosphere is unstable, turbulence is enhanced. If the atmosphere is stable, there is no turbulence. Under the same wind direction and wind speed, the dispersion will be larger in a more unstable atmosphere. The atmospheric stability classes are categorised in terms of surface wind speeds, daytime insolation and nighttime cloudiness.
In general, a small fraction (~6%) of the emitted particles from a coal power plant with a very tall stack fell within a few km. Very tall stacks ensure maximum atmospheric dispersion before ground impact and therefore is not expected high deposition rate near the source. However, specific local factors may affect dispersal, such as downwash, buildings, and other point sources, changing the deposition pattern near the stack.
The variation pattern of particles deposition observed within the 6-km area in sampling points: nº 4, 8, 11 and 34, and also in the outer area (20 km), in sampling points: nº 1, 18, 21, 23, 24, 25, 26, 27, 31, 32, 33, 38, 39 and 40, suggests the contribution of emissions from more than one source overlapping. In these cases, such additional emissions may reverse the typical pattern of dust deposition.
Besides the existence of other industrial facilities in the studied area, there is also a substantial open-air coal pile deposit located near the stacks. In particular, the deposition flux observed for sampling points nº 4 and nº 8 may be explained by the dispersion of unburned coal particles from this pile. The other situations may be explained by the emissions from other industrial facilities located at NW and N, road traffic and agricultural practices for the sampling points more distant from the stacks where rural and agricultural areas prevail. On the other hand, the height of the stacks (225 m) may influence fallout dispersion up to a distance of 20 km or more.
The dispersion of particle emissions with wind parameters as well as the dispersion in the dominant wind direction is a little more complex process as the observed trend does not completely follow the wind patterns.
In SC2, the deposition occurs mainly at NW and NE. In the E-SE sector, at distances relatively close to the stacks, the flux deposition pattern is similar. Peaks deposition flux occur for sampling points nº 11 (SC1) and nº 13 (SC2), located at distances comprised between 4150 and 6300 m S-SE from the stacks. These two peaks may have a contribution from the coal deposit around the stacks. The fallout particles observed in the NW sector may be attributed to other pollution sources located at N and NW of the coal power plant.
For sampling point’s nº 26 and nº 39 located at distances of 18 and 21 km from the stacks, respectively, it was observed an increase in the flux deposition in the southeastern and eastern sectors. These two sampling points are located in rural areas near the road and may have a contribution from either agricultural practices or road traffic.
Another point of discussion concerns the wind velocity; higher values due to the strong winds occurring at NE direction may be responsible for the increasing deposition flux as observed at sampling point nº 40. Additionally, terrestrial breeze, which occurs in particular at night, may reverse the expected flux deposition pattern as it is observable at sampling point nº 18 located at the south of the coal-fired power plant.
Finally, the flux deposition during SC2 follows a different pattern as wind parameters are also different. The influence of intense rainfall periods during this sampling campaign increased the precipitation by approximately 40% comparing with the sampling period of SC1. This rainfall event may suggest particles washout by rainfall as the dispersion occurred downwind from the source, causing lower deposition fluxes.
3.3. Element Concentrations in Surface Soils and Their Characteristics
The concentration of twenty elements was registered with the portable XRF spectrometer: As, Ba, Ca, Co, Cu, Fe, Hg, K, Mn, Mo, Ni, Pb, Rb, S, Sb, Se, Sr, Ti, Zn, Zr. The average values and the statistical description for the concentration of the selected elements, according to the distance to the potential emitting source (6 km area and 6–20 km), are presented in
Table 6.
Some of the selected elements were detected in few sampling points: Co, Hg, Mo, Ni, Se and Sb, in addition to Ba for SC2. Elements content in soils were compared with the maximum permissible concentration according to soil use: agricultural, residential and industrial. The Canadian Soil Quality Guidelines for the Protection of Environmental and Human Health were used for comparison with the selected elements (
Table 7).
The concentration values obtained for As, Co, Sb and Se are above the respective limit for all types of land use, but Cu, Pb and Sn are below the guidelines values. Barium, mercury and molybdenum exceed the legislation limits for agriculture and residential soils. Nevertheless, it should be noted that some of these elements were detected in very few sampling points.
The same variation pattern was observed in SC2 as for Pb, Zn and Cu, the concentrations are below the limits of the guidelines and As and Co concentrations are above the legislation limit for all types of soil use. For other elements, the concentration levels are above the limits for agricultural and residential soil use: Ba, Hg and Mo.
All concentration levels decreased significantly from SC1 to SC2. This variation may be a consequence of soil moisture content for SC2, carried out after an intense rainy period. Excessive soil moisture is a limitation in using field XRF; the higher the soil moisture in a particular matrix, the lower the reported concentration relative to the actual concentration. The actual difference may vary significantly for all samples from a site [
46].
For both sampling campaigns, the obtained concentrations are higher in the outer sampling area (6–20 km) with the exception of Sr and Ti for SC1 and Ba, Sr and Ti for SC2.
The deposition of atmospheric particulates is one of the main routes for heavy metals entering into the environment. Heavy metals present in the atmospheric particulate matter include Mn, Cu, Zn, Cd, Cr, Fe, Ni, K, Ca, V, Ba, As, Se and Sr are the most commonly found metals in atmospheric pollution sources.
The atmospheric dispersion of particulate matter depends on meteorological conditions, particle size and stack height: ~6% of the emitted particles from a coal power plant with a 300 m stack fell within 5 km. In power plants equipped with electrostatic precipitators, most particles released have less than 2 µm in diameter, which can agglomerate, accelerating the deposition near the source even though smaller particles can travel between 100 and 1700 km [
47].
In the present case, the height of the stacks and the dispersion by strong seasonal winds could explain the observed enrichment of the selected elements in the area between 6 and 20 km (a consequence of many years of atmospheric emissions). However, some of the typical heavy metals associated with coal combustion emissions such as Cd, Cr, Hg and Ni were not detected in the sampling area or in a significant number of cases. In this situation, the contribution to metals in the superficial soils must come from diverse pollution sources.
On the other hand, the in-situ XRF technique has some limitations, in particular, related to high soil moisture; metals interference (Fe tends to absorb Cu X-rays, whereas Cr levels will be enhanced in the presence of Fe); and lack of sensitivity due to peak overlapping (high detection limits demanding more field measurement time; Cd and Hg are not detected easily by XRF because of their detection limit) [
46].
3.4. Geostatistical Analysis
3.4.1. Gamma Dose Rates
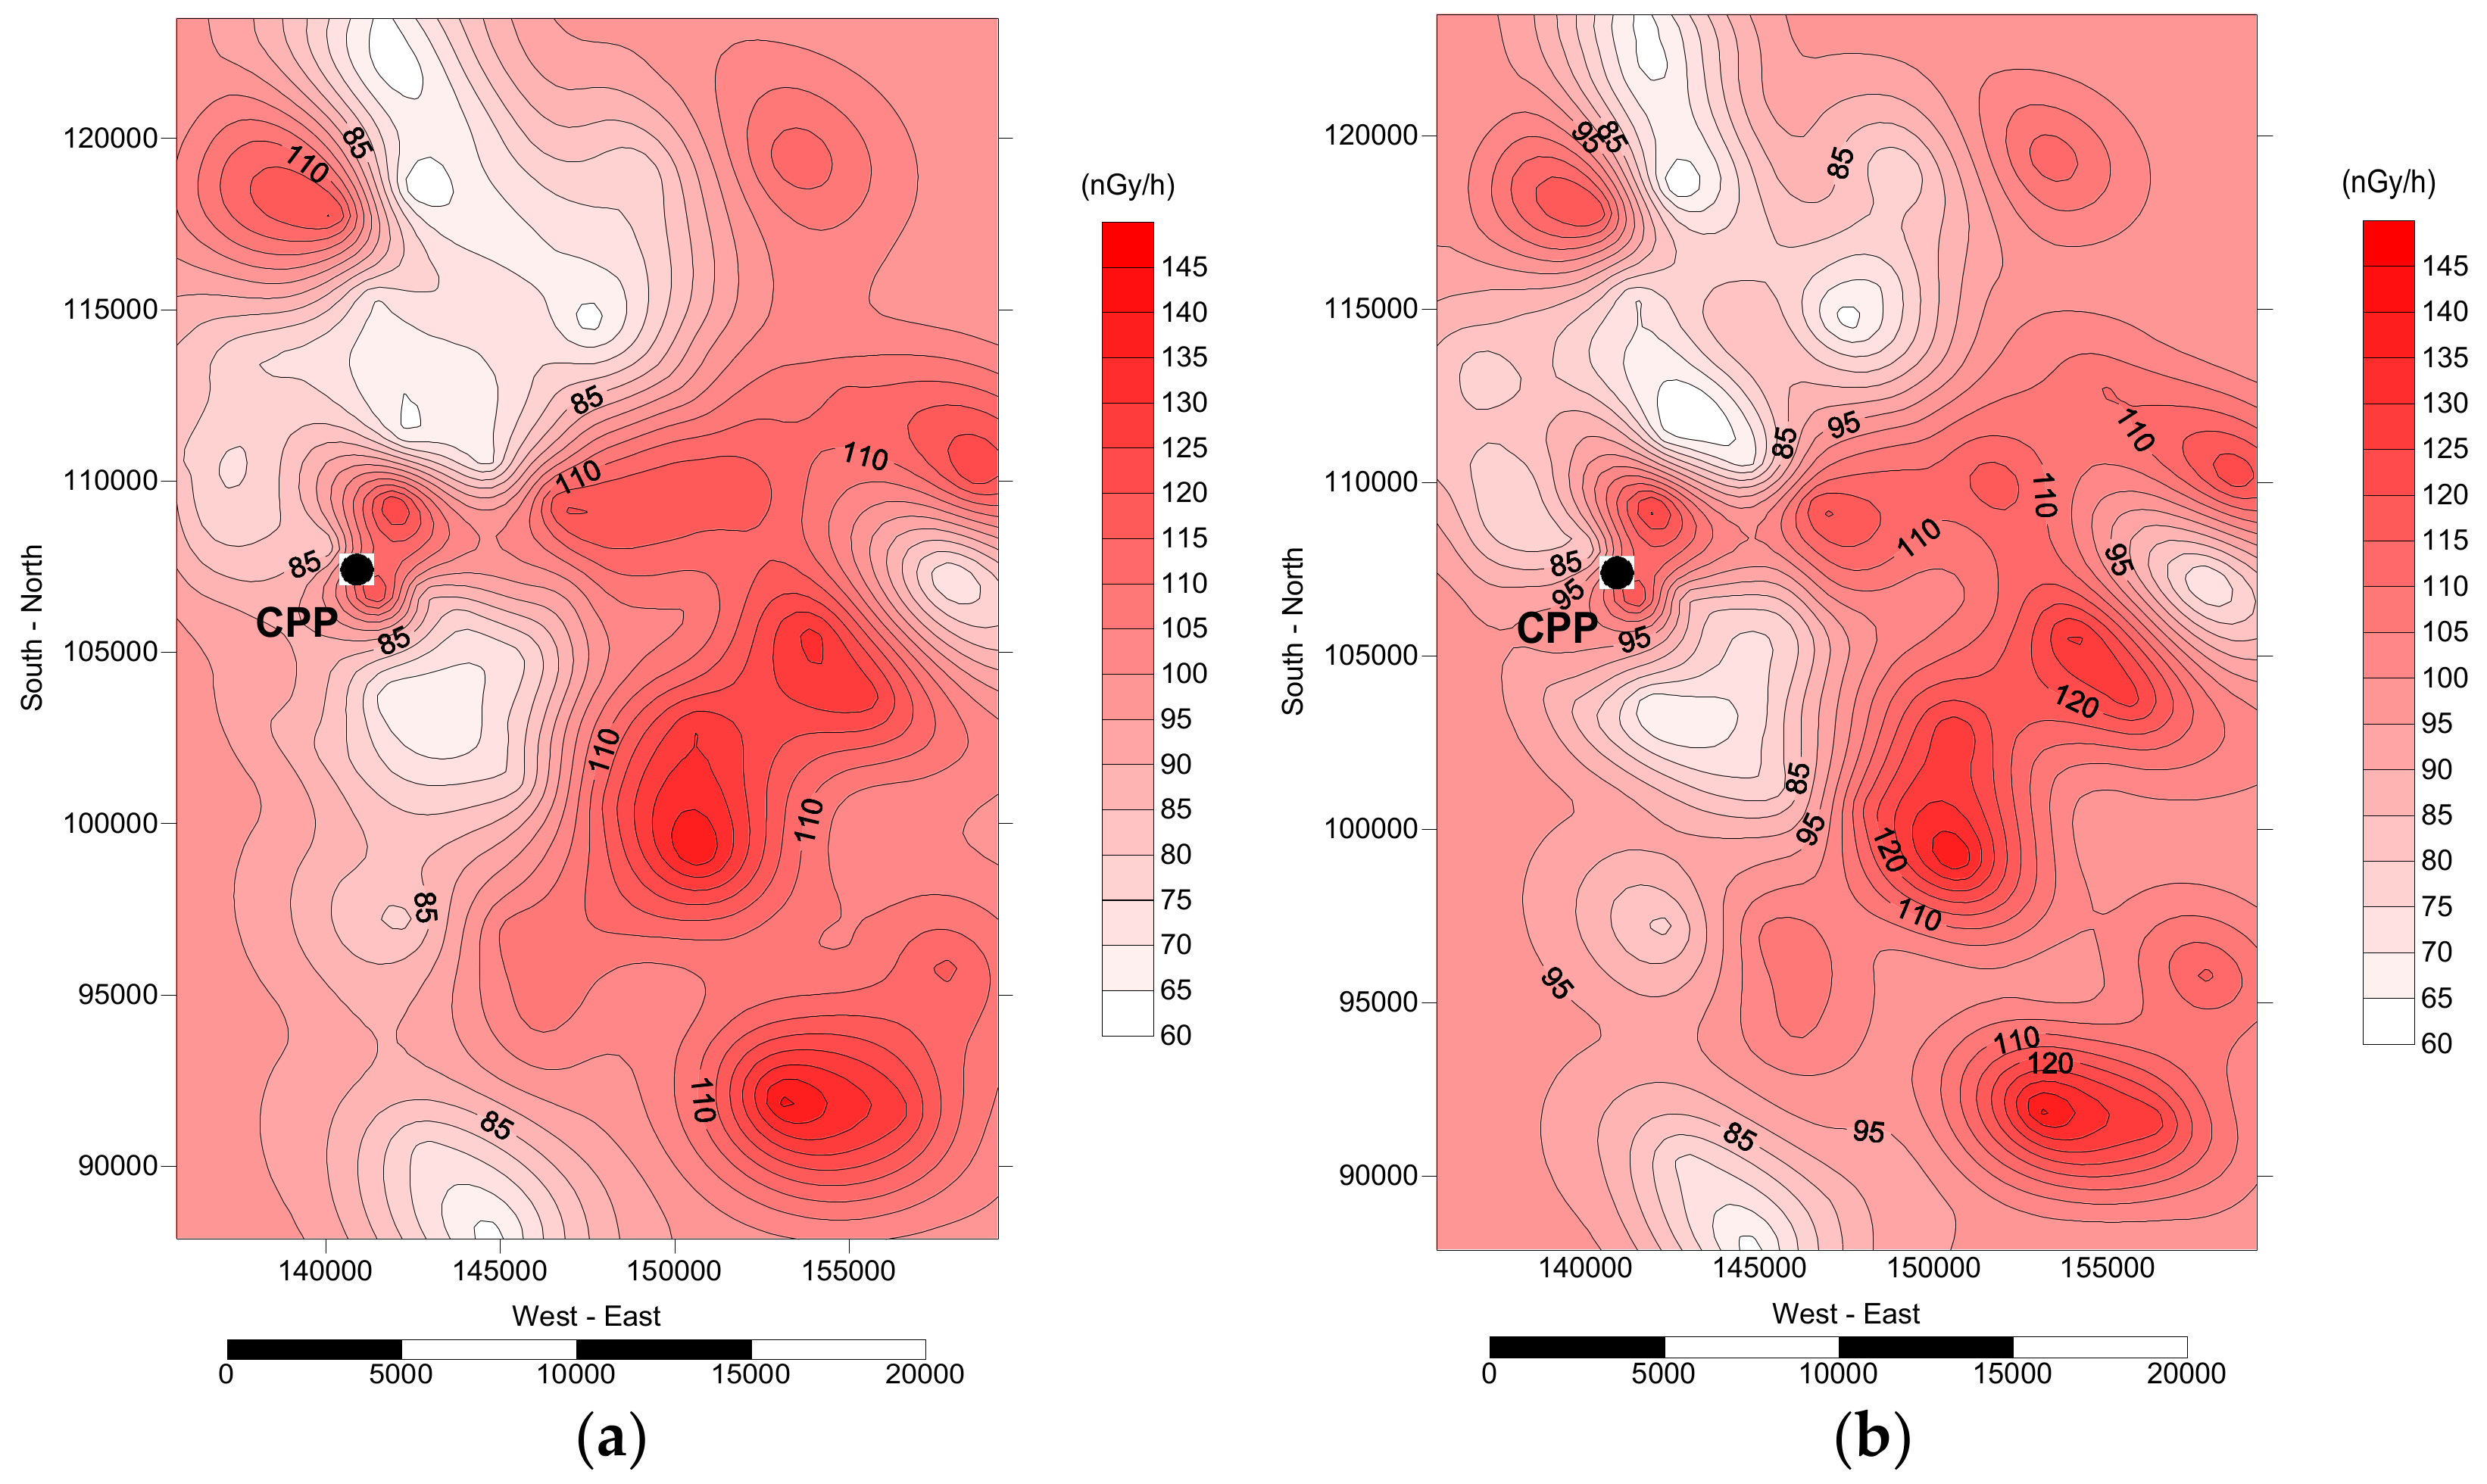
The prediction maps of gamma dose distribution (isodose contour map) were created by the ordinary kriging and are displayed in
Figure 3, showing the spatial variation of gamma radiation dose rates generated from the respective variograms. The stacks are located at approximately 141,000 m (x) and 107,600 (y) and are indicated as CPP.
The represented data refers to the terrestrial component only, obtained by subtracting, to each measured value, the cosmic component obtained as proposed by [
42] using the altitude over the sea of each sampling point.
The maps present a strong gradient dose rates with the distance from the stacks, mainly in the prevailing wind direction, where higher dose rates were obtained (SP24, SP25, SP32, SP46, SP49 and SP48). The distribution of the ambient dose may reflect different geological units, and in this case, the local occurrence of main anomalies should coincide with the highest elevations. Nevertheless, a weak correlation factor was obtained for gamma dose rate and the elevation (~0.5).
Lower gamma dose rates were found at S and N from the stacks (SP21 and SP43). Some of the measurements locations selected for control did not present the lowest dose rates. The exceptions were SP28 (N), SP27 (E), SP45 (E) and SP21 (S), located in the boundary of the studied area.
Regarding the area within the circle of 6 km, higher values correspond to two locations at NE (SP8) and SE (SP10) located at 2 km and 1 km from the stacks, respectively. For the area within the 6–20 km circle, higher values correspond to the locations placed both at 12.5 km from the stacks and at the boundary of 20 km: SP25 (SE), SP24 (SE), SP48 (SE), SP49 (SE) and SP32 (NE).
The spatial variability of gamma radiation in the environment, and consequently the dose rates, may be affected by many factors, including intrinsic factors (soil properties, soil composition, geology, etc.) and extrinsic factors (climate factors, cosmic radiation, soil use and anthropogenic activities) [
33]. Considering the general inherent characteristics of the predominant soil formation process in the study region, it is not expected to have high absorbed dose rates as the geological setting is mainly dominated by the presence of sandstone, limestone, clay, and quartzite. The older formations are represented by metamorphic rocks: shales, greywacke and schist. In what concerns the effects of the region’s anthropogenic activities, the deposition of coal ash potentially enriched in some elements, including radionuclides, may contribute to the environmental pollution of the study area and potentially to higher dose rates on a long-term basis.
Radionuclides present in the escaping fly ash are released from the stacks with an initial velocity and are dispersed by the wind at several distances from the stacks. Particles settle under gravity whilst are removed simultaneously horizontally by the wind speed and direction. The stack’s height affects the dispersion and deposition of the fly ash. In this way, depending on the height of the stack and the particle size of the escaping fly ash, in addition to local climatology and topography, the influence of air activity concentration at ground level may be extended to several km away from the source (100 km and more) [
48]. A stack with 225 m height is considered very tall and ensures maximum atmospheric dispersion before ground impact. However, other local characteristics may affect this idealistic dispersion, such as downwash and building effects [
48] negatively. Some modelling studies on the particulate dispersion of fly ash revealed that at the distances where the maximum concentration has been achieved, the height of the layer of fly ash on the ground surface could reach up to 7 mm/year [
10]. All these factors design the spatial distribution pattern.
In this study, the representation of the spatial distribution showed a geographical trend with higher dose rates in the NW-SE direction coincident with the prevailing wind direction. However, two peak values of high dose rates occur near the stacks, and these are not in line with the prevailing wind direction, which suggests that the coal piles (1.3 × 10⁶ tons of coal) located near the stacks may be the origin of unburned coal particles dispersed and accumulated in these two particular locations. The ash disposal of the coal-fired power plant may also be a contributing source.
Under dry conditions, the prevailing winds are from NW towards the SE. Under wet conditions, winds are generally from SW to NE, particularly during October when inversion occurs for the prevailing wind direction and its average velocity.
3.4.2. Spatial Distribution of Radionuclides Activity Concentration
The results of the determination of the radionuclide concentration (
226Ra,
232Th and
40K) identified around the coal-fired power plant are presented in
Table 8.
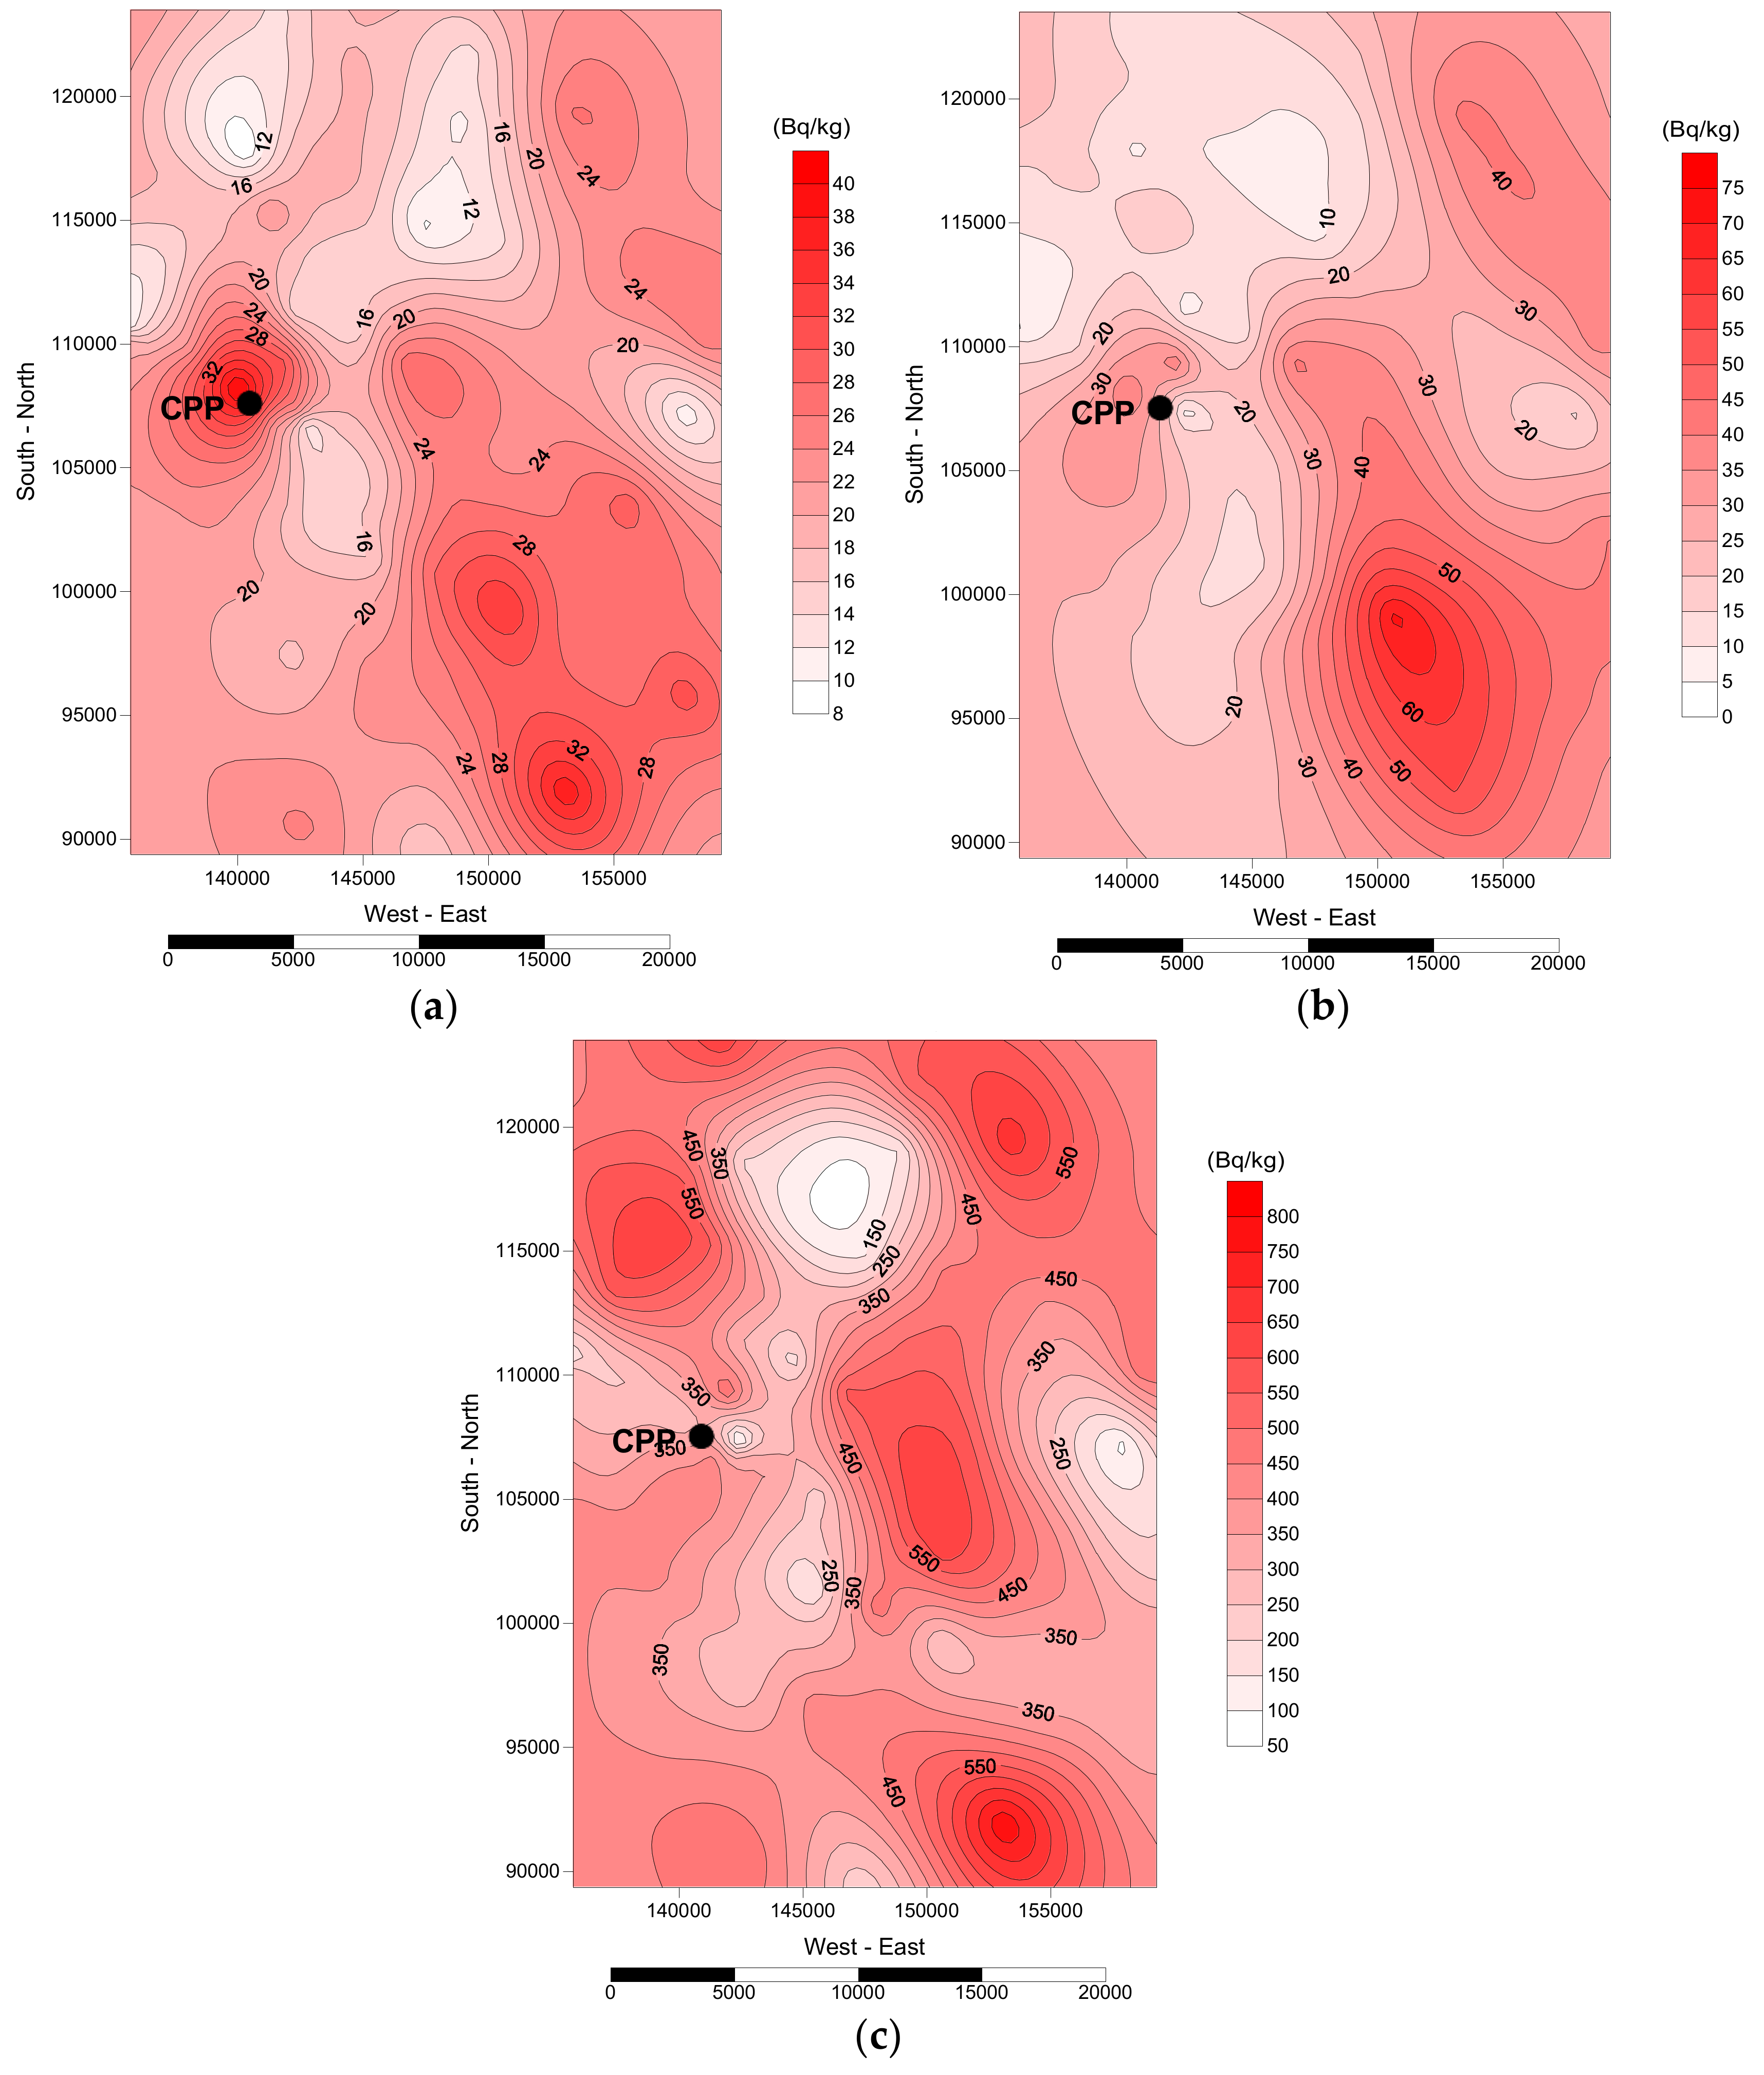
The prediction maps for the environmental distribution of the concentration of the radionuclides (Bq kg
−1), obtained by ordinary kriging, is presented in
Figure 4.
The distribution of the concentration of the radionuclides in the environment showed that higher levels occur at distances between 6 and 20 km with the same two exceptions observed before (SP8 and SP10), while lower values occur in the N and S sectors of the coal-fired power plant stacks. This variation is in good agreement with the spatial distribution of the gamma dose. Higher values occur predominantly at locations in the prevailing wind direction (SE): SP17, SP24, SP48 and SP49.
In particular, for
40K, the maximum concentration was registered at SP24 (SE) (795 Bq/kg). However, other relevant values were also registered at SP32 (681 Bq/kg) and SP44 (563 Bq/kg), located in the southeast (NE) direction to the stacks. All these locations are 9–20 km distant from the stacks. Some authors [
2,
12,
49] concluded that people living around a coal power plant with a stack height of 120–200 m would be exposed to higher dose at the distance of 3–6 km while the others living around a coal power plant with a stack height of 300 m will be most affected at a distance of 9–12 km.
In general, the concentration of the radionuclides is higher beyond the 6 km distance from the stacks at NE and SE directions. A few anomalies occur within the 6 km area matching with the results obtained for the gamma dose rates. Meteorological factors (particularly wind speed and direction), atmospheric stability class, source’s characteristics (stack height) and particle size of escaping fly ash strongly affect the dispersion and the transport of particulate matter from the stacks emissions.
Model simulations and atmospheric dispersion studies of fly ash cumulative deposition, as a function of distance from a coal power plant, showed that about 25% of emitted particles from a 40 m stack fell within 5 km and 34% within 10 km and only 6% of the emitted particles from a 300 m stack fell within the distance of 5 km. In modern coal power plants, most particles released into the atmosphere have less than 2 µm in diameter, which can agglomerate, accelerating the deposition near the source but even though smaller particles can travel distances from 100 up to 1700 km [
47].
In the present case study, the height of the stacks (225 m) combined with wind patterns (predominantly from NW to SE) are expected to have transported the emissions up to long distances away from the stacks, and in this case, peak values detected near the stacks could not be originated by fly ash falling from the plume vertically; this probably reflects the influence of the coal deposit located near the stacks (likely to be predominately from local fugitive sources in the form of windblown ash and dust) or other point sources.
Higher activity concentrations registered at NE, E and SE for distances up to 20 km are consistent with wind parameters and stacks height influence, also shown by higher activity concentration for the stations located in the prevailing wind direction (SE) at distances up to 20 km from the stacks [
19]. Moreover, the concentration values increased by 37% for
40K, 44% for
226Ra and 75% for
232Th in the prevailing wind direction (SE). Furthermore, the concentrations of
226Ra and
232Th showed a good correlation (0.83) for each measurement location, while a weak correlation was observed between each one of these radionuclides and
40K (0.31 and 0.39, respectively).
3.4.3. Spatial Distribution of Radionuclides Activity Concentration
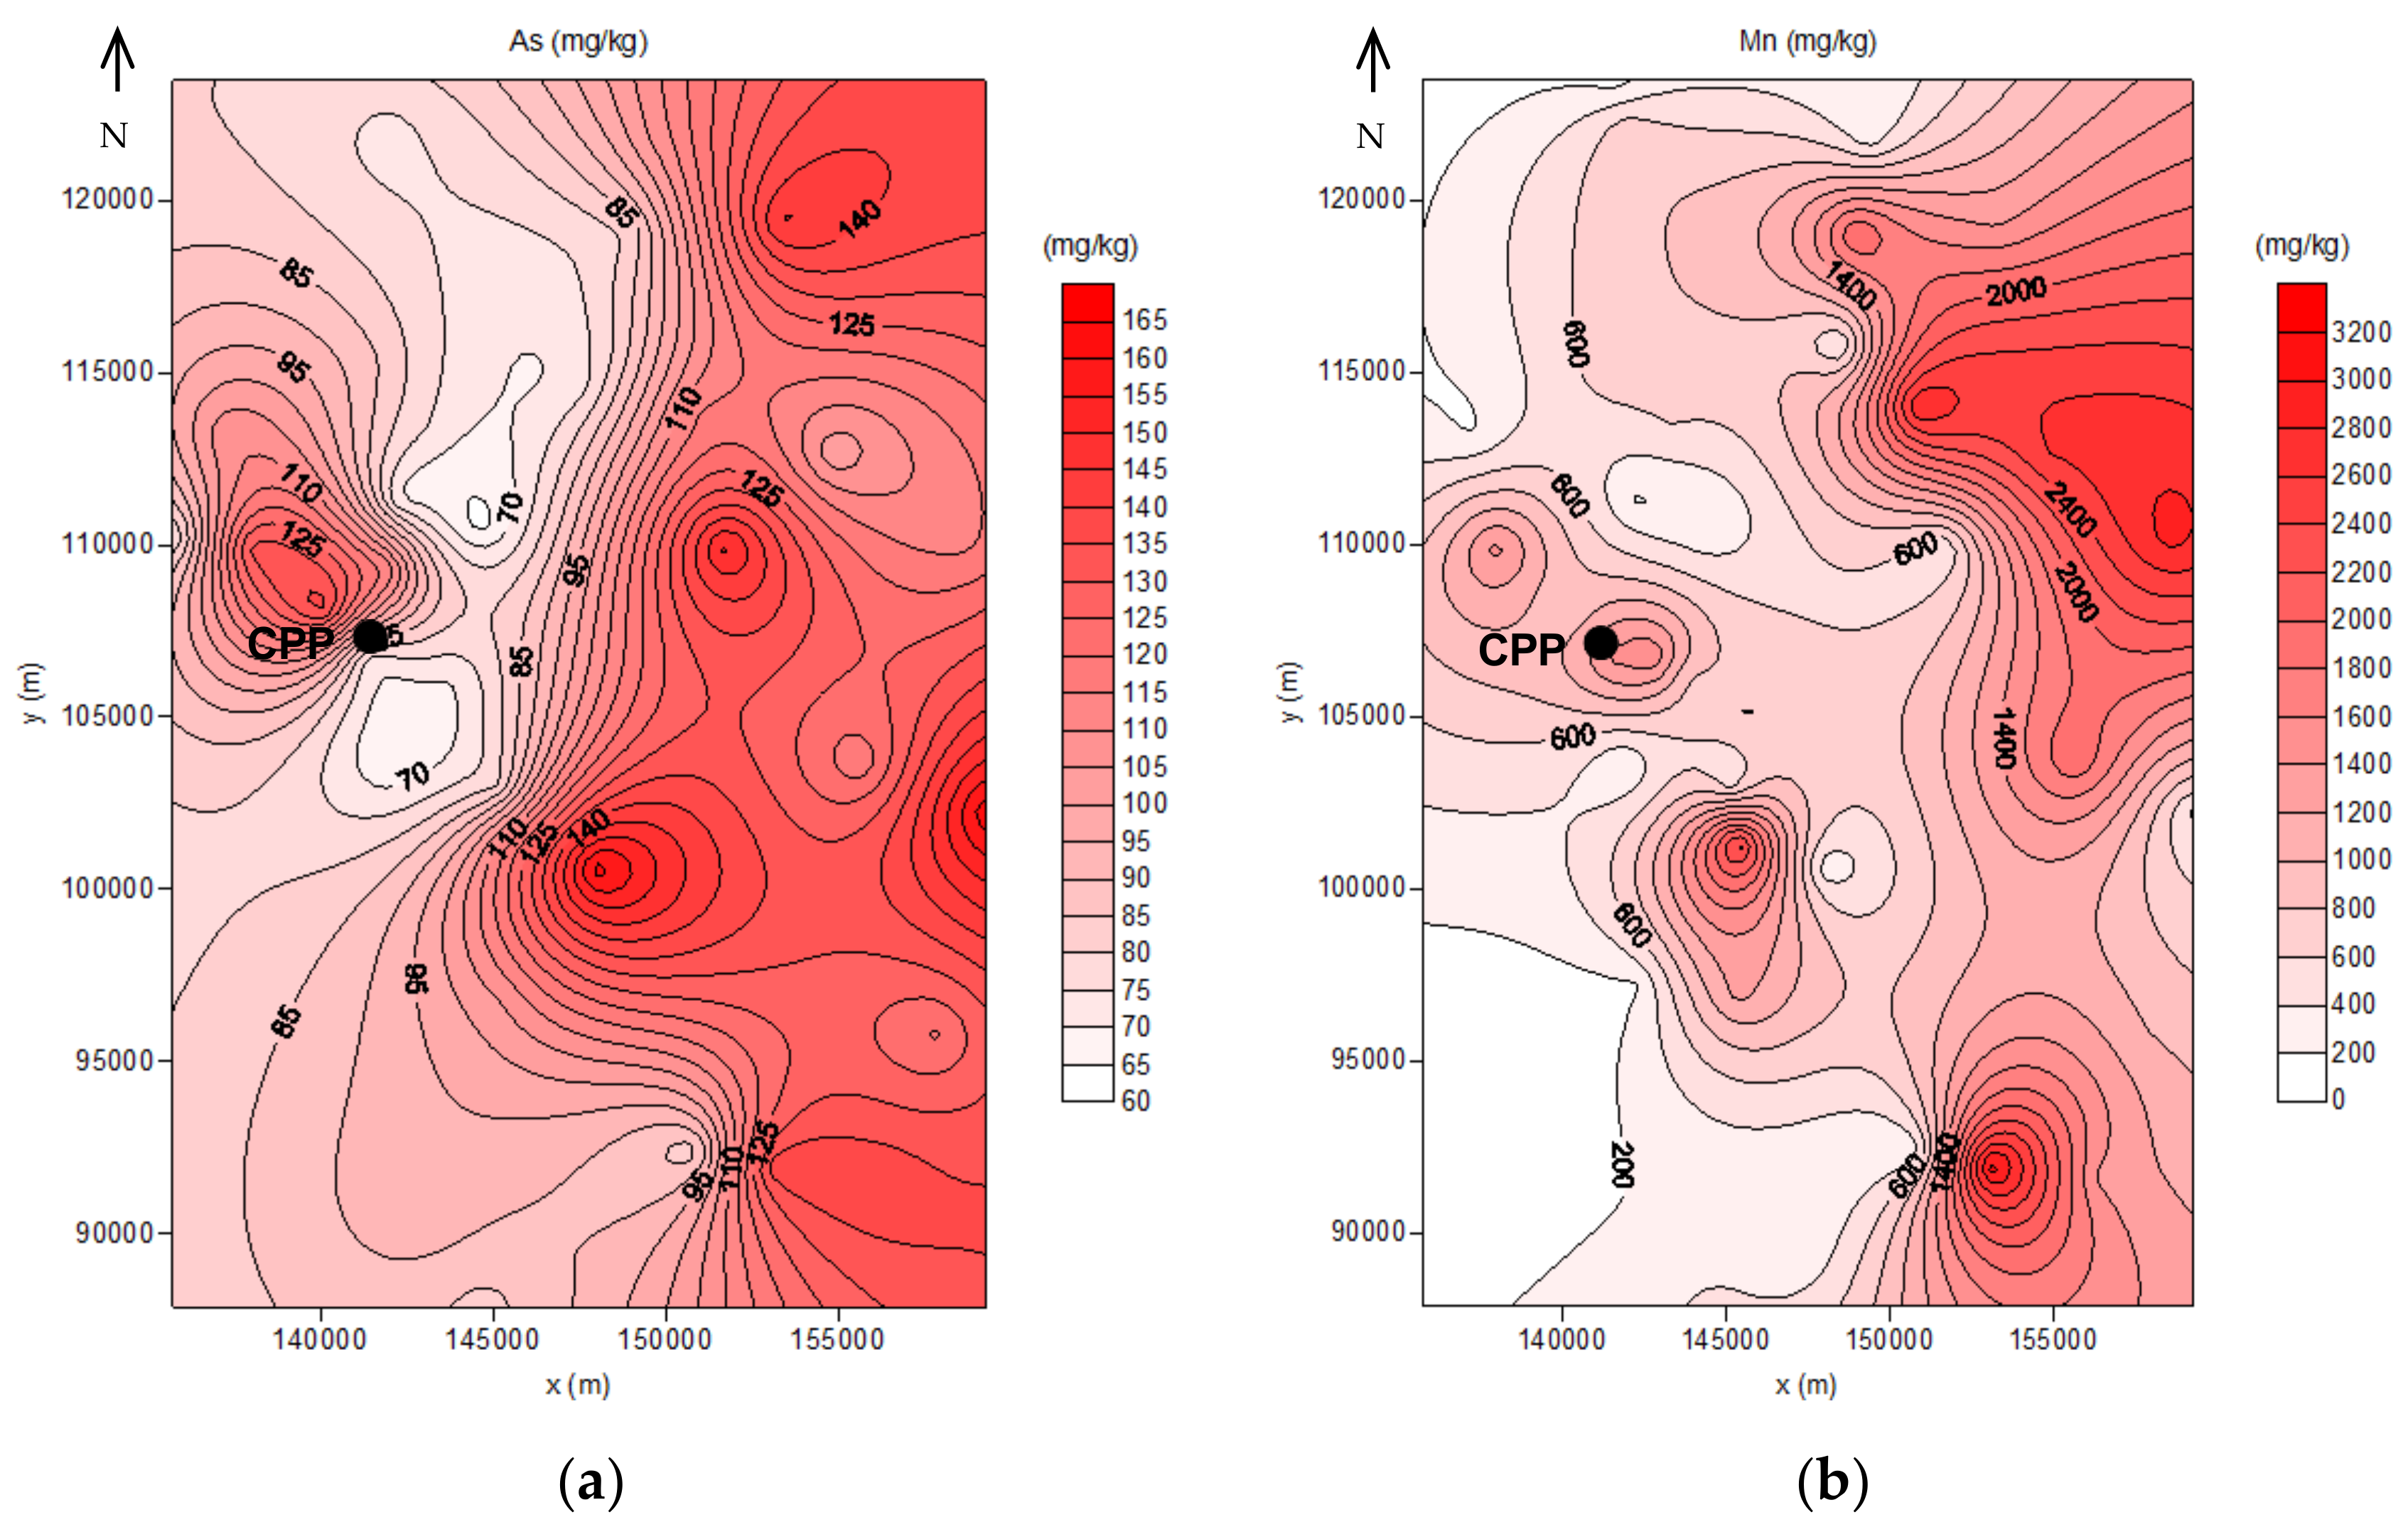
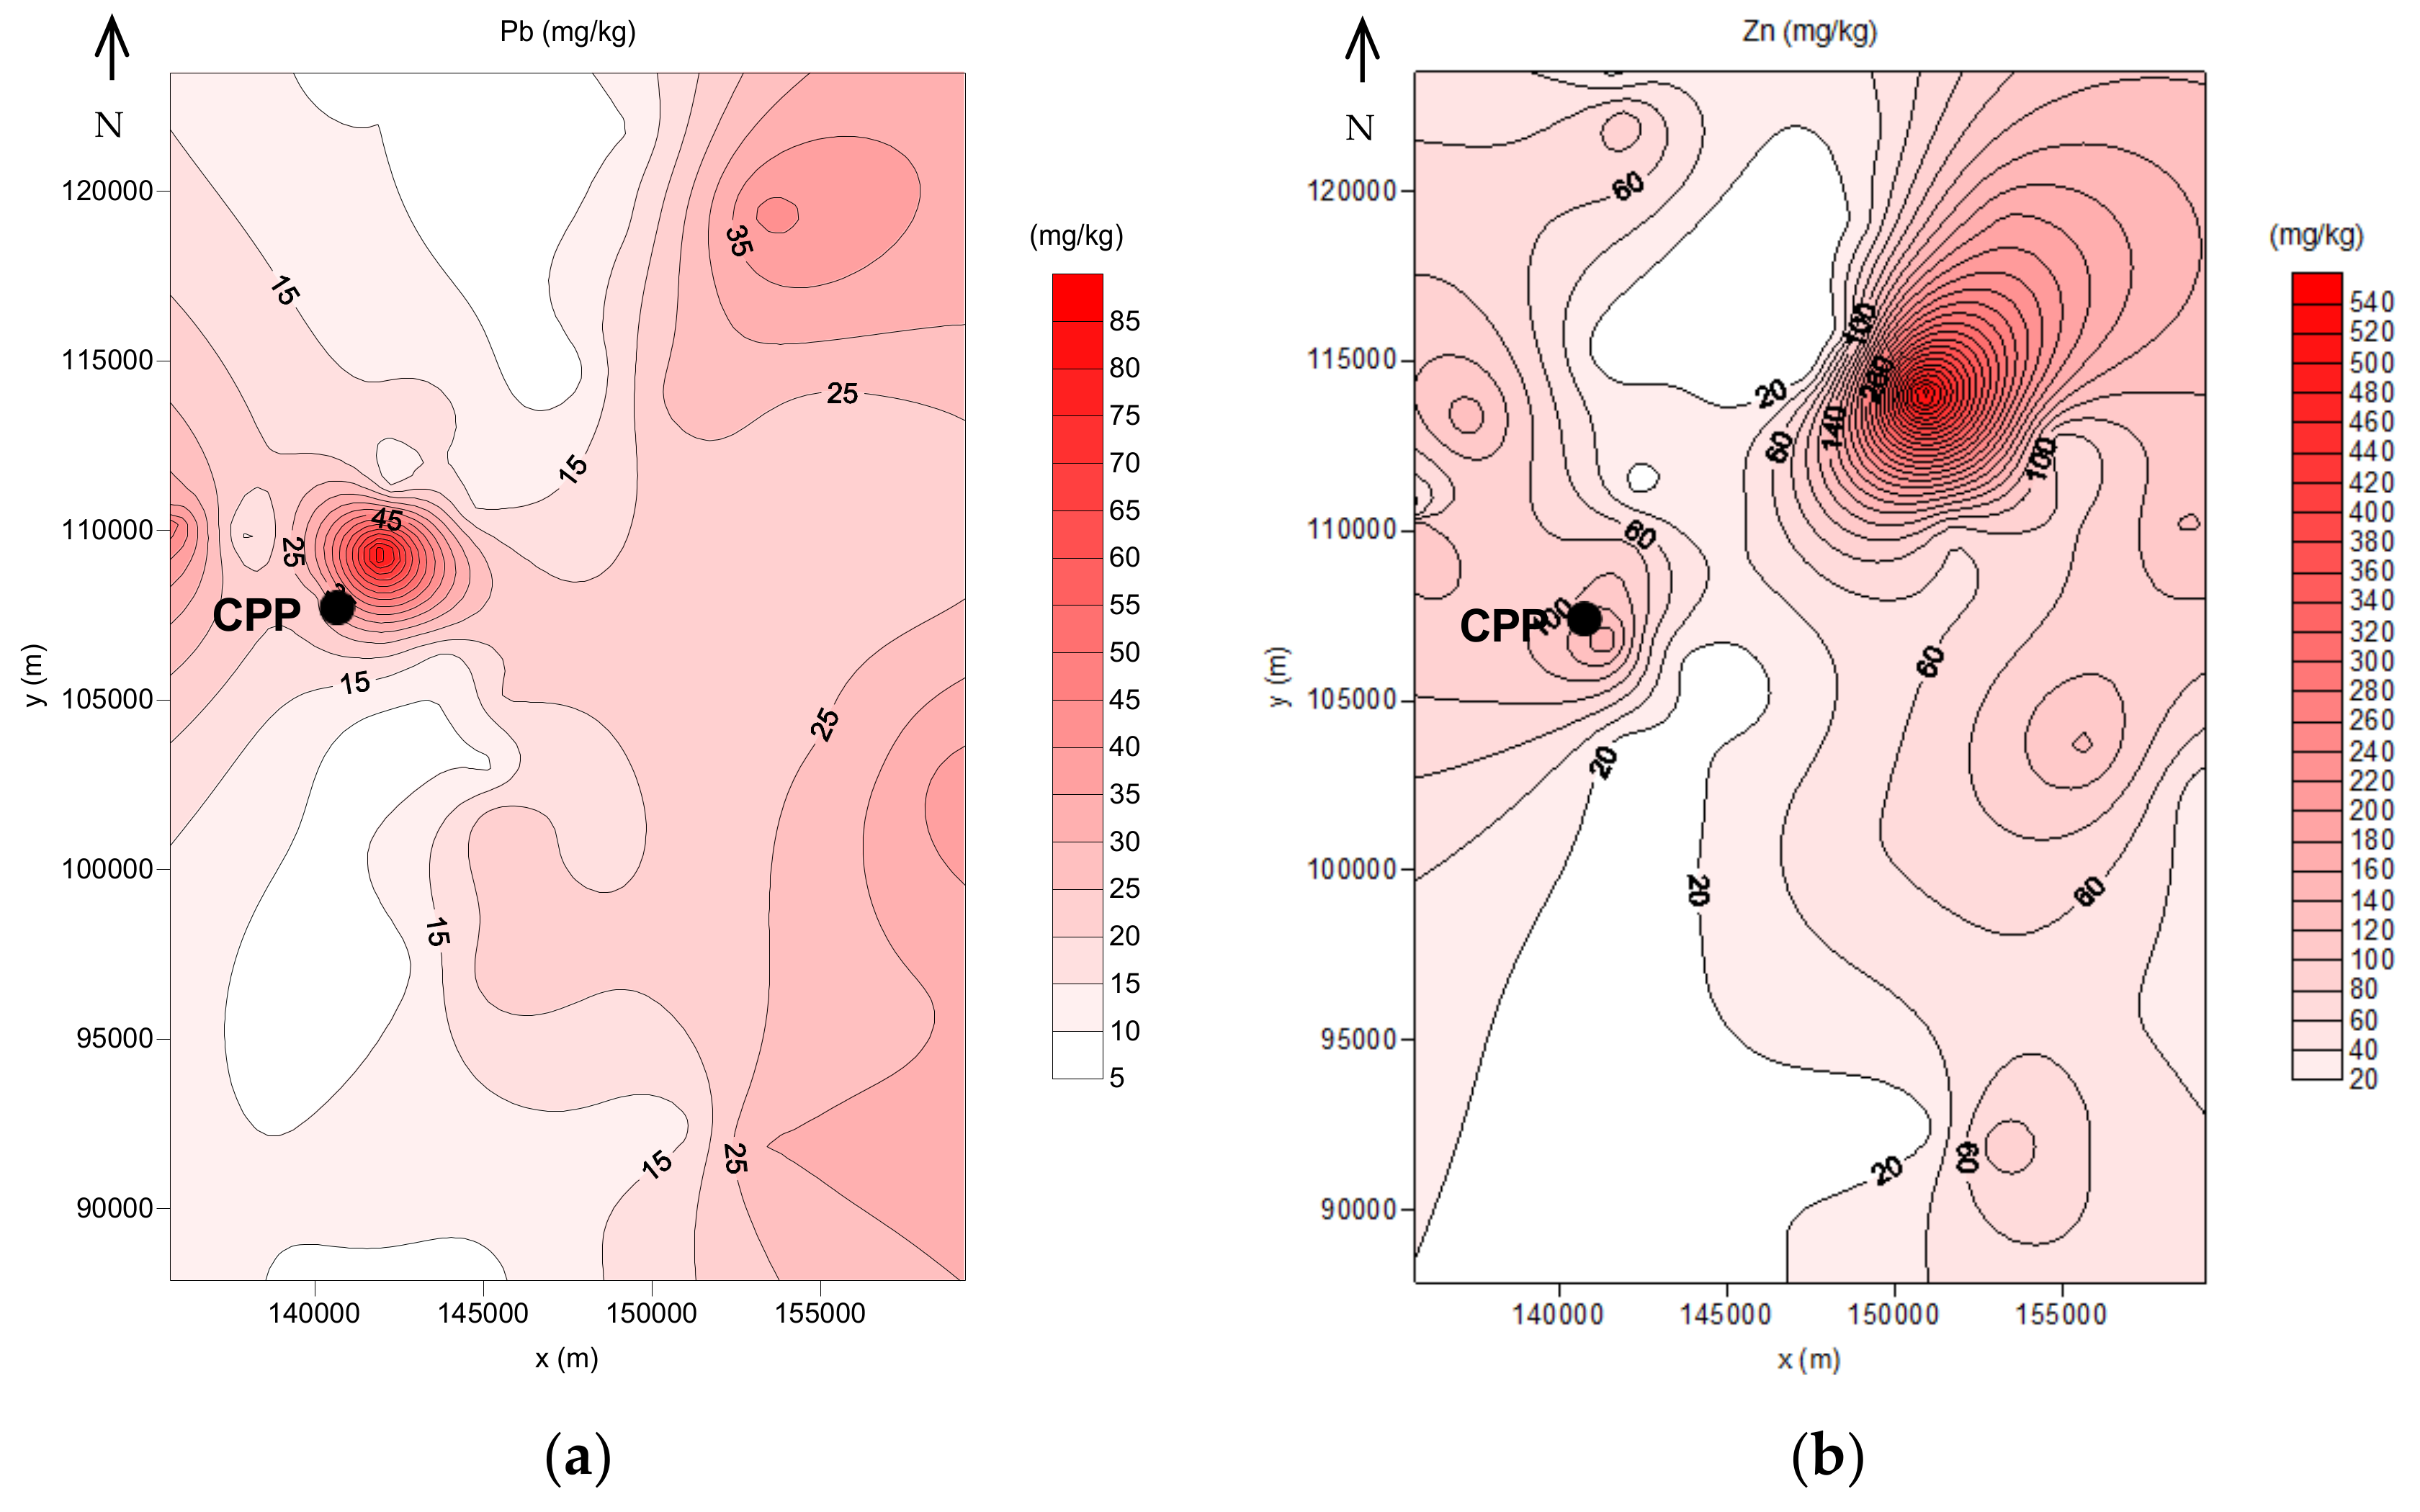
The iso-concentration maps were created for some elements of the first sampling campaign: As, Mn, Pb and Zn (
Figure 5 and
Figure 6). These elements were selected regarding their relation to industrially contaminated soils.
The spatial distribution for the concentration of the selected elements, as well as other elements in surface soil (e.g., Fe and Ti), showed a pattern concentration described by marked element enrichment for distances between 6 and 20 km in the NE-E and E-SE sectors to the stacks and peak concentrations in the immediate area around the stacks, following the same trend of the spatial distribution in the environment for gamma dose rates and radionuclides concentration. Nevertheless, no regular trends could be observed for elemental concentration and distance from the power plant.
The concentration of the selected elements showed the same behaviour observed in the flux deposition from the SC1 to SC2: in particular, the concentration of As, Mn, Pb and Zn decreased significantly from the first to the second campaign.
During both sampling campaigns, the prevailing wind directions were from N-NW and N-NE. This could explain, to some extent, the spatial distribution of metals in soils; however, peak concentration suggests also the contribution from others sources, such as the coal deposit in the vicinity of the coal-fired power plant, as mentioned before.
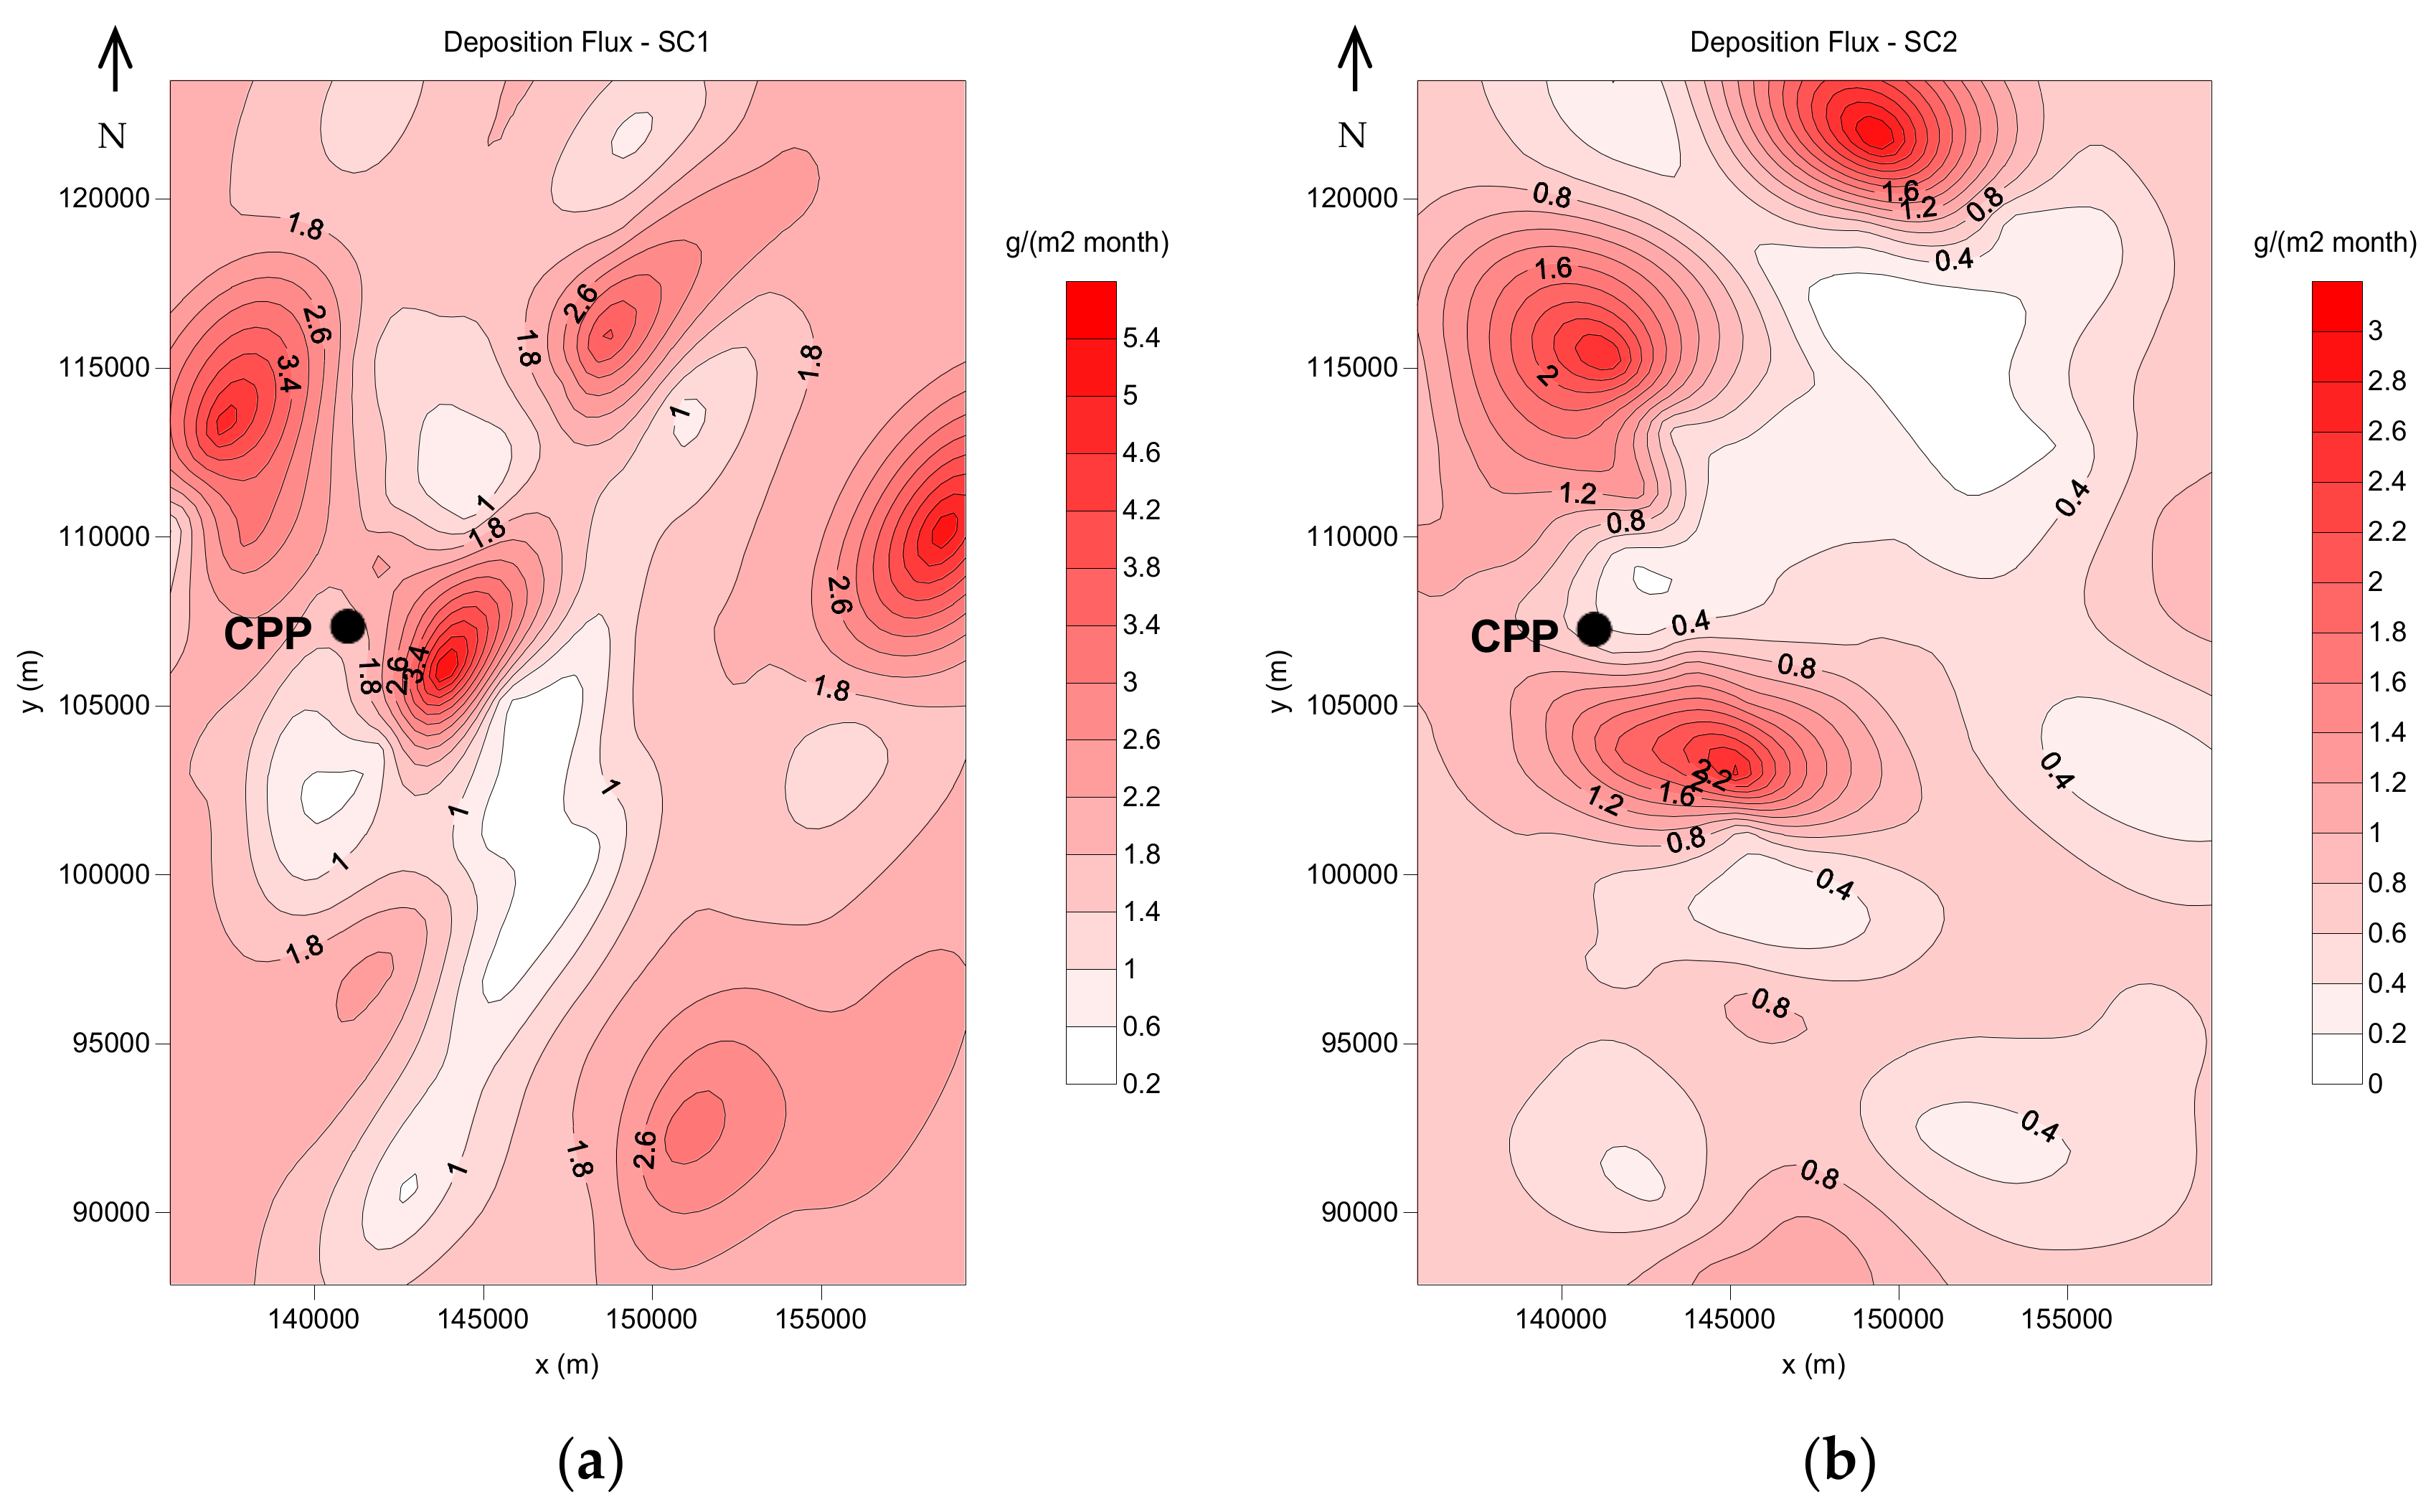
3.4.4. Spatial Distribution of Particulate Matter Fallout
For the spatial dispersion of the particulate matter (
Figure 7), it is possible to observe two preferential deposition areas at SE from the coal power plant, following the prevailing wind direction for SC1 and one of the directions with higher frequency for SC2. It is also noticeable the important contribution from the coal deposit located at SE from the stacks.
In what concerns SC1, where the results are more reliable than for SC2, there is a similarity between the spatial distribution of deposition flux and all the other studied variables: gamma dose rate, radionuclides and element concentrations (in particular, As and Mn).
4. Conclusions
The spatial variability obtained by ordinary kriging showed that for all studied variables, higher values occur for the locations in the prevalent wind direction (SE) and for distances up to 20 km distant from the stacks: most of these values were registered at several locations within the 6–20 km area at SE from the stacks although two peaks were detected very close to the stacks, within the 6-km area. These two peaks are not in line with the prevailing wind direction, suggesting that the coal piles near the stacks may be the origin of unburned coal particles dispersed and accumulated in these locations. The ash disposal of the coal-fired power plant may also be a contributing source. This is supported by the coherent results obtained for the environmental spatial variability of gamma dose rates, radionuclides activity concentration, metals concentration and deposition flux of particulate matter.
In general, the assessment of the environmental radioactivity carried out in the vicinity of the studied coal-fired power plant did not show concerning values being similar to the background scenario. However, the coincident environmental variability for gamma dose rates, radionuclides concentrations and deposition fluxes show an association with coal combustion. For heavy metals, metals and metalloids, there are some concerning situations, in particular with arsenic, but also with toxic metals such as Pb, Ni and Zn. Major elements such as Ca and Fe are of crustal origin, while minor contributors, such as Pb, Ni, Cu, Mn and Zn, are of anthropogenic origin.
No significant correlation was found between the altitude and the studied variables. The higher correlation value was 0.5 for altitude versus gamma dose rates. A good correlation was obtained between 226Ra and 232Th concentrations (0.9) and between these and gamma dose rates (0.7–0.8).
The assessment of the radiological impact potentially originated by coal-fired power plants operations is not a simple and linear task. The studied coal-fired power plant may have been a source of atmospheric emissions over the years, but only the activity concentration of radionuclides in the 30 cm of the soils are responsible for the gamma rays detected by the equipment. Therefore, the measurements of the ambient dose rate are related only to the activity concentration in this part of the soil profile. According to the European Pollutant Release and Transfer Register, these emissions decreased substantially in the last years. However, the contribution from other sources related to current ash disposal practices and coal storage may contribute to the concentration of the radionuclides in the topsoil.


 ,
, 


