
Causes of the Record-Breaking Pacific Northwest Heatwave, Late June 2021

Pacific Marine Environmental Laboratory, National Oceanic and Atmospheric Administration (NOAA), Seattle, WA 98115, USA
Atmosphere 2021, 12(11), 1434; https://doi.org/10.3390/atmos12111434
Submission received: 27 September 2021
/
Revised: 22 October 2021
/
Accepted: 27 October 2021
/
Published: 30 October 2021
(This article belongs to the Special Issue Extreme Weather and Climate Events: Global and Regional Aspects)
Abstract
:The extreme heat event that hit the Pacific Northwest (Oregon, Washington, southern British Columbia) at the end of June 2021 was 3 °C greater than the previous Seattle record of 39 °C; larger extremes of 49 °C were observed further inland that were 6 °C above previous record. There were hundreds of deaths over the region and loss of marine life and forests. At the large scale prior to the event, the polar vortex was split over the Arctic. A polar vortex instability center formed over the Bering Sea and then extended southward along the west coast of North America. The associated tropospheric trough (low geopotential heights) established a multi-day synoptic scale Omega Block (west-east oriented low/high/low geopotential heights) centered over the Pacific Northwest. Warming was sustained in the region due to subsidence/adiabatic heating and solar radiation, which were the main reasons for such large temperature extremes. The seasonal transition at the end of spring suggests the possibility of a southern excursion of a polar vortex/jet stream pair. Both the Pacific Northwest event in 2021 and the Siberian heatwave climax in June 2020 may be examples of crossing a critical state in large-scale atmospheric circulation variability.
1. Introduction
There appears to have been an increase of extreme events over the previous few years of various types, locations, seasonal timings and durations [1,2]; many such events have been well beyond previous records. This raises the philosophical question of: what does it mean when an event is well beyond a previous record? This does not seem to be, necessarily, part of a long tail distribution of previous observations from historical data [3,4], but is rather a result of new, and perhaps unknown, processes. What are the interpretations and implications for further climate change? It is possible that there are additional interactions between shifts in the climate system and tipping elements occurring simultaneously. The heatwave that occurred in the Pacific Northwest (Oregon, Washington, southern British Columbia) during late June 2021 is an example. This mandates improved understanding on how the weather is changing as the planet warms, because weather has a large impact on humans and ecosystems.
Temperatures were extreme—including readings of 46 °C in Portland, OR, and a Canadian record of 49 °C in British Columbia (2021 Western North America heatwave-Wikipedia). The heatwave sparked numerous extensive wildfires, reaching hundreds of square kilometers in area (Figure 1). These fires largely destroyed the town of Lytton, British Columbia. The heatwave resulted in extensive damage to ecosystems (forests, oysters, and starfish) and crops (wheat and cherries). Total deaths from the event are at least in the multiple hundreds.
Three connected levels of causation are proposed: a polar vortex instability as the effective or primary cause, a tropospheric blocking ridge, and subsidence/solar heating in the ridge as a proximate/final cause. The instability relates to the movement and weakening of the vortex in the spring/summer transition (June) and possibly by Arctic changes. Was the event related to global warming? Models suggest a 1-in-1000 year event due to 1.2 °C global warming. It would have been at least 150 times rarer before global warming according to the World Weather Attribution (WWA) project (NW-US-extreme-heat-2021-scientific-report-WWA.pdf). A second option is that interactions in the weather/climate system have substantially increased the probability of such extreme heat, yet according to the WWA, climate models do not show this.
2. Meteorology of the Event
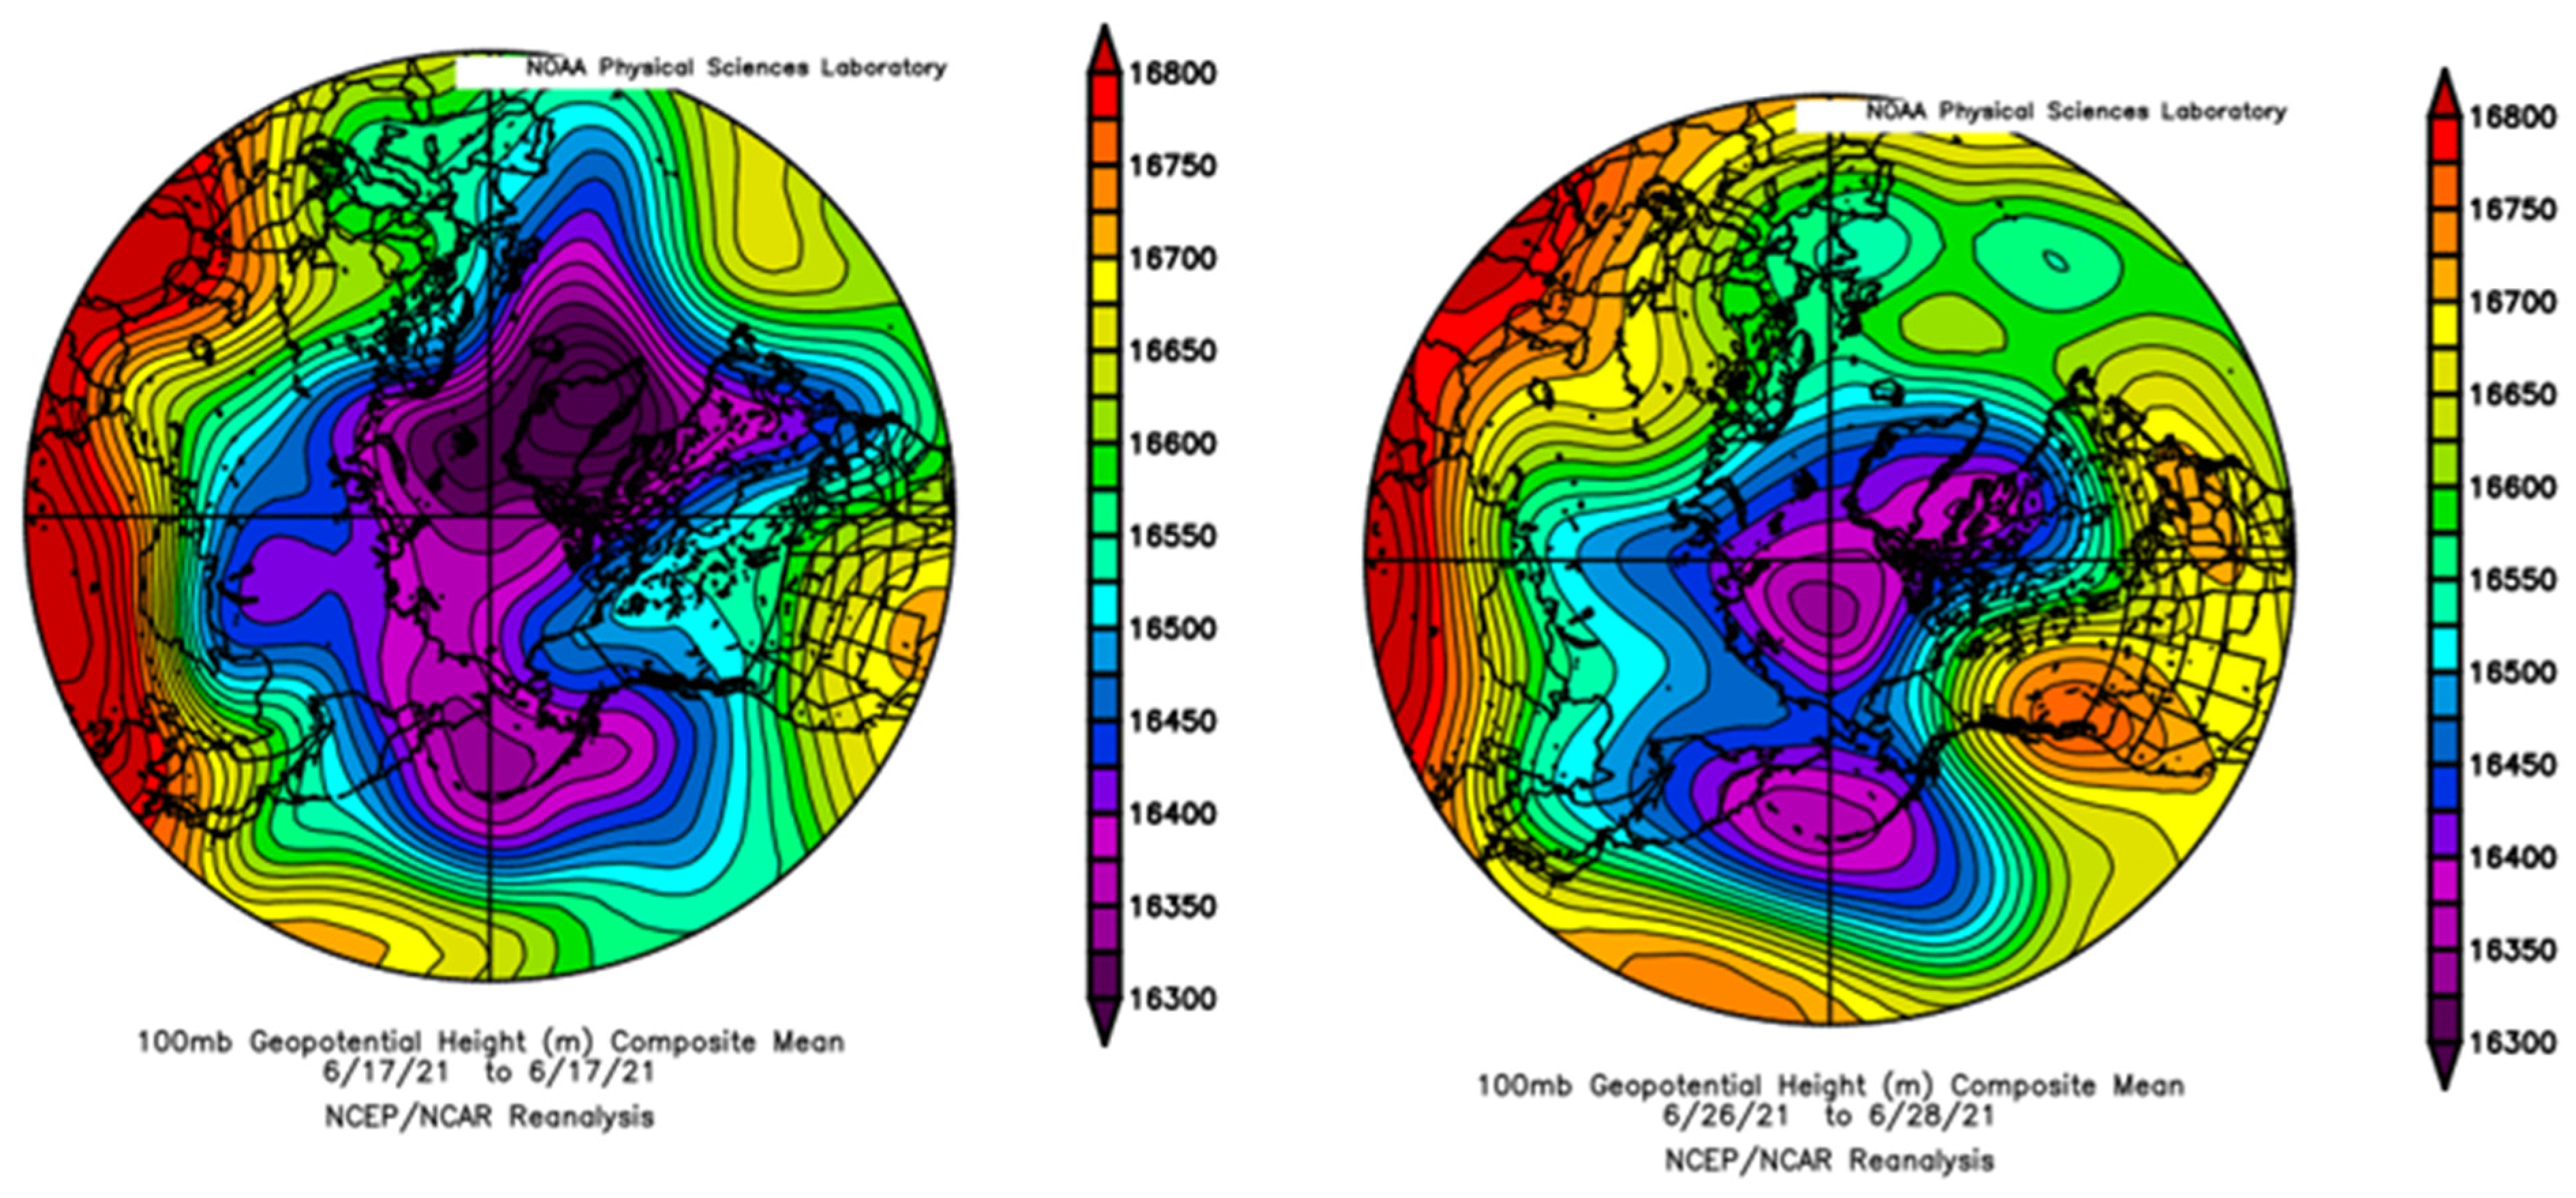
The severe weather event of June 2021 in the Pacific Northwest (PNW) started mid-month with the split in the polar vortex into two centers. The 100 hPa level geopotential heights over the Bering Sea rapidly formed a closed feature on 17 June 2021 (Figure 2, left). Data are from the NCEP/NCAR reanalysis. Also seen in this early figure is a development of a Rossby wave meander over the Sea of Japan. Subsequently, this closed feature expanded to the east, extended along the west coast of North America with a region of higher heights over the PNW, and persisted for three days: 26–28 June 2021 (Figure 2, right). At the 500 hPa level, high geopotential heights are observed in a vertical alignment with the 100 hPa ridging (Figure 3). This ridge featured a maximal 500 hPa geopotential height of ~5980 m that is unprecedented for this area of western North America for the period from 1948 through to June 2021. Such a feature is termed an Omega Block weather pattern, and it contributed to the persistence of the heating event. Omega Blocks are a combination of two lows with one blocking high between them oriented west to east.
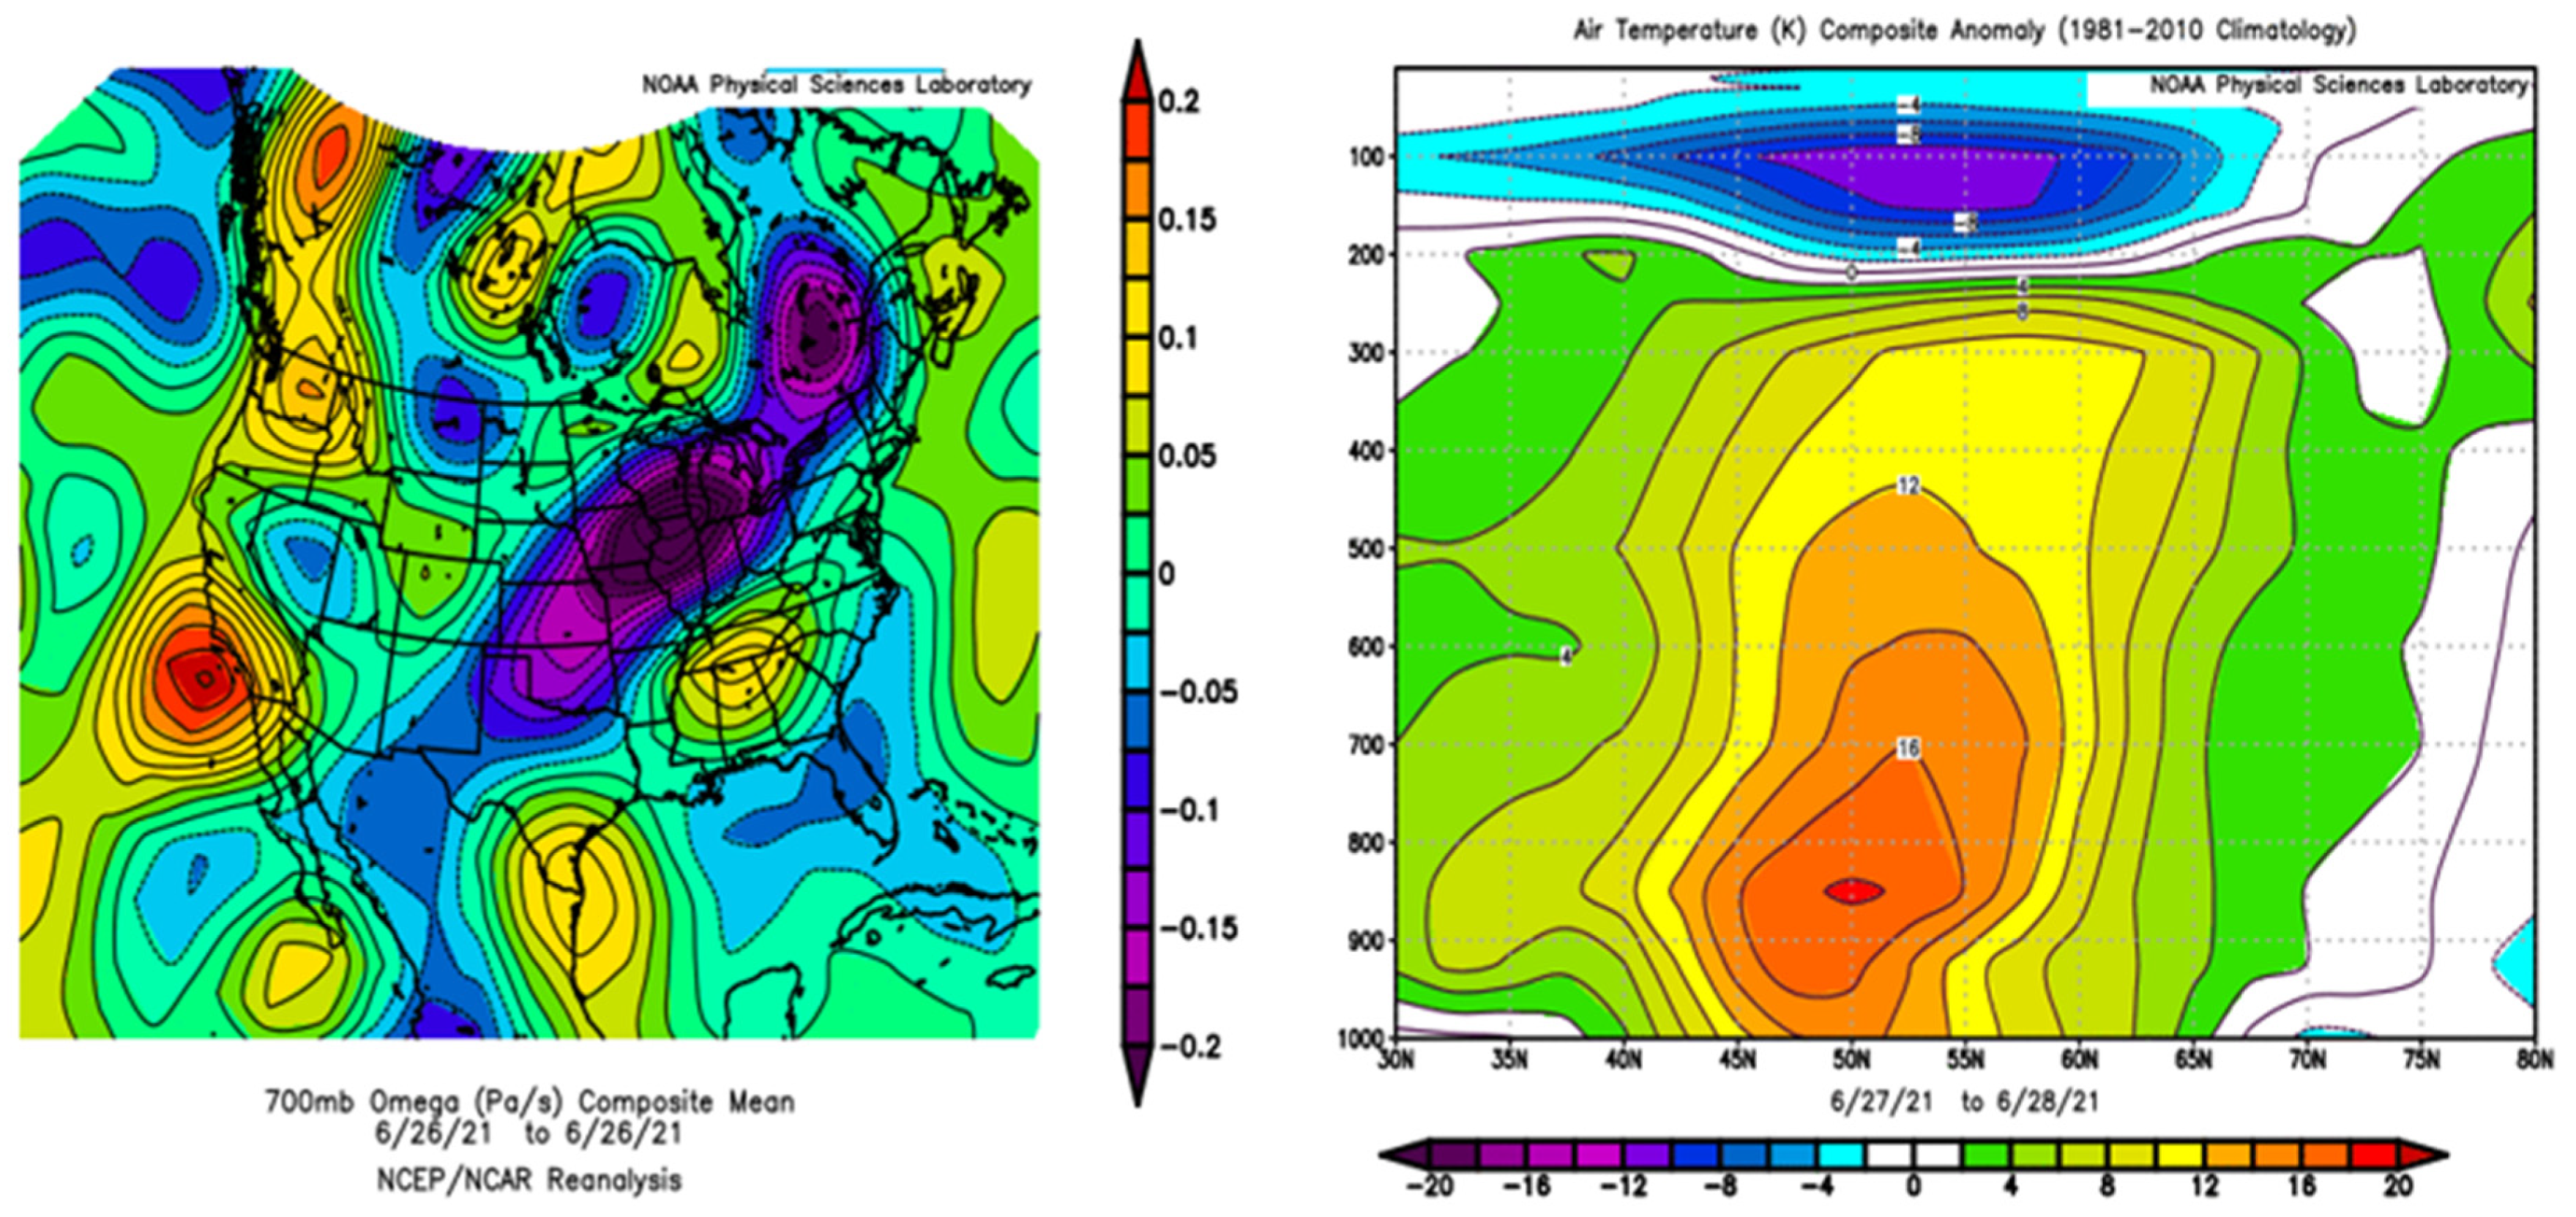
Figure 4 shows by how much warm temperature records were broken in June 2021 compared to the highest temperatures from 1950–2020. The June 2021 Pacific Northwest heatwave exceeded previous records by 3–6 °C. Once the high-pressure dome was established over the PNW, subsidence through adiabatic warming took place, which contributed to the temperature extremes. Figure 5 (left) estimates the downward atmospheric motion at 700 hPa in the lower troposphere along the North American west coast on 26 June, calculated through the Omega equation based on quasi-geostrophic vorticity dynamics [5]. Positive values of Omega represent sinking air. A south-north vertical cross-section of air temperature anomalies along 122° W longitude (Figure 5, right) shows that maximum heating took place above the surface, demonstrating that subsidence was an important factor. Surface solar radiation and drought also contributed; the soil moisture for 26 June was low (0.21 fraction), as given by the NCEP/NCAR reanalysis. When soils are dry, all incoming heat energy raises the ambient temperature instead of evaporating water.
3. Discussion and Conclusions
How does one interpret events at or beyond previous experience, as those shown in Figure 4? One cannot enumerate the states of nature that arose from prior cases, much less assign probabilities. An alternate approach is to admit that the new observations may have enhanced physics compared to the historical record. One way of acknowledging this approach is if there is additional information that the process may be non-stationary or that the event may be considered previously unimaginable prior to the event. The magnitude of future events is thus uncertain with unpredictable consequences [1]. Events for whose processes are insufficiently understood for deterministic forecasts or for probabilities to be known has been labelled radical uncertainty [6]. To recommend action one cannot wait to fully learn about new processes. Such events around the globe should be monitored and understood.
A classic method is based on fitting data to a frequency approach with a probability distribution, such as a Gaussian or long tail model. These backward-looking risk assessments extrapolate historical trends. Climate models are good at showing the linear increasing temperatures but do not always handle the interaction of multiple regional dynamic processes, especially blocking [7]. This is the approach taken in recent attribution studies for global warming by the WWA project, and others (NW-US-extreme-heat-2021-scientific-report-WWA.pdf). As noted, comparing model runs with and without a 1.2 °C global warming increase changed the odds of occurrence for daily maximum temperatures in the heatwave region to 1-in-1000 years, which would have been at least 150 times rarer without human-induced climate change. In a world with 2 °C of global warming that could be reached by 2040, this event would occur roughly every 5 to 10 years. Certainly, the PNW June heatwave was an outlier event beyond data or model extrapolation, involving polar vortex instability and subsequent meteorological impacts.
Regionally, WWA found that about 1% of June and July circulation patterns, defined as the 500 hPa geopotential height pattern within 160° W–110° W; 35° N–65° N, in previous years have an anomaly correlation larger than 0.8 with the 28 June pattern, which make them rare, but not impossible. There is no scientific consensus as to whether blocking events are now more severe or persistent than earlier [8,9].
In summary, the PNW heatwave was a rare event consisting of three components: polar vortex instability, tropospheric blocking ridge, and subsidence and solar heating. One could say that vortex instability was the initial cause and subsidence was the proximate/final cause. The fact that the magnitude of the event was so far beyond previous records puts society on guard and mandates further exploration of the dynamics and thermodynamics of such events. Perhaps the late spring atmospheric circulation transition is a critical time when the jet stream both weakens and moves south over the PNW, making the climate system vulnerable to natural and forced disruptions and latitudinal displacements. The occurrence of a latitudinal extended circulation event in June 2020 as part of the Siberian heatwave also comes to mind [10].
Funding
NOAA/Arctic Program/Global Ocean Monitoring and Observing Office, and NOAA/PMEL.
Data Availability Statement
The data and images are publicly accessible as provided by the NOAA/ESRL Physical Sciences Laboratory, Boulder, Colorado, from their website at Daily Climate Composites: NOAA Physical Sciences Laboratory, based on the NCEP-NCAR Reanalysis. Interactive Climate Analysis & Plotting Tools: NOAA Physical Sciences Laboratory.
Acknowledgments
This is PMEL Contribution 5306. The author completed the preparation of the manuscript.
Conflicts of Interest
Author declares no conflict of interest.
References
- Fischer, E.M.; Sippel, S.; Knutti, R. Increasing probability of record-shattering climate extremes. Nat. Clim. Chang. 2021, 11, 689–695. [Google Scholar] [CrossRef]
- Walsh, J.E.; Ballinger, T.; Euskirchen, E.S.; Hanna, E.; Mård, J.; Overland, J.E.; Tangen, H.; Vihma, T. Extreme weather and climate events in northern areas: A review. Earth-Sci. Rev. 2020, 209, 103324. [Google Scholar] [CrossRef]
- Latif, M.; Barnett, T. Causes of decadal climate variability over the North Pacific and North America. Science 1994, 266, 634–637. [Google Scholar] [CrossRef] [PubMed] [Green Version]
- Trenberth, K.; Hurrel, J. Decadal atmosphere–ocean variations in the Pacific. Clim. Dyn. 1994, 9, 303–319. [Google Scholar] [CrossRef]
- Holton, J.R. An Introduction to Dynamic Meteorology; Academic Press: Waltham, MA, USA, 1979. [Google Scholar]
- Kay, J.; King, M. Radical Uncertainty; Norton and Company: New York, NY, USA, 2020. [Google Scholar]
- Cohen, J.; Zhang, X.; Francis, J.; Jung, T.; Kwok, R.; Overland, J.; Ballinger, T.J.; Bhatt, U.S.; Chen, H.W.; Coumou, D.; et al. Divergent consensuses on Arctic amplification influence on midlatitude severe winter weather. Nat. Clim. Chang. 2020, 10, 20–29. [Google Scholar] [CrossRef]
- Barnes, E.A.; Screen, J.A. The impact of Arctic warming on the midlatitude jet-stream: Can it? Has it? Will it? Wiley Interdiscip. Rev. Clim. Chang. 2015, 6, 277–286. [Google Scholar] [CrossRef] [Green Version]
- Woollings, T.; Barnes, E.; Hoskins, B.; Kwon, Y.-O.; Lee, R.; Li, C.; Madonna, E.; McGraw, M.; Parker, T.; Rodrigues, R.; et al. Daily to Decadal Modulation of Jet Variability. J. Clim. 2018, 31, 1297–1314. [Google Scholar] [CrossRef]
- Overland, J.E.; Wang, M. The 2020 Siberian heat wave. Int. J. Clim. 2021, 41, E2341–E2346. [Google Scholar] [CrossRef]
Figure 1.
Wildfire in British Columbia, end of June 2021. See Figure 4 for location map of maximum temperatures near Lytton, BC. Source: BC Wildfire Service/AFC via Gett.
Figure 1.
Wildfire in British Columbia, end of June 2021. See Figure 4 for location map of maximum temperatures near Lytton, BC. Source: BC Wildfire Service/AFC via Gett.
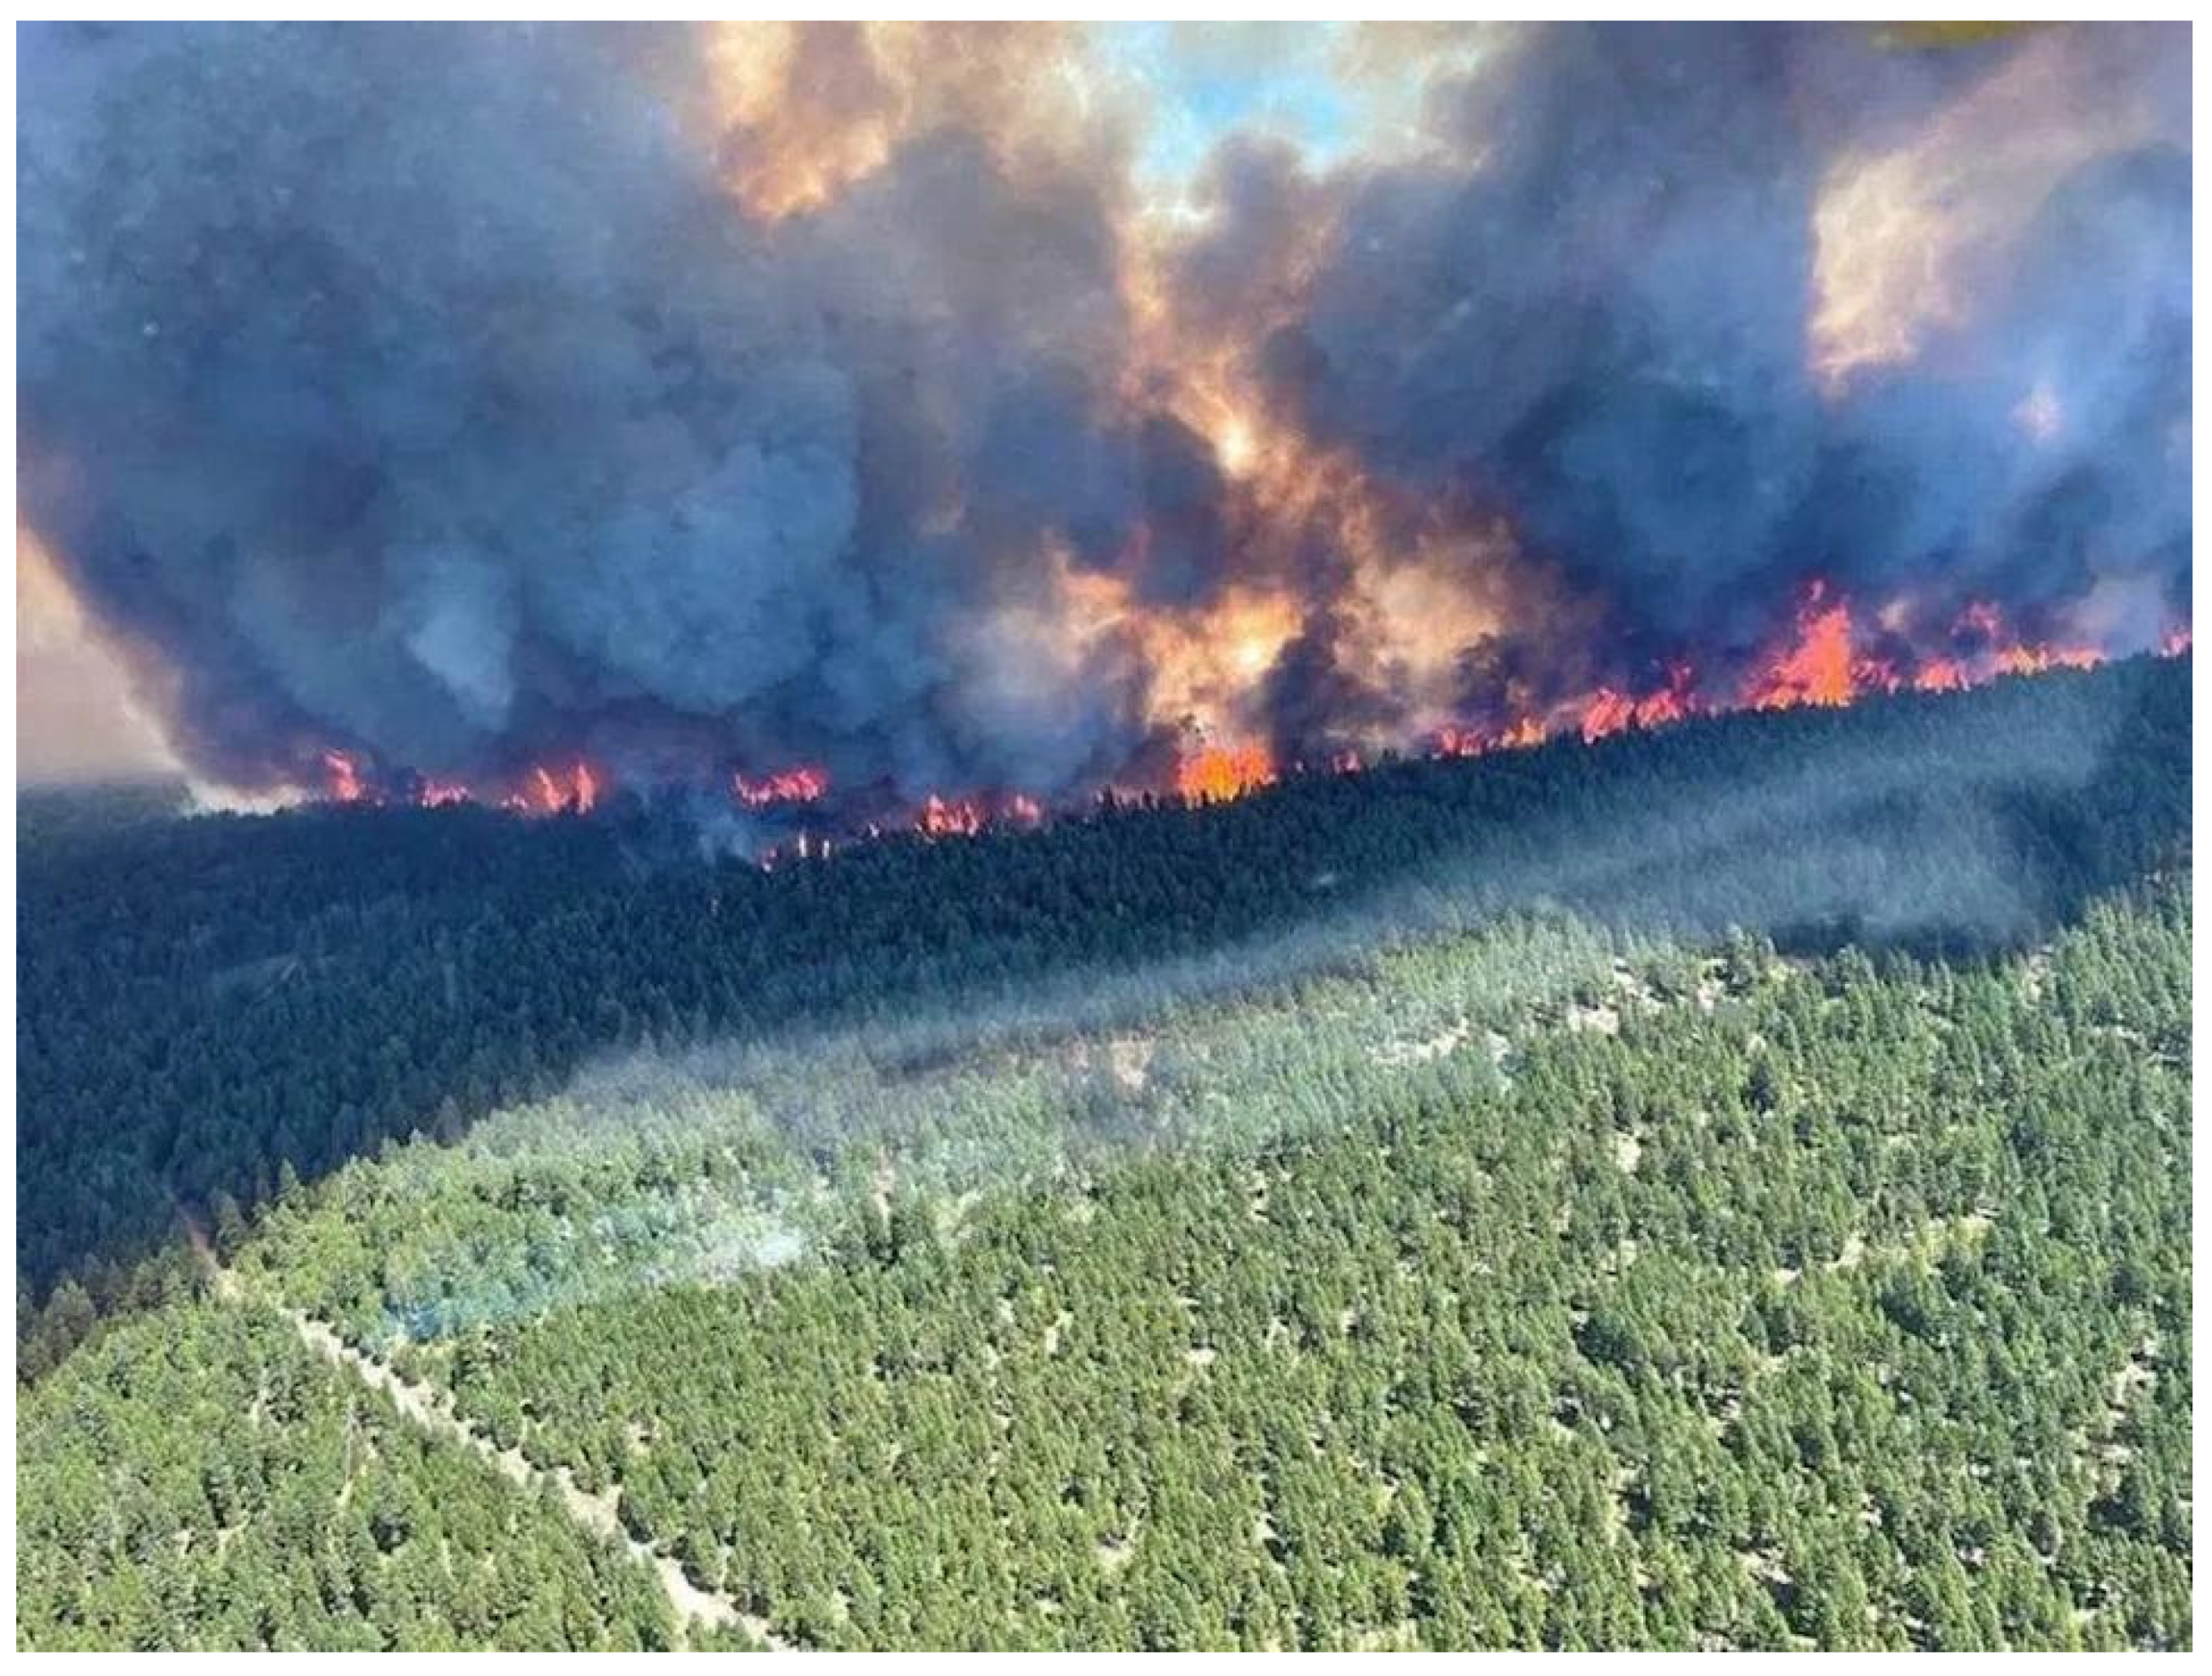
Figure 2.
Geopotential height field at polar vortex level (100 hPa) at the beginning of the event (17 June 2021, left) and during the main impact on the Pacific Northwest (26–28 June 2021, right). Note that the legend is the same for both maps. Images are from NOAA/ESRL plotting routines based on the NCEP/NCAR reanalysis.

Figure 3.
Geopotential height field at polar vortex level (500 hPa) during the main impact on the Pacific Northwest (26–28 June 2021).
Figure 3.
Geopotential height field at polar vortex level (500 hPa) during the main impact on the Pacific Northwest (26–28 June 2021).
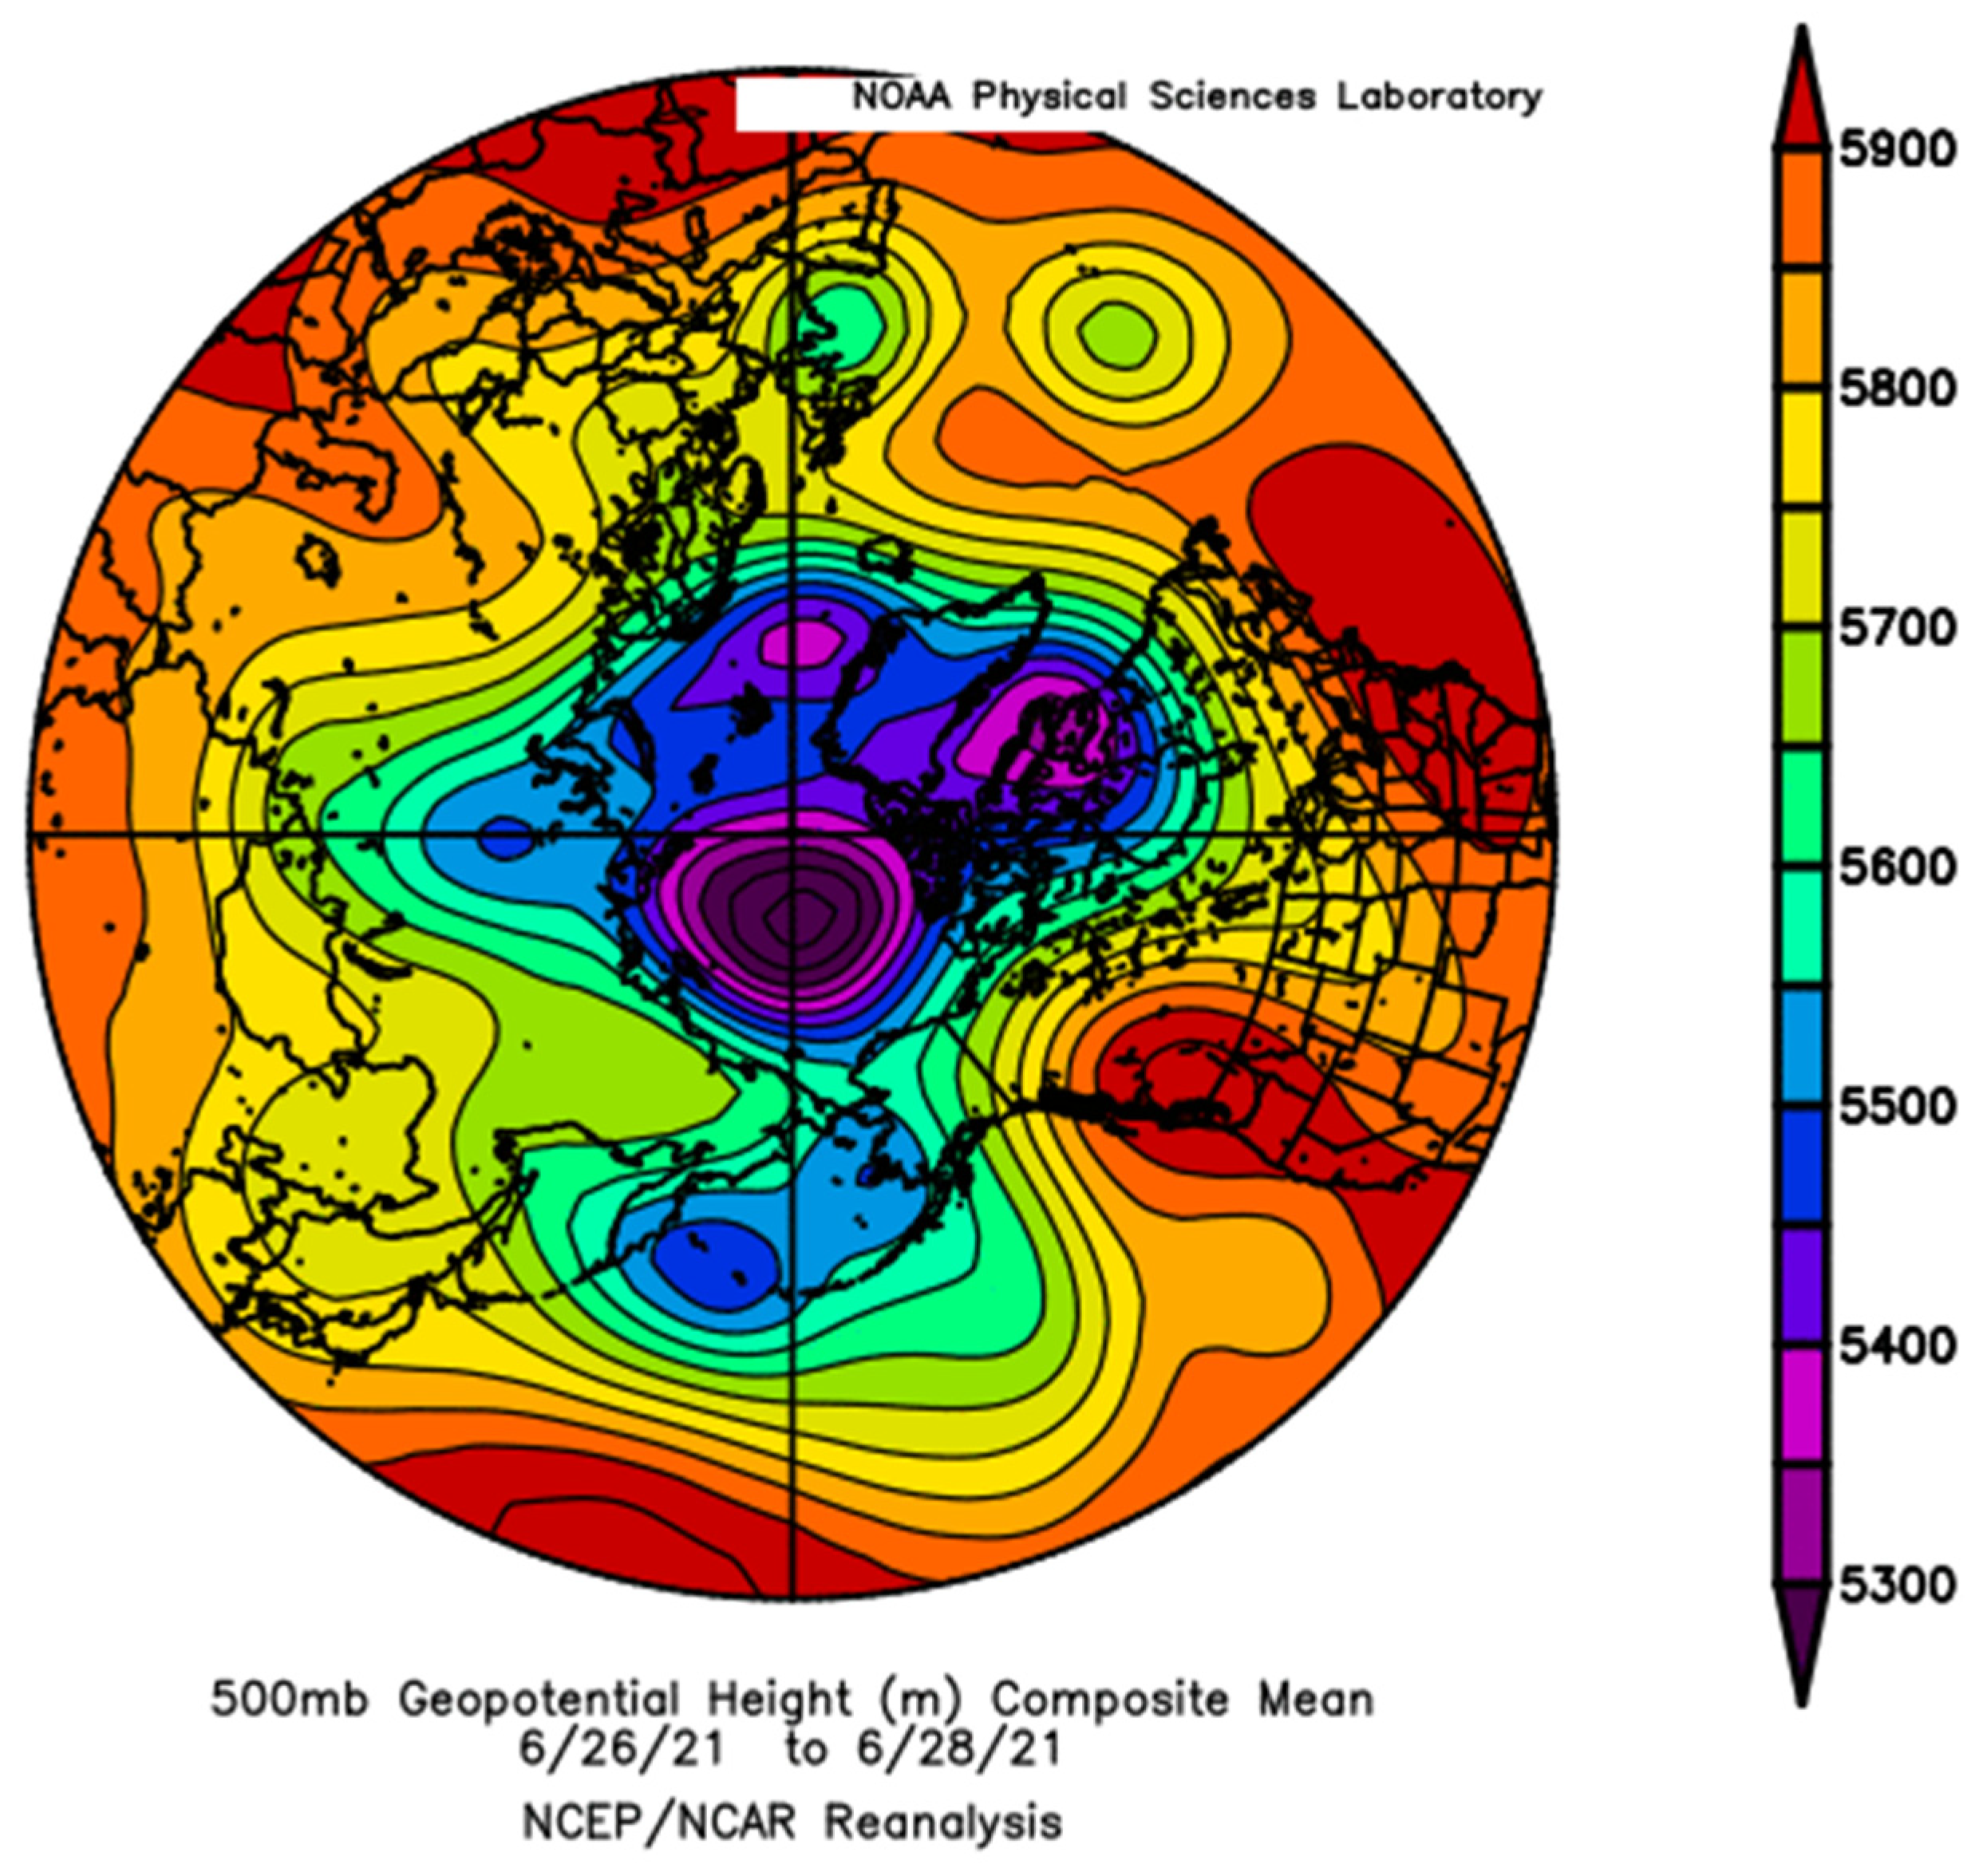
Figure 4.
How much warm temperature records were exceeded in June 2021 compared to the highest temperatures from 1950–2020. Source: Geert Jan van Oldenborgh based on ERA5 reanalysis from Copernicus/ECMWF.
Figure 4.
How much warm temperature records were exceeded in June 2021 compared to the highest temperatures from 1950–2020. Source: Geert Jan van Oldenborgh based on ERA5 reanalysis from Copernicus/ECMWF.
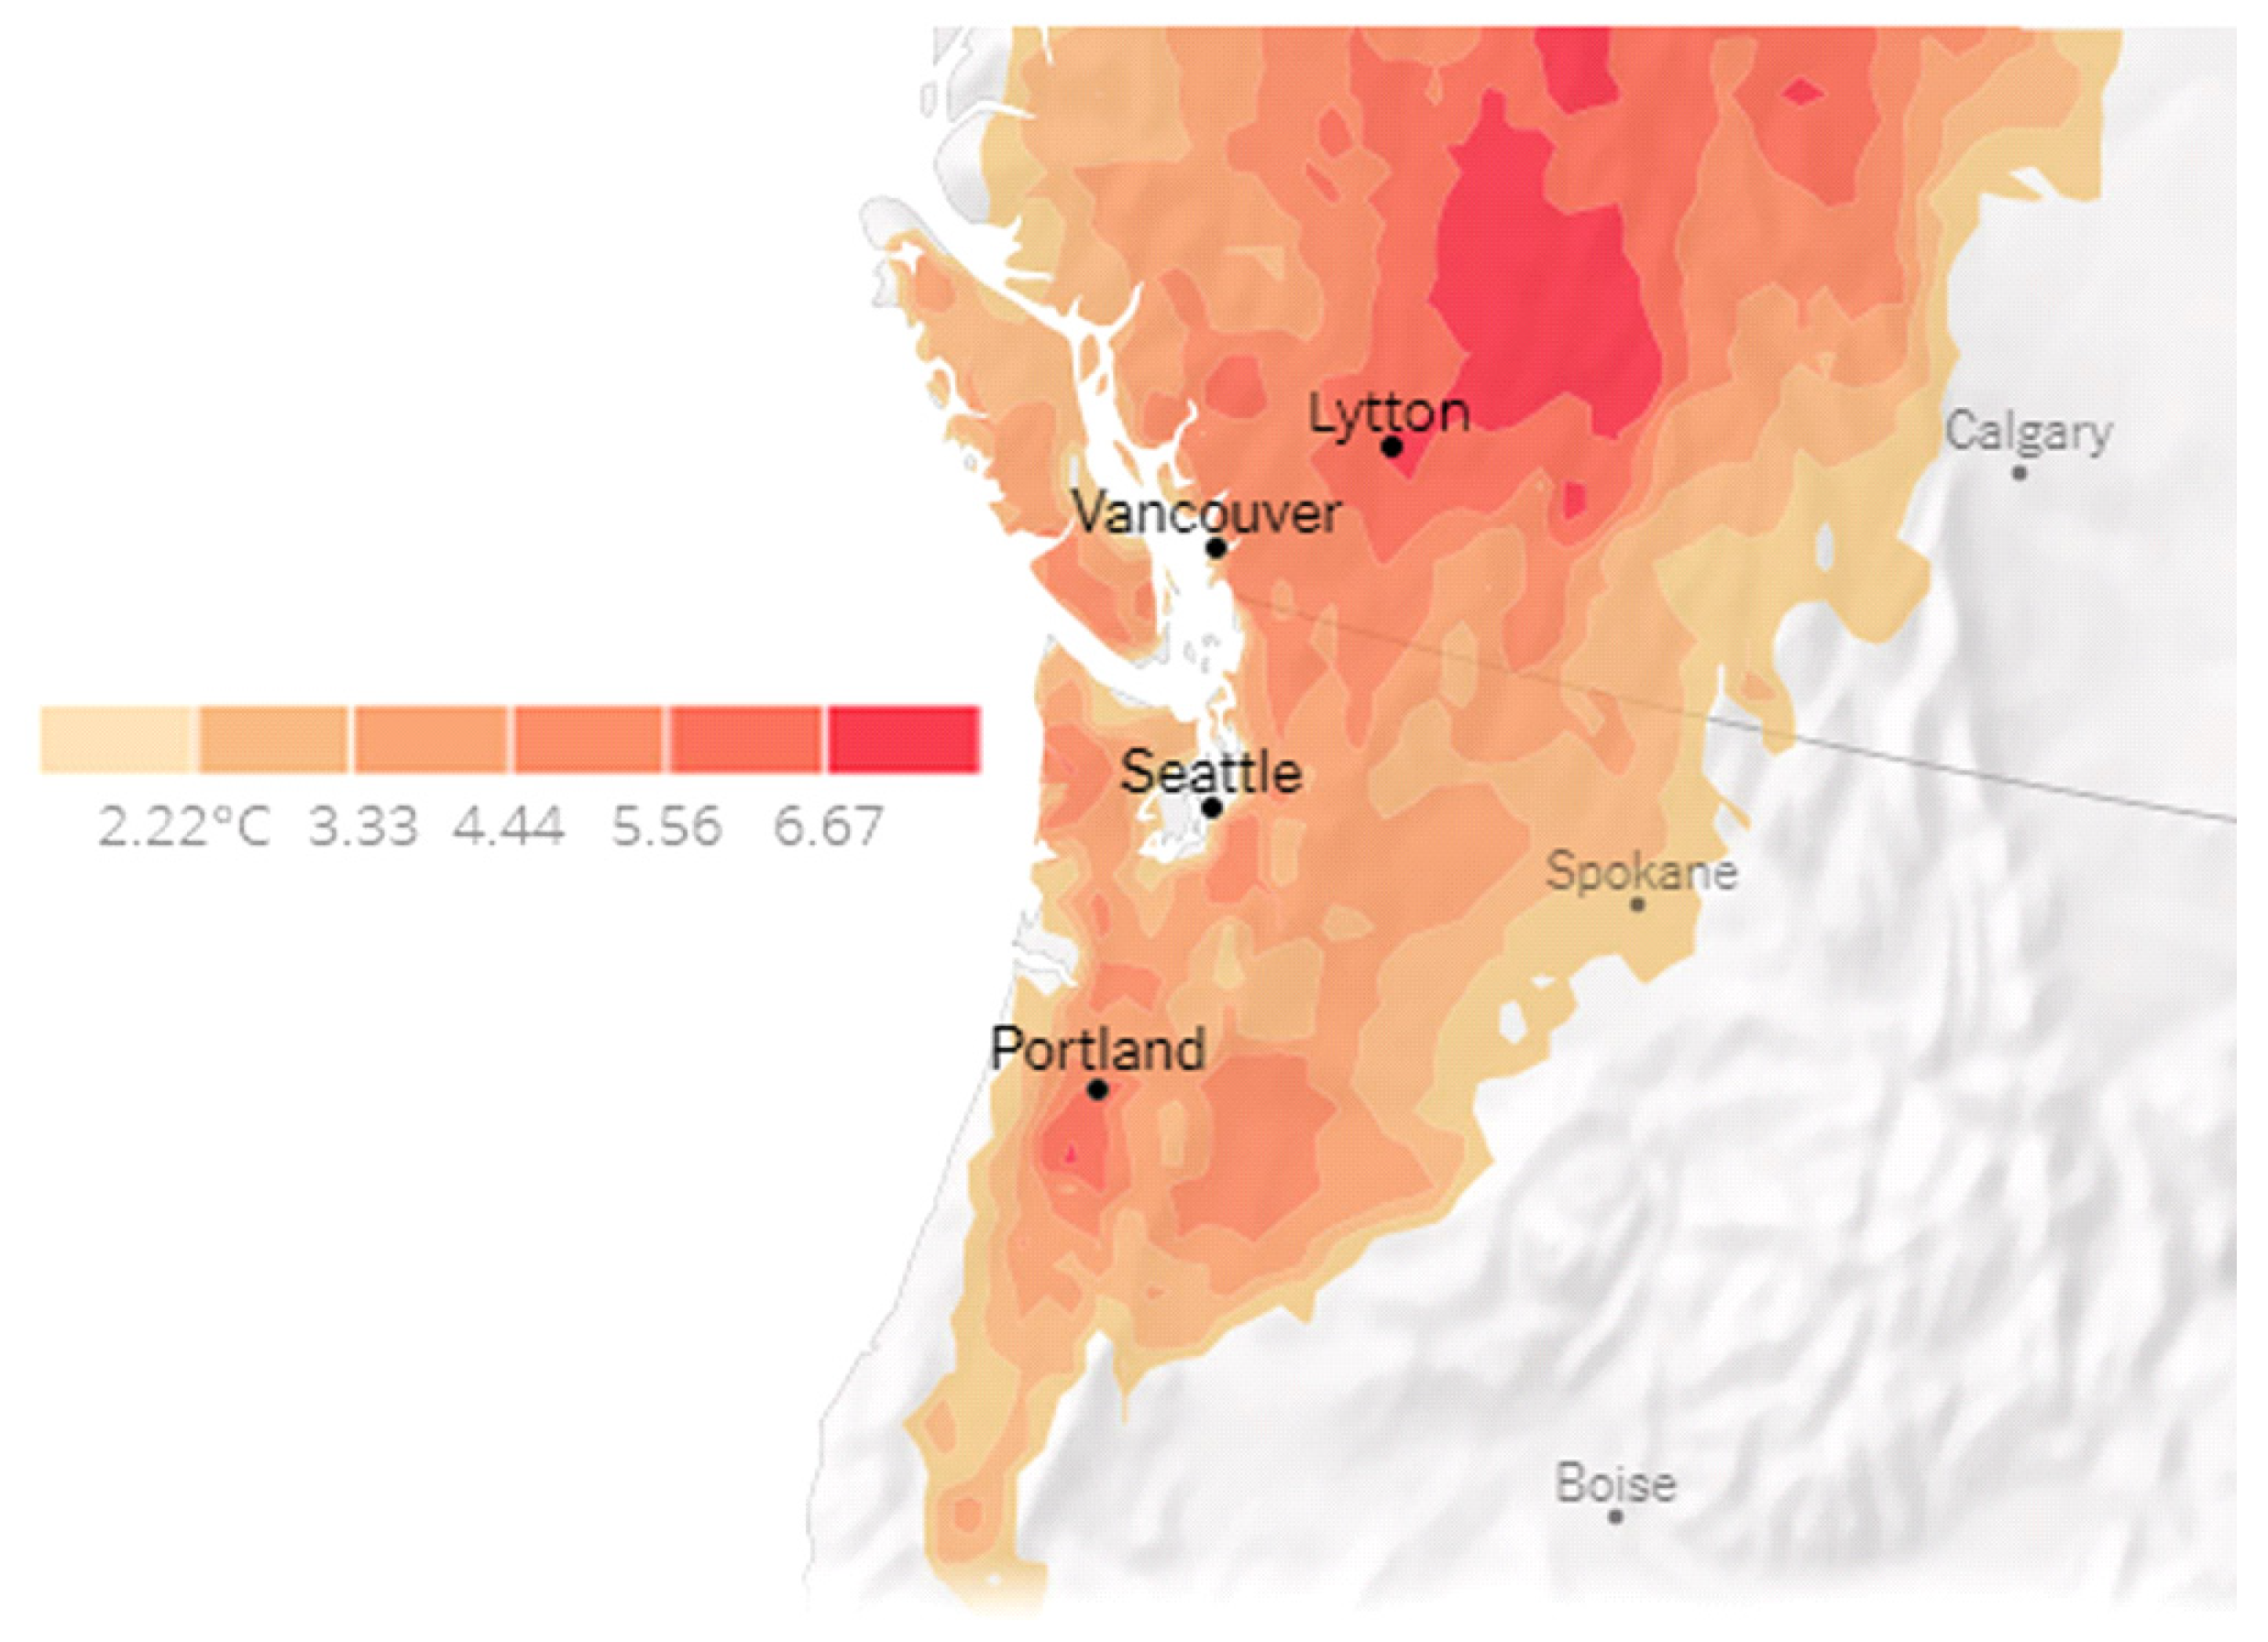
Figure 5.
(left) Subsidence estimates (Pa/s) during 26 June 2021 for the North American west coast based on the Omega equation [5]. Positive values are downward motions. (right) Anomalies of air temperature on a south-north vertical cross-section along 122° W longitude. Maximum values of 16 °C were above the surface in the lower troposphere. Images from NOAA/ESRL plotting routines based on the NCEP/NCAR reanalysis.
Publisher’s Note: MDPI stays neutral with regard to jurisdictional claims in published maps and institutional affiliations. |
© 2021 by the author. Licensee MDPI, Basel, Switzerland. This article is an open access article distributed under the terms and conditions of the Creative Commons Attribution (CC BY) license (https://creativecommons.org/licenses/by/4.0/).
Share and Cite
MDPI and ACS Style
Overland, J.E. Causes of the Record-Breaking Pacific Northwest Heatwave, Late June 2021. Atmosphere 2021, 12, 1434. https://doi.org/10.3390/atmos12111434
AMA Style
Overland JE. Causes of the Record-Breaking Pacific Northwest Heatwave, Late June 2021. Atmosphere. 2021; 12(11):1434. https://doi.org/10.3390/atmos12111434
Chicago/Turabian StyleOverland, James E. 2021. "Causes of the Record-Breaking Pacific Northwest Heatwave, Late June 2021" Atmosphere 12, no. 11: 1434. https://doi.org/10.3390/atmos12111434
Note that from the first issue of 2016, this journal uses article numbers instead of page numbers. See further details here.