Regional Air Pollutant Characteristics and Health Risk Assessment of Large Cities in Northeast China
Abstract
:1. Introduction
2. Materials and Methods
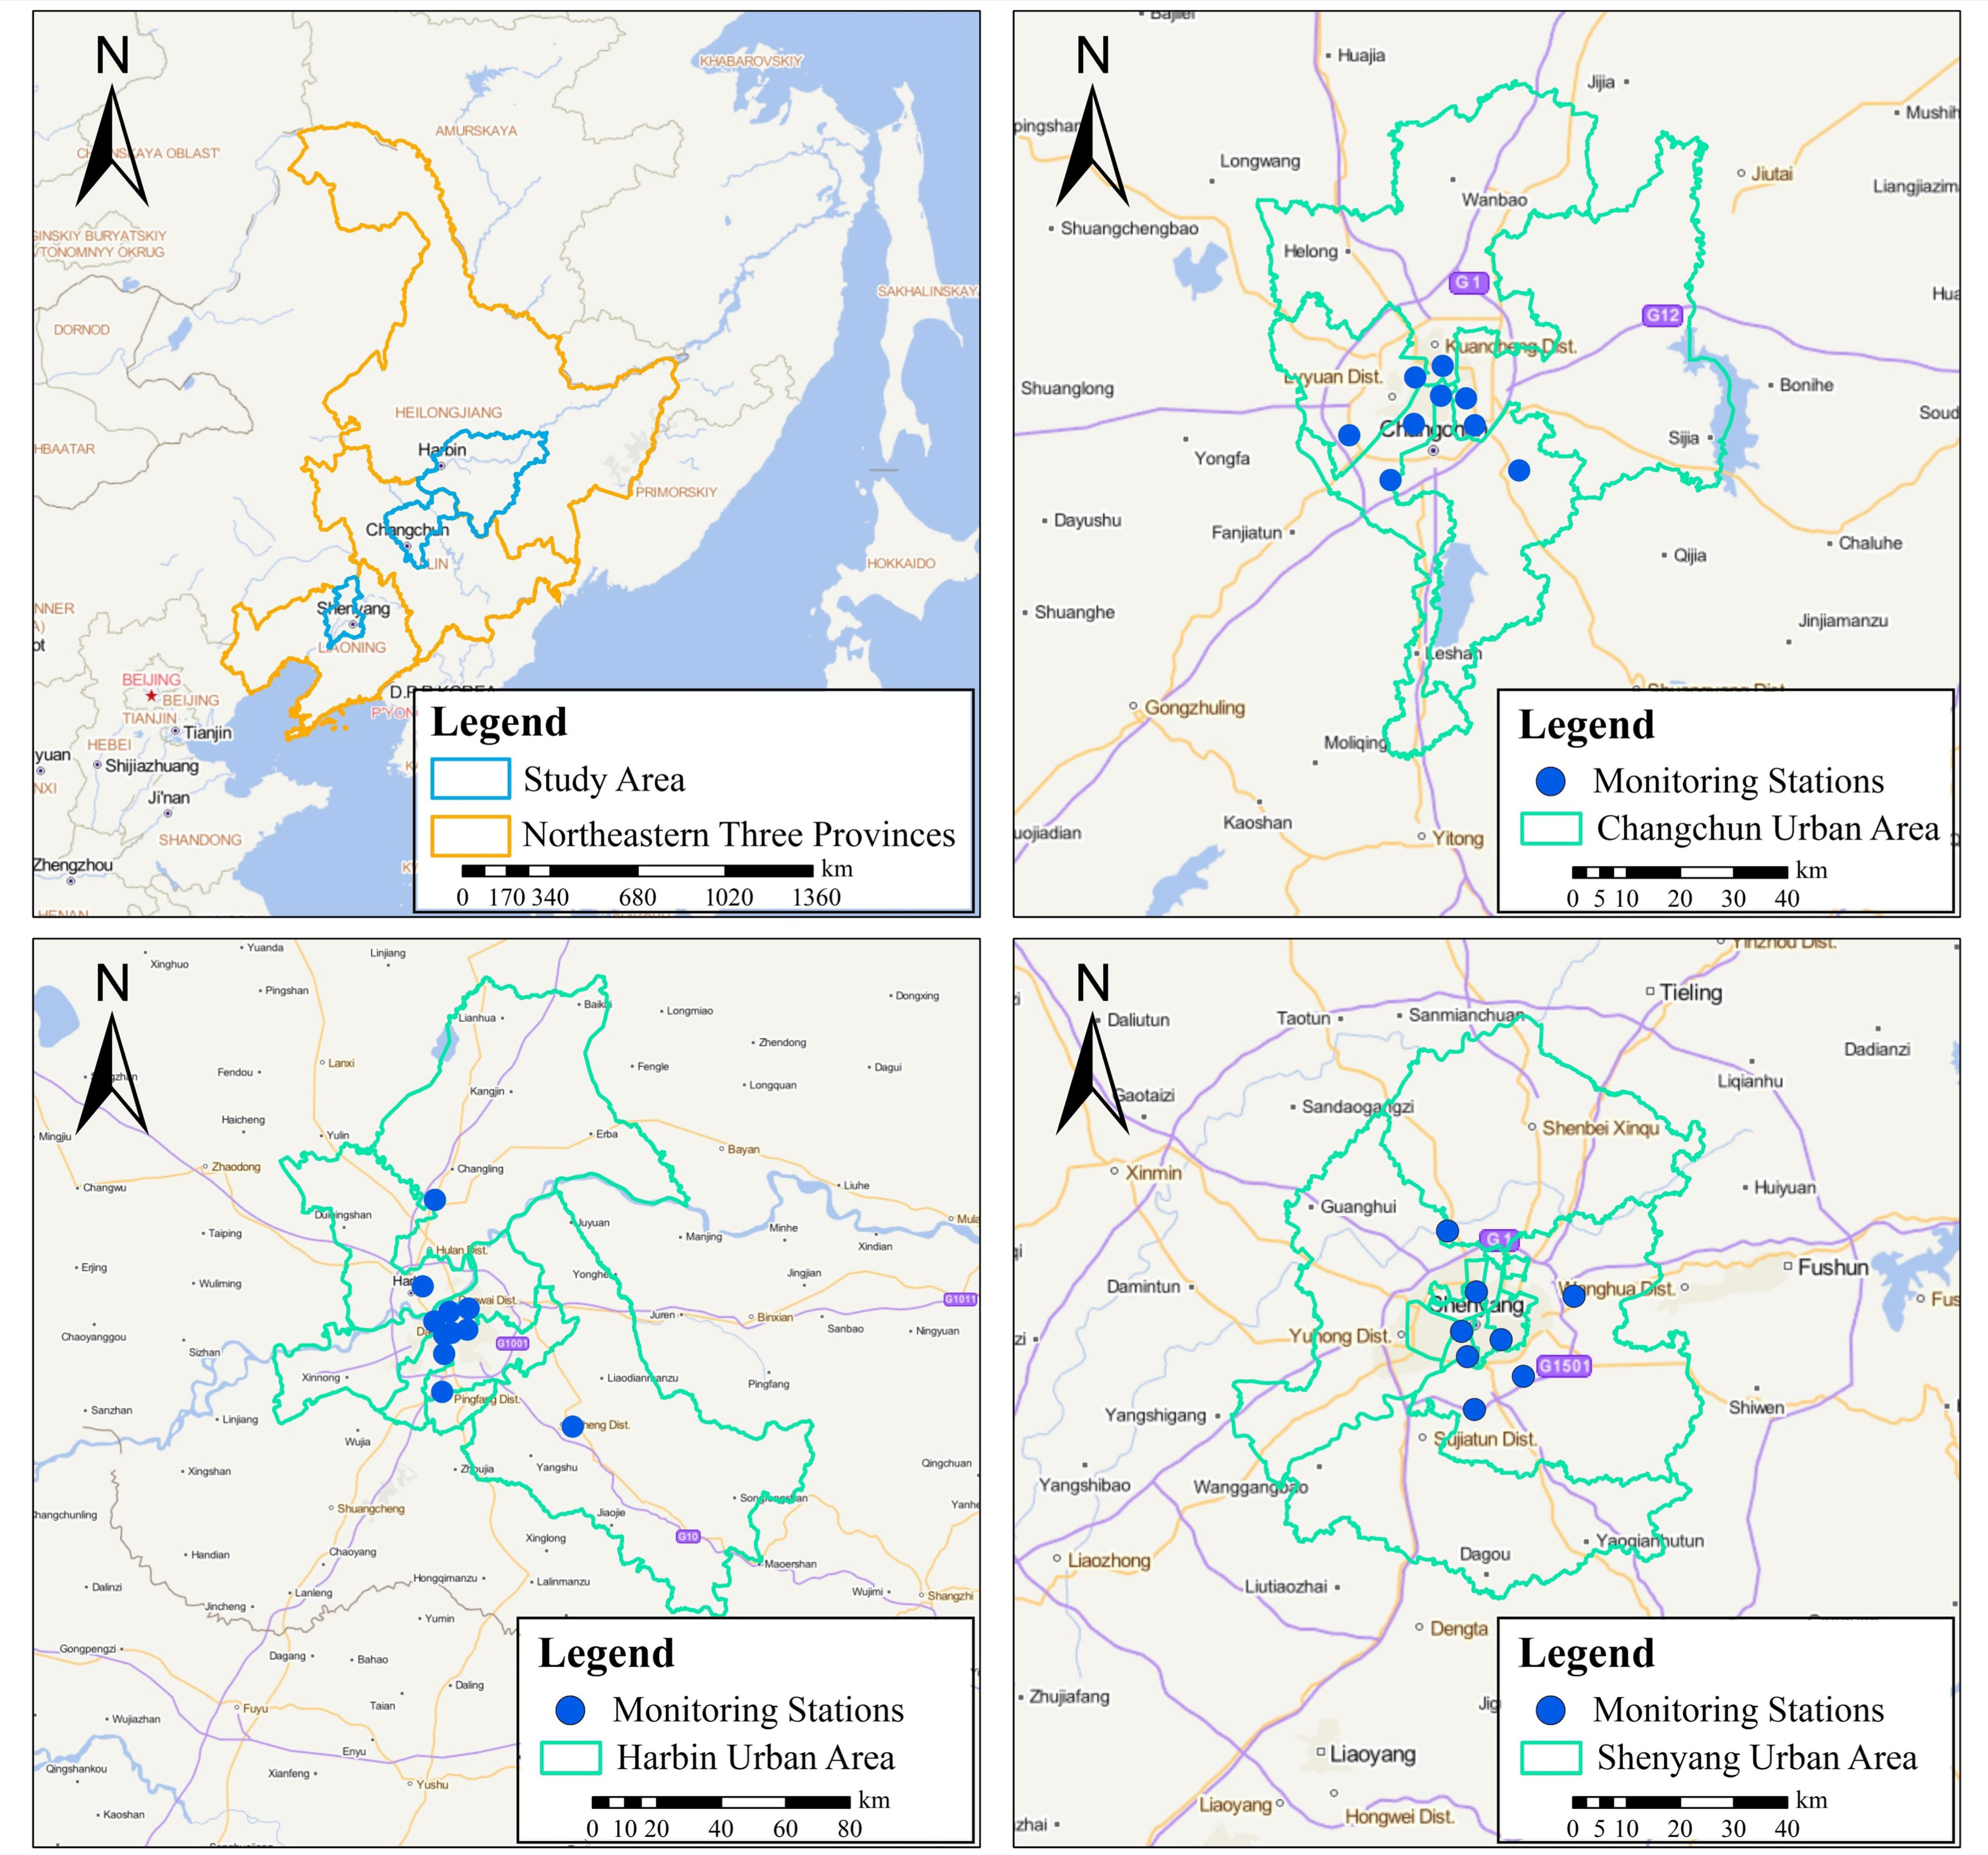
2.1. Study Area and Data Selection
2.2. Backward Trajectory Clustering Analysis
2.3. Potential Source Contribution Function (PSCF) and Concentration Weighting Trajectory (CWT) Analysis
2.3.1. PSCF Analysis
2.3.2. CWT Analysis
2.4. Health Risk Assessment
3. Results and Discussion
3.1. Pollution Characteristics of Major Cities in the Three Eastern Provinces
3.1.1. Annual Variation of PM2.5 and O3 Concentrations
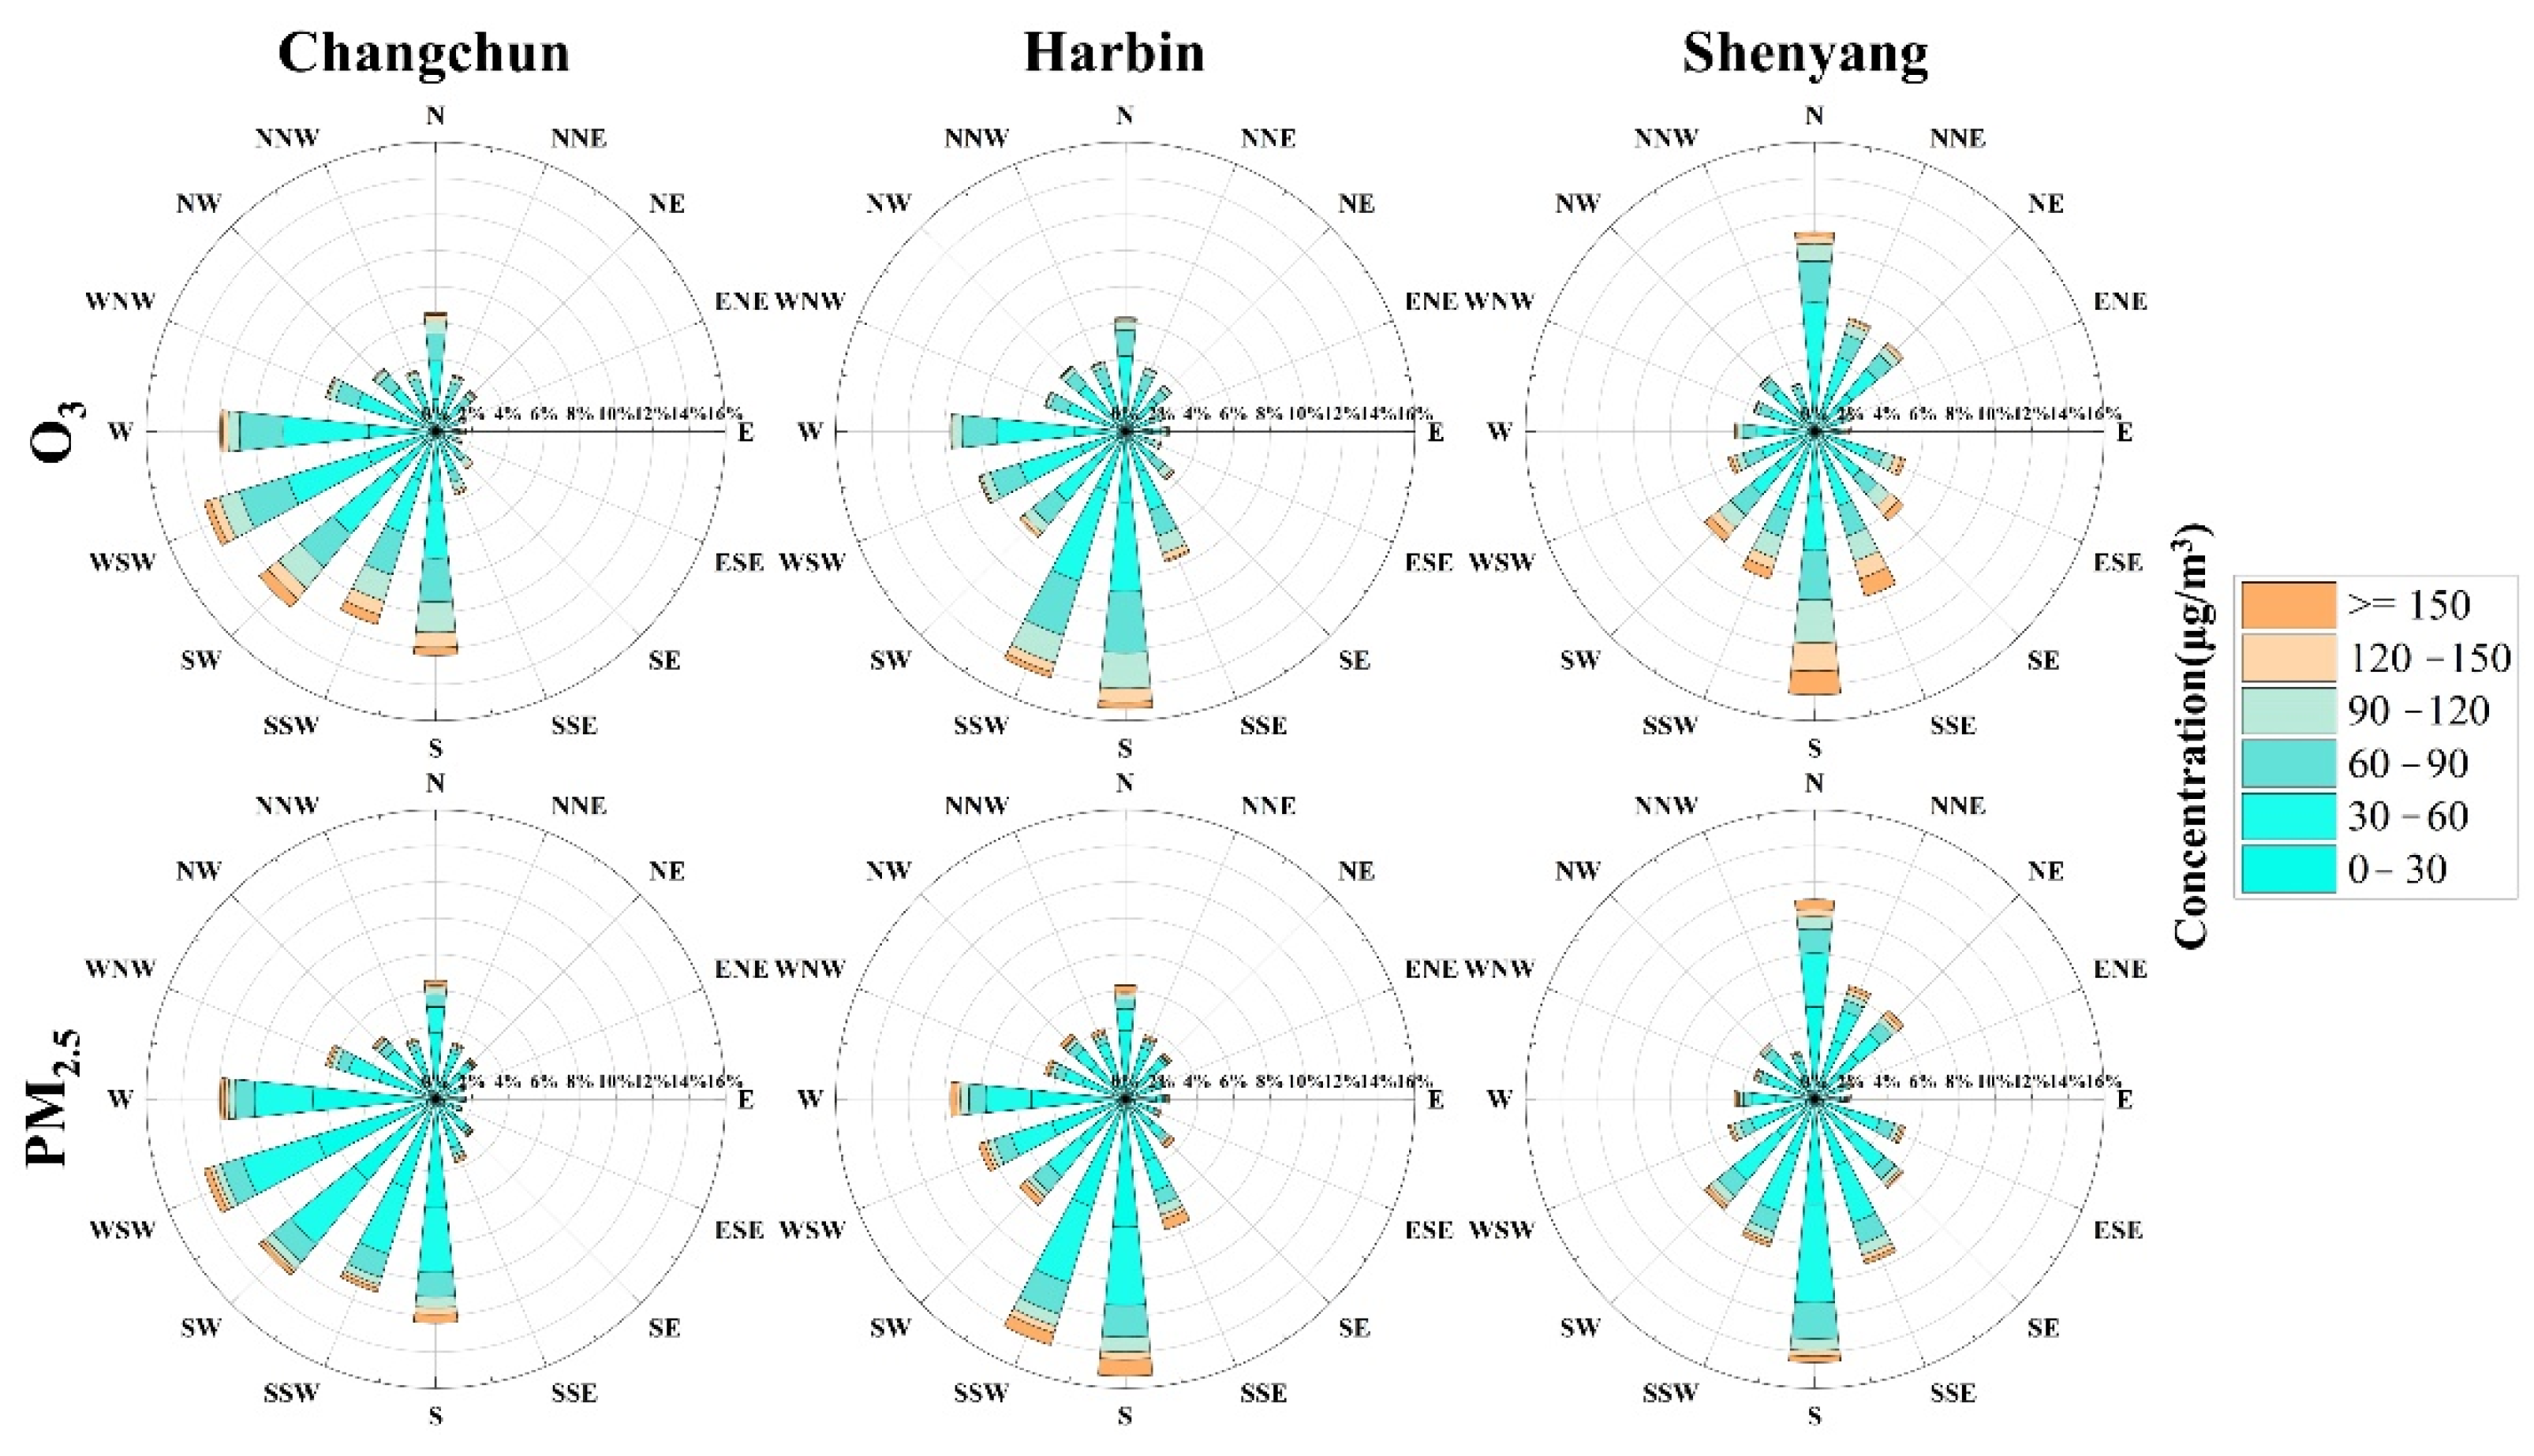
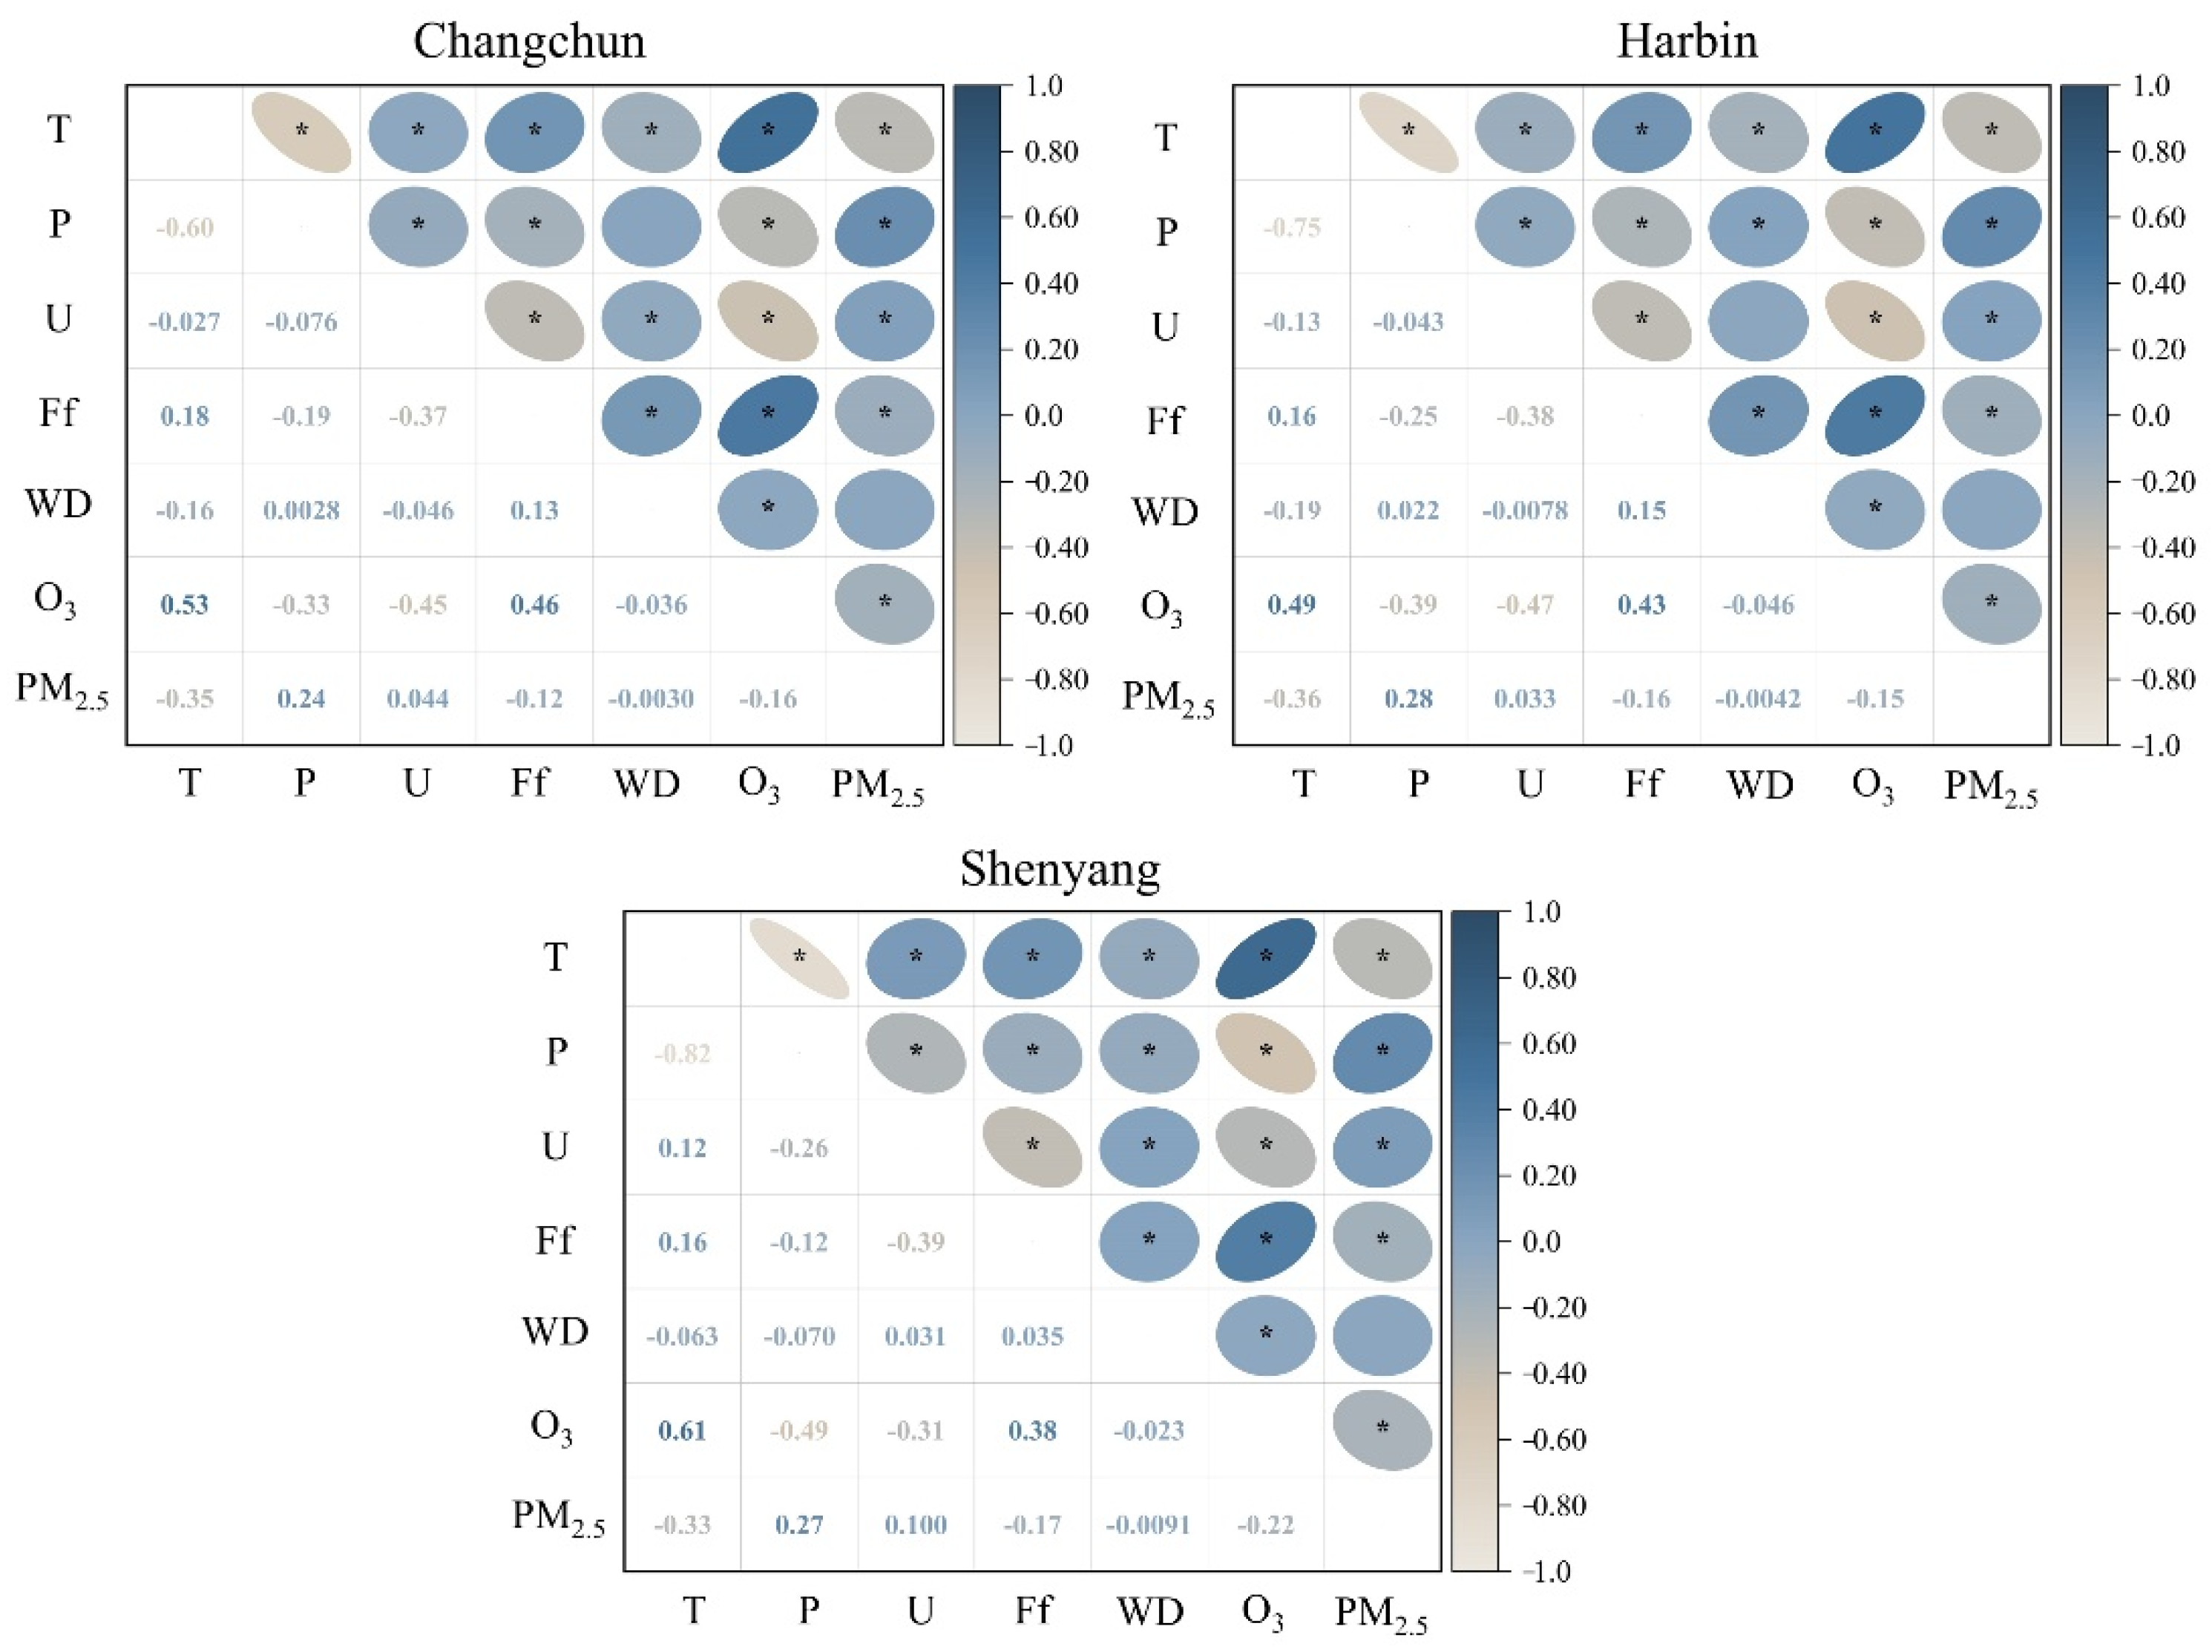
3.1.2. Relationship between Meteorological Factors and PM2.5 and O3
3.2. Backward Trajectory-Based PSCF and CWT Analysis
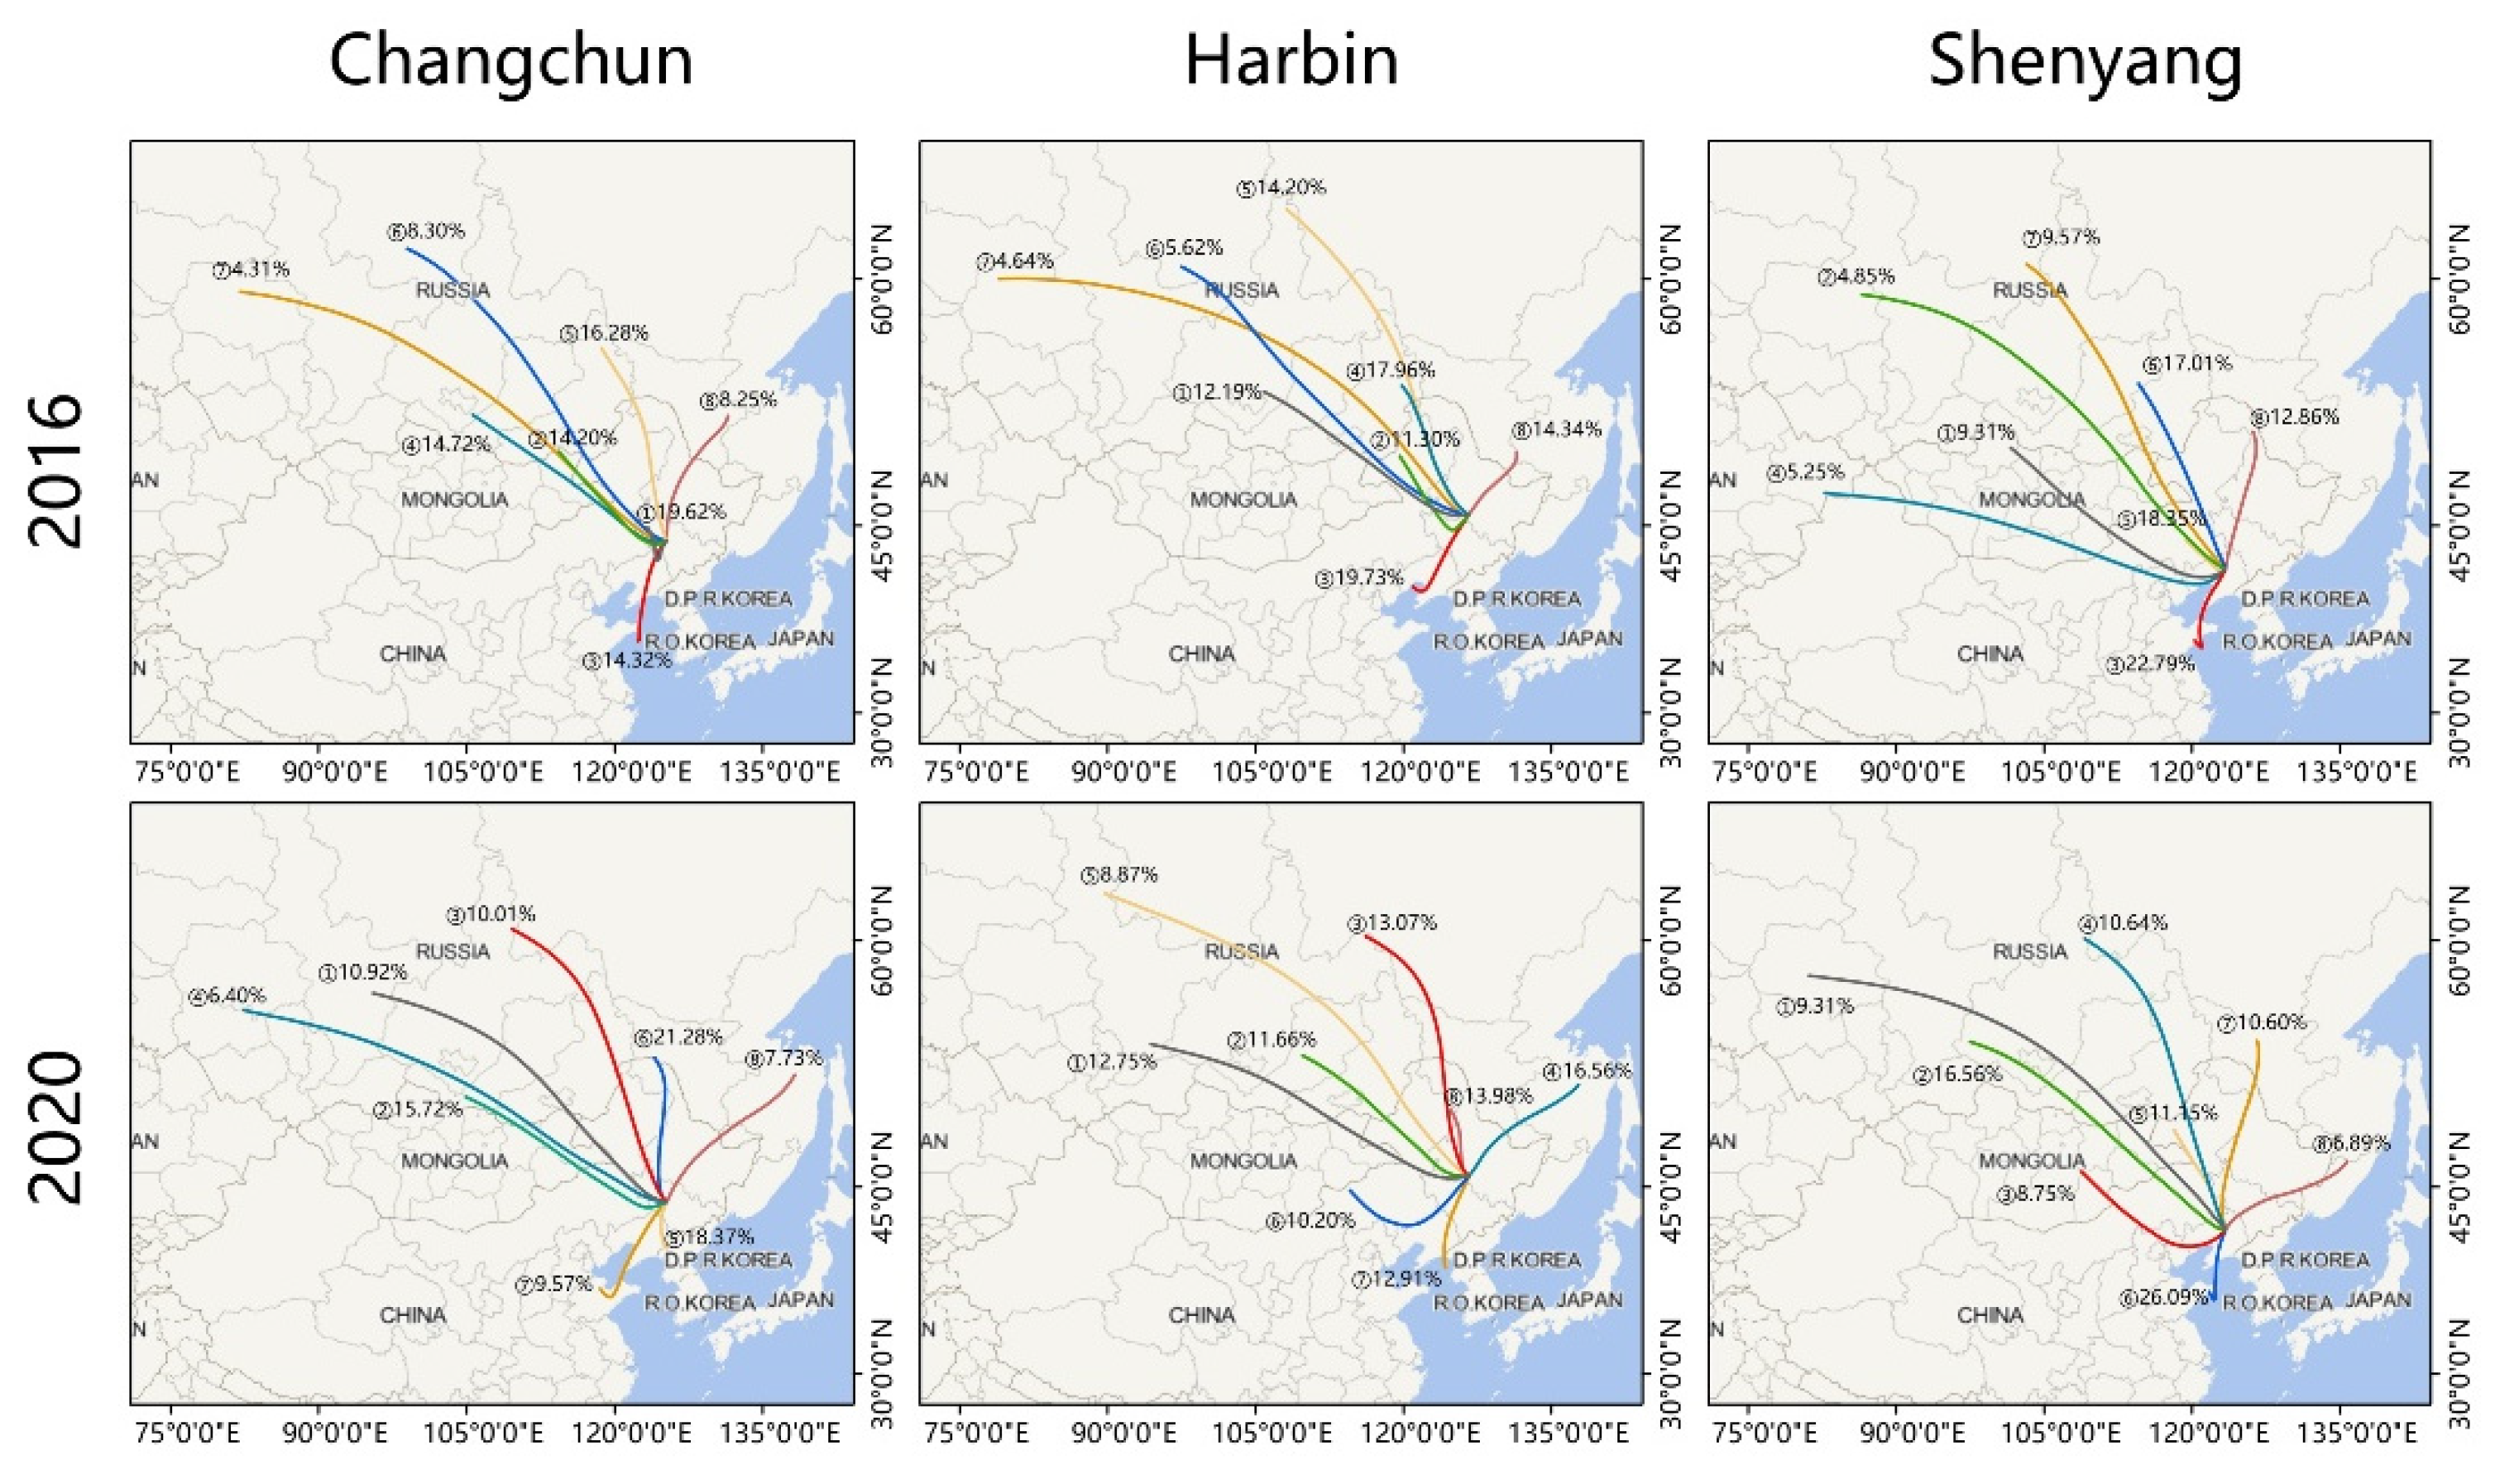
3.2.1. Backward Trajectory Clustering Analysis
3.2.2. PSCF Analysis
3.2.3. CWT Analysis
3.3. Health Risk Assessment
4. Conclusions
Author Contributions
Funding
Institutional Review Board Statement
Informed Consent Statement
Data Availability Statement
Acknowledgments
Conflicts of Interest
References
- Zhang, Q.; Jiang, X.; Tong, D.; Davis, S.J.; Zhao, H.; Geng, G.; Feng, T.; Zheng, B.; Lu, Z.; Streets, D.G.; et al. Transboundary health impacts of transported global air pollution and international trade. Nature 2017, 543, 705–709. [Google Scholar] [CrossRef] [Green Version]
- Lelieveld, J.; Pozzer, A.; Poschl, U.; Fnais, M.; Haines, A.; Munzel, T. Loss of life expectancy from air pollution compared to other risk factors: A worldwide perspective. Cardiovasc. Res. 2020, 116, 1910–1917. [Google Scholar] [CrossRef]
- Kim, Y.; Choi, Y.H.; Kim, M.K.; Paik, H.J.; Kim, D.H. Different adverse effects of air pollutants on dry eye disease: Ozone, PM2.5, and PM10. Environ. Pollut. 2020, 265, 115039. [Google Scholar] [CrossRef]
- Smith, R.B.; Beevers, S.D.; Gulliver, J.; Dajnak, D.; Fecht, D.; Blangiardo, M.; Douglass, M.; Hansell, A.L.; Anderson, H.R.; Kelly, F.J.; et al. Impacts of air pollution and noise on risk of preterm birth and stillbirth in London. Environ. Int. 2020, 134, 105290. [Google Scholar] [CrossRef]
- Dedoussi, I.C.; Eastham, S.D.; Monier, E.; Barrett, S.R.H. Premature mortality related to United States cross-state air pollution. Nature 2020, 578, 261–265. [Google Scholar] [CrossRef]
- Pope, C.A., III; Coleman, N.; Pond, Z.A.; Burnett, R.T. Fine particulate air pollution and human mortality: 25+ years of cohort studies. Environ. Res. 2020, 183, 108924. [Google Scholar] [CrossRef]
- Zhu, Y.; Wang, Y.; Xu, H.; Luo, B.; Zhang, W.; Guo, B.; Chen, S.; Zhao, X.; Li, W. Joint effect of multiple air pollutants on daily emergency department visits in Chengdu, China. Environ. Pollut. 2020, 257, 113548. [Google Scholar] [CrossRef]
- Edlund, K.K.; Killman, F.; Molnár, P.; Boman, J.; Stockfelt, L.; Wichmann, J. Health Risk Assessment of PM2.5 and PM2.5-Bound Trace Elements in Thohoyandou, South Africa. Int. J. Environ. Res. Public Health 2021, 18, 1359. [Google Scholar] [CrossRef]
- Jones, E.R.; Cedeño Laurent, J.G.; Young, A.S.; MacNaughton, P.; Coull, B.A.; Spengler, J.D.; Allen, J.G. The effects of ventilation and filtration on indoor PM2.5 in office buildings in four countries. Build. Environ. 2021, 200, 107975. [Google Scholar] [CrossRef]
- Yue, H.; He, C.; Huang, Q.; Yin, D.; Bryan, B.A. Stronger policy required to substantially reduce deaths from PM2.5 pollution in China. Nat. Commun. 2020, 11, 1462. [Google Scholar] [CrossRef] [Green Version]
- Fan, H.; Zhao, C.; Yang, Y. A comprehensive analysis of the spatio-temporal variation of urban air pollution in China during 2014–2018. Atmos. Environ. 2020, 220. [Google Scholar] [CrossRef]
- Li, K.; Jacob, D.J.; Liao, H.; Shen, L.; Zhang, Q.; Bates, K.H. Anthropogenic drivers of 2013–2017 trends in summer surface ozone in China. Proc. Natl. Acad. Sci. USA 2019, 116, 422. [Google Scholar] [CrossRef] [PubMed] [Green Version]
- Sicard, P.; De Marco, A.; Agathokleous, E.; Feng, Z.; Xu, X.; Paoletti, E.; Rodriguez, J.J.D.; Calatayud, V. Amplified ozone pollution in cities during the COVID-19 lockdown. Sci. Total Environ. 2020, 735, 139542. [Google Scholar] [CrossRef]
- Wang, Y.; Liao, H. Effect of emission control measures on ozone concentrations in Hangzhou during G20 meeting in 2016. Chemosphere 2020, 261, 127729. [Google Scholar] [CrossRef] [PubMed]
- Wang, Z.; Li, Y.; Chen, T.; Li, L.; Liu, B.; Zhang, D.; Sun, F.; Wei, Q.; Jiang, L.; Pan, L. Changes in atmospheric composition during the 2014 APEC conference in Beijing. J. Geophys. Res. 2015, 120, 12695–12707. [Google Scholar] [CrossRef] [Green Version]
- Park, E.H.; Heo, J.; Kim, H.; Yi, S.-M. The major chemical constituents of PM2.5 and airborne bacterial community phyla in Beijing, Seoul, and Nagasaki. Chemosphere 2020, 254, 126870. [Google Scholar] [CrossRef]
- Salmabadi, H.; Khalidy, R.; Saeedi, M. Transport routes and potential source regions of the Middle Eastern dust over Ahvaz during 2005–2017. Atmos. Res. 2020, 241, 104947. [Google Scholar] [CrossRef]
- Xia, L.; Zhang, G.; Zhan, M.; Li, B.; Kong, P. Seasonal variations of atmospheric CH4 at Jingdezhen station in Central China: Understanding the regional transport and its correlation with CO2 and CO. Atmos. Res. 2020, 241, 104982. [Google Scholar] [CrossRef]
- Fang, C.; Gao, J.; Wang, D.; Wang, D.; Wang, J. Optimization of stepwise clustering algorithm in backward trajectory analysis. Neural Comput. Appl. 2020, 32, 109–115. [Google Scholar] [CrossRef]
- Wang, L.; Wang, J.; Fang, C. Assessing the Impact of Lockdown on Atmospheric Ozone Pollution Amid the First Half of 2020 in Shenyang, China. Int. J. Environ. Res. Public Health 2020, 17, 9004. [Google Scholar] [CrossRef]
- Polissar, A.V.; Hopke, P.K.; Paatero, P.; Kaufmann, Y.J.; Hall, D.K.; Bodhaine, B.A.; Dutton, E.G. The aerosol at Barrow, Alaska: Long-term trends and source locations. Atmos. Environ. 1999, 33, 18. [Google Scholar] [CrossRef]
- Dimitriou, K.; Kassomenos, P. Combining AOT, Angstrom Exponent and PM concentration data, with PSCF model, to distinguish fine and coarse aerosol intrusions in Southern France. Atmos. Res. 2016, 172, 74–82. [Google Scholar] [CrossRef]
- Dimitriou, K.; Kassomenos, P. Indicators reflecting local and transboundary sources of PM2.5 and PMCOARSE in Rome—Impacts in air quality. Atmos. Environ. 2014, 96, 154–162. [Google Scholar] [CrossRef]
- Stohl, A. Trajectory statistics-A new method to establish source-receptor relationships of air pollutants and its application to the transport of particulate sulfate in Europe. Atmos. Environ. 1996, 30, 579–587. [Google Scholar] [CrossRef]
- Li, L.; Yan, D.; Xu, S.; Huang, M.; Wang, X.; Xie, S. Characteristics and source distribution of air pollution in winter in Qingdao, eastern China. Environ. Pollut. 2017, 224, 44–53. [Google Scholar] [CrossRef]
- Zhao, Q.; He, Q.; Jin, L.; Wang, J.; Donateo, A. Potential Source Regions and Transportation Pathways of Reactive Gases at a Regional Background Site in Northwestern China. Adv. Meteorol. 2021, 2021, 1–20. [Google Scholar] [CrossRef]
- Wang, L.; Xing, L.; Wu, X.; Sun, J.; Kong, M. Spatiotemporal variations and risk assessment of ambient air O3, PM10 and PM2.5 in a coastal city of China. Ecotoxicology 2021, 30, 1333–1342. [Google Scholar] [CrossRef] [PubMed]
- Othman, M.; Latif, M.T.; Yee, C.Z.; Norshariffudin, L.K.; Azhari, A.; Halim, N.D.A.; Alias, A.; Sofwan, N.M.; Hamid, H.H.A.; Matsumi, Y. PM2.5 and ozone in office environments and their potential impact on human health. Ecotox. Environ. Saf. 2020, 194, 110432. [Google Scholar] [CrossRef]
- Othman, M.; Latif, M.T. Air pollution impacts from COVID-19 pandemic control strategies in Malaysia. J. Clean. Prod. 2021, 291, 125992. [Google Scholar] [CrossRef]
- Li, B.; Shi, X.; Liu, Y.; Lu, L.; Wang, G.; Thapa, S.; Sun, X.; Fu, D.; Wang, K.; Qi, H. Long-term characteristics of criteria air pollutants in megacities of Harbin-Changchun megalopolis, Northeast China: Spatiotemporal variations, source analysis, and meteorological effects. Environ. Pollut. 2020, 267, 115441. [Google Scholar] [CrossRef]
- Li, W.; Duan, F.; Zhao, Q.; Song, W.; Cheng, Y.; Wang, X.; Li, L.; He, K. Investigating the effect of sources and meteorological conditions on wintertime haze formation in Northeast China: A case study in Harbin. Sci. Total Environ. 2021, 801, 149631. [Google Scholar] [CrossRef] [PubMed]
- Ma, Y.; Wang, M.; Wang, S.; Wang, Y.; Feng, L.; Wu, K. Air pollutant emission characteristics and HYSPLIT model analysis during heating period in Shenyang, China. Environ. Monit. Assess. 2020, 193, 9. [Google Scholar] [CrossRef] [PubMed]
- Raoufi, S.S.; Goharnejad, H.; Niri, M.Z. Air Pollution Effects on Climate and Air Temperature of Tehran City Using Remote Sensing Data. Asian J. Water Environ. Pollut. 2018, 15, 79–87. [Google Scholar] [CrossRef]
- Liu, N.; Lin, W.; Ma, J.; Xu, W.; Xu, X. Seasonal variation in surface ozone and its regional characteristics at global atmosphere watch stations in China. J. Environ. Sci. 2019, 77, 291–302. [Google Scholar] [CrossRef] [PubMed]
- Neto, P.S.G.D.M.; Marinho, M.H.N.; Siqueira, H.; de Souza Tadano, Y.; Machado, V.; Antonini Alves, T.; de Oliveira, J.F.L.; Madeiro, F. A Methodology to Increase the Accuracy of Particulate Matter Predictors Based on Time Decomposition. Sustainability 2020, 12, 7310. [Google Scholar] [CrossRef]
- Neto, P.S.G.D.M.; Firmino, P.R.A.; Siqueira, H.; Tadano, Y.D.S.; Alves, T.A.; Oliveira, J.F.L.D.; Marinho, M.H.D.N.; Madeiro, F. Neural-Based Ensembles for Particulate Matter Forecasting. IEEE Access 2021, 9, 14470–14490. [Google Scholar] [CrossRef]
- Neto, P.S.G.D.M.; Cavalcanti, G.D.C.; Madeiro, F. Nonlinear combination method of forecasters applied to PM time series. Pattern Recogn. Lett. 2017, 95, 65–72. [Google Scholar] [CrossRef]
- Neto, P.S.G.D.M.; Madeiro, F.; Ferreira, T.A.E.; Cavalcanti, G.D.C. Hybrid intelligent system for air quality forecasting using phase adjustment. Eng. Appl. Artif. Intell. 2014, 32, 185–191. [Google Scholar] [CrossRef]

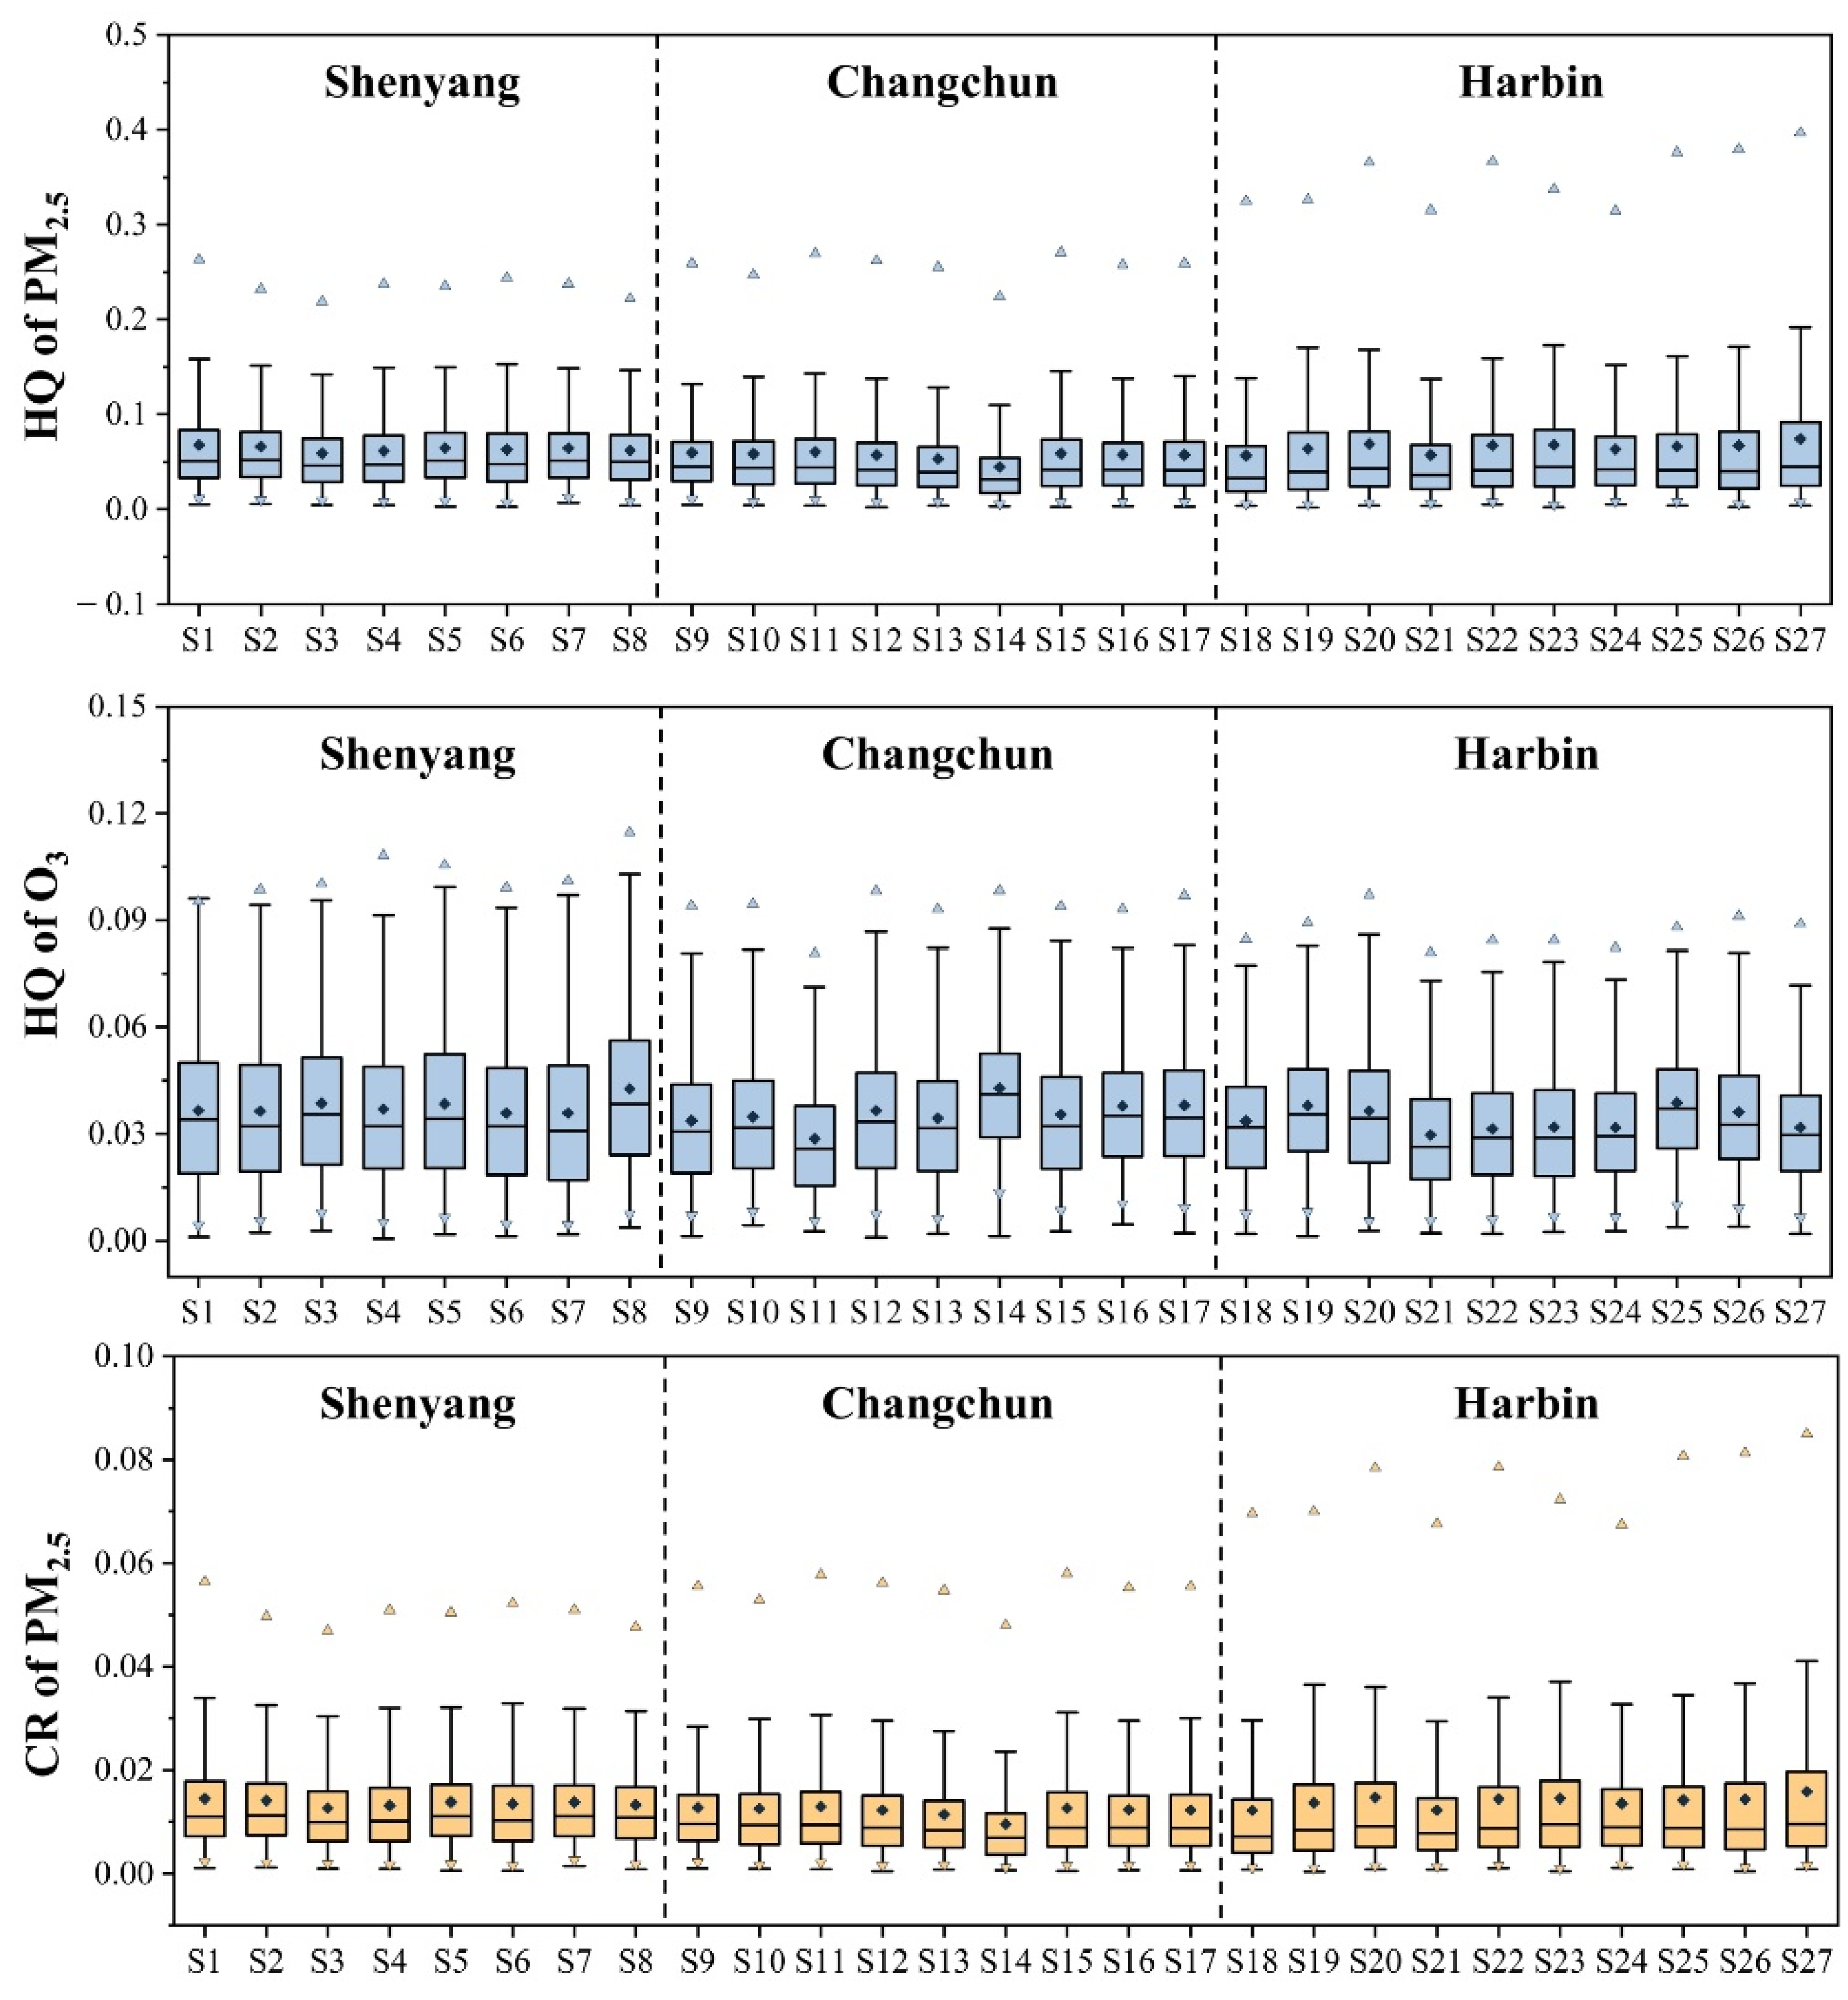
| Pollutants | S1 | S2 | S3 | S4 | S5 | S6 | S7 | S8 | |
|---|---|---|---|---|---|---|---|---|---|
| Non-carcinogenic risks | |||||||||
| O3 | Min | 0.0011 | 0.0023 | 0.0027 | 0.0006 | 0.0018 | 0.0013 | 0.0018 | 0.0037 |
| Max | 0.1388 | 0.1391 | 0.1511 | 0.1493 | 0.1304 | 0.1392 | 0.1391 | 0.1535 | |
| Median | 0.0340 | 0.0322 | 0.0354 | 0.0322 | 0.0342 | 0.0321 | 0.0308 | 0.0384 | |
| Mean | 0.0365 | 0.0364 | 0.0386 | 0.0370 | 0.0384 | 0.0358 | 0.0358 | 0.0427 | |
| PM2.5 | Min | 0.0051 | 0.0056 | 0.0046 | 0.0043 | 0.0027 | 0.0026 | 0.0068 | 0.0041 |
| Max | 0.4353 | 0.4114 | 0.3349 | 0.3148 | 0.3755 | 0.4594 | 0.4357 | 0.3101 | |
| Median | 0.0513 | 0.0521 | 0.0462 | 0.0472 | 0.0515 | 0.0478 | 0.0515 | 0.0504 | |
| Mean | 0.0675 | 0.0659 | 0.0591 | 0.0614 | 0.0645 | 0.0629 | 0.0644 | 0.0621 | |
| Carcinogenic risks | |||||||||
| PM2.5 | Min | 0.0011 | 0.0012 | 0.0010 | 0.0009 | 0.0006 | 0.0006 | 0.0015 | 0.0009 |
| Max | 0.0933 | 0.0882 | 0.0718 | 0.0675 | 0.0805 | 0.0984 | 0.0934 | 0.0665 | |
| Median | 0.0110 | 0.0112 | 0.0099 | 0.0101 | 0.0110 | 0.0102 | 0.0110 | 0.0108 | |
| Mean | 0.0145 | 0.0141 | 0.0127 | 0.0132 | 0.0138 | 0.0135 | 0.0138 | 0.0133 | |
| Pollutants | S9 | S10 | S11 | S12 | S13 | S14 | S15 | S16 | S17 | |
|---|---|---|---|---|---|---|---|---|---|---|
| Non-carcinogenic risks | ||||||||||
| O3 | Min | 0.0013 | 0.0044 | 0.0026 | 0.0010 | 0.0019 | 0.0013 | 0.0026 | 0.0046 | 0.0021 |
| Max | 0.1164 | 0.1156 | 0.1054 | 0.1277 | 0.1193 | 0.1312 | 0.1200 | 0.1235 | 0.1311 | |
| Median | 0.0306 | 0.0317 | 0.0259 | 0.0334 | 0.0316 | 0.0411 | 0.0322 | 0.0350 | 0.0344 | |
| Mean | 0.0337 | 0.0348 | 0.0286 | 0.0365 | 0.0344 | 0.0429 | 0.0354 | 0.0378 | 0.0380 | |
| PM2.5 | Min | 0.0048 | 0.0043 | 0.0040 | 0.0021 | 0.0038 | 0.0030 | 0.0024 | 0.0032 | 0.0028 |
| Max | 0.6070 | 0.4541 | 0.4771 | 0.5710 | 0.5801 | 0.6858 | 0.6086 | 0.5257 | 0.4754 | |
| Median | 0.0450 | 0.0436 | 0.0440 | 0.0416 | 0.0390 | 0.0320 | 0.0416 | 0.0415 | 0.0412 | |
| Mean | 0.0596 | 0.0586 | 0.0605 | 0.0573 | 0.0533 | 0.0446 | 0.0590 | 0.0577 | 0.0575 | |
| Carcinogenic risks | ||||||||||
| PM2.5 | Min | 0.0010 | 0.0009 | 0.0009 | 0.0004 | 0.0008 | 0.0007 | 0.0005 | 0.0007 | 0.0006 |
| Max | 0.1301 | 0.0973 | 0.1022 | 0.1224 | 0.1243 | 0.1470 | 0.1304 | 0.1126 | 0.1019 | |
| Median | 0.0096 | 0.0094 | 0.0094 | 0.0089 | 0.0084 | 0.0068 | 0.0089 | 0.0089 | 0.0088 | |
| Mean | 0.0128 | 0.0126 | 0.0130 | 0.0123 | 0.0114 | 0.0096 | 0.0126 | 0.0124 | 0.0123 | |
| Pollutants | S18 | S19 | S20 | S21 | S22 | S23 | S24 | S25 | S26 | S27 | |
|---|---|---|---|---|---|---|---|---|---|---|---|
| Non-carcinogenic risks | |||||||||||
| O3 | Min | 0.0019 | 0.0013 | 0.0028 | 0.0021 | 0.0019 | 0.0024 | 0.0026 | 0.0039 | 0.0039 | 0.0019 |
| Max | 0.1092 | 0.1209 | 0.1320 | 0.1059 | 0.1294 | 0.2202 | 0.1131 | 0.1223 | 0.1285 | 0.1170 | |
| Median | 0.0319 | 0.0354 | 0.0343 | 0.0264 | 0.0289 | 0.0288 | 0.0293 | 0.0372 | 0.0326 | 0.0296 | |
| Mean | 0.0335 | 0.0380 | 0.0365 | 0.0296 | 0.0314 | 0.0319 | 0.0318 | 0.0387 | 0.0361 | 0.0318 | |
| PM2.5 | Min | 0.0037 | 0.0018 | 0.0039 | 0.0037 | 0.0050 | 0.0020 | 0.0052 | 0.0041 | 0.0021 | 0.0040 |
| Max | 0.9925 | 1.4299 | 1.4414 | 1.1773 | 2.0438 | 1.2372 | 0.8054 | 1.2463 | 1.5295 | 0.9394 | |
| Median | 0.0332 | 0.0394 | 0.0429 | 0.0363 | 0.0410 | 0.0446 | 0.0418 | 0.0413 | 0.0400 | 0.0448 | |
| Mean | 0.0569 | 0.0639 | 0.0687 | 0.0573 | 0.0672 | 0.0678 | 0.0633 | 0.0662 | 0.0670 | 0.0739 | |
| Carcinogenic risks | |||||||||||
| PM2.5 | Min | 0.0008 | 0.0004 | 0.0008 | 0.0008 | 0.0011 | 0.0004 | 0.0011 | 0.0009 | 0.0005 | 0.0009 |
| Max | 0.2127 | 0.3064 | 0.3089 | 0.2523 | 0.4380 | 0.2651 | 0.1726 | 0.2671 | 0.3278 | 0.2013 | |
| Median | 0.0071 | 0.0085 | 0.0092 | 0.0078 | 0.0088 | 0.0096 | 0.0090 | 0.0088 | 0.0086 | 0.0096 | |
| Mean | 0.0122 | 0.0137 | 0.0147 | 0.0123 | 0.0144 | 0.0145 | 0.0136 | 0.0142 | 0.0144 | 0.0158 | |
Publisher’s Note: MDPI stays neutral with regard to jurisdictional claims in published maps and institutional affiliations. |
© 2021 by the authors. Licensee MDPI, Basel, Switzerland. This article is an open access article distributed under the terms and conditions of the Creative Commons Attribution (CC BY) license (https://creativecommons.org/licenses/by/4.0/).
Share and Cite
Fang, C.; Gao, H.; Li, Z.; Wang, J. Regional Air Pollutant Characteristics and Health Risk Assessment of Large Cities in Northeast China. Atmosphere 2021, 12, 1519. https://doi.org/10.3390/atmos12111519
Fang C, Gao H, Li Z, Wang J. Regional Air Pollutant Characteristics and Health Risk Assessment of Large Cities in Northeast China. Atmosphere. 2021; 12(11):1519. https://doi.org/10.3390/atmos12111519
Chicago/Turabian StyleFang, Chunsheng, Hanbo Gao, Zhuoqiong Li, and Ju Wang. 2021. "Regional Air Pollutant Characteristics and Health Risk Assessment of Large Cities in Northeast China" Atmosphere 12, no. 11: 1519. https://doi.org/10.3390/atmos12111519


