Article

The Effects of Display Type, Weather Type, and Pilot Experience on Pilot Interpretation of Weather Products

1
Department of Human Factors and Systems, Embry-Riddle Aeronautical University, Daytona Beach, FL 32114-3900, USA
2
Department of Applied Aviation Sciences, Embry-Riddle Aeronautical University, Daytona Beach, FL 32114-3900, USA
*
Author to whom correspondence should be addressed.
Atmosphere 2021, 12(2), 143; https://doi.org/10.3390/atmos12020143
Submission received: 2 December 2020 / Revised: 4 January 2021 / Accepted: 16 January 2021 / Published: 23 January 2021
(This article belongs to the Special Issue Weather and Aviation Safety)

Abstract

:
The majority of general aviation (GA) accidents involving adverse weather result in fatalities. Considering the high weather-related fatality rate among GA flight operations, it is imperative to ensure that GA pilots of all experience levels can incorporate available weather information into their flight planning. In the past decade, weather product development has incorporated increasing levels of automation, which has led to the generation of high-resolution, model-based aviation displays such as graphical turbulence guidance and current icing potential, which rival the resolution of radar and satellite imagery. This is in stark contrast to the traditional polygonal-based displays of aviation weather hazards (G-AIRMETs and SIGMETs). It is important to investigate the effects of these changes on the end user. Therefore, the purpose of this study was to compare the interpretability of weather products for two areas of interest: display type (traditional polygons vs. model-based imagery) and type of weather phenomena (ceiling/visibility, turbulence, and icing), across a range of pilot experience levels. Two hundred and four participants completed a series of weather product interpretation questions. The results indicated significant effects of product display type, as well as significant effects of weather phenomena and pilot experience on product interpretation. Further investigation is needed to assess possible extraneous variables.

1. Introduction

In the aviation community, general aviation (GA) operations are the most susceptible to weather-related aviation accidents. In fact, between 2000 and 2011 the National Transportation Safety Board (NTSB) identified 19,441 GA accidents, of which 29% were weather related [1]. Additionally, the NTSB identified 159 GA accidents between 2014 and 2018, as weather related [2]. The NTSB findings also indicate that GA accidents involving adverse weather have a high probability of resulting in fatalities [2]. Factors that contribute to the high fatality rate include the nature of GA operations, such as low altitude flights and single-engine flights, and GA pilots’ limited experience interpreting weather information [3]. In terms of the types of weather phenomena in which GA accidents occur, the NTSB reported that adverse winds, ceiling/visibility, density altitude, icing, and thunderstorms were among the top causal conditions [2,4,5]. While GA pilots have a variety of weather products available to use for flight planning, rapidly changing technology has been producing a continual influx of weather products that pilots may or may not interpret correctly. To add to the complexity, new weather products may include unfamiliar graphics, overlaid displays, or products generated entirely by automation without a meteorologist/human-in-the-loop [6]. Finally, pilots with varying levels of flight experience rely on the same products to plan and carry out their flights. Given the high GA weather-related accident rates, the influx of new, complex technology, and the varying experience levels among GA pilots, consideration should be given to the interpretability/usability of new weather products. Thus, the current study compares the interpretability of weather products with respect to type of display, type of weather phenomena, and GA pilot experience level.

1.1. GA Weather Product/Displays

Information on weather phenomena (e.g., winds, ceiling/visibility, density altitude, icing, thunderstorms, low ceiling) are presented to pilots via weather products. The Federal Aviation Administration (FAA) categorizes weather products into three groups, i.e., observations, analyses, and forecasts [6]. Observation products collect current weather information from one or more sensors (e.g., Satellite and METARs (meteorological aerodrome reports) and Terminal Doppler Weather Radar). Analysis products are enhanced depictions or interpretations of observation data (e.g., Ceiling and Visibility Analysis (CVA) and Surface Analysis Charts). Forecast products use numerical model guidance and forecaster experience to predict future weather conditions (e.g., Significant Meteorological Information (SIGMET), Graphical Airmen’s Meteorological Information (G-AIRMET), Center Weather Advisory (CWA), and Graphical Forecast for Aviation (GFA)).
Aviation weather hazard products/displays have traditionally been created using polygons to identify the horizontal extent of the hazard, while information boxes indicate the vertical extent (e.g., G-AIRMETs and SIGMETs). These products are generated with input from a meteorologist/human-in-the-loop (HITL). More recently, products, which stem from high-resolution model output (e.g., Current Icing Product and Forecast Icing Potential (CIP/FIP) and Graphical Turbulence Guidance (GTG)), have allowed for the development of “image-like” products, similar to satellite and radar imagery [7]. These types of products will be referred to as “model-based imagery” or simply “imagery” throughout the remainder of the paper. These products are automated and display hazards using a variety of color shades to indicate varying levels of intensity. The vertical extent is typically displayed by allowing the user to select a specific altitude (or flight level) or by showing the maximum intensity regardless of altitude, while the intensity is displayed using a color-bar legend [6].
While pilots consider weather information during two time periods, i.e., preflight (before takeoff) and inflight (during flight operations), the emphasis of this paper is pilots’ preflight weather planning. During the preflight planning process, a pilot can obtain weather information using a Flight Service Station (FSS) call-in service, various commercial mobile applications such as Foreflight [8], or internet sites such as the National Oceanic and Atmospheric Administration and National Weather Service Aviation Weather Center website (hereafter referred to as the “AWC website”) [9]. A subset of weather products available on the AWC website are the focus of this paper.

1.2. Weather Phenomena

Although there is a wide array of weather phenomena that can be hazardous to GA flight [10], this paper examines ceiling and visibility, turbulence, and icing.

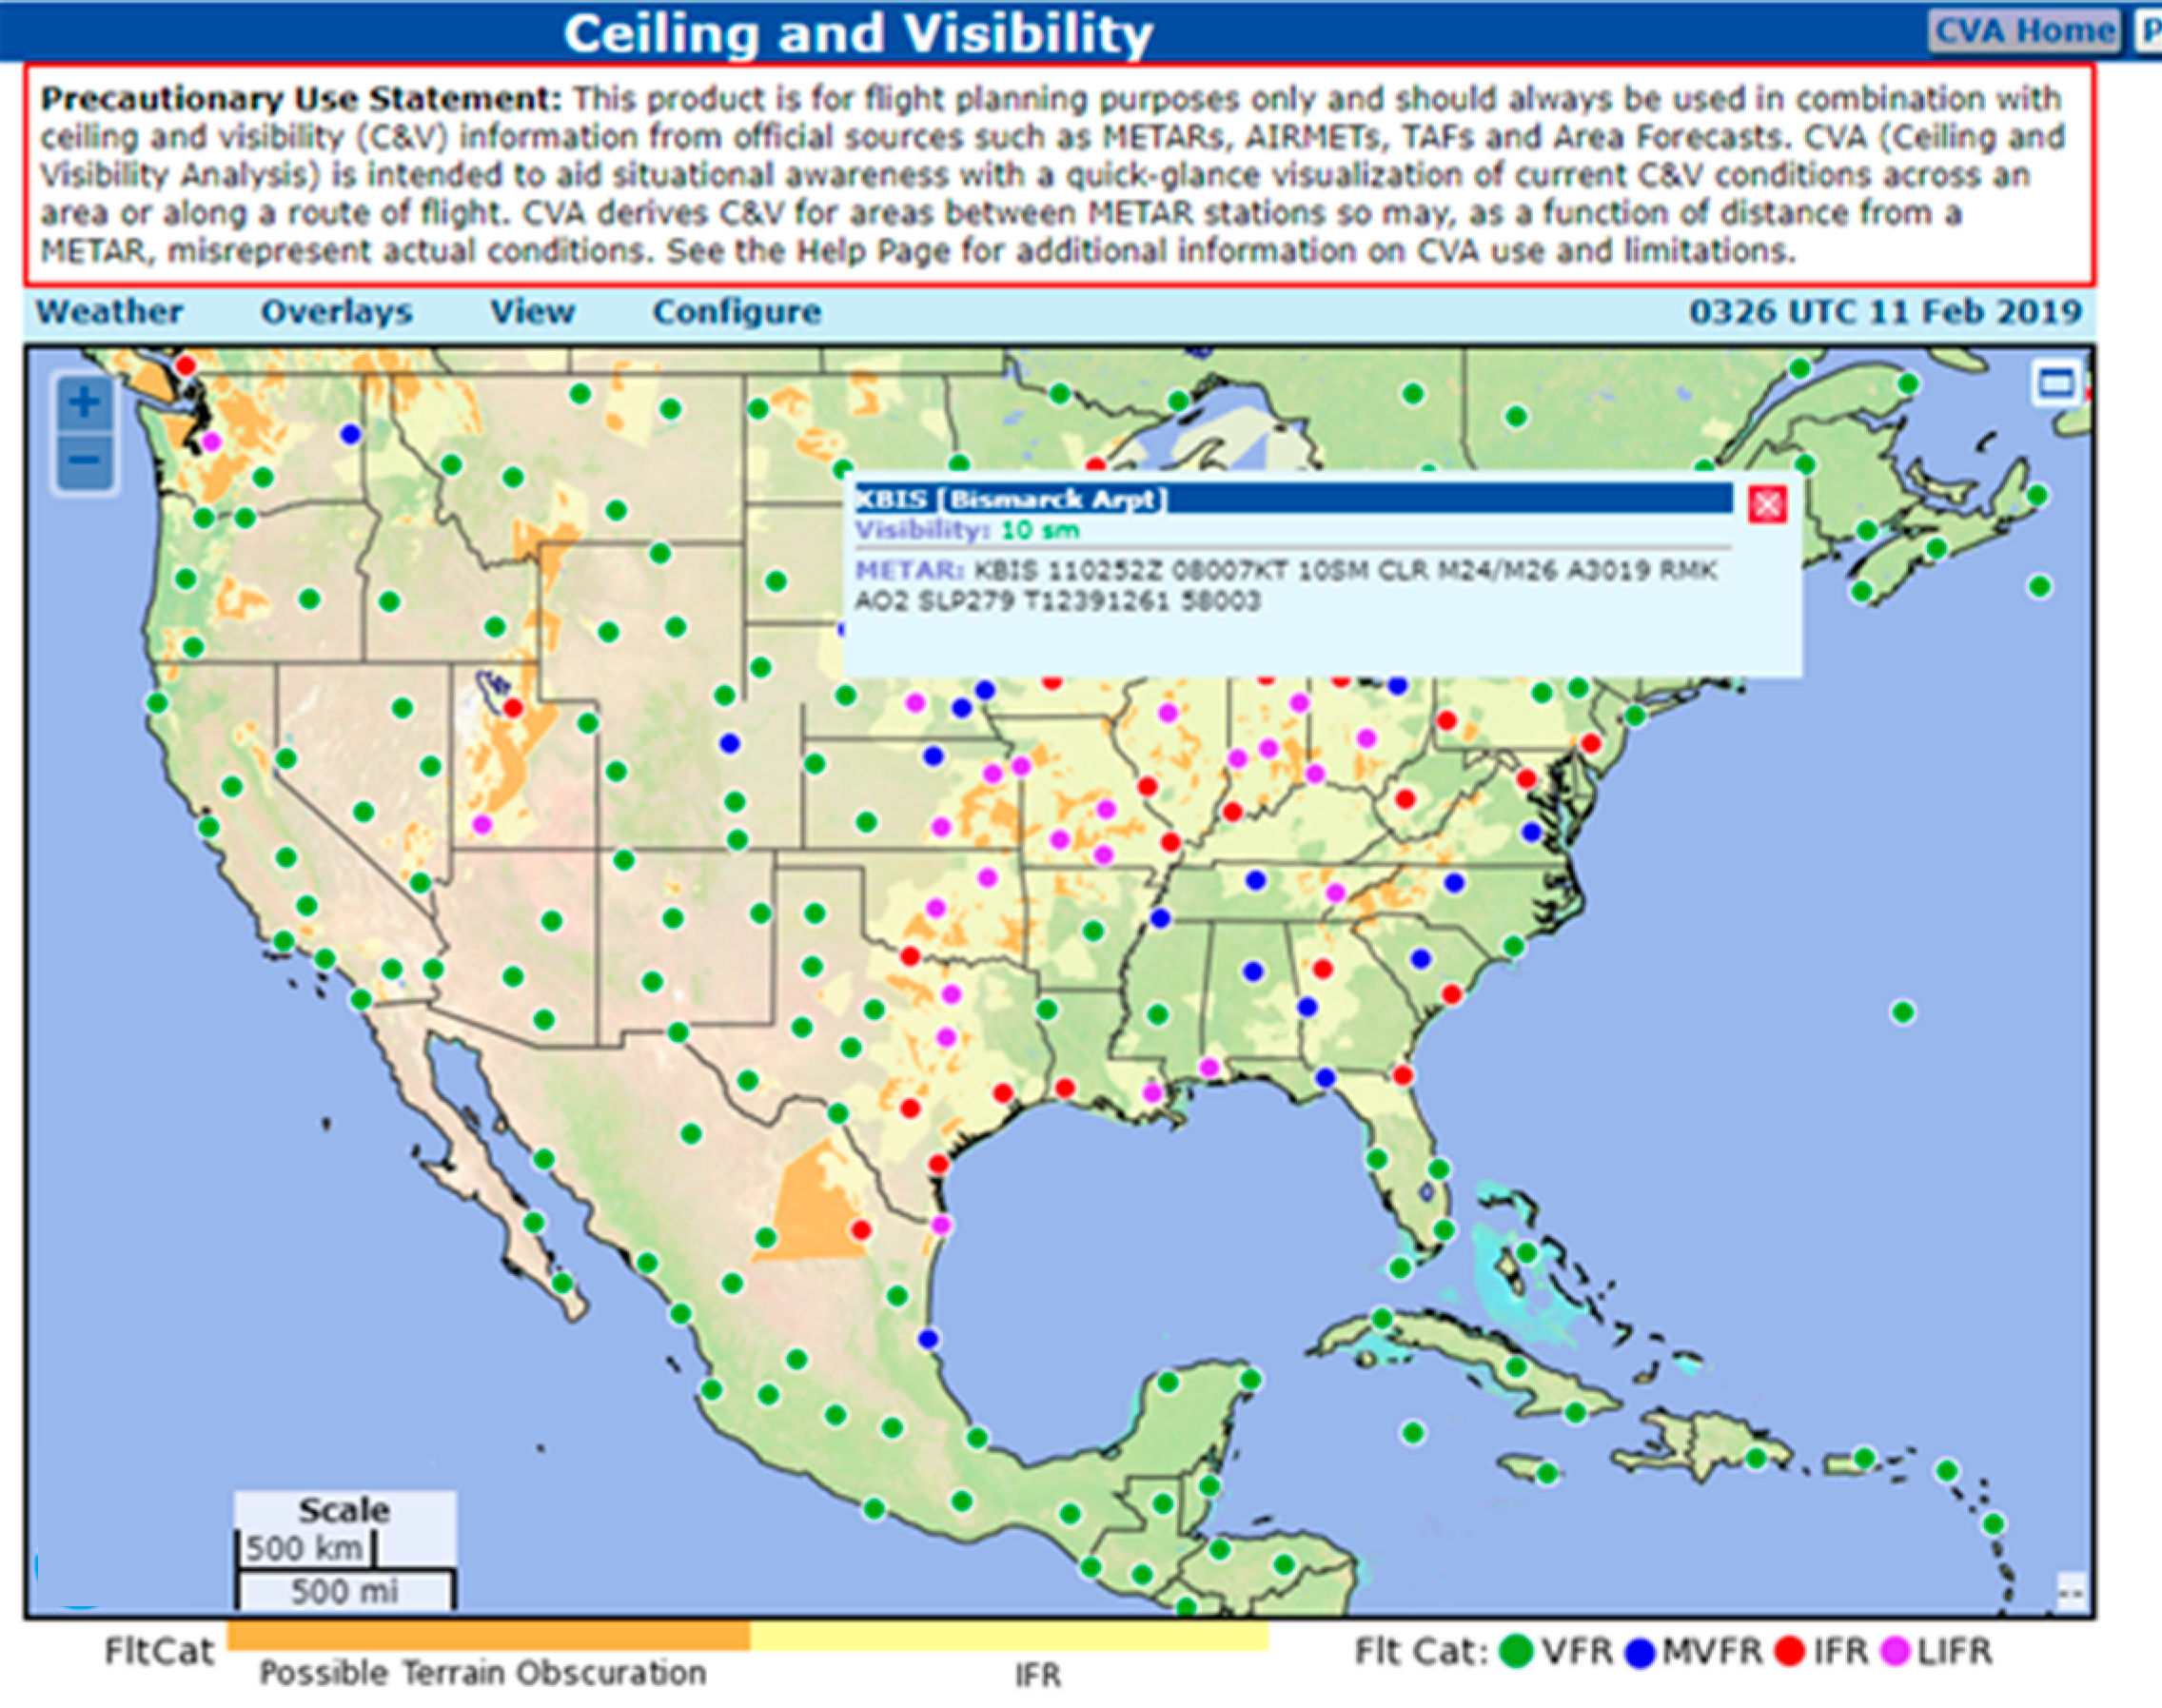
1.2.1. Ceiling and Visibility

Ceiling and visibility are vital aspects of flight operations that help determine whether flight conditions are classified as visual flight rules (VFR) or instrument flight rules (IFR). VFR during instrument meteorological conditions (IMC) account for more than 62 percent of all GA weather-related accidents and nearly 67 percent of all GA weather related fatalities [2]. Ceiling represents a vertical measure of the height of the base of the lowest layer of broken (i.e., five-eighths to seven-eighths of the sky is covered by clouds) or overcast (i.e., all of the sky cover is covered by clouds) cloud cover [6]. Cloud heights are reported in feet above ground level (AGL). Visibility represents the greatest horizontal distance that “prominent objects can be viewed with the naked eye” [6]. Minimum ceiling and visibility requirements for VFR operations vary by airspace classification. Operating in conditions that violate these minimums can place pilots in situations where they may be unable to see and avoid aircraft, terrain, or other obstructions. Aviation weather products that display visibility include the Ceiling and Visibility Analysis (CVA) and G-AIRMET Sierra. It should be noted that since the time of this research, the AWC discontinued CVA and replaced it with a different product based on the Localized Model Output Statics Model Program (LAMP). However, since the display formats of both products are very similar, the impact on product interpretability remains unchanged.
Consider the CVA product shown in Figure 1 [11], which was developed by the National Center for Atmospheric Research (NCAR), the CVA aids pilots’ situational awareness by providing a quick-glance visualization of current ceiling and visibility conditions in their area and along their route of flight. Information on the CVA is automatically generated based upon data gathered from approximately 1650 meteorological aerodrome report (METAR) sites across the United States [6]. CVA derives potential ceiling and visibility conditions for areas between METAR stations. However, because of the variability of weather systems, conditions present on the CVA may not represent actual conditions in any given area. The base for the display of the CVA is a map of the United States with overlaying dots representing significant airports. The color of each dot corresponds to the flight category of the weather present on that airport’s METAR [11,12] (pp. 526–532).

1.2.2. Turbulence

Turbulence is defined as the irregular motion of an aircraft in flight especially when characterized by rapid up-and-down motions caused by rapid variation of atmospheric wind velocities [13]. Between 2014 and 2018, turbulence contributed to ten GA accidents, resulting in four fatalities [2]. Turbulence differs in type (e.g., clear air turbulence, mountain wave turbulence, convectively induced turbulence, or mechanical turbulence) as well as severity (light, moderate, severe, or extreme) [6,14]. Light turbulence entails air movements that result in slight momentary erratic changes in altitude or attitude. Extreme turbulence produces forces capable of causing structural damage to large commercial airliners. Pilot reports (PIREPs) of severe-or-greater turbulence encounters average approximately 5500 per year [15] (pp. 268–287). Examples of weather products that display turbulence are the more traditional G-AIRMET Tango and the automated Graphical Turbulence Guidance (Figure 2 [16]).
The Graphical Turbulence Guidance (GTG) is an automated weather product for forecasting mid- and upper-level turbulence. The GTG employs an ensemble average of multiple turbulence diagnostics to arrive at an optimum combination, which can, then, be applied to a numerical model, such as the Rapid Refresh Model (RAP) [17]. Turbulent intensity, measured in eddy dissipation rate (EDR), is indicated by a color bar, while the impact on the aircraft is determined by selecting the aircraft type (light, moderate, or heavy) [6,16]. At the time of the research, the type of aircraft was not a selectable parameter.

1.2.3. Icing

Icing commonly occurs when aircraft are operating at an altitude above the freezing level in the presence of visible moisture. Buildup of ice on an aircraft’s wings can result in a loss of lift, making it difficult to maintain attitude. Icing is particularly hazardous to GA pilots because they often operate small aircraft with no anti-icing or de-icing capabilities. Icing caused fifteen GA accidents between 2014 and 2020, resulting in five fatalities [2]. Examples of weather products that display icing information are the Current Icing Product and Forecast Icing Potential (CIP/FIP), shown in Figure 3 [18]. The CIP/FIP is a weather product designed for forecasting and diagnosing icing conditions. The CIP/FIP combines satellite, radar, surface, lightning, and PIREPs with a numerical model to create an hourly forecast of the potential for icing and supercooled large droplets (SLD, droplet diameters higher than 50 μm) [19].
Finally, G-AIRMETs are HITL issued by the Aviation Weather Center (AWC) every 6 h and updated and amended as necessary. G-AIRMETs take the three traditional AIRMETs (Sierra, Tango, and Zulu) and further break them up into eight separate weather hazards (ceiling and visibility, mountain obscuration, turbulence high, turbulence low, low-level wind shear (LLWS), surface winds (SW), icing, and freezing level) [6,19] (e.g., G-AIRMET Sierra, Figure 4). With the exception of freezing level, all G-AIRMETs use polygons with information boxes to identify the hazards. The freezing level chart uses isopleths of constant freezing level and polygons to indicate regions with multiple freezing levels [6,19].
Within the three weather phenomena (visibility, turbulence, and icing) and the six weather products under inspection (CVA, CIP/FIP, GTG, G-AIRMET Tango, G-AIRMET Sierra, and G-AIRMET Zulu) automation method (human-in-the-loop or automation), is a key difference that may have implications for end users. Thus, it is important to consider how the level of automation impacts interpretability by GA pilots.

1.3. Automation

Automation is defined as “a device or system that accomplishes (partially or fully) a function that was previously, or conceivably could be, carried out (partially or fully) by a human operator” [21] (pp. 286–297). In complex situations, the use of automation can be paired with a human controller which results in a “human–automation” system. Traditionally, the development of weather products (e.g., G-AIRMETs) relied on a human-automation system, which involved a meteorologist interpreting raw weather data collected by automated systems. However, newer weather products (e.g., CVA, GTG, and CIP/FIP) now employ a fully automated weather interpretation process that requires a HITL meteorologist [6]. Many benefits of the automated approach exist. These include lowering the workload of meteorologists, increasing the efficiency of data processing, and significantly reducing the time required to generate updated weather products [22] (pp. 43–60). This enables more frequent iterations of weather products while decreasing the cost of product generation.
Despite the benefits of automation, relying on automation alone presents its own challenges. Automated systems are limited by the particular sensitivity, accuracy, and range of their sensory system [22] (pp. 43–60). For example, as previously mentioned, the CVA generates information automatically using data gathered from approximately 1650 meteorological aerodrome report (METAR) sites across the United States [6]. However, METARs only provide information about weather conditions within the area of an airport. The CVA extrapolates data from surrounding airports to derive potential ceiling and visibility conditions for areas between METAR stations, and, as the distance between METAR stations increase, the accuracy of the CVA diminishes. If a pilot is unaware of this limitation, they may make an incorrect assessment about the flight conditions they could encounter. In the event that the actual weather did not match a pilot’s expectations based on the weather product, the flight could be at risk, and the mismatch may have an additional effect of negative feedback to the pilot(s). Negative feedback from an automated system can erode the pilot’s trust in the system [23] (pp. 399–407). Even more concerning is that research indicates if one aid (e.g., weather product) is unreliable it lowers the users trust of all the aids in the system overall [24,25] (pp. 230–253, 114–128).

1.4. Experience

In addition to weather phenomenon and the automation underlying the products, another important consideration is a pilot’s experience level in interpreting weather information. The majority of weather-related accidents in aviation occur among pilots holding a private pilot’s license without an instrument rating [4,10]. These pilots are certified to fly only under visual flight rules during times of fair weather and good visibility. Private pilots have relatively limited operational weather experience as compared with pilots who have obtained an instrument rating, and therefore are authorized to fly in weather systems that limit visibility.
Some research has shown that pilots with more operational weather experience exhibit improved weather-related decision making and skill acquisition [5]. This research aligns with the cognitive psychology research that describes the process of skill acquisition as an operator’s progression from novice to intermediate, and finally expert [26,27]. As operators (in this case GA pilots) progress from novice to experts, they accumulate weather-related experiences including interpreting weather products and inflight weather experiences. These accumulated experiences should improve their skills to effectively plan and, in turn, avoid hazardous weather during flight. For example, during preflight weather planning, pilots must obtain information from several weather products to gain a holistic view of the current weather conditions and how the weather might develop during the flight. It is likely that pilots with greater flight experience can more easily interpret weather products and understand the implications for flight.
In terms of research evidence, the results are mixed. Rockwell and McCoy [28] found that pilots with high levels of experience were more efficient at evaluating weather-related information than individuals with little to no experience. Wiggins et al., [29] (pp. 162–167) found that pilots with more weather experience were able to identify necessary information and integrate that information more effectively than pilots with less weather experience. Other weather research has found little to no correlation between flight hours and aviation weather knowledge [30]. In the domain of aviation, experience is typically measured either by a pilot’s cumulative time spent operating an aircraft (flight hours) or by the certifications (private and commercial) and ratings (instrument) earned by the pilot. However, with each certification or rating acquired, a pilot must complete a practical and written examination to demonstrate they have acquired a more advanced skill set and knowledge base. Therefore, level of certification and rating may be a more appropriate means of gauging a pilot’s weather experience level. Overall, questions remain regarding the degree to which GA pilot experience level correlates with understanding weather information.

1.5. Purpose

The GA community has been the population most susceptible to weather-related aviation accidents. Gultepe et al. [5] provided an overall summary of weather parameters and their adverse impact related to aviation meteorology, which included adverse winds, ceiling/visibility, density altitude, icing, and thunderstorms. As the weather products that convey these conditions evolve, proper investigation of the effects of these product changes should be investigated. Currently, no research exists regarding interpretability of weather products that are generated entirely via automation without a meteorologist in the loop as compared with that of traditional products. Furthermore, it is also important to consider how the effectiveness of these products may differ depending on the experience level of the pilots using the products and/or the weather phenomenon the products are depicting. Therefore, the purpose of this study was to compare the interpretability of weather products for two areas of interest, i.e., type of visualization/display (traditional HITL polygons vs. model-based imagery) and type of weather phenomena (ceiling/visibility, turbulence, and ice), across a range of pilot experience levels.

2. Materials and Method

2.1. Data

Data was originally collected as part of a larger dataset in Blickensderfer et al. [30].

2.2. Participants

Recruitment of participants for this study (number of participants (n) = 204) occurred in the following two locations: a university in the southeastern United States (U.S.) and a midwestern U.S. airshow hosted by the Experimental Aircraft Association (EAA). The age of participants ranged from 18 to 66 (mean age (M age) = 22.50, standard deviation (SD) = 7.60). Participants were grouped based on their highest certification/rating achieved. All pilots fell within one of the following four groups: student (n = 41, M flight hours = 38.37, SD = 30.83, median = 35); private (n = 72, M flight hours = 128.77, SD = 118.50, median = 105); private with instrument (n = 50, M flight hours = 211.46, SD = 196.68, median = 172); and commercial with instrument (n = 41, M flight hours = 479.87, SD = 1015.22, median = 260). No commercial pilot without an instrument rating took part in the study. The study obtained approval from the Embry-Riddle Aeronautical Institutional Review Board prior to data collection. All participating pilots signed an informed consent form before taking part in the study. Each pilot at the university received $20 in base compensation for participating in the study. An additional $0.31 was provided for each correctly answered question. Researchers provided each participating pilot at the air show with a $100 gift card.

2.3. Measures

Participants were asked to complete a demographic questionnaire and the Aviation Weather Product Test [31] for this study. The demographic questionnaire contained 33 items and was administered through an online survey website (surveymonkey.com). The purpose of the demographic questionnaire was to obtain general information about the participants. This ranged from basic information (e.g., age and gender) to aviation specific information such as flight (e.g., flight training and flight hours) and meteorology experience and meteorological training (e.g., where did they receive weather training and how frequently they used aviation weather products).
The Aviation Weather Product Test contains 95 questions designed to evaluate a pilot’s ability to interpret aviation weather products used during preflight planning. Questions on both textual and graphical products hosted on the AWC website are included. As shown in Figure 5 and Figure 6 [31], all questions are multiple choice and contain 2 or 4 answer choices (a, b or a, b, c, d) per question. Each question contains only one correct answer. Test questions focus on the application of weather information. In order to ensure a high level of cognitive fidelity, the test required respondents to interpret the weather products just as they would during actual flight planning.

Product Interpretation Score

Fourteen of the original 95 multiple-choice questions were selected for the analysis in this paper. The weather products examined in this paper are classified as either model-based imagery or HITL polygons and provide information to pilots on one of three types of weather phenomena (ceiling/visibility, turbulence, or icing) (see Table 1). Each respective question asked pilots to interpret one of the weather products listed in Table 1 (CVA, GTG, CIP/FIP, G-AIRMET Sierra, G-AIRMET Tango, or G-AIRMET Ice). A percentage correct score was calculated in each category for each participant.

2.4. Procedure

Upon arriving at the study location, each participant was briefed on the study. Then, participants were given an informed consent form and asked to review the document. After the participant signed the informed consent form, individuals participating at the university were asked to sit at a desktop computer and complete the demographic questionnaire followed by the Aviation Weather Product Test. Participants recruited from the airshow completed the demographic questionnaire online, on their own personal devices. Then, airshow participants were provided a hardcopy of the Aviation Weather Test and asked to log their answer on the paper score sheet provided. No time restriction was placed on any participant. After completing the Aviation Weather Product Test, participants were debriefed, scores were calculated, and compensation was provided to the participants.

2.5. Data Analysis

To assess the differences in product interpretability across pilot experience levels, weather phenomenon type, and display type, a series of analyses were conducted using IBM SPSS Statistic (Version 24) [32].

3. Results

The descriptive statistics are shown in Table 2, Table 3, Table 4 and Table 5. A 4 × 3 × 2 mixed (between-within) analysis of variance was conducted to evaluate the impact of pilot certificate or rating (student, private, private with instrument, commercial with instrument), weather phenomena (turbulence, visibility, and icing) and display type (imagery or HITL polygon) on participants’ product interpretation scores. Twenty-seven univariate outliers were identified by inspection of a boxplot. The outliers were kept in the analysis because they did not materially affect the results, as assessed by a comparison of the results with and without the outliers. A Shapiro–Wilk’s test for normality indicated interpretation scores were not normally distributed (p < 0.05). Additionally, the Levene’s test of homogeneity of variance revealed the assumption of homogeneity of variances was violated (p < 0.001).
When assessing the three-way interaction effect, the Mauchly’s test of sphericity revealed the assumption of sphericity was met χ2(2) = 4.95, p = 0.084; the results indicated that there was not a statistically significant three-way interaction between pilot certificate or rating, weather type, and display type, Greenhouse–Geisser = 5.86, F(6, 398) = 0.48, p = 0.82, partial η2 = 0.007. Consequently, these results indicate that there is not a combined effect of pilot certificate or rating, weather type, and display type.
There was not a significant two-way interaction between experience and weather type F(2, 398) = 1.33, p = 0.248 or experience and display type F(2, 398) = 0.67, p = 0.57 (see Table 3 and Table 4).
However, there was a statistically significant two-way interaction between weather type and display type on interpretation score, F(2, 398) = 31.03, p < 0.001, partial η2 = 0.14 (see Table 5). Therefore, 14% of variance in the interpretation score can be accounted for by the combined effect of weather type and display type. There were no statistically significant simple effects of weather type and display type on visibility weather product questions, F(1, 203) = 3.789, p = 0.053. However, the results indicated there was a statistically significant simple effect of weather type and display type on turbulence weather product questions (F(1, 203) = 51.77, p < 0.001) and icing weather product questions, (F(1, 202) = 26.23, p < 0.001). This indicates that participants scored higher on model-based imagery turbulence products than HITL traditional polygon products, while scoring lower on model-based imagery icing products than HITL traditional polygon weather products (see Table 5).
Further analysis revealed, there was a significant main effect of pilot certificate and rating on the interpretation score, F(3, 199) = 3.73, p = 0.012, partial η2 = 0.05. Consequently, 5% of variance in the interpretation score can be accounted for by pilot certificate and rating. Post hoc analyses revealed that student (M = 47.65, SD = 13.61) pilots’ interpretation scores were significantly lower than private instrument rated pilots (M = 61.77, SD = 12.93, p = 0.03) and commercial instrument rated pilots (M = 65.62, SD = 14.50, p = 0.05).
Additionally, there was a significant main effect of weather type on the interpretation score, F(2, 398) = 77.48, p < 0.001, partial η2 = 0.28. Thus, 28% of variance in the interpretation score can be accounted for by weather type. Post hoc analyses revealed that pilots scored significantly higher on turbulence (M = 61.18, SD = 24.37, p < 0.001) and visibility interpretation questions (M = 63.40, SD = 32.42, p < 0.001) than on icing interpretation questions (M = 37.77, SD = 16.49).
Conversely, there was not a significant main effect of display type on the interpretation score, F(1, 199) = 117, p = 0.73, partial η2 = 0.001.
For post hoc analyses, we conducted a series of paired samples t-tests to compare product interpretation score differences between the following traditional polygon products: G-AIRMET Ice, G-AIRMET Sierra, and G-AIRMET Tango. A boxplot inspection revealed seven outliers, but as all outliers did not materially affect results, all were retained in the analysis. Normal Q-Q plot results indicated all comparison differences were normally distributed. Three paired samples t-tests were run with the Bonferoni adjusted alpha level of 0.008, and results indicated participants scored statistically significantly higher on G-AIRMET Sierra (M = 67.98, SD = 46.77) than G-AIRMET Tango ((M = 53.36 and SD = 30.64), 14.71, 95% CI 7.914 and 21.50, t(203) = 4.27, p < 0.001, d = 0.299), and G-AIRMET Ice ((M = 47.54 and SD = 30.16), 20.59, 95% CI 13.54, 27.63, t(203) = 5.76, p < 0.001, d = 0.403) product interpretation questions. However, there was no significant difference in score between G-AIRMET Tango and G-AIRMET Ice, 5.89, 95% CI 0.28 and 11.48, t(203) = 2.07, p = 0.039, d = 0.007.
A final series of post hoc paired samples t-tests compared product interpretation score differences among the following model-based imagery products: GTG, CVA, and CIP/FIP. The boxplot inspection revealed no outliers, and normal Q-Q plot results indicated all comparison differences were normally distributed. Three paired samples t-tests were run with the adjusted alpha level of 0.0083, and results indicated participants scored statistically significantly higher on GTG (M = 72.66 and SD = 31.13) than CVA ((M = 61.08 and SD = 37.40), 11.76, 95% CI 6.40 and 17.13, t(203) = 4.32, p < 0.001, d = 0.303) and CIP/FIP ((M = 32.88 and SD = 22.51), 39.78, 95% CI 34.95 and 44.60, t(202) = 16.25, p < 0.001, d = 1.141) product interpretation. Participants also scored statistically significantly higher on CVA than on CIP/FIP (28.20, 95% CI 22.50 and 33.90, t(202) = 9.75, p < 0.001, d = 0.684).

4. Discussion

For decades, weather accidents have been a major concern in the GA community. Recent research indicates that GA pilots have difficulty interpreting weather products that are imperative for flight planning and decision making [33]. Considering the complexity of weather products and theory, this finding is not particularly surprising. Adding to the complexity is the availability of new, automatically generated products. Therefore, it is important to examine the effect that evolving product display types have on the end users (in this study, the GA pilots).
When assessing display interpretation scores by weather type, the results indicated that weather type had a significant effect on interpretation scores. Overall, participants scored lower on icing product interpretation questions than on visibility and turbulence interpretation questions. However, this pattern of results changed depending on whether or not the products used traditional polygons versus the newer numerical model-based images to identify hazard areas. That is, for traditional products, participants scored higher on visibility (G-Airmet Sierra) than turbulence (G-Airmet Tango) and icing (G-Airmet Ice), and participants scored similarly on turbulence and icing. In contrast, among the automated model-based image products, interpretation scores were highest on turbulence (GTG), followed by visibility (CVA), and icing (CIP/FIP), respectively. The model-based image product results are particularly interesting, considering that ceiling and visibility phenomena are associated with the majority of weather-related GA accidents [9].
Looking further at the effects of product display type, the results revealed that although there was no significant effect of display type (model images vs. traditional polygons) overall on interpretation score (indicating that the pilots interpreted the traditional and the model-based images with about the same level of accuracy), again, the combined effect of weather product type and type of display changed things. The combined effect was found in icing and turbulence type products, where participants scored higher on the model-based turbulence product (GTG) than the traditional polygon-based weather product (G-AIRMET Tango), but lower on the model-based images of icing (CIP/FIP) than on the traditional polygon-based icing product (G-AIRMET Ice). These results suggest that employing model-based images when generating weather products has mixed results. While employing model-based images may result in easier product interpretation in one application (turbulence), it may have no significant impact in another application (visibility), and model-based images may make interpretation more difficult in another context (icing).
Results from this study indicate that pilot experience, in terms of certificate/rating, had a significant effect on weather product interpretation scores, with student pilots scoring significantly lower than private with instrument and commercial with instrument rated pilots. In other words, the capability for private pilots without instrument ratings to interpret these weather products was at a level similar to student pilots. Furthermore, the results indicate that the weather products in this study are the least effective for the very pilots who can only fly VFR (i.e., low hour, private pilots without instrument). Conceivably, private pilots may not show substantial increases in their knowledge of weather topics and products before earning an instrument rating and beyond. These results may provide some insight into the GA weather accident rate, where the primary demographic is non-instrument rated private pilots [2].
Another study [31] examined weather product interpretability using a sample of GA pilots with higher flight hours as compared with the pilots in the current study. Although the interpretation scores for those weather products appear slightly higher than the current study, the interpretation scores are still moderate at best. Taken together, while a pilot may have acquired substantial aviation experience in terms of flight hours alone does not equate to aviation weather experience [33]. Understanding the relationship between pilots’ aviation experiences versus aviation weather experiences is crucial. There are very few regulations that guide aviation weather training protocols, and as a result, aviation weather training can vary dramatically depending on the flight instructor and pilot preference.
It is important to consider whether the differences in the interpretation scores reported in this study are due to factors inherent to particular weather phenomena, the display usability, or other extraneous variables. First, the weather products in this examined in this study employ two-dimensional (2D) images/symbols to display three-dimensional (3D) dynamic weather conditions. It may be that certain weather phenomena (such as turbulence) provide a closer conceptual match to a 2D display than do other products (such as fog). Another explanation to consider could be the difficulty of weather theory associated with the weather phenomena. Perhaps icing and the theory underlying icing are inherently more difficult concepts for pilots to understand as compared with turbulence and visibility. Lastly, usability of the display design likely plays a role in the current results. All of the products in this study are graphical in nature, and yet other usability factors may exist. The difference in scores may be due to varying levels of usability for each product and not due to weather type or product generation at all. While usability plays a role in all display interpretation, it is difficult (if even possible) to isolate that variable in the case of weather product interpretation.
Some limitations of this study exist. First, this study focuses on preflight weather product interpretation, however, previous research has indicated that automatic dependent surveillance-broadcast (ADS-B) assists with inflight situational awareness and can facilitate access to inflight weather updates, therefore, future research should include an assessment of inflight weather information interpretability. Additionally, the participants were young, relatively low-hour pilots, which limits the generalizability. Another limitation is the number of items in the weather product interpretation measure. At the most granular level, the weather products had four or fewer questions each, which limits the reliability. Future research should include a more robust set of measures. Further consideration should also address how to separate out possible effects of product usability from other factors impacting product interpretability.

5. Conclusions

In summation, the purpose of this study was to compare the interpretability of weather products for two areas of interest, i.e., product display type (traditional human-in-the-loop polygons or model-based imagery) and type of weather phenomena (ceiling/visibility, turbulence, and ice), across a range of pilot experience levels. The results revealed a combined effect of display type and weather type (F(2, 398) = 31.03, p < 0.001, partial η2 = 0.14), as well as significant main effects on product interpretation scores for weather type (F(2, 398) = 77.48, p < 0.001, partial η2 = 0.28) (M visibility = 63.40 and SD = 32.42 and M icing = 37.77, SD = 16.49) and pilot experience (F(3, 199) = 3.73, p = 0.012, partial η2 = 0.05) (M student pilots = 47.65, SD = 13.61 and M commercial instrument rated pilots 65.62, SD = 14.5). These results support the claim there is a very little difference in interpretability between the selected model-based imagery products and the human-in-the-loop polygon products. Future research should expand the investigation of weather product display types to include the usability factor and inflight weather product interpretability.

Author Contributions

Conceptualization, J.M.K., T.G., and B.B.; methodology, J.M.K. and B.B.; software, J.M.K.; validation, J.M.K., T.G., J.L.K., and B.B.; formal analysis, J.M.K.; investigation, J.M.K., T.G., and B.B.; resources, J.M.K., T.G., J.L.K., and B.B.; data curation, J.M.K., J.L.K., and B.B.; writing—original draft preparation, J.M.K., J.L.K., and B.B.; writing—review and editing, J.M.K., B.B., J.L.K., and T.G.; visualization, J.L.K.; supervision, J.M.K., and B.B.; project administration, B.B.; funding acquisition, B.B. and T.G. All authors have read and agreed to the published version of the manuscript.

Funding

This research was funded by FAA, grant number 14-G-010.

Institutional Review Board Statement

The study was conducted according to the guidelines of the Declaration of Helsinki and approved by the Institutional Review Board of Embry-Riddle Aeronautical University on 27 May 2016 (16-047).

Informed Consent Statement

Informed consent was obtained from all subjects involved in the study.

Data Availability Statement

No new data were created or analyzed in this study. Data sharing is not applicable to this article.

Acknowledgments

The views presented in this paper are those of the authors and do not represent official views of ERAU or the FAA. A portion of this data was presented at the Human Factors and Ergonomics Society 2017 Annual meeting. The authors wish to thank Ian Johnson and Gary Pokodner of the FAA Weather Technology in the Cockpit program of the Aviation Weather Division for their support of our research. In addition, we thank all the GA pilots who participated in this research for allowing us to use their data.

Conflicts of Interest

The authors declare no conflict of interest.

References

  1. Eick, D. Turbulence related Accidents & Incidents. Available online: https://ral.ucar.edu/sites/default/files/public/events/2014/turbulence-impact-mitigation-workshop-2/docs/eick-turbulencerelatedaccidents.pdf (accessed on 30 December 2020).
  2. Aircraft Owners and Pilots Association. Nall Report. AOPA, 2020. Available online: https://www.aopa.org/training-and-safety/air-safety-institute/accident-analysis/joseph-t-nall-report/nall-report-figure-view?category=all&year=2017&condition=all&report=true (accessed on 19 January 2021).
  3. Lanicci, J.; Halperin, D.; Shappell, S.; Hackworth, C.; Holcomb, K.; Bazargan, M.; Iden, R. General Aviation Weather Encounter Case Studies; Aerospace Medicine Technical Report DOT/FAA/AM-12/11; Office of Aerospace Medicine: Washington, DC, USA, 2012. [Google Scholar]
  4. Aviation Safety Information Analysis and Sharing. Weather—Related Aviation Accident Study 2003–2007. Federal Aviation Administration, 2010. Available online: https://www.asias.faa.gov/i/studies/2003-2007weatherrelatedaviationaccidentstudy.pdf (accessed on 18 January 2021).
  5. Gultepe, I.; Wayne, F.F. Aviation Meteorology: Observations and Models. Introduction. Pure Appl. Geophys. 2019, 176, 1863–1867. [Google Scholar] [CrossRef] [Green Version]
  6. Federal Aviation Administration. Advisory Circular 00-45H, Change 2, Aviation Weather Services; 2019. Available online: https://www.faa.gov/documentLibrary/media/Advisory_Circular/AC_00-45H_CHG_2.pdf (accessed on 2 December 2020).
  7. Mosher, F.R. Aviation Weather Forecasts Beyond Today. In Proceedings of the 17th Conference on Aviation, Range, and Aerospace Meteorology. In Proceedings of the 95th Annual Meeting of the American Meteorological Society, Phoenix, AZ, USA, 4−8 January 2015; Available online: https://ams.confex.com/ams/95Annual/webprogram/Paper257969.html (accessed on 2 December 2020).
  8. Foreflight. Mobile Application Software. (Version 11.6). Boeing: Chicago, IL, USA. Available online: https://foreflight.com/ (accessed on 2 December 2020).
  9. Aviation Weather Center. Available online: https://www.aviationweather.gov/ (accessed on 2 December 2020).
  10. Fultz, A.J.; Ashley, W.S. Fatal weather-related general aviation accidents in the United States. Phys. Geogr. 2016. [Google Scholar] [CrossRef] [Green Version]
  11. Aviation Weather Center. Ceiling and Visibility; National Oceanic and Atmospheric Administration & National Weather Service: Washington, DC, USA, 2019. Available online: https://aviationweather.cp.ncep.noaa.gov/cva (accessed on 11 February 2019).
  12. Herzegh, P.; Wiener, G.; Bateman, R.; Cowie, J.; Black, J. Data fusion enables better recognition of ceiling and visibility hazards in aviation. Bull. Am. Meteorol. Soc. 2015, 96, 526–532. [Google Scholar] [CrossRef]
  13. American Meteorological Society. Cited 2020: Turbulence. Glossary of Meteorology. Available online: https://glossary.ametsoc.org/wiki/Aircraft_turbulence (accessed on 18 January 2021).
  14. Federal Aviation Administration. Advisory Circular 00-6B, Aviation Weather. 2016. Available online: https://www.faa.gov/documentlibrary/media/advisory_circular/ac_00-6b.pdf (accessed on 18 January 2021).
  15. Sharman, R.; Tebaldi, C.; Wiener, G.; Wolff, J. An integrated approach to mid-and upper-level turbulence forecasting. Weather Forecast. 2006, 21, 268–287. [Google Scholar] [CrossRef]
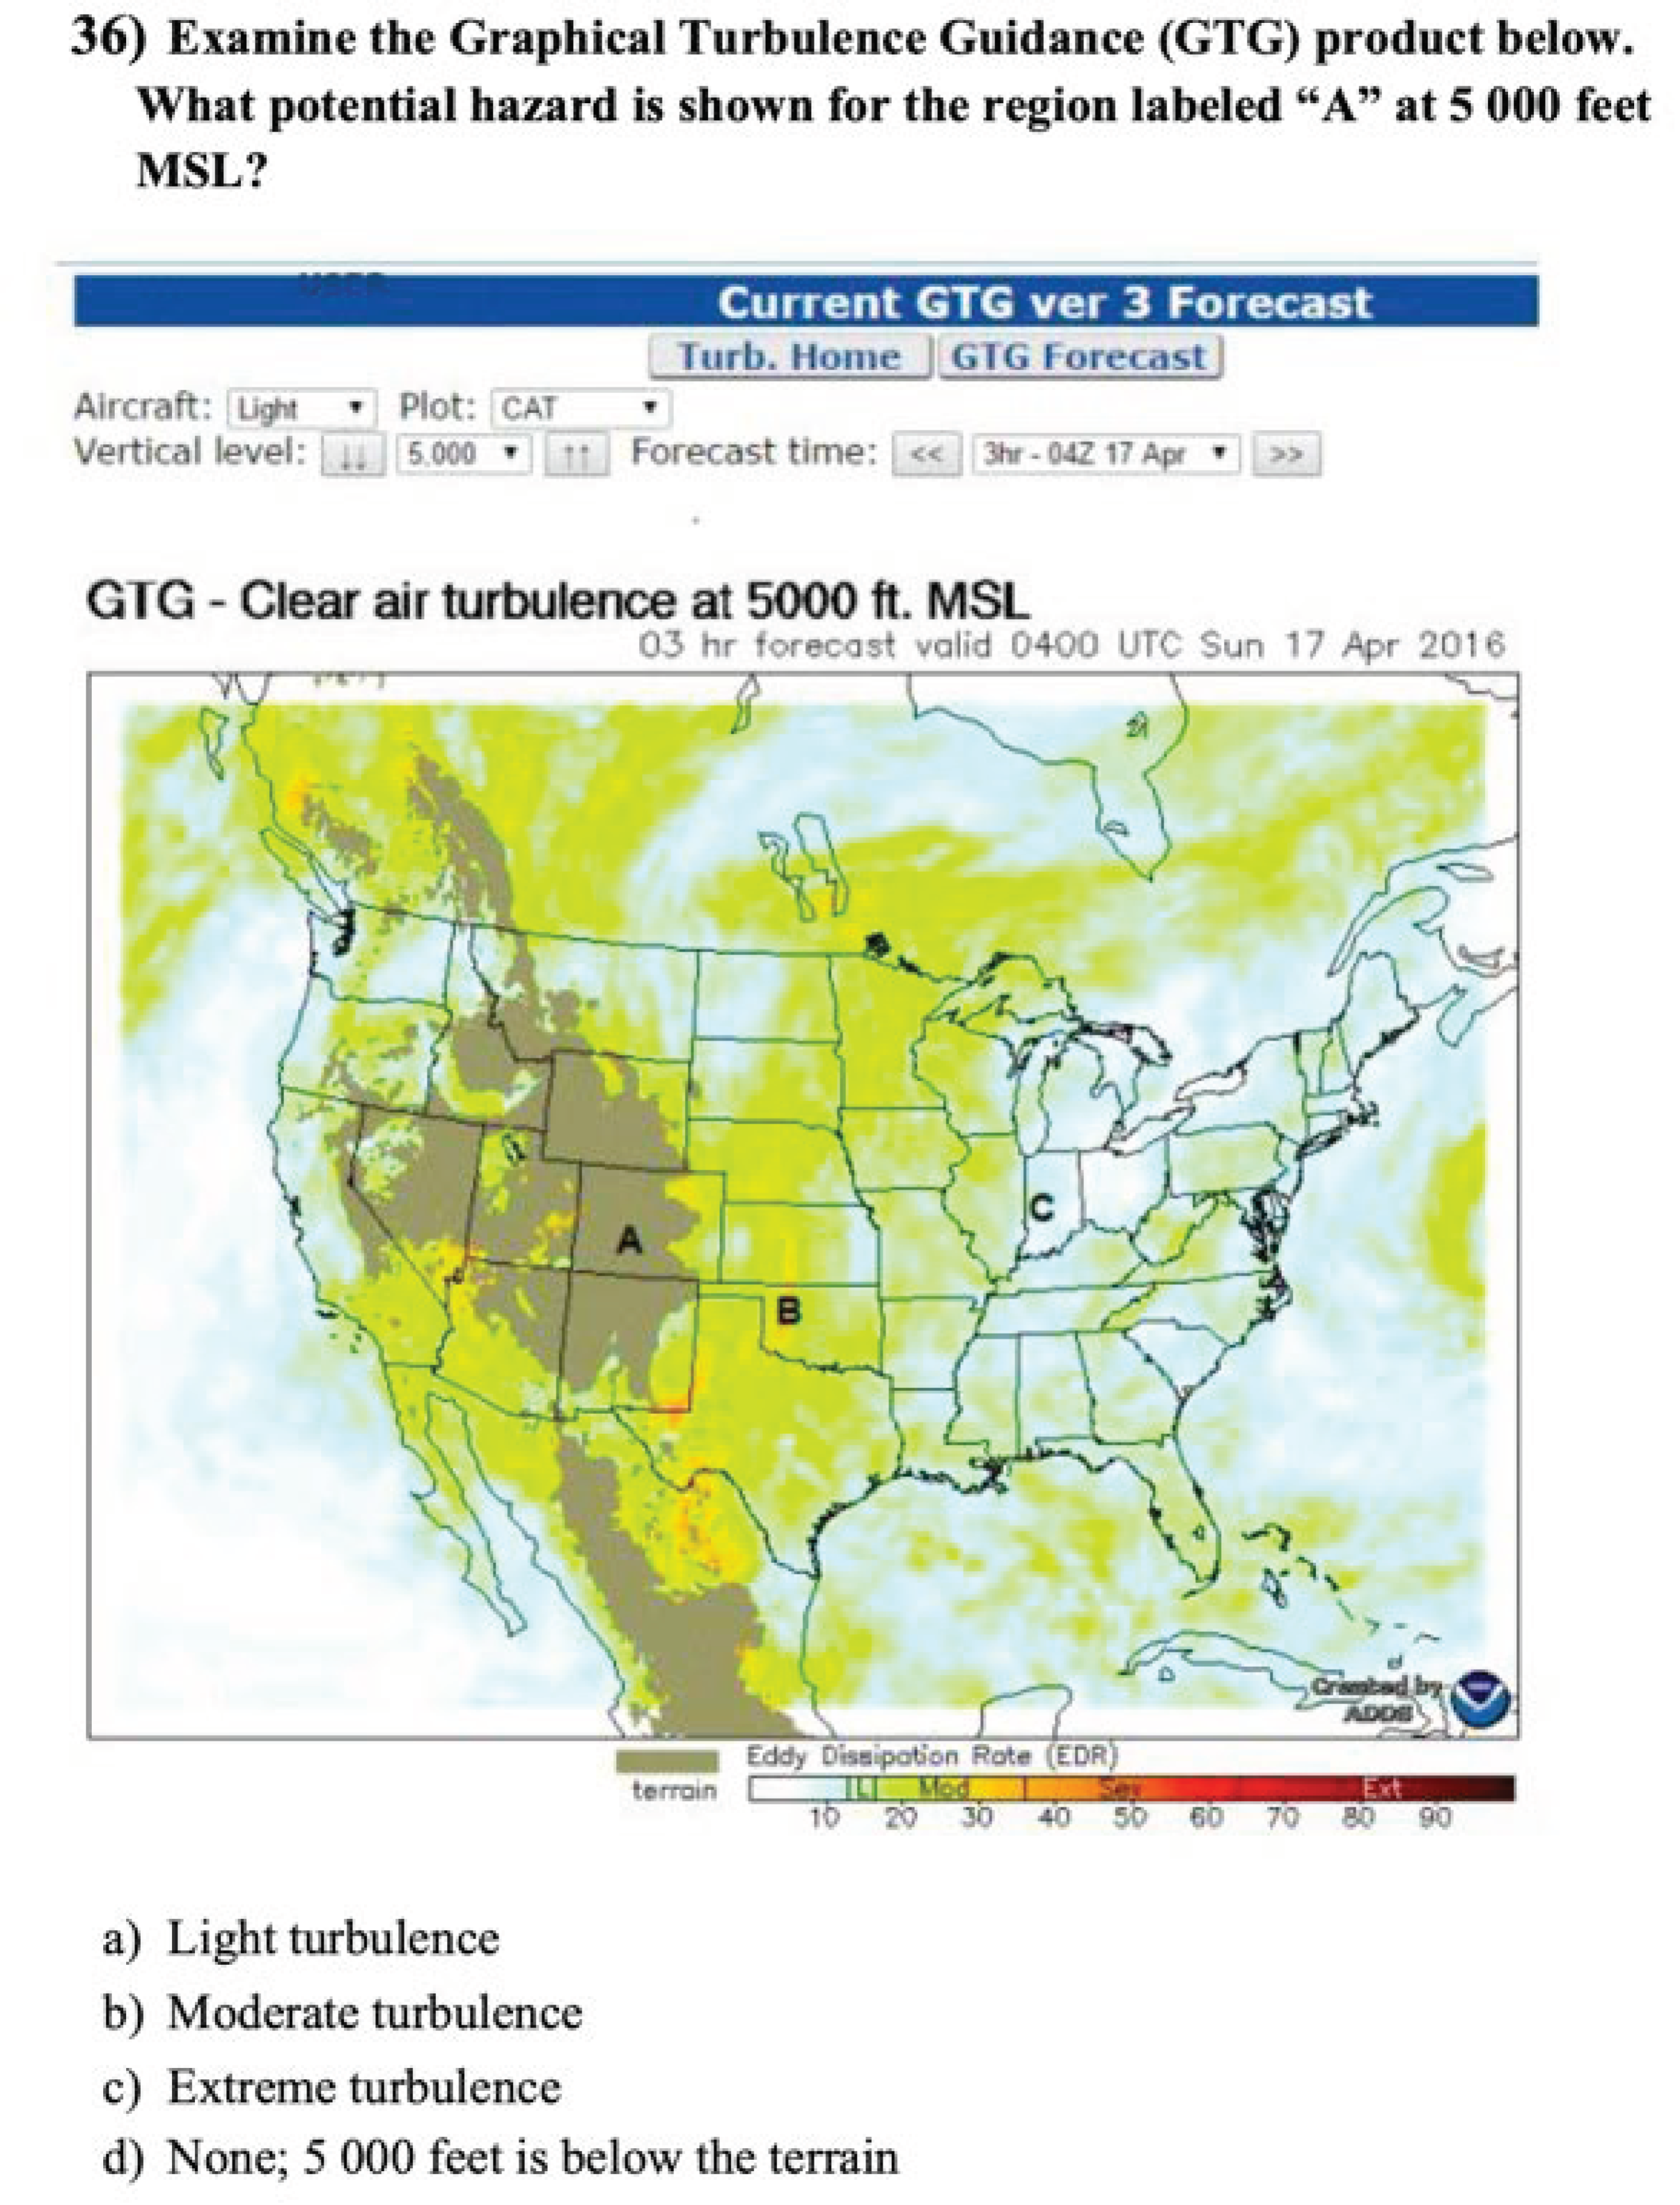
  16. Aviation Weather Center. Current GTG Forecast; National Oceanic and Atmospheric Administration & National Weather Service: Washington, DC, USA, 2021. Available online: https://www.aviationweather.gov/turbulence/gtg (accessed on 18 January 2021).
  17. Muñoz-Esparza, D.; Sharman, R. An Improved Algorithm for Low-Level Turbulence Forecasting. J. Appl. Meteor. Climatol. 2018, 57, 1249–1263. [Google Scholar] [CrossRef]
  18. Aviation Weather Center. CIP and FIP Plots; National Oceanic and Atmospheric Administration & National Weather Service: Washington, DC, USA, 2019. Available online: https://www.aviationweather.gov/icing/fip (accessed on 11 February 2019).
  19. Etherton, B.J.; Wandishin, M.S.; Hart, J.E.; Layne, G.J.; Leon, M.H.; Petty, M.A. Assessment of the Current Icing Product (CIP) and Forecast Icing Product (FIP) Version 1.1; United States National Oceanic and Atmospheric Administration, Earth System Research Laboratory: Boulder, CO, USA, 2014. [Google Scholar] [CrossRef]
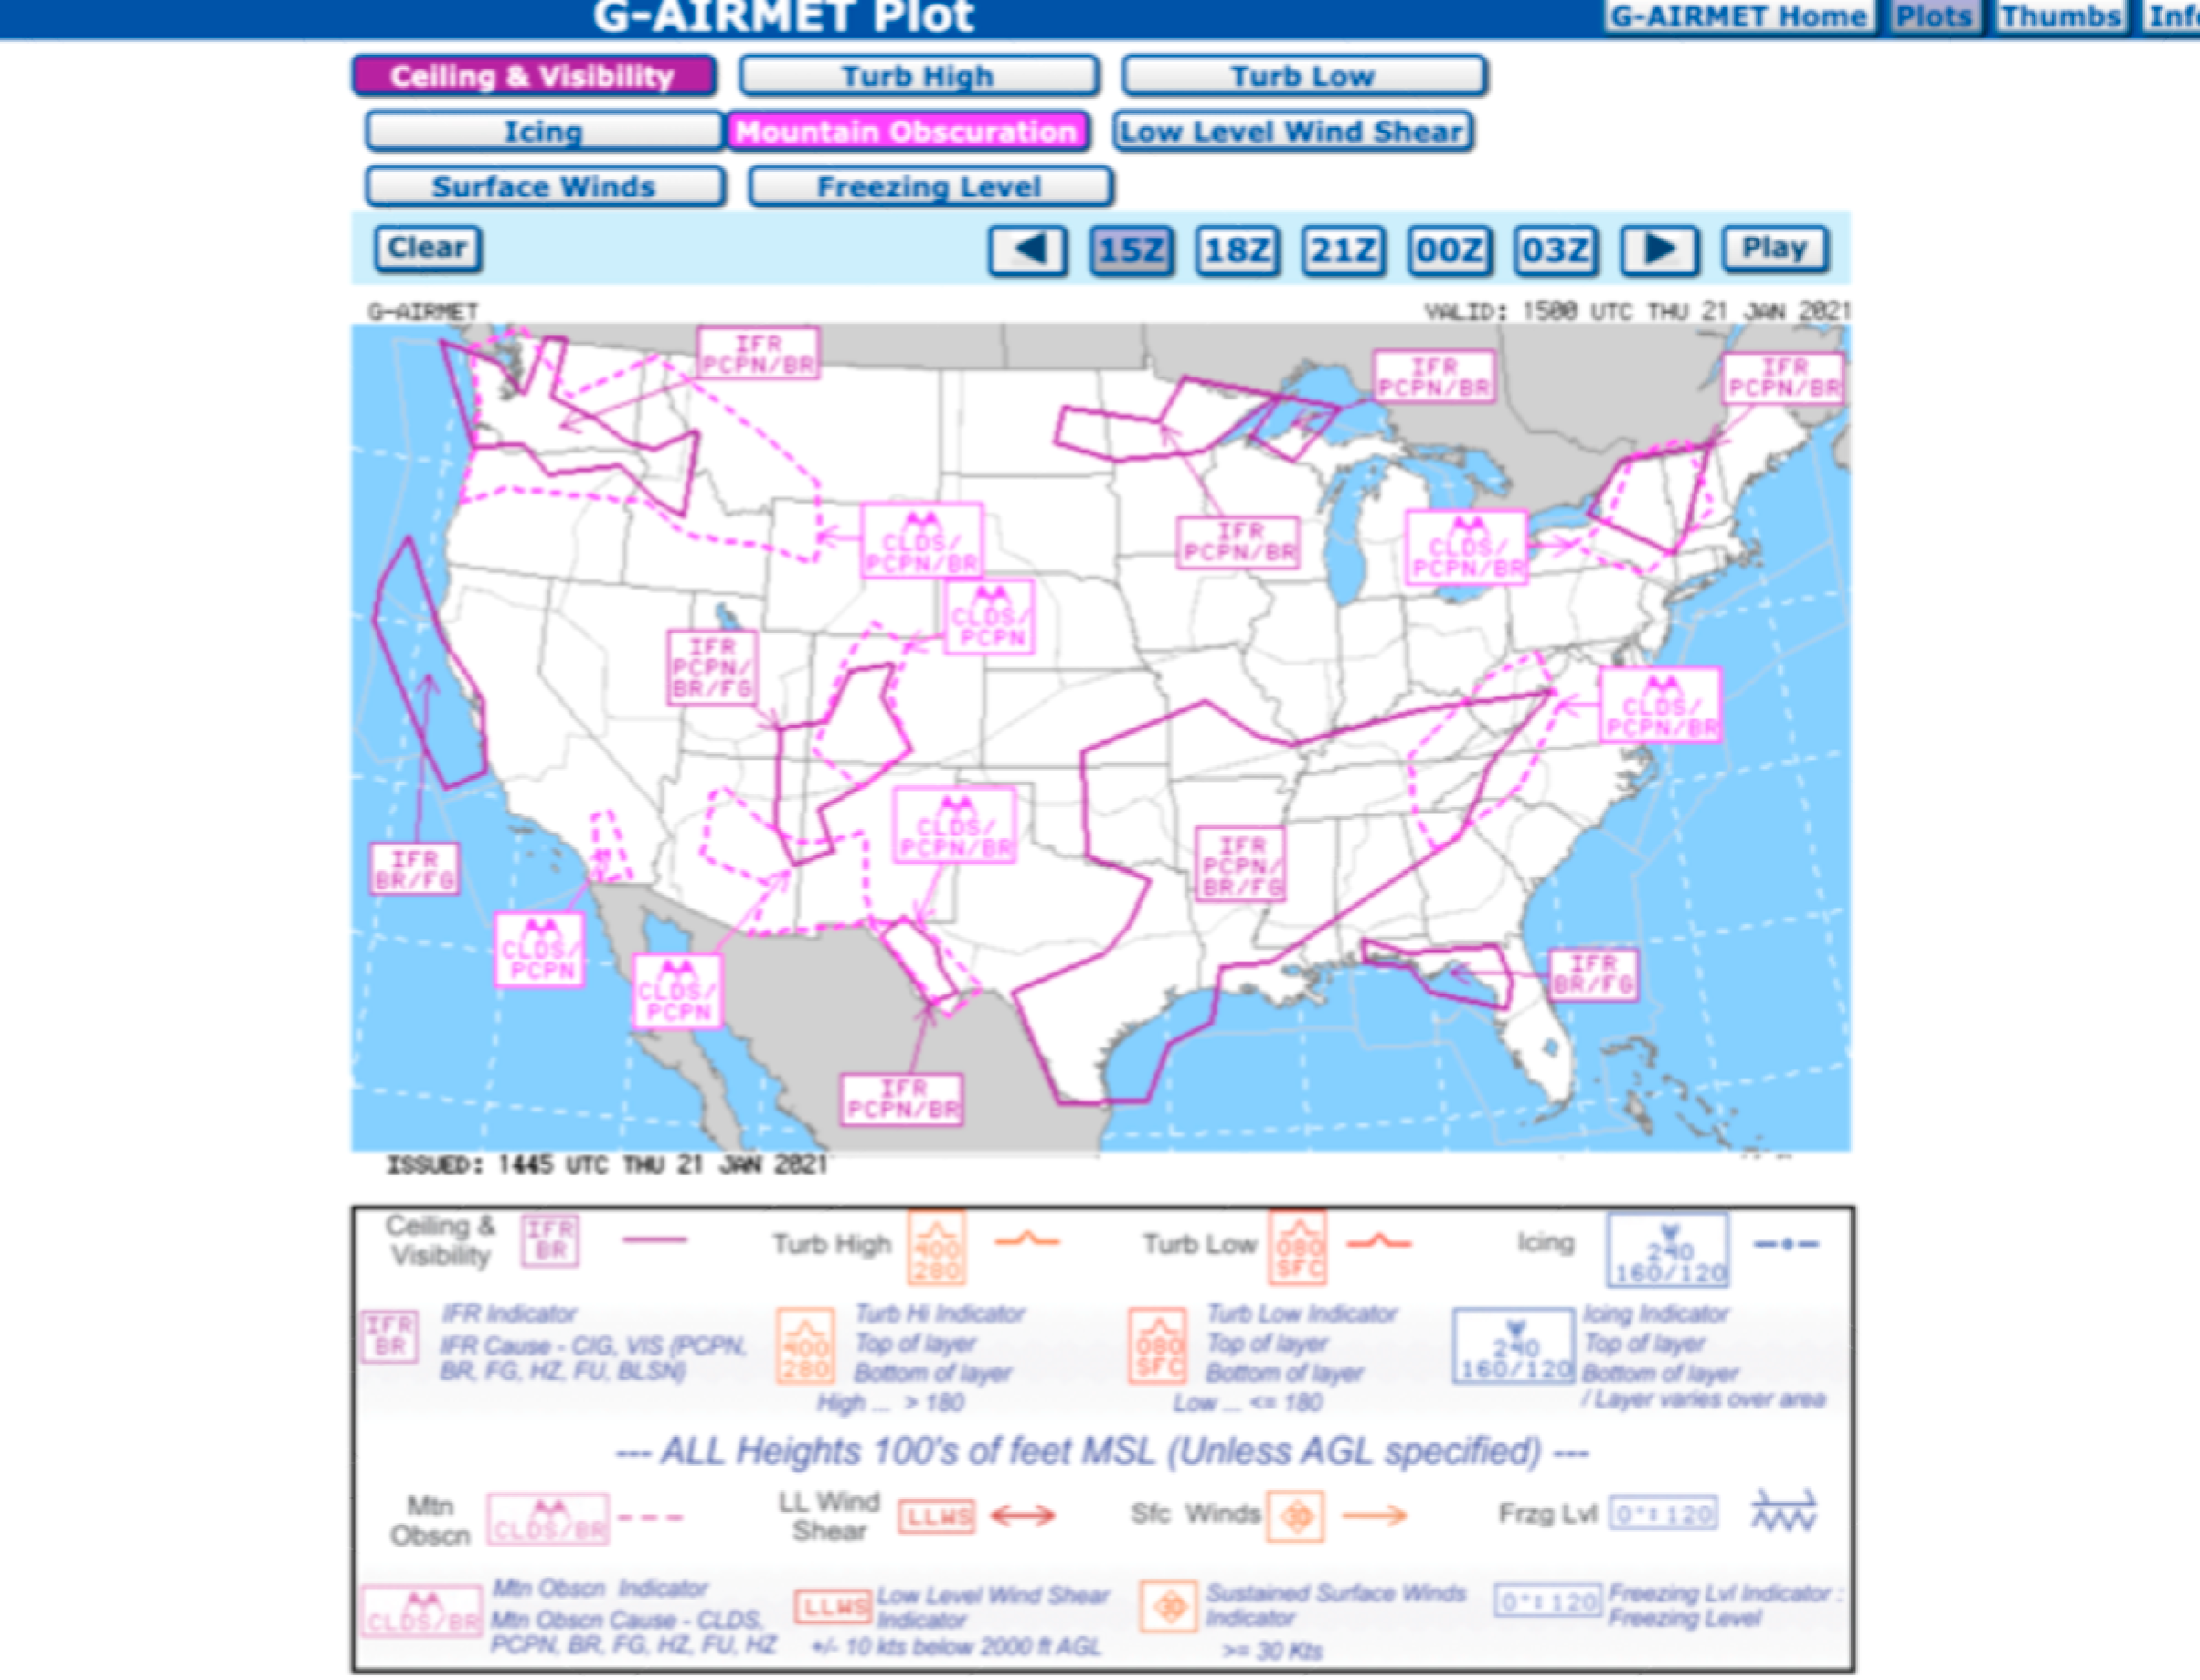
  20. Aviation Weather Center. G-AIRMET Plot; National Oceanic and Atmospheric Administration & National Weather Service: Washington, DC, USA, 2021. Available online: https://www.aviationweather.gov/gairmet (accessed on 18 January 2021).
  21. Parasuraman, R.; Sheridan, T.B.; Wickens, C.D. A model for types and levels of human interaction with automation. IEEE Trans. Syst. Man Cybern. Part A Syst. Hum. 2000, 30, 286–297. [Google Scholar] [CrossRef] [PubMed] [Green Version]
  22. Ortiz, Y.; Guinn, T.; King, J.; Thomas, R.; Blickensderfer, B. The role of automation in aviation weather: Product development and general aviation pilot performance. In Human Performance in Automated and Autonomous Systems: Emerging Issues and Practical Perspectives, 1st ed.; Mouloua, M., Hancock, P., Eds.; CRC Press: Boca Raton, FL, USA, 2019; pp. 43–60. [Google Scholar] [CrossRef]
  23. Chen, W.; Zhao, L.; Tan, D.; Wei, Z.; Xu, K.; Jiang, Y. Human–machine shared control for lane departure assistance based on hybrid system theory. Control Eng. Pract. 2019, 84, 399–407. [Google Scholar] [CrossRef]
  24. Parasuraman, R.; Riley, V. Humans and automation: Use, misuse, disuse, abuse. Hum. Factors 1997, 39, 230–253. [Google Scholar] [CrossRef]
  25. Keller, D.; Rice, S. System-wide versus component-specific trust using multiple aids. J. Gen. Psychol. 2009, 137, 114–128. [Google Scholar] [CrossRef] [PubMed]
  26. Anderson, J.R. Rules of the Mind; Psychology Press: New York, NY, USA, 1993. [Google Scholar]
  27. Patel, V.L.; Groen, G.J.; Norman, G.R. Effects of conventional and problem-based medical curricula on problem solving. Acad. Med. 1991, 66, 380–389. [Google Scholar] [CrossRef] [PubMed]
  28. Rockwell, T.H.; McCoy, C.E. General Aviation Pilot Error: A Study of Pilot Strategies in Computer Simulated Adverse Weather Scenarios; United States Department of Transportation: Cambridge, MA, USA, 1988. [Google Scholar]
  29. Wiggins, M.W.; O’hare, D. Expertise in aeronautical weather-related decision making: A cross-sectional analysis of general aviation pilots. J. Exp. Psychol. Appl. 1995, 1, 305. [Google Scholar] [CrossRef]
  30. Blickensderfer, B.L.; Guinn, T.A.; Lanicci, J.M.; Ortiz, Y.; King, J.M.; Thomas, R.L.; DeFilippis, N. Interpretability of aviation weather information displays for general aviation. Aerosp. Med. Hum. Perform. 2020, 91, 318–325. [Google Scholar] [CrossRef] [PubMed]
  31. Blickensderfer, B.; Lanicci, J.; Guinn, T.; Thomas, R.; Thropp, J.; King, J.; Ortiz, Y. Aviation Weather Knowledge Questions (FAA Grant #14-G-010). Unpublished project report.
  32. IBM SPSS Statistics for Windows. Computer software. (Version 24). IBM: Armonk, NY, USA. Available online: https://www.ibm.com/products/spss-statistics?lnk=hp-optb (accessed on 2 December 2020).
  33. Blickensderfer, B.; McSorley, J.; Defillipis, N.; King, J.M.; Ortiz, Y.; Guinn, T.A.; Thomas, R. General aviation pilots’ capability to interpret aviation weather displays. Under review.
Figure 1. Ceiling and Visibility Analysis [11].
Atmosphere 12 00143 g001
Figure 2. Graphical Turbulence Guidance [16].
Atmosphere 12 00143 g002
Figure 3. Current Icing Product and Forecast Icing Potential (CIP/FIP) [18].
Atmosphere 12 00143 g003
Figure 4. Graphical Airman Meteorological Advisories (G- AIRMET) [20].
Atmosphere 12 00143 g004
Figure 5. Example of a Graphical Turbulence Guidance (GTG) interpretation question [31].
Atmosphere 12 00143 g005
Figure 6. Example of a G-AIRMET Tango interpretation question [31].
Atmosphere 12 00143 g006
Table 1. Description of products in this paper.
ProductWeather PhenomenaModel-Based Imagery or HITLPolygonsNumber of Questions
Ceiling and Visibility Analysis (CVA)Flight category of weather present at an airport (ceiling and visibility)Imagery2
Graphical Turbulence Guidance (GTG)Mid- and upper-level turbulenceImagery2
Current Icing Product (CIP) and Forecast Icing Product (FIP)Icing and supercooled large droplets (SLD)Imagery4
Graphical Airman Meteorological Advisories Sierra (G-AIRMET Sierra)Ceiling and visibility, mountain obscuration,Polygons1
Graphical Airman Meteorological Advisories Tango (G-AIRMET Tango)Turbulence high, turbulence low, low-level wind shear (LLWS), surface winds (SW),Polygons2
Graphical Airman Meteorological Advisories Ice (G-AIRMET Ice)Icing and freezing levelPolygons2
Table 2. Means and standard deviations of scores on the Aviation Weather Product Test (flight certificate/rating by weather type by display type).
Flight Certificate/RatingHITL PolygonModel-Based Imagery
Turbulence
M (SD)
Visibility
M (SD)
Icing
M (SD)
Turbulence
M (SD)
Visibility
M (SD)
Icing
M (SD)
Student45.53 (33.13)56.10 (50.24)42.68 (38.01)68.29 (31.14)54.88 (41.54)28.05 (21.06)
Private51.64 (30.2)63.38 (48.52)47.18 (29.14)75.35 (30.32)57.04 (39.00)29.93 (20.97)
Private w/Instrument60.00 (28.57)80.00 (40.41)49.00 (29.43)70.00 (33.50)69.00 (34.83)34.50 (23.63)
Commercial w/Instrument56.10 (30.22)73.17 (44.86)51.22 (23.68)75.61 (29.84)64.63 (32.10)40.85 (23.56)
Total53.37 (30.64)67.98 (46.77)47.54 (30.16)72.66 (31.13)61.08 (37.40)32.88 (22.51)
Table 3. Means and standard deviations of scores on the Aviation Weather Product Test (flight certificate/rating by weather type).
Flight Certificate/RatingTurbulence
M (SD)
Visibility
M (SD)
Icing
M (SD)
Total
M (SD)
Student54.63 (24.50)55.28 (36.22)32.93 (16.02)47.65 (13.6)
Private61.13 (23.39)59.15 (33.90)35.68 (16.00)56.62 (15.67)
Private w/instrument64.00 (24.58)72.67 (28.32)39.33 (16.41)61.77 (12.93)
Commercial w/instrument63.90 (25.38)67.48 (28.37)44.31 (16.08)65.62 (14.50)
Total61.18 (24.37)63.40 (32.42)37.77 (16.49)57.88 (15.54)
Table 4. Means and standard deviations of scores on the Aviation Weather Product Test (display type by flight certificate/rating).
Display TypeStudent
M (SD)
Private
M (SD)
Private w/Instrument
M (SD)
Commercial w/Instrument
M (SD)
Total
M (SD)
Traditional/polygon46.34 (21.51)51.23 (21.67)58.25 (19.33)61.59 (23.12)54.06 (21.94)
Automated/model-based imagery 44.82 (16.53)48.06 (19.55)52.00 (21.33)55.49 (19.57)49.88 (19.66)
Total47.65 (13.61)55.70 (14.88)61.79 (12.93)65.62 (14.50)57.88 (15.54)
Table 5. Means and standard deviations of scores on the Aviation Weather Product Test (weather type by display type).
Weather TypePolygon
M (SD)
Imagery
M (SD)
Total
M (SD)
Turbulence53.36 (30.64)72.66 (31.13)61.18 (24.37)
Visibility67.98 (46.77)61.08 (37.40)63.40 (32.42)
Icing47.54 (30.16)32.88 (22.51)37.77 (16.49)
Total54.06 (21.94)49.88 (19.66)57.88 (15.54)
Publisher’s Note: MDPI stays neutral with regard to jurisdictional claims in published maps and institutional affiliations.

