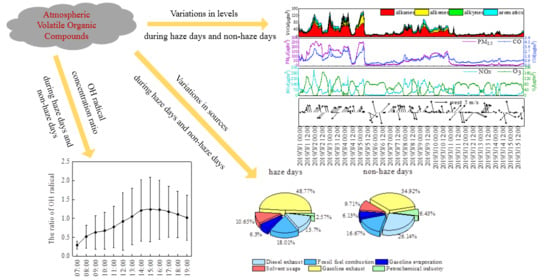
Variations in Levels and Sources of Atmospheric VOCs during the Continuous Haze and Non-Haze Episodes in the Urban Area of Beijing: A Case Study in Spring of 2019
Abstract
:1. Introduction
2. Materials and Methods
2.1. Observation Site and Period
2.2. Observing Instruments
2.3. Methods
2.3.1. Positive Matrix Factorization
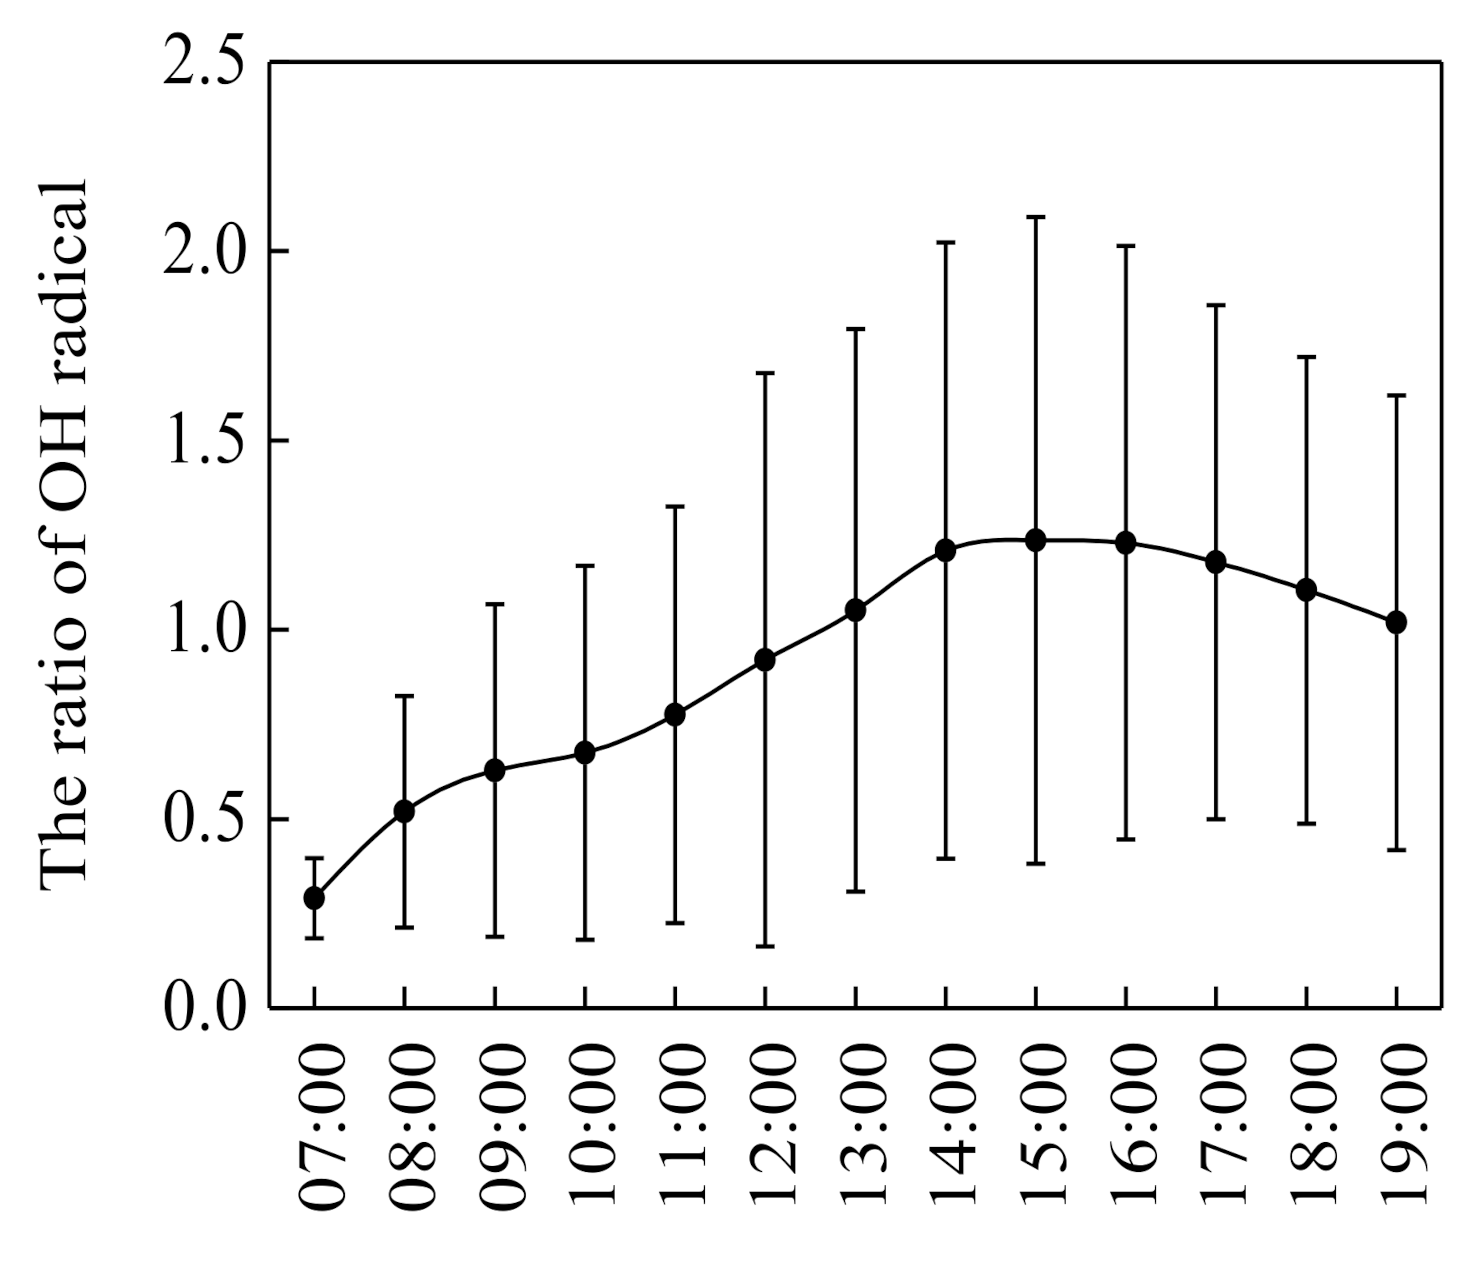
2.3.2. OH Radical Concentration
2.3.3. The Backward Trajectory
2.3.4. Potential Source Contribution Function (PSCF)
2.3.5. Concentration-Weighted Trajectory (CWT)
3. Results and Discussion
3.1. Time Series of VOCs and other Pollutants
3.2. Concentrations and Compositions of VOCs
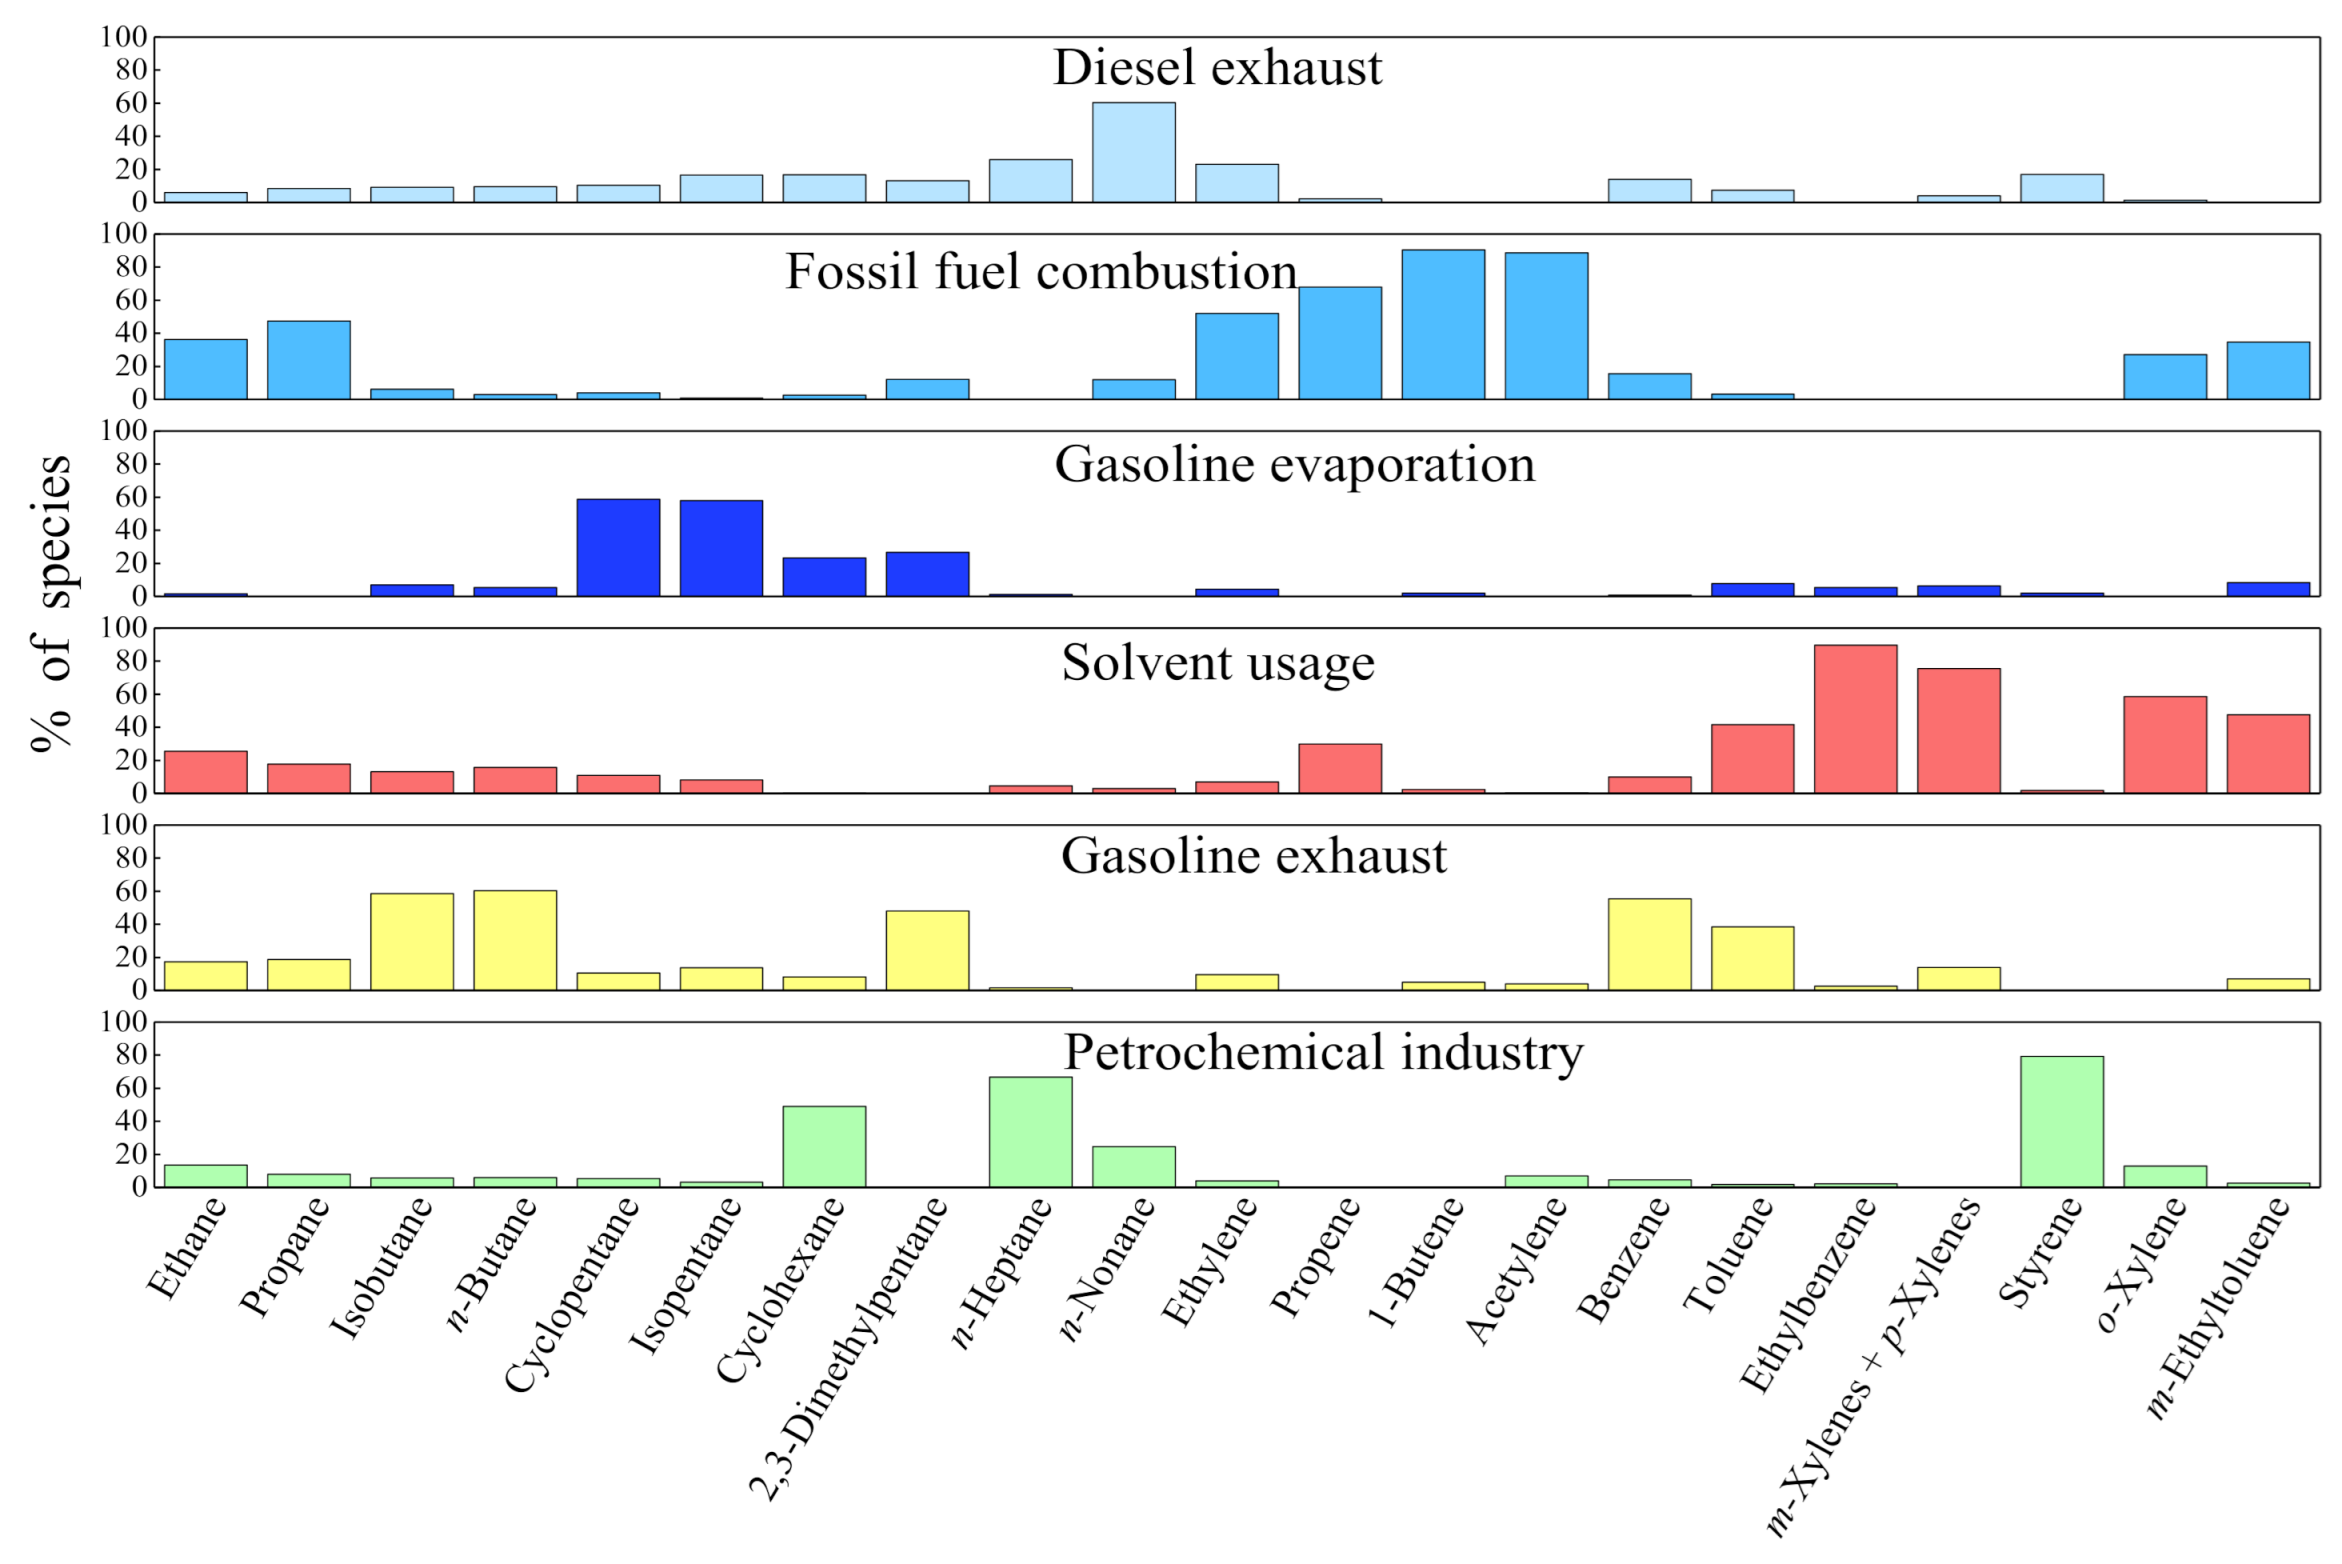
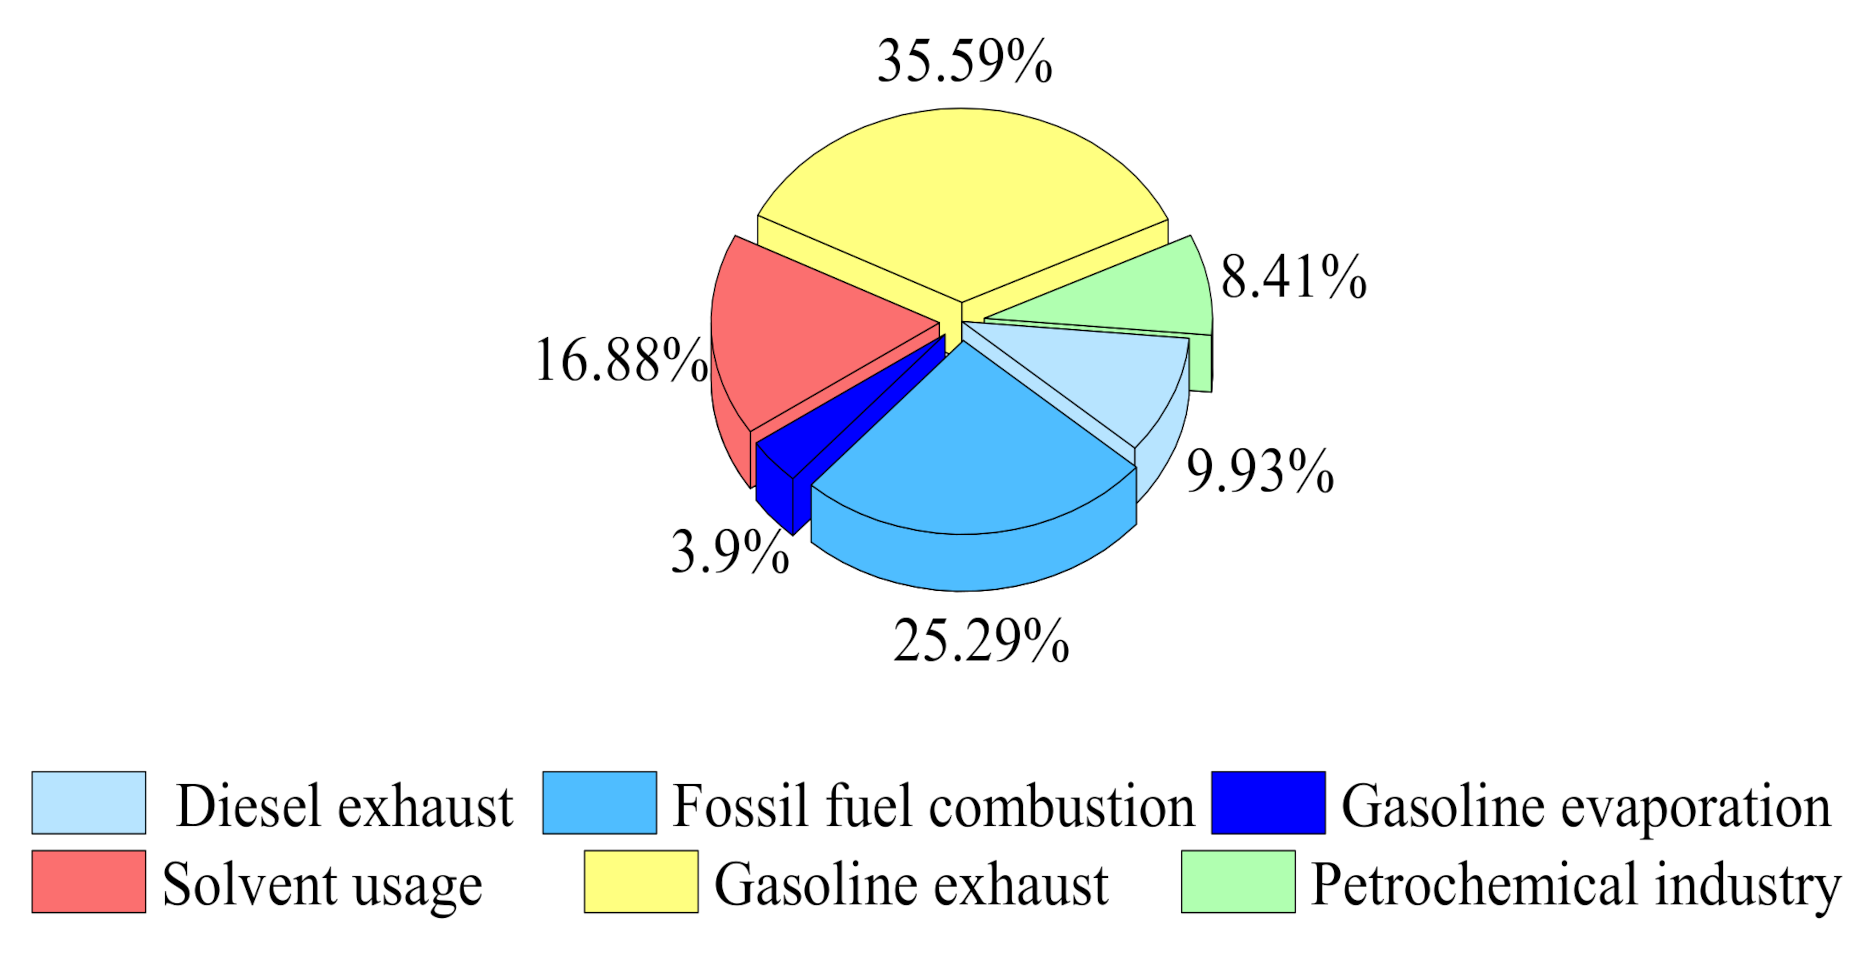
3.3. Source Apportionment
3.4. The Potential Source-Areas of VOCs
4. Conclusions
Author Contributions
Funding
Acknowledgments
Conflicts of Interest
References
- Cao, J.; Wang, Q.-Y.; Chow, J.C.; Watson, J.G.; Tie, X.-X.; Shen, Z.-X.; Wang, P.; An, Z.-S. Impacts of aerosol compositions on visibility impairment in Xi’an, China. Atmos. Environ. 2012, 59, 559–566. [Google Scholar] [CrossRef]
- Wang, Y.; Liu, Z.R.; Zhang, J.K.; Hu, B.; Ji, D.S.; Yu, Y.C. Aerosol physicochemical properties and implications for visibility during an intense haze episode during winter in Beijing. Atmos. Chem. Phys. Discuss. 2015, 15, 3205–3215. [Google Scholar] [CrossRef] [Green Version]
- Nguyen, G.T.H.; Shimadera, H.; Uranishi, K.; Matsuo, T.; Kondo, A. Numerical assessment of PM2.5 and O3 air quality in Continental Southeast Asia: Impacts of potential future climate change. Atmos. Environ. 2019, 215, 117398. [Google Scholar] [CrossRef]
- O’Donnell, M.J.; Fang, J.; Mittleman, M.A.; Kapral, M.K.; Wellenius, G.A. Investigators of the Registry of Canadian Stroke, N. Fine particulate air pollution (PM2.5) and the risk of acute ischemic stroke. Epidemiology 2011, 22, 422–431. [Google Scholar] [CrossRef] [Green Version]
- Ma, Y.; Chen, R.; Pan, G.; Xu, X.; Song, W.; Chen, B.; Kan, H. Fine particulate air pollution and daily mortality in Shenyang, China. Sci. Total Environ. 2011, 409, 2473–2477. [Google Scholar] [CrossRef]
- Ministry of Ecology and Environmental of the People’s Republic of China. 2016 Report on the State of the Environment of China; Ministry of Ecology and Environmental of the People’s Republic of China: Beijing, China, 2016. Available online: http://www.mee.gov.cn/hjzl/sthjzk/zghjzkgb/201706/P020170605833655914077.pdf (accessed on 5 June 2017).
- Beijing Municipal Environmental Protection Bureau. 2016 Report on the State of the Environment in Beijing; Beijing Municipal Environmental Protection Bureau: Beijing, China, 2016. Available online: http://sthjj.beijing.gov.cn/bjhrb/resource/cms/2018/04/2018042409542462126.pdf (accessed on 2 June 2017).
- Beijing Municipal Environmental Protection Bureau. 2018 Report on the State of the Environment in Beijing; Beijing Municipal Environmental Protection Bureau: Beijing, China, 2018. Available online: http://sthjj.beijing.gov.cn/bjhrb/index/xxgk69/zfxxgk43/fdzdgknr2/xwfb/849888/index.html (accessed on 9 May 2019).
- Hui, L.; Liu, X.; Tan, Q.; Feng, M.; An, J.; Qu, Y.; Zhang, Y.; Cheng, N. VOC characteristics, sources and contributions to SOA formation during haze events in Wuhan, Central China. Sci. Total Environ. 2019, 650, 2624–2639. [Google Scholar] [CrossRef]
- Wu, R.; Li, J.; Shaodong, X.; Li, Y.; Zeng, L.; Xie, S. Evolution process and sources of ambient volatile organic compounds during a severe haze event in Beijing, China. Sci. Total Environ. 2016, 62–72. [Google Scholar] [CrossRef]
- Yang, Y.R.; Liu, X.G.; Qu, Y.; An, J.-L.; Jiang, R.; Zhang, Y.H.; Sun, Y.; Wu, Z.J.; Zhang, F.; Xu, W.Q.; et al. Characteristics and formation mechanism of continuous hazes in China: A case study during the autumn of 2014 in the North China Plain. Atmos. Chem. Phys. Discuss. 2015, 15, 8165–8178. [Google Scholar] [CrossRef] [Green Version]
- Huang, R.-J.; Zhang, Y.; Bozzetti, C.; Ho, K.-F.; Cao, J.; Han, Y.; Daellenbach, K.R.; Slowik, J.G.; Platt, S.M.; Canonaco, F.; et al. High secondary aerosol contribution to particulate pollution during haze events in China. Nat. Cell Biol. 2014, 514, 218–222. [Google Scholar] [CrossRef] [Green Version]
- Zhao, X.J.; Zhao, P.S.; Xu, J.; Meng, W.; Pu, W.W.; Dong, F.; He, D.; Shi, Q.F. Analysis of a winter regional haze event and its formation mechanism in the North China Plain. Atmos. Chem. Phys. Discuss. 2013, 13, 5685–5696. [Google Scholar] [CrossRef] [Green Version]
- Han, T.; Liu, X.; Zhang, Y.; Qu, Y.; Zeng, L.; Hu, M.; Zhu, T. Role of secondary aerosols in haze formation in summer in the Megacity Beijing. J. Environ. Sci. 2015, 31, 51–60. [Google Scholar] [CrossRef] [PubMed]
- Liu, J.; Mu, Y.; Zhang, Y.; Zhang, Z.; Wang, X.; Liu, Y.; Sun, Z. Atmospheric levels of BTEX compounds during the 2008 Olympic Games in the urban area of Beijing. Sci. Total Environ. 2009, 408, 109–116. [Google Scholar] [CrossRef]
- Song, M.; Zhang, C.; Wu, H.; Mu, Y.; Ma, Z.; Zhang, Y.; Liu, J.; Li, X. The influence of OH concentration on SOA formation from isoprene photooxidation. Sci. Total Environ. 2019, 650, 951–957. [Google Scholar] [CrossRef]
- Sun, J.; Wu, F.; Hu, B.; Tang, G.; Zhang, J.; Wang, Y. VOC characteristics, emissions and contributions to SOA formation during hazy episodes. Atmos. Environ. 2016, 141, 560–570. [Google Scholar] [CrossRef]
- Wei, W.; Li, Y.; Wang, Y.; Cheng, S.; Wang, L. Characteristics of VOCs during haze and non-haze days in Beijing, China: Concentration, chemical degradation and regional transport impact. Atmos. Environ. 2018, 194, 134–145. [Google Scholar] [CrossRef]
- Zhang, Z.; Wang, H.; Chen, D.; Li, Q.; Thai, P.; Gong, D.; Li, Y.; Zhang, C.; Gu, Y.; Zhou, L.; et al. Emission characteristics of volatile organic compounds and their secondary organic aerosol formation potentials from a petroleum refinery in Pearl River Delta, China. Sci. Total Environ. 2017, 584–585, 1162–1174. [Google Scholar] [CrossRef] [PubMed] [Green Version]
- Zhang, H.; Li, H.; Zhang, Q.; Zhang, Y.; Zhang, W.; Wang, X.; Bi, F.; Chai, F.; Gao, J.; Meng, L.; et al. Atmospheric Volatile Organic Compounds in a Typical Urban Area of Beijing: Pollution Characterization, Health Risk Assessment and Source Apportionment. Atmosphere 2017, 8, 61. [Google Scholar] [CrossRef] [Green Version]
- Cheng, X.; Li, H.; Zhang, Y.; Li, Y.; Zhang, W.; Wang, X.; Bi, F.; Zhang, H.; Gao, J.; Chai, F.; et al. Atmospheric isoprene and monoterpenes in a typical urban area of Beijing: Pollution characterization, chemical reactivity and source identification. J. Environ. Sci. 2018, 71, 150–167. [Google Scholar] [CrossRef] [PubMed]
- Zhang, L.; Li, H.; Wu, Z.; Zhang, W.; Liu, K.; Cheng, X.; Zhang, Y.; Li, B.; Chen, Y. Characteristics of atmospheric volatile organic compounds in urban area of Beijing: Variations, photochemical reactivity and source apportionment. J. Environ. Sci. 2020, 95, 190–200. [Google Scholar] [CrossRef]
- Hui, L.; Liu, X.; Tan, Q.; Feng, M.; An, J.; Qu, Y.; Zhang, Y.; Jiang, M. Characteristics, source apportionment and contribution of VOCs to ozone formation in Wuhan, Central China. Atmos. Environ. 2018, 192, 55–71. [Google Scholar] [CrossRef]
- Buzcu, B.; Fraser, M.P. Source identification and apportionment of volatile organic compounds in Houston, TX. Atmos. Environ. 2006, 40, 2385–2400. [Google Scholar] [CrossRef]
- Chen, C.H.; Chuang, Y.C.; Hsieh, C.C.; Lee, C.S. VOC characteristics and source apportionment at a PAMS site near an in-dustrial complex in central Taiwan. Atmos. Pollut. Res. 2019, 4, 1060–1074. [Google Scholar] [CrossRef]
- Lyu, X.; Chen, N.; Guo, H.; Zhang, W.; Wang, N.; Wang, Y.; Liu, M. Ambient volatile organic compounds and their effect on ozone production in Wuhan, central China. Sci. Total Environ. 2016, 541, 200–209. [Google Scholar] [CrossRef] [PubMed]
- Shao, P.; An, J.; Xin, J.; Wu, F.; Wang, J.; Ji, D.; Wang, Y.S. Source apportionment of VOCs and the contribution to photochemical ozone formation during summer in the typical industrial area in the Yangtze River Delta, China. Atmos. Res. 2016, 176-177, 64–74. [Google Scholar] [CrossRef]
- Hsu, C.-Y.; Chiang, H.-C.; Shie, R.-H.; Ku, C.-H.; Lin, T.-Y.; Chen, M.-J.; Chen, N.-T.; Chen, Y.-C. Ambient VOCs in residential areas near a large-scale petrochemical complex: Spatiotemporal variation, source apportionment and health risk. Environ. Pollut. 2018, 240, 95–104. [Google Scholar] [CrossRef]
- Shao, M.; Yuan, B.; Wang, M.; Zheng, J.; Liu, Y.; Lu, S. Volatile Organic Compounds in the Atmosphere: Sources and the Roles in Atmospheric Chemistry; Science Press: Beijing, China, 2020; Volume 1, p. 95. [Google Scholar]
- Wang, Y.; Zhang, X.; Draxler, R.R. TrajStat: GIS-based software that uses various trajectory statistical analysis methods to identify potential sources from long-term air pollution measurement data. Environ. Model. Softw. 2009, 24, 938–939. [Google Scholar] [CrossRef]
- Dimitriou, K.; Remoundaki, E.; Mantas, E.; Kassomenos, P. Spatial distribution of source areas of PM2.5 by Concentration Weighted Trajectory (CWT) model applied in PM2.5 concentration and composition data. Atmos. Environ. 2015, 116, 138–145. [Google Scholar] [CrossRef]
- Liu, B.; Liang, D.; Yang, J.; Dai, Q.; Bi, X.; Feng, Y.; Yuan, J.; Xiao, Z.; Zhang, Y.; Xu, H. Characterization and source appor-tionment of volatile organic compounds based on 1-year of observational data in Tianjin, China. Environ. Pollut. 2016, 218, 757–769. [Google Scholar] [CrossRef]
- Sheng, J.; Zhao, D.; Ding, D.; Li, X.; Huang, M.; Gao, Y.; Quan, J.; Zhang, Q. Characterizing the level, photochemical reactivity, emission, and source contribution of the volatile organic compounds based on PTR-TOF-MS during winter haze period in Beijing, China. Atmos. Res. 2018, 212, 54–63. [Google Scholar] [CrossRef]
- Atkinson, R.; Arey, J. Atmospheric Degradation of Volatile Organic Compounds. Chem. Rev. 2003, 103, 4605–4638. [Google Scholar] [CrossRef]
- Brown, S.G.; Frankel, A.; Hafner, H.R. Source apportionment of VOCs in the Los Angeles area using positive matrix factor-ization. Atmos. Environ. 2007, 41, 227–237. [Google Scholar] [CrossRef]
- Liu, Y.; Shao, M.; Fu, L.; Lu, S.; Zeng, L.; Tang, D. Source profiles of volatile organic compounds (VOCs) measured in China: Part I. Atmos. Environ. 2008, 42, 6247–6260. [Google Scholar] [CrossRef]
- Zhu, H.; Wang, H.; Jing, S.; Wang, Y.; Cheng, T.; Tao, S.; Lou, S.; Qiao, L.; Li, L.; Chen, J. Characteristics and sources of at-mospheric volatile organic compounds (VOCs) along the mid-lower Yangtze River in China. Atmos. Environ. 2018, 190, 232–240. [Google Scholar] [CrossRef]
- Guo, H.; Cheng, H.; Ling, Z.; Louie, P.; Ayoko, G. Which emission sources are responsible for the volatile organic compounds in the atmosphere of Pearl River Delta? J. Hazard. Mater. 2011, 188, 116–124. [Google Scholar] [CrossRef]
- Lai, C.-H.; Chang, C.-C.; Wang, C.-H.; Shao, M.; Zhang, Y.; Wang, J.-L. Emissions of liquefied petroleum gas (LPG) from motor vehicles. Atmos. Environ. 2009, 43, 1456–1463. [Google Scholar] [CrossRef]
- Huang, L.; Qian, H.; Deng, S.; Guo, J.; Li, Y.; Zhao, W.; Yue, Y. Urban residential indoor volatile organic compounds in summer, Beijing: Profile, concentration and source characterization. Atmos. Environ. 2018, 188, 1–11. [Google Scholar] [CrossRef]
- Ma, Z.; Liu, C.; Zhang, C.; Liu, P.; Ye, C.; Xue, C.; Zhao, D.; Sun, J.; Du, Y.; Chai, F.; et al. The levels, sources and reactivity of volatile organic compounds in a typical urban area of Northeast China. J. Environ. Sci. 2019, 79, 121–134. [Google Scholar] [CrossRef]
- Civan, M.Y.; Elbir, T.; Seyfioglu, R.; Kuntasal, Ö.O.; Bayram, A.; Doğan, G.; Yurdakul, S.; Andiç, Ö.; Muezzinoglu, A.; Sofuoğlu, S.C.; et al. Spatial and temporal variations in atmospheric VOCs, NO2, SO2, and O3 concentrations at a heavily industrialized region in Western Turkey, and assessment of the carcinogenic risk levels of benzene. Atmos. Environ. 2015, 103, 102–113. [Google Scholar] [CrossRef] [Green Version]
- Barletta, B.; Meinardi, S.; Simpson, I.J.; Zou, S.; Sherwood Rowland, F.; Blake, D.R. Ambient mixing ratios of non-methane hydrocarbons (NMHCs) in two major urban centers of the Pearl River Delta (PRD) region: Guangzhou and Dong-guan. Atmos. Environ. 2008, 42, 4393–4408. [Google Scholar] [CrossRef] [Green Version]
- Watson, J.G.; Chow, J.C.; Fujita, E.M. Review of volatile organic compound source apportionment by chemical mass balance. Atmos. Environ. 2001, 35, 1567–1584. [Google Scholar] [CrossRef]
- Niu, Z.; Zhang, H.; Xu, Y.; Liao, X.; Xu, L.; Chen, J. Pollution characteristics of volatile organic compounds in the atmosphere of Haicang District in Xiamen City, Southeast China. J. Environ. Monit. 2012, 14, 1145–1151. [Google Scholar] [CrossRef] [PubMed]
- Wang, Y.; Ren, X.; Ji, D.; Zhang, J.; Sun, J.; Wu, F. Characterization of volatile organic compounds in the urban area of Beijing from 2000 to 2007. J. Environ. Sci. 2012, 24, 95–101. [Google Scholar] [CrossRef]
- Wang, B.; Shao, M.; Lu, S.H.; Yuan, B.; Zhao, Y.; Wang, M.; Zhang, S.Q.; Wu, D. Variation of ambient non-methane hydrocarbons in Beijing city in summer 2008. Atmos. Chem. Phys. Discuss. 2010, 10, 5911–5923. [Google Scholar] [CrossRef] [Green Version]
- Cai, C.; Geng, F.; Tie, X.; Yu, Q.; An, J. Characteristics and source apportionment of VOCs measured in Shanghai, China. Atmos. Environ. 2010, 44, 5005–5014. [Google Scholar] [CrossRef]
- Lau, A.K.H.; Yuan, Z.; Yu, J.Z.; Louie, P.K.K. Source apportionment of ambient volatile organic compounds in Hong Kong. Sci. Total Environ. 2010, 408, 4138–4149. [Google Scholar] [CrossRef]
- Zheng, H.; Kong, S.; Xing, X.; Mao, Y.; Hu, T.; Ding, Y.; Li, G.; Liu, D.; Li, S.; Qi, S. Monitoring of volatile organic compounds (VOCs) from an oil and gas station in northwest China for 1 year. Atmos. Chem. Phys. Discuss. 2018, 18, 4567–4595. [Google Scholar] [CrossRef] [Green Version]
- Zhou, X.; Li, Z.; Zhang, T.; Wang, F.; Wang, F.; Tao, Y.; Zhang, X.; Wang, F.; Huang, J. Volatile organic compounds in a typical petrochemical industrialized valley city of northwest China based on high-resolution PTR-MS measurements: Characteri-zation, sources and chemical effects. Sci. Total Environ. 2019, 671, 883–896. [Google Scholar] [CrossRef]
- Liu, Y.; Song, M.; Liu, X.; Zhang, Y.; Hui, L.; Kong, L.; Zhang, Y.; Zhang, C.; Qu, Y.; An, J.; et al. Charac-terization and sources of volatile organic compounds (VOCs) and their related changes during ozone pollution days in 2016 in Beijing, China. Environ. Pollut. 2020, 257, 113599. [Google Scholar] [CrossRef]


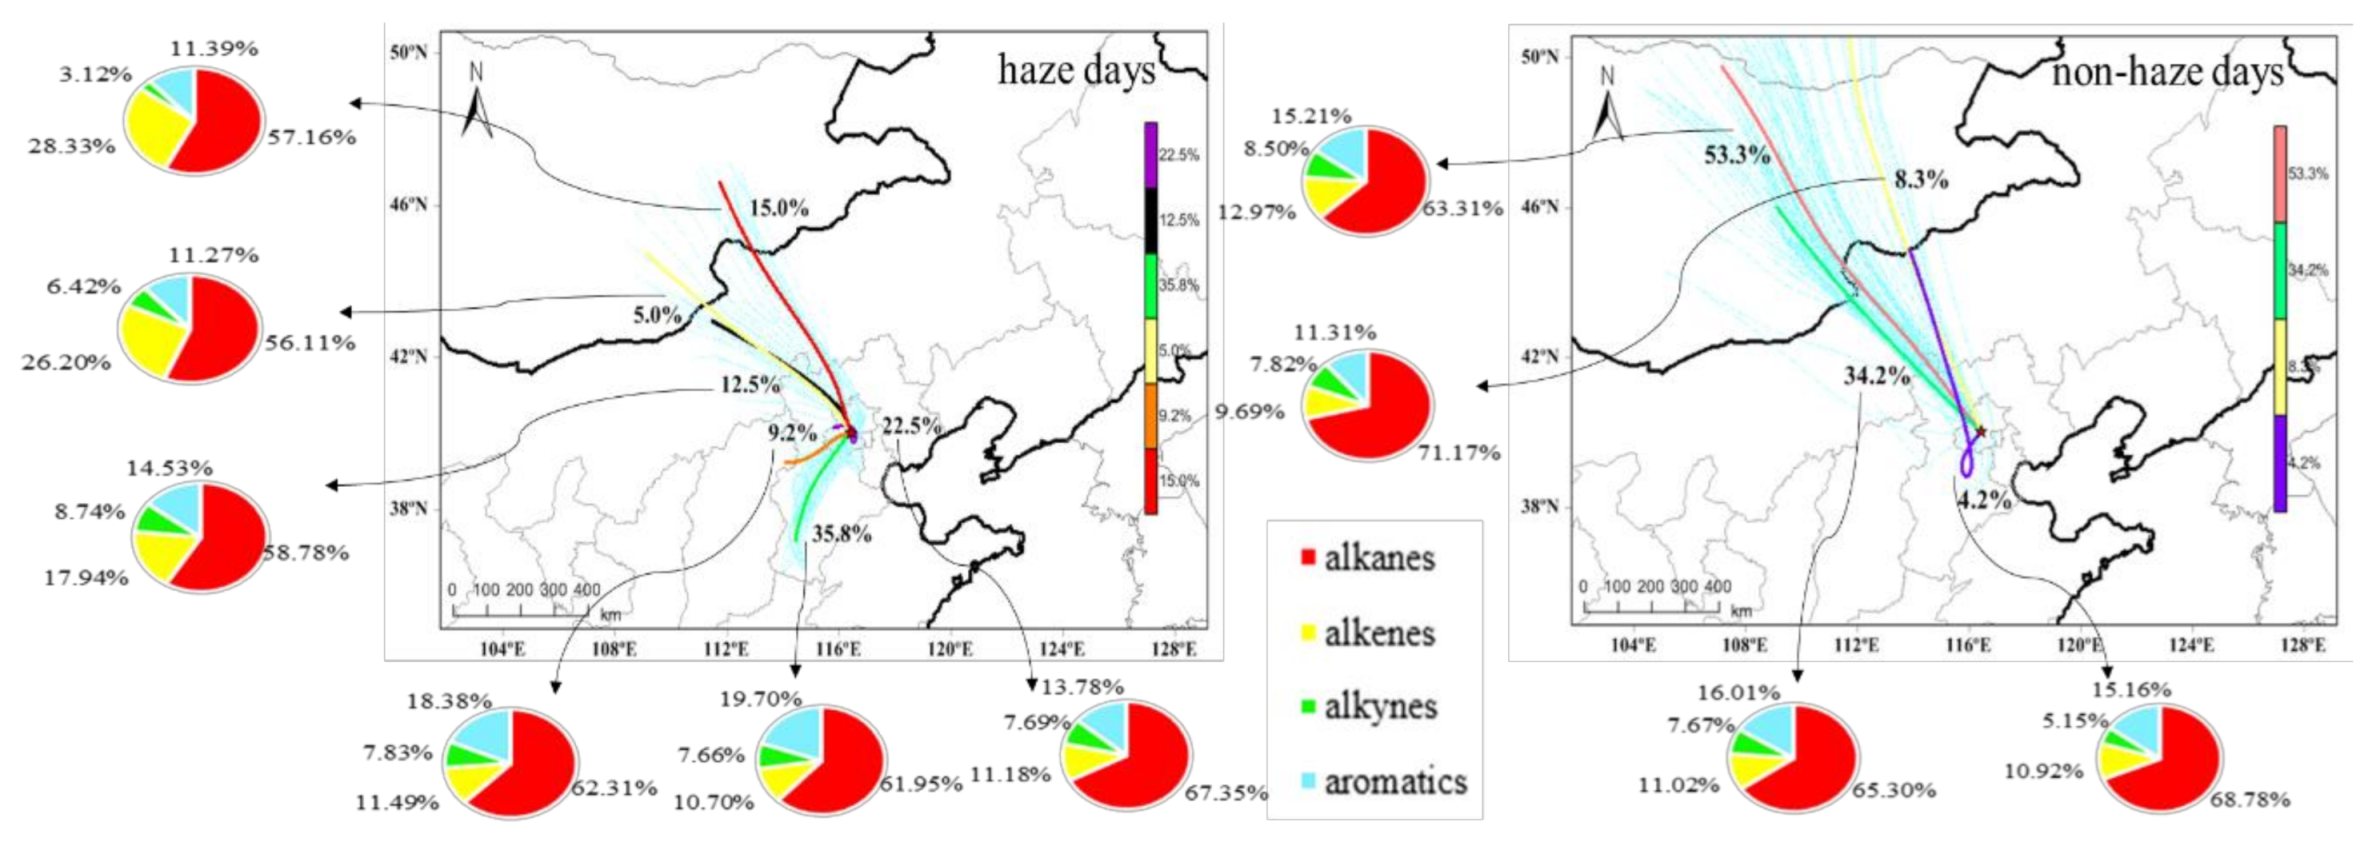
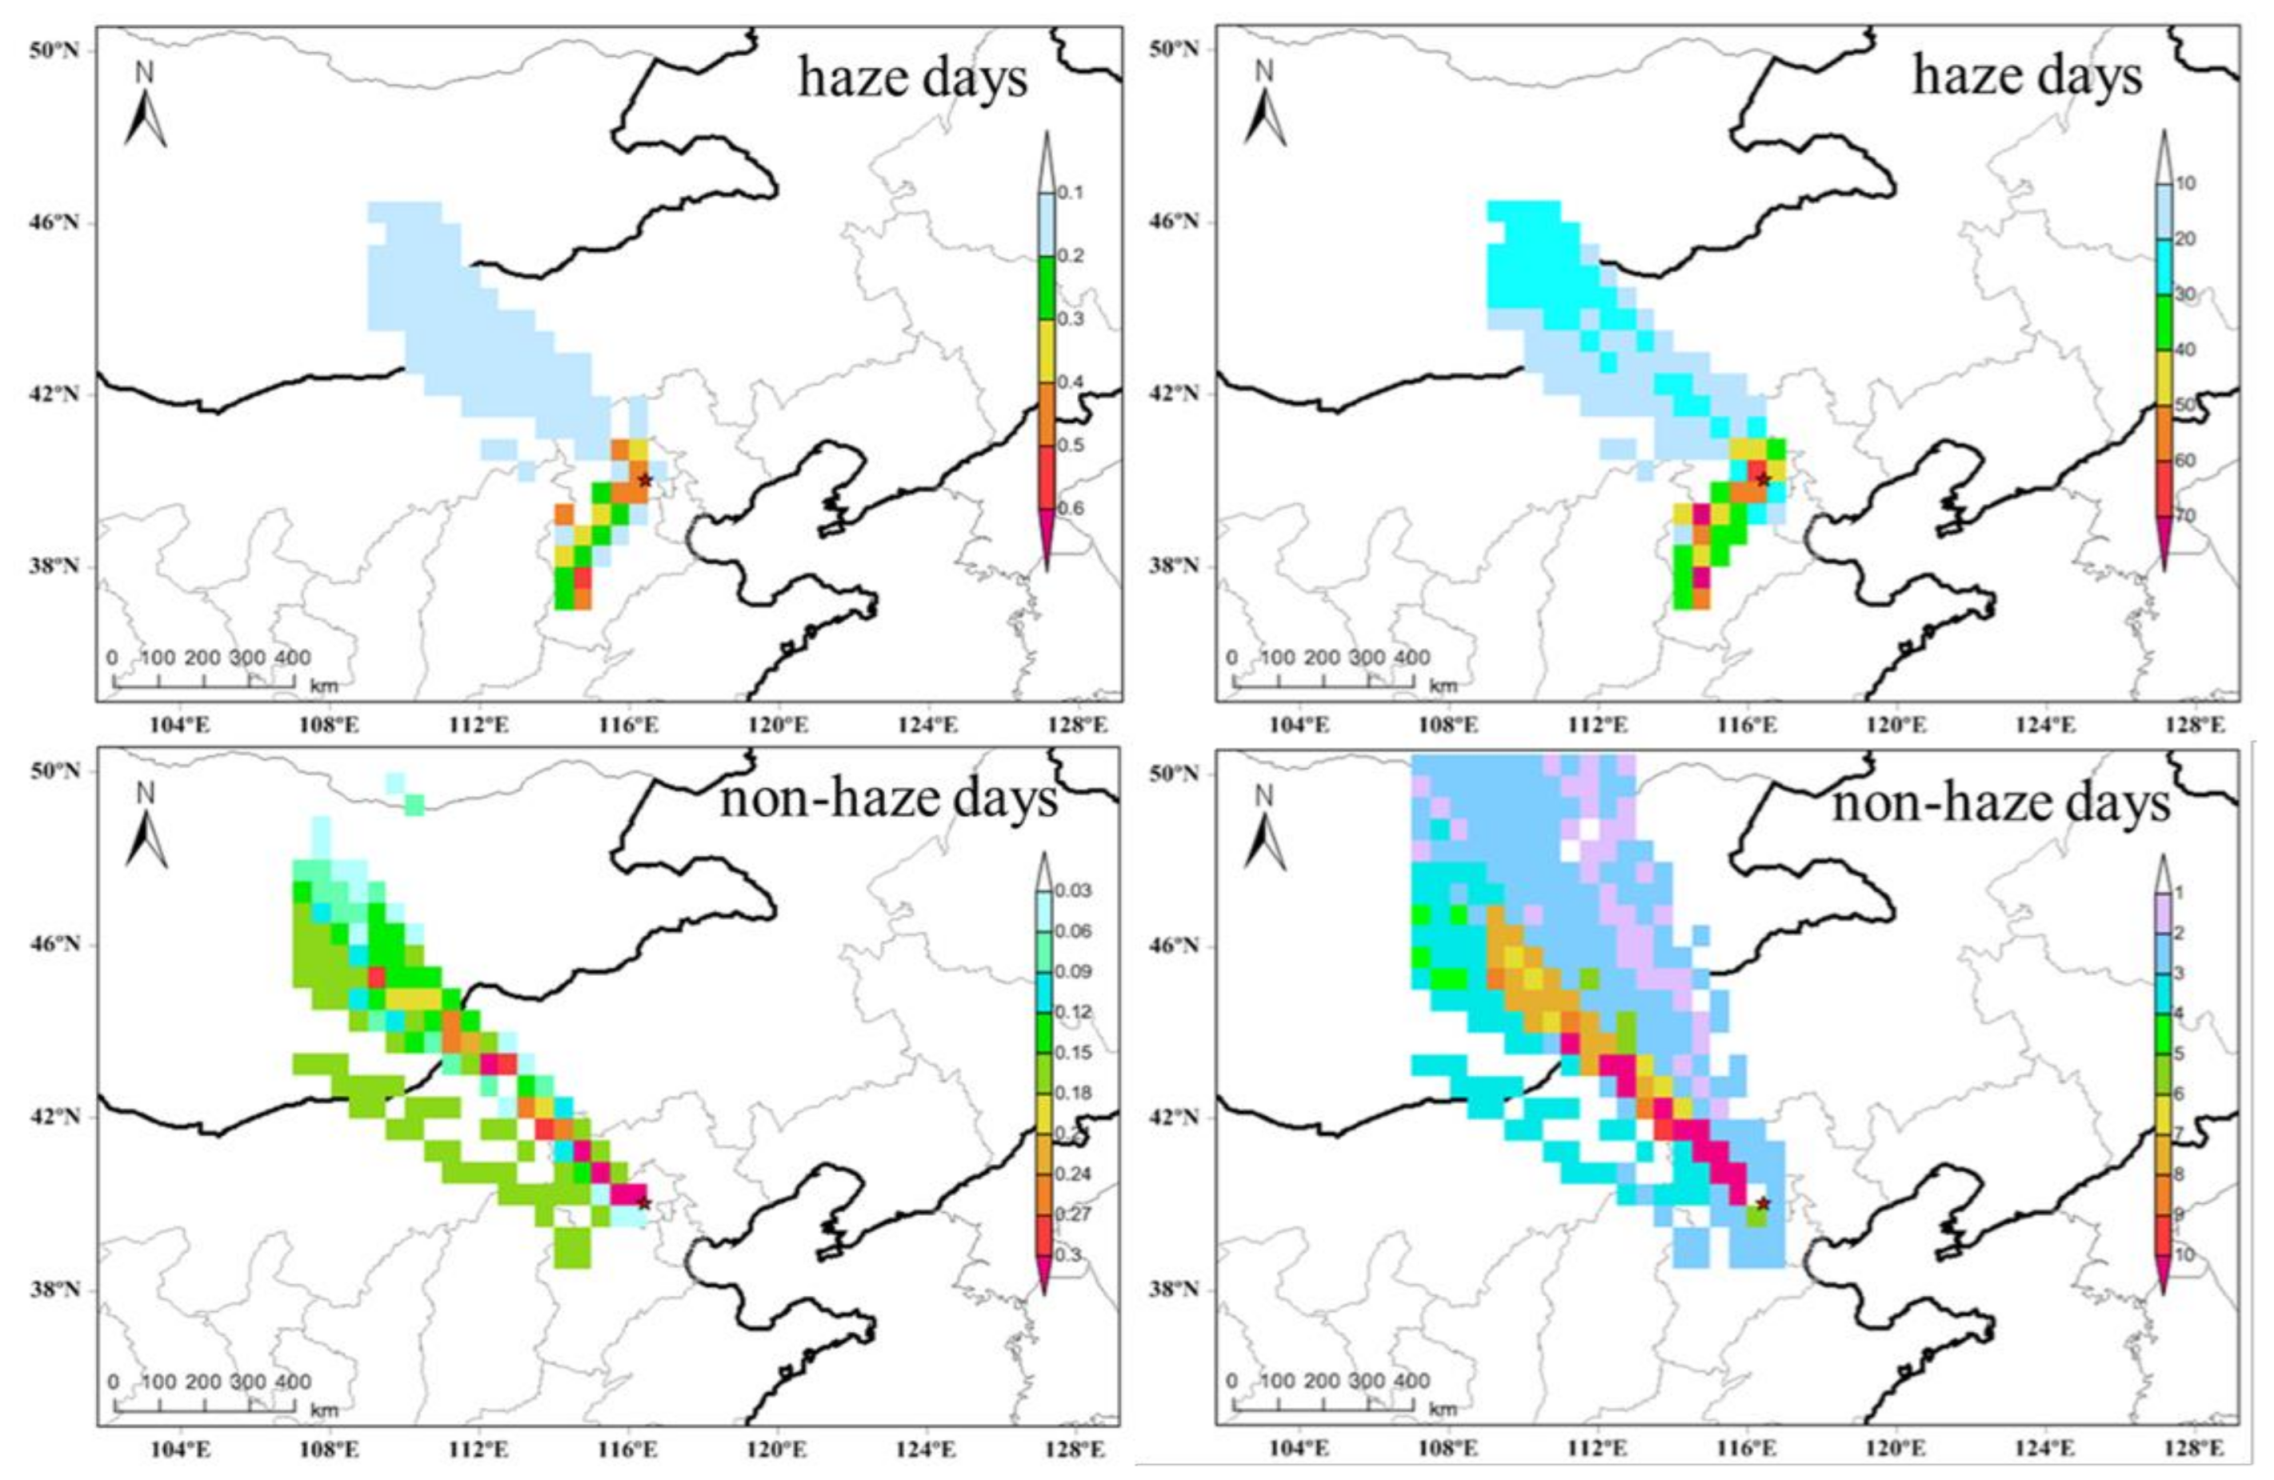
| Variety | Species | Haze days | non-Haze Days | ||
|---|---|---|---|---|---|
| Average ± SD | Proportion | Average ± SD | Proportion | ||
| Alkanes | ethane | 9.40 ± 3.55 | 15.90% | 4.34 ± 1.06 | 25.67% |
| propane | 12.40 ± 7.40 | 20.97% | 3.30 ± 1.48 | 19.52% | |
| isobutane | 2.79 ± 1.61 | 4.72% | 0.54 ± 0.36 | 3.19% | |
| n-butane | 4.88 ± 2.74 | 8.25% | 1.16 ± 0.92 | 6.86% | |
| cyclopentane | 1.82 ± 1.15 | 3.08% | 0.36 ± 0.32 | 2.13% | |
| isopentane | 1.85 ± 1.28 | 3.13% | 0.84 ± 0.63 | 4.97% | |
| n-pentane | 0.03 ± 0.04 | 0.05% | 0.01 ± 0.02 | 0.06% | |
| methylcyclopentane | 0.01 ± 0.04 | 0.02% | 0.01 ± 0.04 | 0.06% | |
| 2,3-dimethylbutane | 0.01 ± 0.01 | 0.02% | 0.01 ± 0.02 | 0.06% | |
| 2&3-methylpentane | 0.00 ± 0.00 | 0.00% | 0.00 ± 0.00 | 0.00% | |
| n-hexane | 1.10 ± 0.86 | 1.86% | 0.18 ± 0.26 | 1.06% | |
| 2,2-dimethylbutane | 0.02 ± 0.04 | 0.03% | 0.01 ± 0.01 | 0.06% | |
| cyclohexane | 0.20 ± 0.17 | 0.34% | 0.01 ± 0.04 | 0.06% | |
| 2,3-dimethylpentane | 0.34 ± 0.30 | 0.58% | 0.03 ± 0.09 | 0.18% | |
| 3-methyhexane | 0.24 ± 0.18 | 0.41% | 0.03 ± 0.05 | 0.18% | |
| 2,2,4-trimethylpentane | 0.04 ± 0.03 | 0.07% | 0.01 ± 0.03 | 0.06% | |
| n-heptane | 0.35 ± 0.32 | 0.59% | 0.03 ± 0.06 | 0.18% | |
| methylcyclohexane | 0.19 ± 0.20 | 0.32% | 0.01 ± 0.03 | 0.06% | |
| 2,3,4-trimethylpentane | 0.01 ± 0.01 | 0.02% | 0.01 ± 0.02 | 0.06% | |
| 2-methylheptane | 0.05 ± 0.06 | 0.08% | 0.01 ± 0.03 | 0.06% | |
| 3-methylheptane | 0.01 ± 0.04 | 0.02% | 0.01 ± 0.01 | 0.06% | |
| n-octane | 0.36 ± 0.40 | 0.61% | 0.04 ± 0.05 | 0.24% | |
| n-nonane | 0.14 ± 0.13 | 0.24% | 0.02 ± 0.05 | 0.12% | |
| n-decane | 0.01 ± 0.01 | 0.02% | 0.00 ± 0.00 | 0.00% | |
| n-undecane | 0.01 ± 0.04 | 0.02% | 0.01 ± 0.08 | 0.06% | |
| n-dodecane | 0.13 ± 0.34 | 0.22% | 0.01 ± 0.06 | 0.06% | |
| total alkanes | 36.39 ± 18.64 | 61.54% | 10.99 ± 4.30 | 64.99% | |
| Alkenes | ethylene | 6.37 ± 4.69 | 10.77% | 1.68 ± 0.93 | 9.93% |
| propene | 0.57 ± 0.41 | 0.96% | 0.07 ± 0.12 | 0.41% | |
| trans-2-butene | 0.17 ± 0.15 | 0.29% | 0.01 ± 0.05 | 0.06% | |
| 1-butene | 0.89 ± 0.61 | 1.51% | 0.03 ± 0.07 | 0.18% | |
| cis-2- butene | 0.22 ± 0.30 | 0.37% | 0.06 ± 0.14 | 0.35% | |
| 1,3- butadiene | 0.06 ± 0.10 | 0.10% | 0.01 ± 0.05 | 0.06% | |
| trans-2-pentene | 0.03 ± 0.09 | 0.05% | 0.01 ± 0.04 | 0.06% | |
| 2-methyl-2-butene | 0.00 ± 0.00 | 0.00% | 0.00 ± 0.00 | 0.00% | |
| 1- pentene | 0.01 ± 0.04 | 0.02% | 0.01 ± 0.03 | 0.06% | |
| cis-2- pentene | 0.13 ± 0.14 | 0.22% | 0.04 ± 0.18 | 0.24% | |
| isoprene | 0.02 ± 0.03 | 0.03% | 0.01 ± 0.03 | 0.06% | |
| 2-methyl-1-pentene | 0.06 ± 0.08 | 0.10% | 0.01 ± 0.03 | 0.06% | |
| α-pinene | 0.01 ± 0.02 | 0.02% | 0.00 ± 0.00 | 0.00% | |
| β- pinene | 0.05 ± 0.07 | 0.08% | 0.06 ± 0.08 | 0.35% | |
| limomene | 0.00 ± 0.00 | 0.00% | 0.00 ± 0.00 | 0.00% | |
| total alkenes | 8.59 ± 8.05 | 14.53% | 2.00 ± 1.22 | 11.83% | |
| Alkyne | acetylene | 3.91 ± 2.65 | 6.61% | 1.30 ± 1.07 | 7.69% |
| Aromatics | benzene | 4.18 ± 2.17 | 7.07% | 0.64 ± 0.46 | 3.78% |
| toluene | 3.17 ± 2.62 | 5.36% | 0.72 ± 0.52 | 4.26% | |
| ethylbenzene | 0.56 ± 0.54 | 0.95% | 0.13 ± 0.17 | 0.77% | |
| m-xylene + p-xylene | 0.59 ± 0.45 | 1.00% | 0.46 ± 0.46 | 2.72% | |
| styrene | 0.62 ± 0.60 | 1.05% | 0.28 ± 0.24 | 1.66% | |
| o-xylene | 0.01 ± 0.02 | 0.02% | 0.12 ± 0.20 | 0.71% | |
| i-propylbenzene | 0.01 ± 0.01 | 0.02% | 0.00 ± 0.00 | 0.00% | |
| n-propylbenzene | 0.34 ± 0.30 | 0.58% | 0.05 ± 0.06 | 0.30% | |
| m-ethyltoluene | 0.04 ± 0.05 | 0.07% | 0.02 ± 0.04 | 0.12% | |
| p-ethyltoluene | 0.09 ± 0.13 | 0.15% | 0.01 ± 0.03 | 0.06% | |
| 1,3,5-trimethylbenzene | 0.01 ± 0.02 | 0.02% | 0.01 ± 0.02 | 0.06% | |
| o-ethyltoluene | 0.11 ± 0.12 | 0.19% | 0.01 ± 0.02 | 0.06% | |
| 1,2,4-trimethylbenzene | 0.38 ± 0.34 | 0.64% | 0.09 ± 0.10 | 0.53% | |
| 1,2,3-trimethylbenzene | 0.08 ± 0.05 | 0.14% | 0.06 ± 0.03 | 0.35% | |
| m-diethylbenzene | 0.02 ± 0.05 | 0.03% | 0.01 ± 0.03 | 0.06% | |
| p-diethylbenzene | 0.03 ± 0.05 | 0.05% | 0.01 ± 0.01 | 0.06% | |
| naphtalene | 0.00 ± 0.00 | 0.00% | 0.00 ± 0.00 | 0.00% | |
| total aromatics | 10.24 ± 5.09 | 17.32% | 2.62 ± 1.79 | 15.49% | |
| Total VOCs | 59.13 ± 31.08 | 100.00% | 16.91 ± 7.19 | 100.00% | |
Publisher’s Note: MDPI stays neutral with regard to jurisdictional claims in published maps and institutional affiliations. |
© 2021 by the authors. Licensee MDPI, Basel, Switzerland. This article is an open access article distributed under the terms and conditions of the Creative Commons Attribution (CC BY) license (http://creativecommons.org/licenses/by/4.0/).
Share and Cite
Zhang, L.; Wang, X.; Li, H.; Cheng, N.; Zhang, Y.; Zhang, K.; Li, L. Variations in Levels and Sources of Atmospheric VOCs during the Continuous Haze and Non-Haze Episodes in the Urban Area of Beijing: A Case Study in Spring of 2019. Atmosphere 2021, 12, 171. https://doi.org/10.3390/atmos12020171
Zhang L, Wang X, Li H, Cheng N, Zhang Y, Zhang K, Li L. Variations in Levels and Sources of Atmospheric VOCs during the Continuous Haze and Non-Haze Episodes in the Urban Area of Beijing: A Case Study in Spring of 2019. Atmosphere. 2021; 12(2):171. https://doi.org/10.3390/atmos12020171
Chicago/Turabian StyleZhang, Lihui, Xuezhong Wang, Hong Li, Nianliang Cheng, Yujie Zhang, Kai Zhang, and Lei Li. 2021. "Variations in Levels and Sources of Atmospheric VOCs during the Continuous Haze and Non-Haze Episodes in the Urban Area of Beijing: A Case Study in Spring of 2019" Atmosphere 12, no. 2: 171. https://doi.org/10.3390/atmos12020171
APA StyleZhang, L., Wang, X., Li, H., Cheng, N., Zhang, Y., Zhang, K., & Li, L. (2021). Variations in Levels and Sources of Atmospheric VOCs during the Continuous Haze and Non-Haze Episodes in the Urban Area of Beijing: A Case Study in Spring of 2019. Atmosphere, 12(2), 171. https://doi.org/10.3390/atmos12020171


