Abstract
We assessed maximum (Tmax) and minimum (Tmin) temperatures over Pakistan’s Indus basin during the 21st century using statistical downscaling. A particular focus was given to spatiotemporal heterogeneity, reference and General Circulation Model (GCM) uncertainties, and statistical skills of regression models using an observational profile that could significantly be improved by recent high-altitude observatories. First, we characterized the basin into homogeneous climate regions using K-means clustering. Predictors from ERA-Interim reanalysis were then used to model observed temperatures skillfully and quantify reference and GCM uncertainties. Thermodynamical (dynamical) variables mainly governed reference (GCM) uncertainties. The GCM predictors under RCP4.5 and RCP8.5 scenarios were used as “new” predictors in statistical models to project ensemble temperature changes. Our analysis projected non-uniform warming but could not validate elevation-dependent warming (EDW) at the basin scale. We obtained more significant warming during the westerly-dominated seasons, with maximum heating during the winter season through Tmin changes. The most striking feature is a low-warming monsoon (with the possibility of no change to slight cooling) over the Upper Indus Basin (UIB). Therefore, the likelihood of continuing the anomalous UIB behavior during the primary melt season may not entirely be ruled out at the end of the 21st century under RCP8.5.
1. Introduction
Anthropogenic activities are estimated to have caused approximately 1 °C global warming over pre-industrial levels [1]. The projected increase is likely between 2 °C to 5 °C by the end of the 21st century under different emission scenarios [2]. Warming has already and will continue to interact with the global climate system and water cycle, e.g., [3,4], by triggering important feedbacks such as cloud radiative effects, snow, and surface albedo. It is also projected that different regions will demonstrate variable climatic sensitivities to global warming. Generally, the Northern Hemisphere’s high-latitudes and the mountain regions will show more warming than their counterparts [5,6,7].
High mountains of the Hindukush–Karakorum–Himalayans contain large volumes of glaciers that are periodically replenished by precipitation from the Western Disturbances and South Asian Summer Monsoon, e.g., [8,9,10]. Many large rivers originate from these mountains to meet the water needs of nearly a billion people in South Asia, e.g., [11]. In addition to seasonal precipitation, the regional cryosphere serves as a dynamic control to regulate year-round flows in these rivers [12,13].
The Indus River system depends heavily on the glacier and seasonal snow melting within these high-mountain regions, e.g., [14]. Considering the climate hotspot nature [15] of the Upper Indus Basin (UIB), an accurate assessment of its climatic response towards projected warming is highly desirable for supporting regional adaptations through scientific evidence. Notably, the temperature projections in the UIB are crucial as they influence future water availability and cryosphere stability.
However, the UIB has shown a somewhat different response to global warming during recent periods, e.g., [16]. For instance, in contrast to the global retreat of glaciers and ice fields [17,18], some evidence of glacial surging or at least stability has often been reported, particularly around the Karakoram—the so-called Karakoram anomaly, e.g., [19,20,21]. Such glacial responses also contradict the adjacent eastern Himalayans and the Tibetan Plateau, where retreat seems more robust [9,22]. Moreover, a decreasing diurnal temperature range (DTR), e.g., [23] and a greater increase in maximum temperatures, e.g., [24,25,26] over the UIB are different patterns than the globally increasing DTR, e.g., [27,28], and prominent warming of minimum temperatures over adjacent China and Tibetan Plateau, e.g., [29,30]. Additionally, elevation-dependent warming (EDW) is well accepted globally, e.g., [7,31], but some recent studies have argued its relevance within the UIB, e.g., [32,33].
Apart from these observational anomalies, there are more contradictions about future temperature patterns over the UIB. For example [32], has concluded a year-round cooling that is stronger in the winter period, which is in stark contrast with many earlier studies, e.g., [23,34,35,36]. While most trend analysis studies have predicted a summer cooling, e.g., [23,36,37], almost all downscaling studies, e.g., refs. [38,39] have projected consistent warming on seasonal and annual scales. Moreover, the magnitude of projected warming differs significantly among different studies. For instance, a recent study projected about 6 °C warmer UIB [40], but nearly half of this warming is reported by [41] under similar radiative forcing. Considering greater sensitivities of the Indus flows towards warming magnitude, where 1 °C rise in the mean temperature can increase up to 16% glacial flows [42], such warming discrepancies can seriously implicate the adaptation planning.
Compared to precipitation, the regional temperatures result from relatively more straightforward processes, show less spatial variability, and the actual high-altitude measurements are more reliable (reduced wind drift influence). Still, regional studies show more contradictions with respect to temperature than precipitation signals over the UIB, as discussed earlier. For instance, increased (decreased) precipitation during the monsoon and winter seasons (pre-monsoon) over the UIB is robust among many studies, e.g., [35,36,37,38], yielding at least consensus on the seasonal direction of future precipitation changes. It should also be noted that some precipitation observations exist over very high-altitude regions through periodic mass balance campaigns, e.g., [20], to improve our understanding of regional precipitation variability. However, comparable temperature measurements are not available, and spatial inferences, which are mainly drawn through low-altitude observations, may increase temperature uncertainty among studies.
Such contradictions certainly warrant further scientific efforts to improve the quality of temperature projections. New observational sites, particularly within the UIB, should help in this regard, but it is still an ongoing process. Meanwhile, exploiting the available observational profile complemented significantly by the recent high-altitude observatories within the UIB can offer new simulation advantages [43]. Following a sub-regional analysis, adopting a suitable statistical downscaling approach, uncertainty quantification, and implementing a model ensemble are some options that may improve temperature simulations in this region. Ref. [43] argue that the basin characterization using climate patterns rather than arbitrarily defined sub-regions, e.g., refs. [36,40] can support a more realistic climate analysis.
Previous studies highlighted large cold biases over the UIB in different GCM simulations, e.g., [44,45,46]. Model experiments [44] further showed that regional GCM limitations are systematic and irrespective of the model horizontal resolution. The evaluation of high resolution (0.44°) RCMs under the Coordinated Regional Climate Downscaling Experiments over the South Asian domain [47,48] and fine-scale (up to 4 km resolution) WRF simulations also yielded cold biases over the UIB, e.g., [49,50]. As biases in different GCMs/RCMs are systematic, statistical treatments like bias corrections are necessary for realistic climate change analysis, e.g., [39,51,52,53]. However, inadequate observational profile, e.g., [43,54] and unreliable observational proxies, e.g., ref. [55] may not accurately correct such systematic biases, particularly over high-altitude regions. Similarly, the uncertainty analysis using GCM simulated temperatures and insufficient observations may lack fidelity, e.g., [40]. In contrast, the GCMs’ ability to simulate atmospheric circulation dynamics has considerably improved over time, e.g., [56,57]. These atmospheric patterns can be used to construct downscaling models to infer more reliable temperature distributions. Despite these advantages, only a few studies, e.g., [58], have used such predictor-driven temperature downscaling in our region. To provide a different and reliable simulation perspective, we used atmospheric predictors for (i) temperature downscaling, (ii) climate uncertainty quantification, and (iii) GCM selections to assess fine-scale temperature changes using a model ensemble over the UIB. Such temperature modeling has not been implemented in this region yet and holds the potential for further improvements.
We adopted large-scale atmospheric patterns from a reanalysis dataset to model observed maximum and minimum temperatures (hereafter Tmax and Tmin, respectively) over the entire basin by following a robust statistical downscaling framework. We incorporated recent but hydrologically critical high-altitude observatories to improve spatial and EDW inferences over the basin. K-means clustering was employed beforehand to identify homogeneous climate sub-regions for fine-scale analysis. We further quantified the reference and model level uncertainties by comparing temperature governing predictors with two other reanalysis datasets and the historical simulations of the GCMs of the Coupled Model Intercomparison Project 5 (CMIP5) [59]. The principal drivers of the reference and GCM uncertainty were also identified. The predictor output of RCP4.5 and RCP8.5 scenarios were used to derive ensemble temperature changes during the 21st century. The Lower Indus considerations can estimate future water demand to support basin-level water management.
2. Study Area
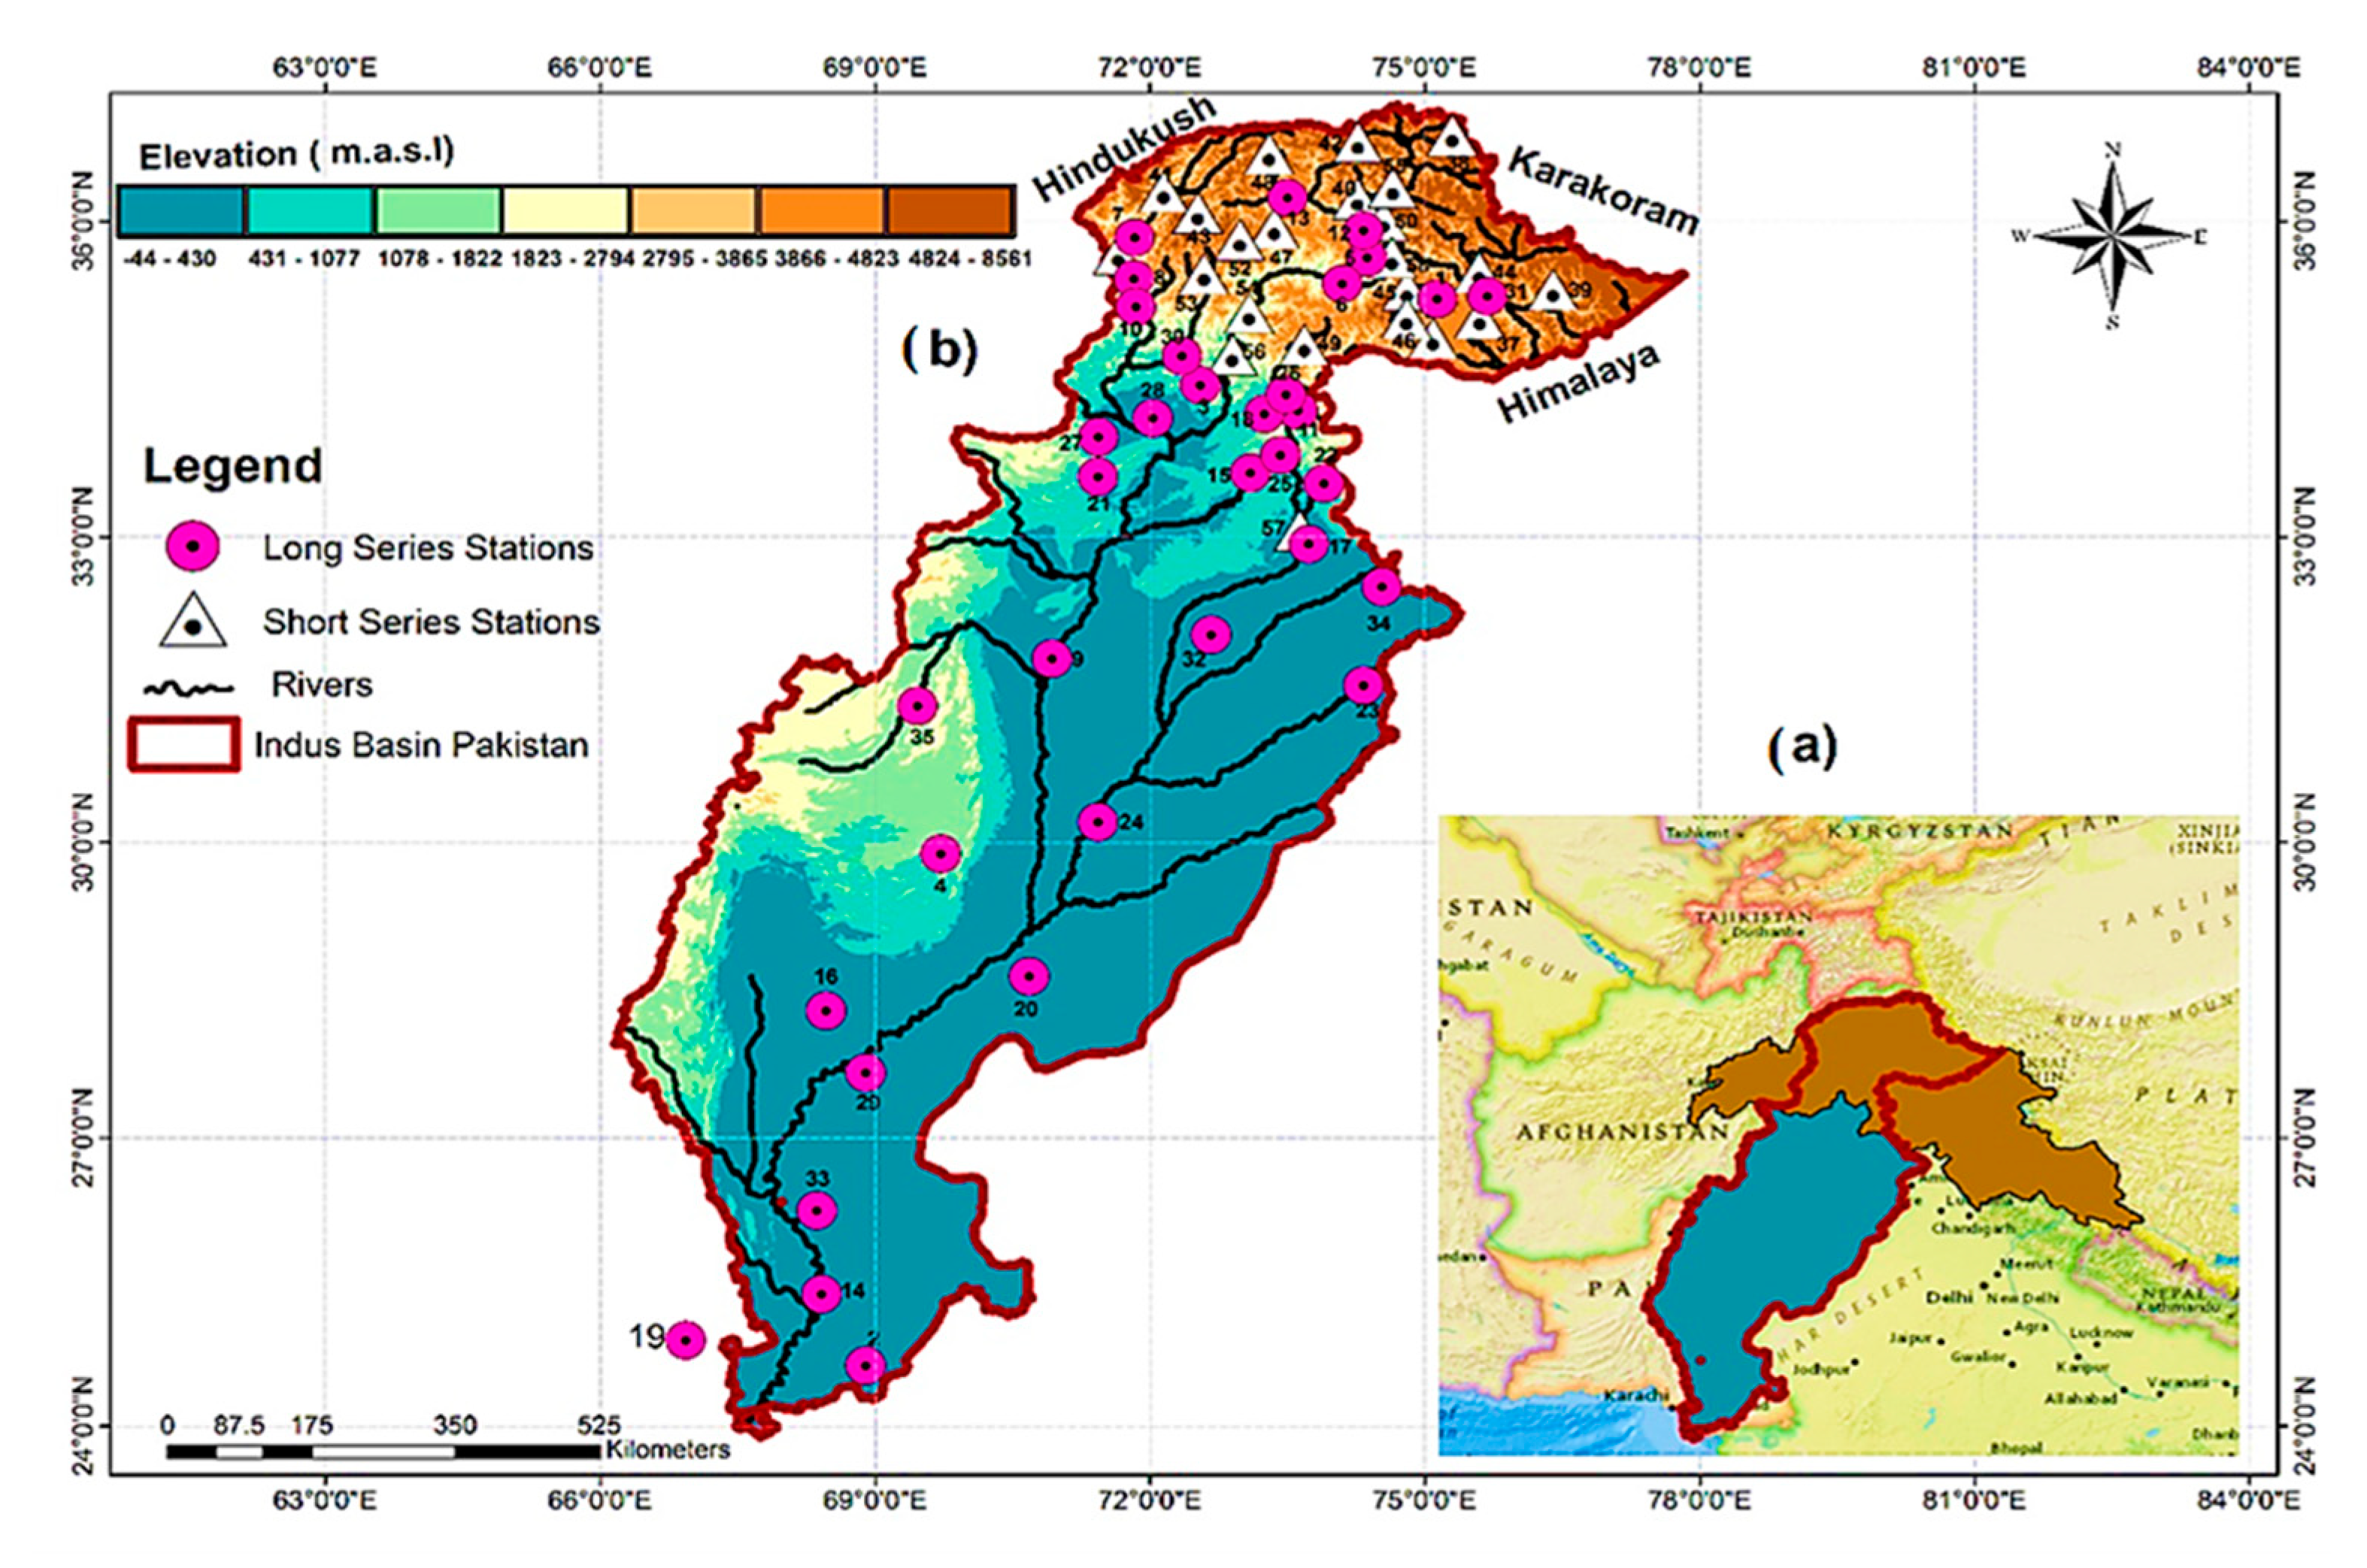
The transboundary Indus River system of Pakistan (Figure 1a) derives runoff from high mountains of the Hindukush–Karakorum–Himalayans that also include K2 and ultimately descends into the Arabian Sea. In the UIB, covering approximately 4.03 × 10⁵ km2 [60], the summer extent of glacial and perennial snow is estimated at 13%, and the regional cryosphere exceeds 70% of the UIB during the winter period [61]. The summer freezing-line elevation within the UIB ranges from 3550 m to 5500 m above mean sea level [62]. The Western Disturbances, Indian Summer Monsoon, and Tibeaten-high regulate year-round moisture and energy fluxes into the basin. A combination of the glacial, nival, and pluvial regimes whose relative contributions vary further with hypsometry and dominant modes of the large and regional scale circulations, regulate the runoff from UIB, e.g., [20,50]. In contrast, the Lower Indus has an arid to semi-arid climate and depends heavily on water melting from the UIB.
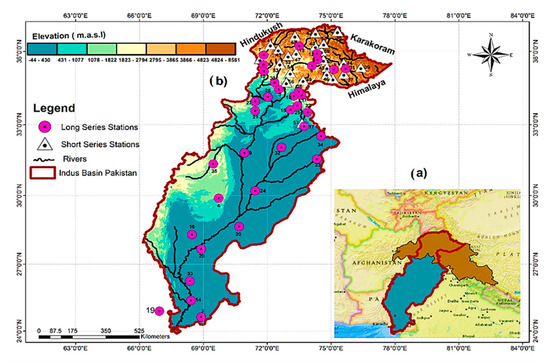
Figure 1.
(a) The transboundary Indus River Basin indicating Upper Indus Basin (brown), Lower Indus (blue), and demarcation of the study area (red boundary). (b) Locations of the meteorological stations used in the study. Pink circles show the longer time series (1979–2015), and triangles indicate high-altitude stations with shorter time series (1994–2015). Note that the color scheme in (b) represents the elevation variation in the study area. The study stations’ geographic details are given after the numbers shown in (b) in Supplementary Materials as Table S1. Adapted with permission from ref. [43].
Global warming has a twin menace for the basin sustainability: changes in large-scale circulations and alterations of the melt contributions. Full energy balance studies alongside precipitation analysis are required to assess the basin’s future hydrological response precisely. Among others, ref. [42] successfully demonstrated the effectiveness of different temperature measurements to assess seasonal water availability from the UIB.
We only focused on Pakistan’s basin area (Figure 1b) due to data availability constraints from other countries. The study area represents the largest and the highest fraction of the basin and is regarded here as a representative for the whole basin.
3. Data and Methodology
This study is a part of the regional project that aims to support climate adaptations across the study basin by analyzing key hydrological variables. Ref. [43] have modeled the observed precipitation dynamics using predictor-predictand relationship by accounting for observed spatial variability on seasonal scales. Ref. [63] further used precipitation governing predictors to model future precipitation response and associated uncertainties amid selected radiative forcing scenarios.
Here, we further extend our analysis to identify Tmax and Tmin governing (atmospheric) patterns within a statistical downscaling framework, quantification of the reference and GCM level uncertainties, and predictor-driven future temperature changes over fine-scales. We used the Indus Basin’s climate characterization of [43] to provide a consistent and coherent perspective about projected precipitation and temperature changes that simultaneously govern the regional hydrology.
We briefly provide details of the adapted regionalization scheme, downscaling model development, and GCM ranking processes in the following to give the necessary background for the current work. More details are available in [43,64].
3.1. Predictand Data
We used monthly temperature (Tmax and Tmin) time series of 58 observatories located across the study basin (Figure 1b) that simultaneously provide historic (low-altitude) and more recent high-altitude climate structures within the UIB. The high-altitude considerations with 23 stations despite shorter time series (average of 17 years) provided a unique opportunity to assess EDW and stability of the regional cryosphere in the light of observations. Table S1 of the Supporting Information provides more details about the study stations.
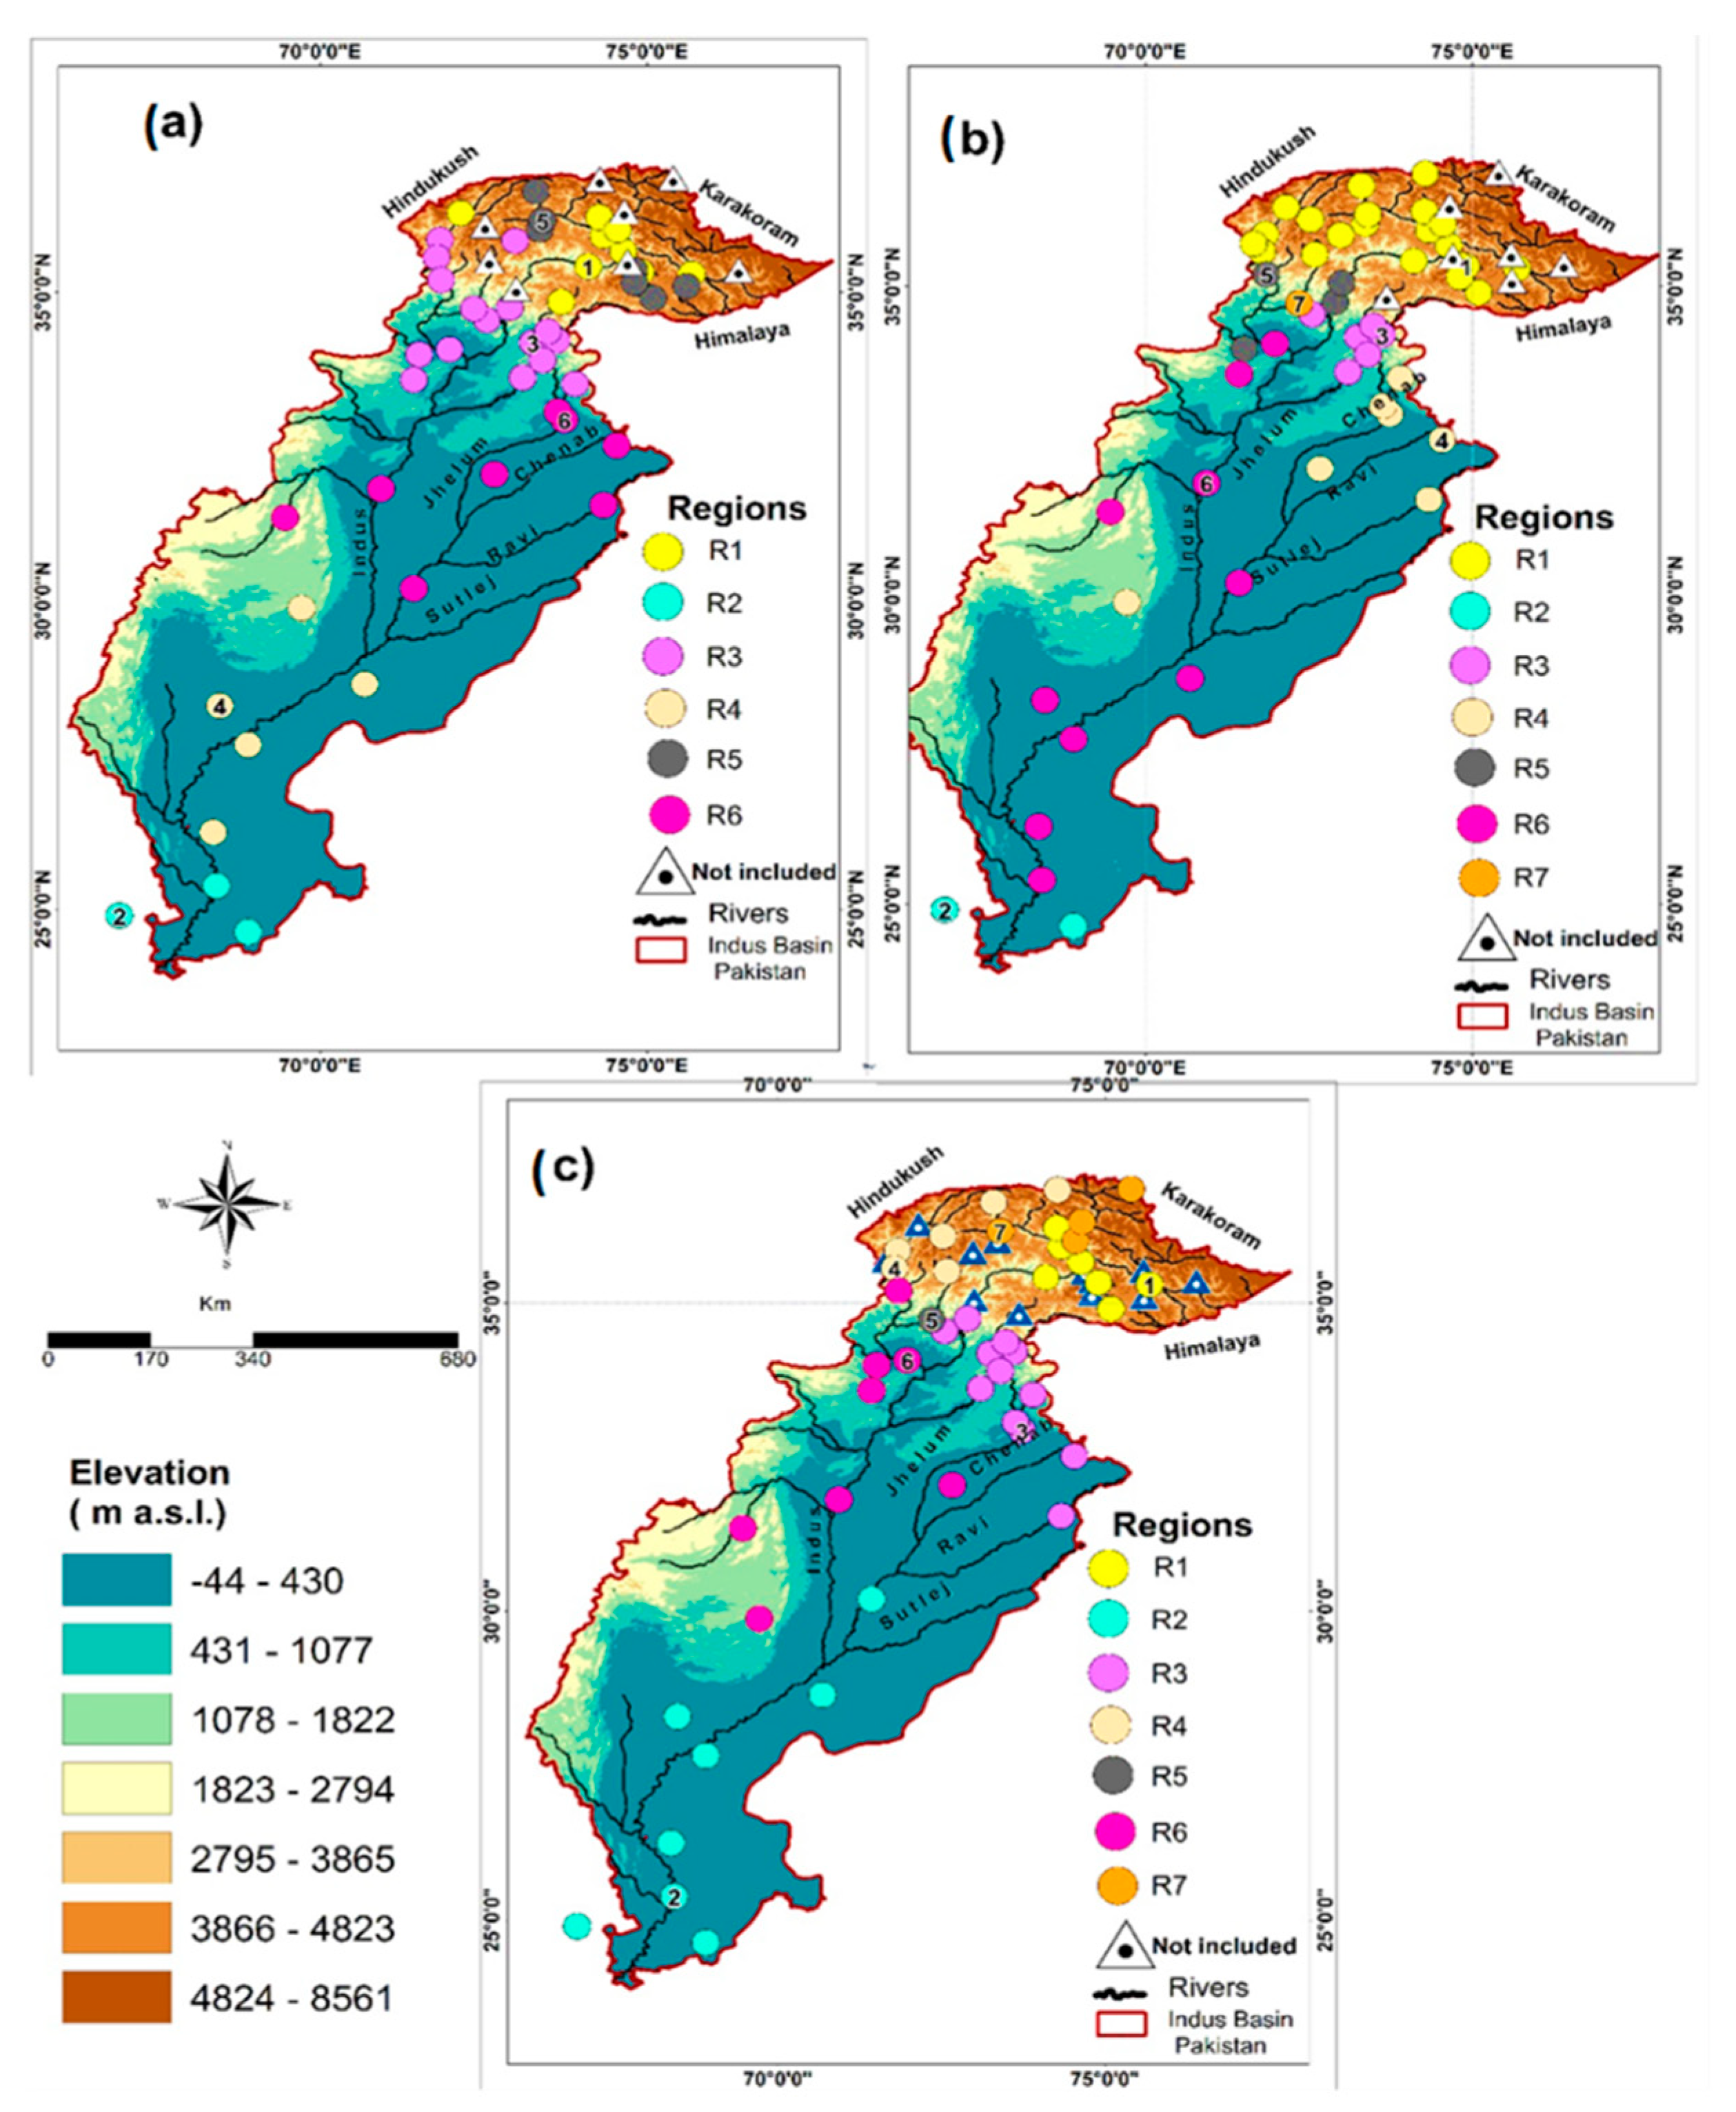
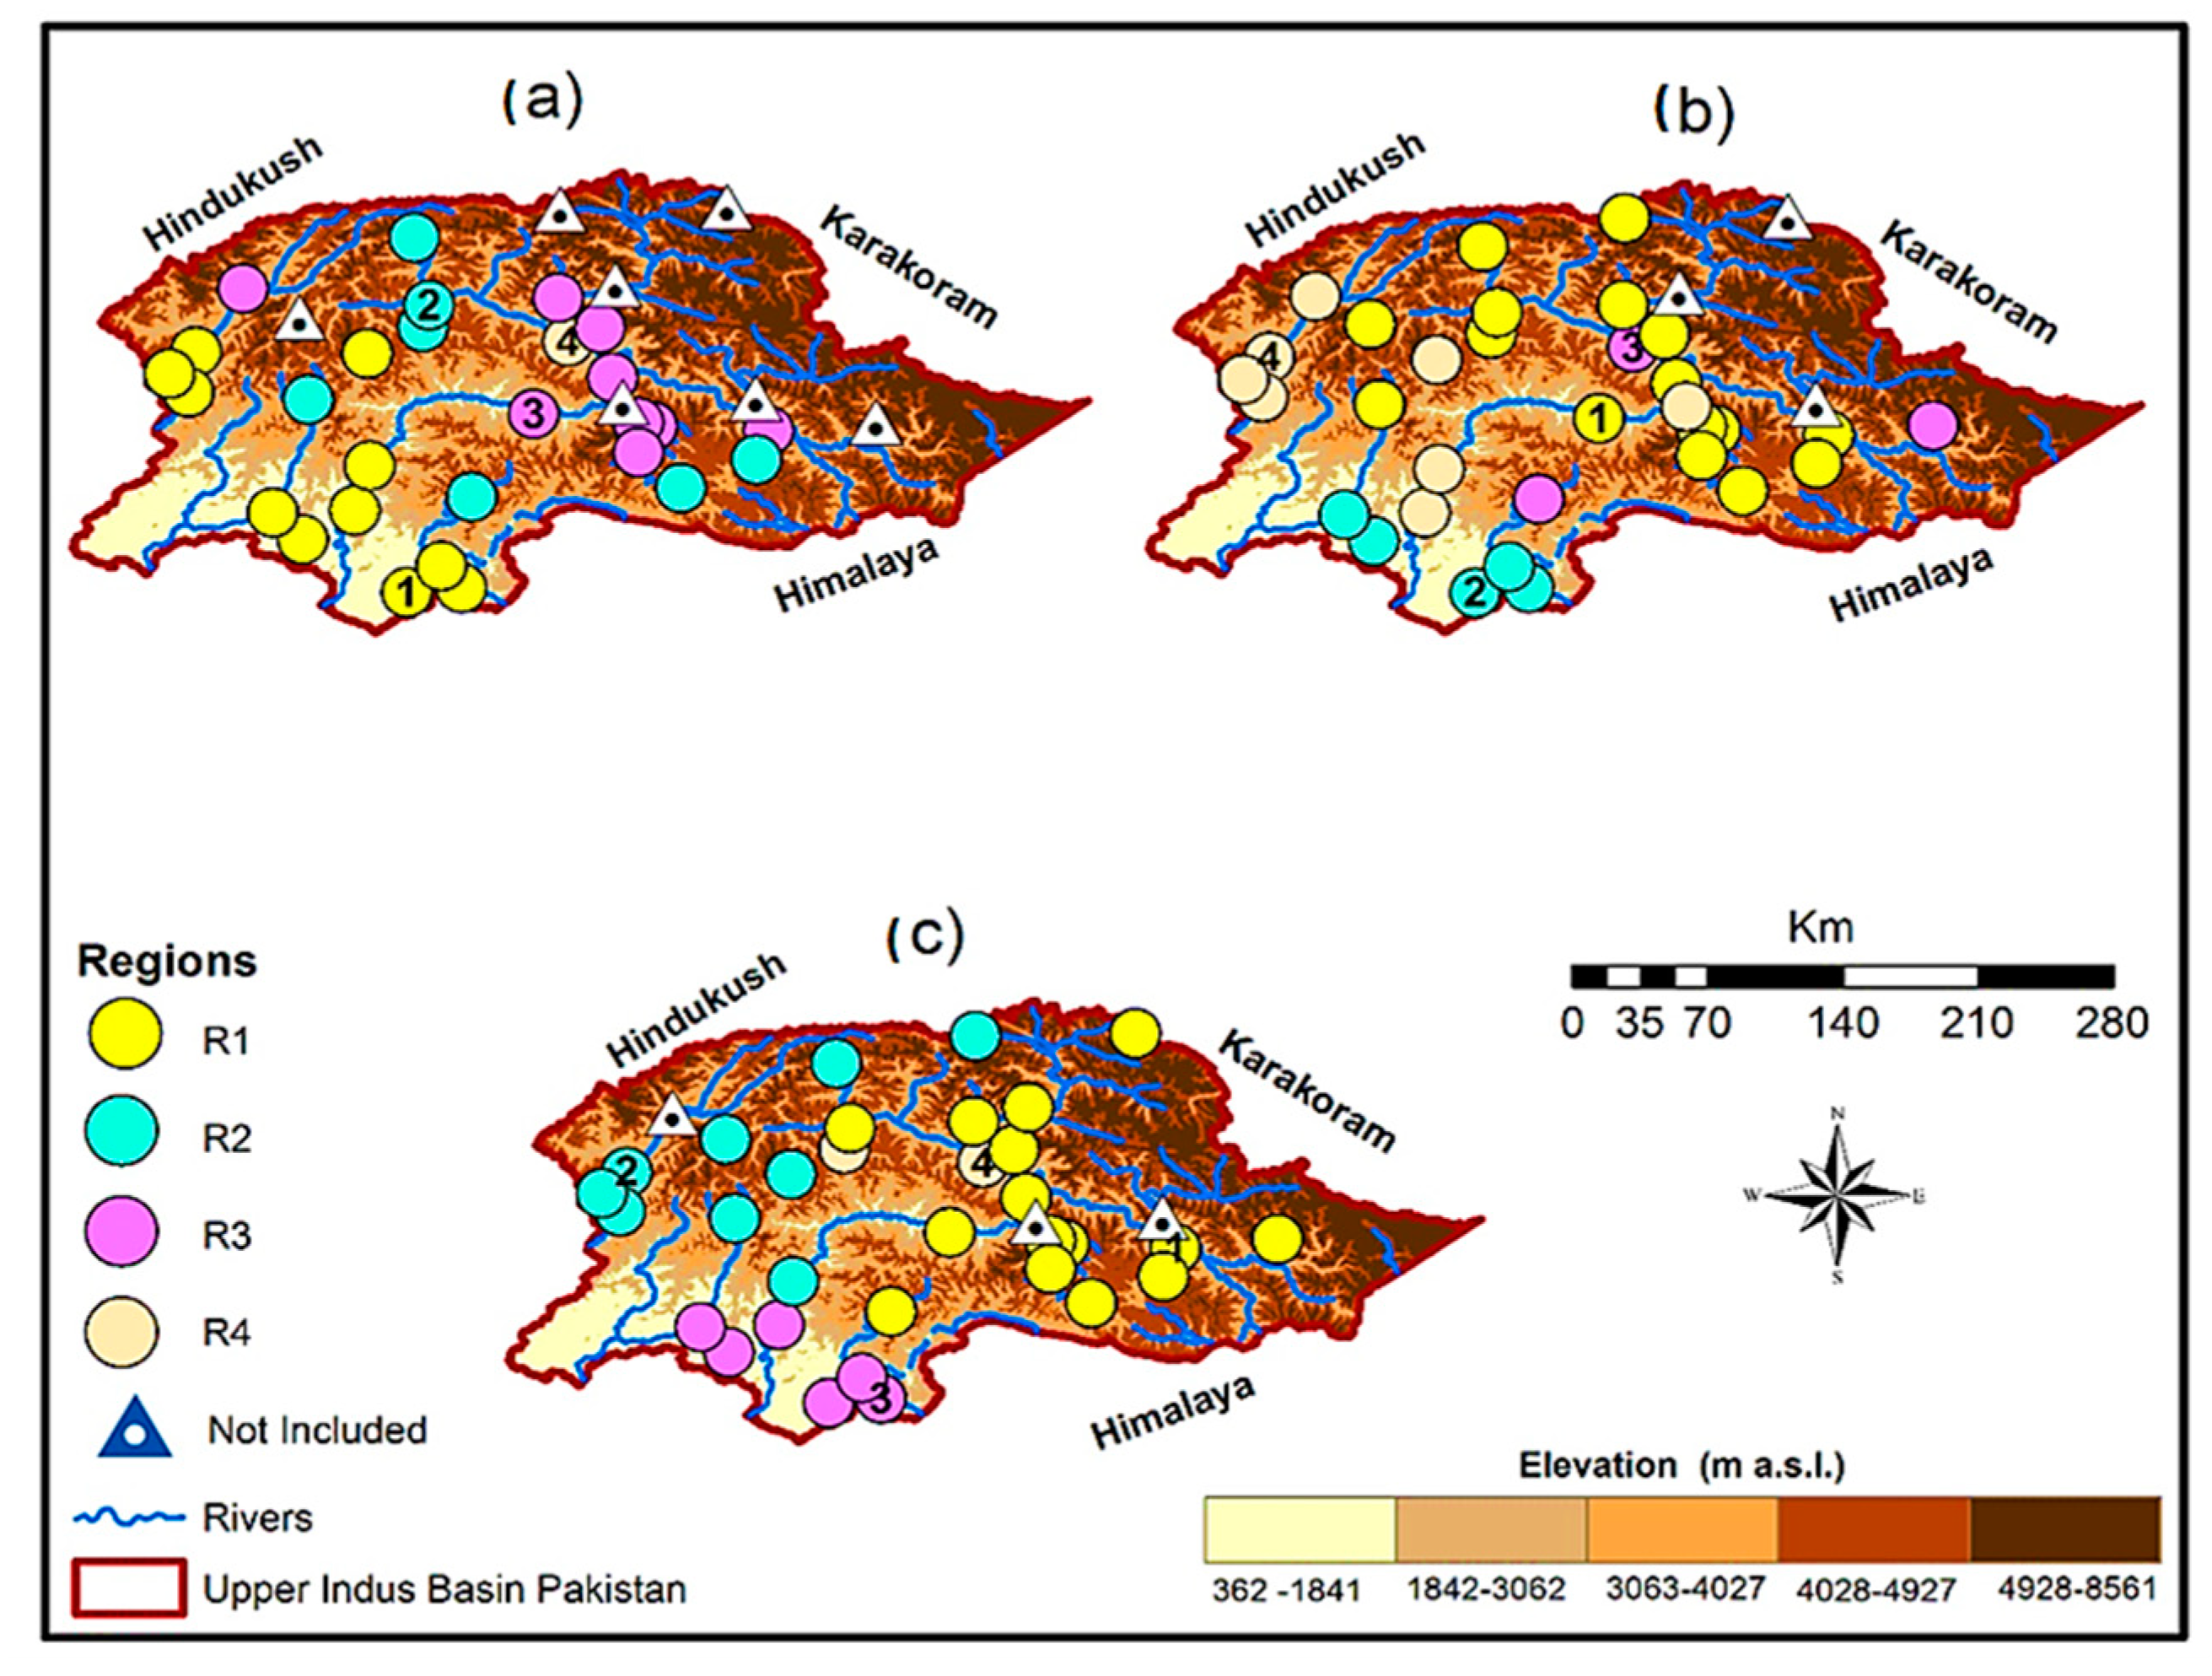
Ref. [43] identified three major precipitation seasons across the Indus basin. These include the winter season (WS) (December to March), pre-monsoon season (PMS) (April to May), and the monsoon season (MS) (July to September). K-Means clustering, e.g., [64], using Spearman correlation as a distance measure, was used to identify sub-regions with similar precipitation variability. During regionalization, the objective was to maximize (minimize) the correlation within (across) regions to define sharp regional boundaries. The cluster members of a region exhibit similar climate characteristics. Two different regionalization experiments were performed to analyze precipitation dynamics over the entire basin and separately over the high-altitude UIB. The regionally representative stations (RR) were identified through multiple considerations, such as station homogeneity, length of time series, and correlation with regional centroids. The time series of RR served as predictands for downscaling models. The output of two regionalization experiments is shown in Figure 2 and Figure 3, respectively. For more details, see [43].
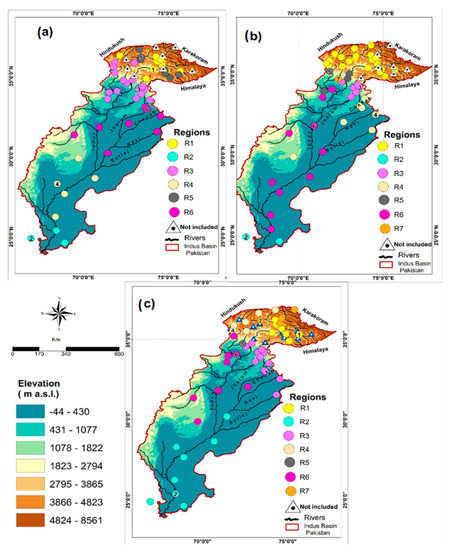
Figure 2.
The climate characterization of the Indus Basin of Pakistan using K-Means cluster analysis. Different colored circles represent the identified regions. In the legend Regions, R stands for the region, and the following number indicates its number (i.e., R1 is region 1, and so on). The circles with the same color indicate the members of a given region that show similar co-variability. The circles with numbers define the location of regional representative stations (RR). For example, a circle with the number 2 indicates the representative stations (RR) location of the second region (i.e., R2). Triangles represent those stations, which could not be assigned to any of the identified regions. The WS (a), PMS (b), and MS (c) regionalization. Adapted with permission from ref. [43].
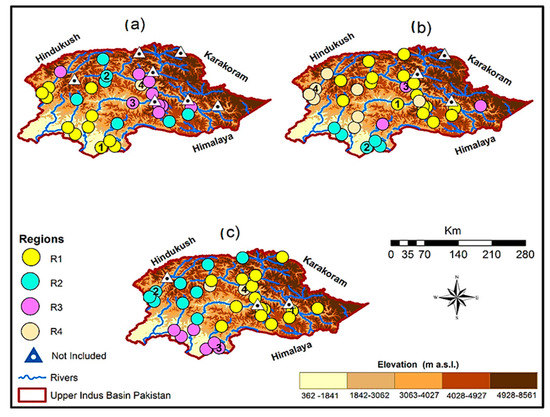
Figure 3.
It is the same as Figure 2 but showing regions under the high-altitude Upper Indus Basin (UIB) regionalization experiment. Adapted with permission from ref. [43].
We adapted the precipitation regions and associated RR to downscale Tmax and Tmin distributions to provide consistent feedback on key hydrological variables across the basin. The identified regions cover the southern Himalayans, trans-Himalayans (including the Karakoram), and northwestern (Hindukush) parts of the UIB that mainly regulate the water supply. In addition, a significant clustering of recent high-altitude observatories in these regions can also facilitate inferences about EDW. Similarly, the projections over the irrigated plains primarily represent the seasonal water demand in the Lower Indus. Thus, our adapted regionalization framework provides realistic grounds for a comprehensive water supply-demand analysis over the basin. We also tested RR for homogeneity by following [65].
3.2. Predictor Data
We used ERA-Interim reanalysis data [66] to identify governing predictors of the observed Tmax and Tmin patterns over the basin. We did not use ERA5 [67] as it was not publically available in 2016 when our research began. Existing regional studies, e.g., [43,60] were consulted for initial predictor selection. The variables (Table 1) include different circulation-dynamic (geopotential heights, sea level pressure, meridional, and zonal winds), thermo-dynamic (relative and specific humidity), and thermal parameters (air temperature) across the troposphere. Predictors were re-gridded to 2°× 2° spatial resolution. The monthly averages of each available predictor were grouped into the seasons to correspond with RR time series of the temperature predictand.

Table 1.
Seasonal contributions of different predictors (in %) that helped to resolve observed temperatures (Tmax and Tmin) over the Indus basin of Pakistan. Multiple linear regression models were used to identify these temperature-governing predictors. Column 2 provides the list of large-scale atmospheric predictors used in this study, where the symbols zg, va, ua, hur, hus, ta, and psl denote the geopotential heights, meridional winds, zonal winds, relative humidity, specific humidity, air temperature, and mean sea level pressure fields, respectively. The number after each predictor symbol reflects the atmospheric level (pressure level in hPa. The last column shows average predictor frequencies over all three seasons.
A larger domain (10° E to 100° E, 10° N to 60° N) was used for circulation-dynamic and thermal variables compared to thermodynamic predictors (64° E to 80° E, 22° N to 40° N) to account for both large-scale and more localized forcing on regional temperatures. We performed S-mode Varimax-rotated principal component analysis (PCA) [68] separately on each predictor field for dimension reduction. Using a modified dominance criterion [69] with some additional constraints [43], we retained PCs that sufficiently explain predictor variance (Table S2). The resulting PC scores (loadings) served as predictor time series (locations of the centers of variation) for downscaling models.
3.3. Statistical Modeling Framework
We selected the multiple linear regression framework to model predictor-predictand relationships in the observations since the time series of nearly all RR follow the normal distribution (e.g., Shapiro–Wilk test). To identify robust atmospheric drivers of the regional temperatures (Tmax and Tmin) from the chosen predictors (Table 1), we adapted the downscaling framework of [43]. The typical downscaling framework uses the mean squared error skill score (MSESS) as a performance criterion [64] within cross-validation through 1000 random calibration-validation iterations. In addition, multi-collinearity among predictors was also considered during the modeling process.
The models that showed maximum MSESS during the calibration and validation process using independent predictors were selected for downscaling. We also calculated root mean square errors (RMSE) and coefficient of determination (R2) to evaluate the statistical performance. The final models were further tested for their error-distributions and heteroscedasticity (Breusch–Pagan test) to meet other multiple linear regression requirements. We constructed downscaling models for the RR of each region to infer mean temperature variations in the respective regions.
3.4. GCMs: Predictor-Based Downscaling
Initially, we considered more than 60 CMIP5-GCMs. However, the availability of governing predictors (Table 1) and their complete spatial coverage over the study domain restricted this number to only eight. Many GCMs have large simulation gaps over the high-mountains for lower-tropospheric predictors due to the intersection of pressure coordinates with regional elevations. These simulations gaps can not be filled with interpolation schemes [64] and restrict the computation of spatially consistent PCA during the historical period. Therefore, we could only use the output of these eight models during the historical (1976–2005) and two future time-slices (2041–2070 and 2071–2100). We considered governing predictors from two scenarios (RCP4.5 and RCP8.5) for temperature projections. These RCPs represent the managed (RCP4.5) and unabated (RCP8.5) societal response throughout the 21st century and are considered suitable for supporting regional adaptations [70]. Further, we only considered the first realization (“r1i1p1”) of these GCMs for downscaling. Table S3 provides information about the CMIP5 models used in our study.
Before downscaling, the GCM predictors were also conservatively re-gridded to 2° × 2° to match with ERA-Interim predictor resolution. The model predictors were standardized over the historical and future time-slices (separately for each scenario). These standardized modeled variables were projected onto the corresponding PC loadings of ERA-Interim to generate new predictor time series (more details on this method in [71]). The new predictor time series were used in the ERA-Interim based regression models to derive downscaled historical and future Tmax and Tmin distributions. The difference between downscaled historical and two future time-slices (separately for each RCP and time slice) was then used to compute median temperature changes over the basin.
We also used the signal-to-noise ratio (SNR) to evaluate the robustness of projected warming (signals) against the observational uncertainty (noise) at the individual model and ensemble levels. This typical variate of the SNR can be computed by dividing median changes with historical standard deviations, and an SNR > 1 indicates the robustness of change signals compared to observational uncertainty.
3.5. GCM Ranking for Uncertainty Quantification
Pomee and Hertig [64] developed a stepwise procedure to rank GCMs based on their ability to simulate precipitation-governing predictors in the historical period. They compared loading patterns of the S-mode PCA of governing predictors from a reanalysis dataset with corresponding GCM-simulated variables to evaluate such reference-model correspondence. A simple performance score (PS) was computed using two of the three summary statistics of the Taylor diagram [72] to quantify the predictor correspondence. Regression coefficients were used as weights during the model evaluation process to identify GCMs that better simulate more influential predictors in a given regression model. Lastly, the consideration of model performance over multiple regions helped to select a GCM with simulation advantages over spatial scales.
We also used this model ranking process to evaluate the GCMs’ performance in representing temperature governing predictors (Table 1) during the overlapping historical period (1979–2005). Note that ERA-Interim only offers data from 1979 onwards. Based on predictor-simulation similarities (i.e., PS), we further quantified the model (and ensemble) level uncertainties ((1−PS) × 100) to assess the reliability of subsequent projections at different spatiotemporal scales. Appendix A provides more details on this procedure.
3.6. Reference Uncertainty
We further consider temperature governing predictors (Table 1) from ERA5 [68] and NCEP-NCAR-II [73] reanalysis datasets to evaluate the regional robustness of ERA-Interim predictors. The weighted PS of these two additional reanalysis datasets (computed separately) was used to quantify the range of reference uncertainty and define the usefulness of ERA-Interim for temperature projections over the study basin.
4. Results and Discussion
4.1. Governing Predictors
Table 1 shows the relative frequency of predictors that govern regional temperatures and identified through regression models. Different lower-tropospheric conditions overwhelmingly dominated by the wind components mostly resolved the basin-wide seasonal distributions of both temperatures. However, near-surface humidity (hur1000, hus1000) also played an important role, particularly during the westerly-dominated seasons (i.e., WS and PMS). Our downscaling framework also recognized the complexities of the MS dynamics by identifying relatively more complex models (containing more predictors and atmospheric levels) compared to other seasons.
However, the predictors exhibited a stronger seasonality within and across the temperature fields. For example, the role of va850 (~61%) and ta850 (~30%) was maximum in the WS simulations of Tmax, but their importance as predictors reduced significantly during the warmer periods and reached the lowest levels during the MS (~10% and 9%, respectively). In contrast, va850 showed maximum contribution (~40%) during the MS to resolve Tmin simulations, but this predictor (along with ta850) could not influence Tmin patterns during the westerly-dominated seasons. For predictor symbols, please refer to Table 1.
Similarly, hur1000 showed maximum contributions (~35%) for modeling Tmax distributions during the PMS but remained ineffective in the WS. On the other hand, hus1000 (~27%) appeared as the most important predictor in resolving seasonal Tmin patterns, with the highest contributions during the WS (100%). Different zonal wind PCs also played a significant role in explaining Tmin distribution, particularly during the PMS. Similarly, strong seasonality was also apparent for the mid-tropospheric winds (va500 and ua500).
Statistically identified governing predictors can also explain the essential features of regional climatology. For example, the dominance of dynamic forcing (winds) during the MS and WS represent the strength of the easterly and westerly circulations that shape the regional climate during these periods, e.g., [43,74]. Similarly, the increased role of atmospheric humidity in the PMS simulations may represent regional convection due to seasonal warming. The specific humidity PCs that primarily explain the Tmin seasonal distributions may be connected to cloud radiative feedbacks.
4.2. Statistical Performance of Downscaling Models
Our downscaling framework, despite significant spatial variability in the basin, skillfully modeled the day (Tmax) and night (Tmin) time temperatures during all three seasons, as shown by the validation performance metric (i.e., MSESS, RMSE, R2) in Table 2 and Table S4. Validation performance reflects a downscaling model’s ability to transfer statistical relationship to other (unknown) periods and strongly influences the projection reliability.

Table 2.
Information about the identified sub-regions, regionally representative stations (RR), governing predictors, and the Tmax downscaling models’ statistical performance during all three seasons under the basin-wide regionalization experiment. The blue (violet) and black colors differentiate among the UIB (Lower Indus) regions and the entire basin. In the table, Reg. Alt is the altitudinal range (elevations in m above mean sea level) for a given region, Mean Obs. Temp indicates the mean observed Tmax at RR. Predictors (PCs) show the explaining variables (number of PCs). RMSE, MSESS, and R2 are the root mean square errors, mean squared error skill scores, and coefficient of determination during the calibration (Cal) and validation (Val) periods, respectively. Additionally shown are the average statistical performances over the UIB (Avg. UIB), Lower Indus (Avg. Lower Indus), and across the entire basin (Avg. basin).
However, the performance metric showed seasonality, varied with spatial scales, and between the temperature variables. For instance, the PMS simulations (Tmax and Tmin), dominated by various thermodynamic predictors, showed very high validation skills (average MSESS >88%) over the four UIB and two Lower Indus regions. Similarly, the WS models containing mostly the circulation-dynamic and thermodynamic predictors also demonstrated high simulation performance over the three UIB (MSESS ~80%) and two LI regions (MSESS > 83%). Therefore, the downscaling models showed high statistical skills for simulating observed temperatures during the westerly-dominated seasons that mainly regulate the regional cryosphere. Such skillful observational models also provide more reliable future inferences about cryosphere dynamics in these seasons.
However, the downscaling models showed relatively low MS performance, particularly for the Tmax simulations over the five UIB regions (MSESS ~70%). The statistical skills reduced further over the two Lower Indus regions. Interestingly, the validation skills lacked over those regions that show high temperatures (e.g., R3, R6, and R2). In these particular cases, the climatological reference showed a higher performance due to lesser inter-seasonal variation, and therefore the relative improvements of the downscaling models were reduced. Relatively high R2 and low RMSE values for these regions further supported this argument. The MS regional complexity, e.g., [45] may also contribute to the relatively low model performances. Still, the MS skills over the UIB were high enough to infer cryosphere response during the main melt season reliably.
In general, the Tmin models were simpler (fewer predictors were required) compared to Tmax and showed high statistical performance during all three seasons. Comparing seasons, the MS models were relatively more complicated for both temperatures. Interestingly, the HA regions were modeled with greater statistical skills during all three seasons, improving our understanding of projected temperature changes over these hydrologically sensitive regions. These skillful models may also help to assess seasonal water supply (UIB) and demand (Lower Indus) perspectives simultaneously to support integrated water management amid climate change scenarios.
4.3. Quantifying Uncertainties
4.3.1. Reference Uncertainty
We used the weighted PS (Table 3) of ERA-Interim predictors to quantify reference uncertainty. The PS represents the simulation robustness of ERA-Interim predictors against two other reanalysis datasets. Generally, a high PS strongly verified the ERA-Interim usefulness for regional temperature (Tmax and Tmin) modeling.

Table 3.
Quantification of the reference uncertainty for temperature (Tmax and Tmin) simulations over the study basin using the weighted PS of ERA-Interim predictors. The PS was computed by separately comparing ERA-Interim predictors against the variables of ERA5 and NCEP-NCAR-II reanalysis datasets and shows the strength of predictor correspondence among different datasets. The regions are grouped into the UIB, and Lower Indus scales to assess spatial predictor correspondence between these reanalysis datasets during each season. The last two columns show the range of reference uncertainties in percentage ((1-PS) × 100).
However, the reliability of ERA-Interim predictors varied over the seasons. For instance, the WS predictor correspondence among three reanalysis datasets was maximum for both temperatures. The MS and PMS predictor agreement followed this. From the perspective of temperature variables, the simulations of Tmax predictors were more robust than Tmin. Among reanalysis datasets, the ERA-Interim predictors showed greater correspondence with ERA5 during the WS and MS. However, the NCEP-NCAR-II better simulated the PMS governing patterns. Such predictor matching suggests ERA-Interim simulations’ robustness against at least one of the two additional reanalysis data during all seasons. If both additional datasets had shown poor correspondence, the fidelity of ERA-Interim predictors would have certainly decreased. Therefore, using ERA-Interim predictors for seasonal temperatures was justified.
A striking feature relates to the substantial agreement among multiple datasets for Tmax predictors over high-altitude regions in all three seasons (e.g., MS-R4, R7, WS-R5, and PMS-R1). These are hydrologically the most critical regions where Tmax regulates the seasonal melting. Therefore, their robust simulations during the observations can also provide better inferences about projected cryosphere response and water availability under global warming scenarios.
Among predictors, the thermodynamic variables (hus1000 and hus1000) largely controlled the magnitude of reference uncertainty. For example, the simulations of hus1000 in NCEP-NCAR-II were significantly different from ERA-Interim (lower PS) during the WS. As this predictor alone resolved the basin-wide Tmin distributions (Table 1); therefore, the associated uncertainty increased (up to 31%). Similarly, hur1000 helped to model the Tmax patterns over multiple sub-regions during the PMS (i.e., R1, R3, R5, and R6). However, ERA5 showed more differences in its simulation, which increased the seasonal uncertainty. Likewise, one influential PC of hur1000 (i.e., high regression coefficient) helped to resolve MS-Tmax conditions over the two regions (R3 and R6). However, both additional datasets showed more differences in the representation of hur1000, which increases uncertainty over these particular regions. Such differences in thermodynamic variables may stem from variations in simulation models and parameterization schemes representing regional convection that strongly influence local climate. The variable resolutions of the reanalysis datasets, e.g., ref. [43] may also contribute to the simulation differences.
Further analysis revealed that the spread of humidity predictor variables mainly reduced the PS, despite higher inter-reference correlations (~0.50) in many of these cases. Although the uncertainty magnitude can be reduced by not including predictor spread during uncertainty quantification, we argue that predictor variance considerations are essential due to their importance for climate change analysis. However, the simulations of various dynamic and thermal predictors, which largely govern the basin-wide temperature distributions, are quite robust among these datasets. Therefore, considering regional complexity and the variety of governing predictors, such finer-scale inter-reference robustness provides strong confidence in using ERA-Interim for temperature modeling.
4.3.2. Model Uncertainty
We similarly used the weighted PS to identify better performing GCMs for both temperatures. Table 4 shows the performance of individual models and their ensemble in reproducing ERA-Interim simulated Tmax predictors. Generally, most GCMs showed a stronger inter and intra-region correspondence with ERA-Interim variables during the WS and PMS. Due to the MS complexities, the GCMs showed relatively smaller PS (more uncertainty). Interestingly, the model ensemble showed high skills in representing the governing patterns over most high-altitude regions during all three seasons (e.g., WS-R5, PMS-R1, PMS-R5, MS-R4, and MS-R7). In addition, the model ensemble showed nearly similar performance (averaged) over the UIB and Lower Indus regions, except for the WS.

Table 4.
Same as Table 3, but showing General Circulation Model (GCM) uncertainties for Tmax predictors. Here the ERA-Interim predictors were individually compared with the corresponding GCM simulated predictors during the overlapping historical period 1979–2005 to compute weighted PS. The last column shows the ensemble performance over various scales. Blue (orange) marks indicate the best (worst) GCM according to the highest (lowest) weighted PS.
The model ranking also helped to distinguish the most suitable model(s). For example, during the WS, CMCC-CM showed the maximum predictor correspondence (average PS = 0.72) over three UIB regions (R1, R3, and R5). The predictors from this particular GCM best simulated the Tmax predictors over the two larger regions located on either side of the Himalayans divide (R1 and R3). The model also showed comparable performance over the third high-altitude region (R5). The particular model even more strongly represented the predictors (average PS = 0.81) over Lower Indus regions (R4 and R6). Even though only the skill during the historical period (and not in the scenario period) was assessed, its use for basin-wide temperature projections appears favorable.
During the PMS, all GCMs showed a high PS over the entire basin predominately due to better agreement of the hur1000 simulations with ERA-Interim. However, MPI-ESM-LR demonstrated very high and consistent performance (average PS = 0.76) across the four UIB regions and two LI regions (average PS = 0.81), which justifies its selection for projections over the entire basin. All GCMs struggled to model the MS governing patterns effectively, but MPI-ESM-LR showed a relatively better correspondence with reference reanalysis over the five UIB regions (average PS ~50%). In addition, a different model (Nor-ESM1-M) demonstrated simulation advantages over the two LI regions.
Similarly, we evaluated the available GCMs for Tmin predictor simulations (Table S5). Overall, these models showed relatively higher PS over different regions but with a similar seasonality (i.e., higher correspondence during the westerly periods than the MS). CNRM-CM5 (MPI-ESM-LR) showed the highest and consistent correspondence with the reference reanalysis over multiple regions in the basin during the WS and PMS (MS).
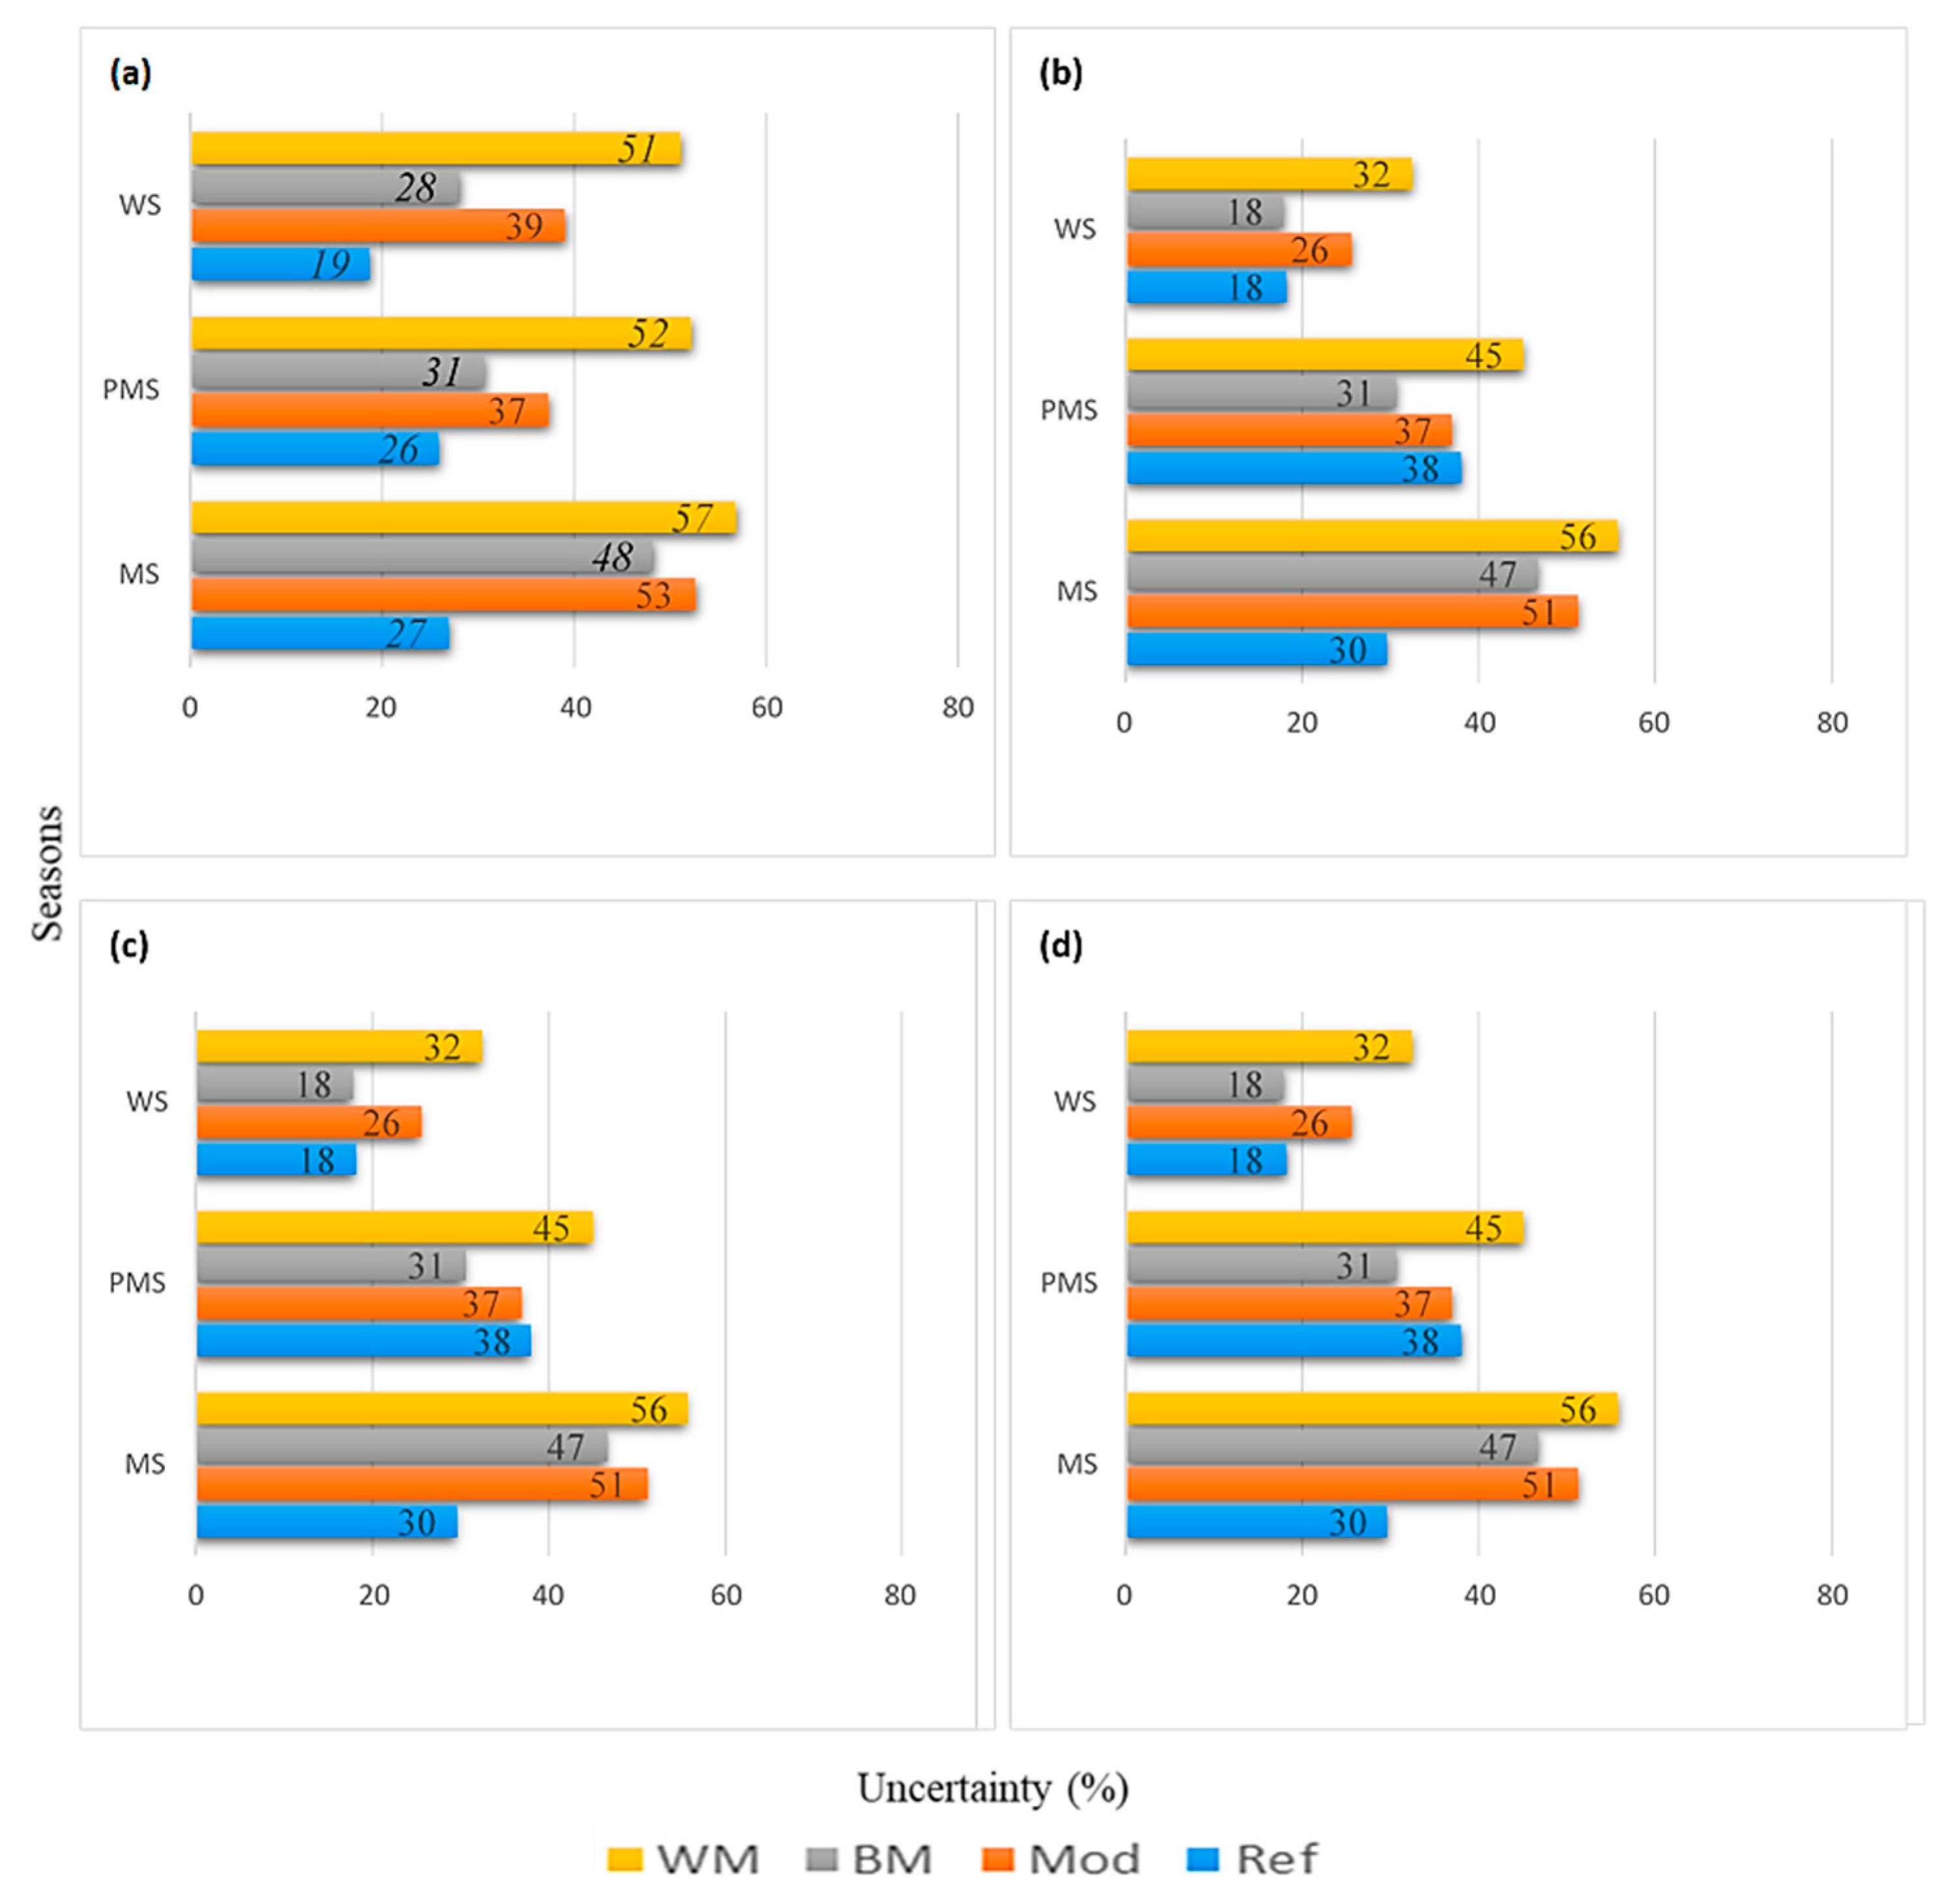
Figure 4 presents the summary of the reference (model) uncertainty for both temperatures (averaged) over the UIB and LI regions. Generally, the magnitude of (seasonal) reference uncertainty remained lower than the GCM ensemble for both temperatures. Moreover, the best seasonal models showed significant simulation improvements over the model ensembles. Similarly, the range between the worst and best models was quite large and represented the ensemble diversity. While the reference uncertainty was mostly high during the PMS, the model uncertainties were maximum during the MS.
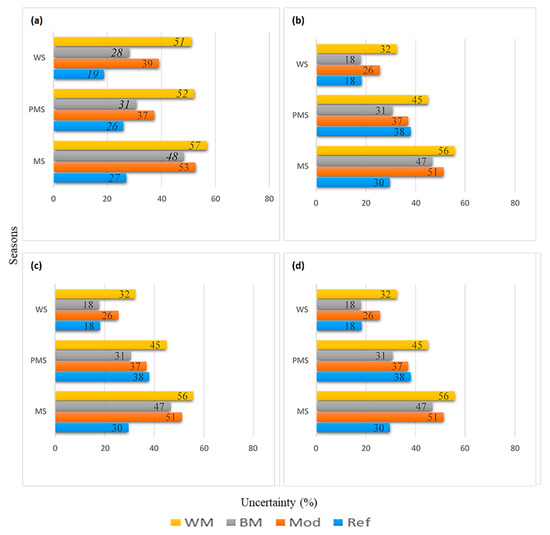
Figure 4.
Seasonal quantification of the reference and GCM level uncertainties in representing temperature governing predictors over Pakistan’s Indus Basin. The seasons (uncertainty) are arranged along the y-axis (x-axis). In the legend, WM, BM, Mod, and Ref refer to the worst model, best model, model ensemble, and the average reference, respectively. (a) Tmax predictor uncertainty averaged over UIB regions, (c) Tmax uncertainty averaged over Lower Indus regions. The panels (b) and (d) show corresponding Tmin uncertainties.
4.4. Future Temperature Changes
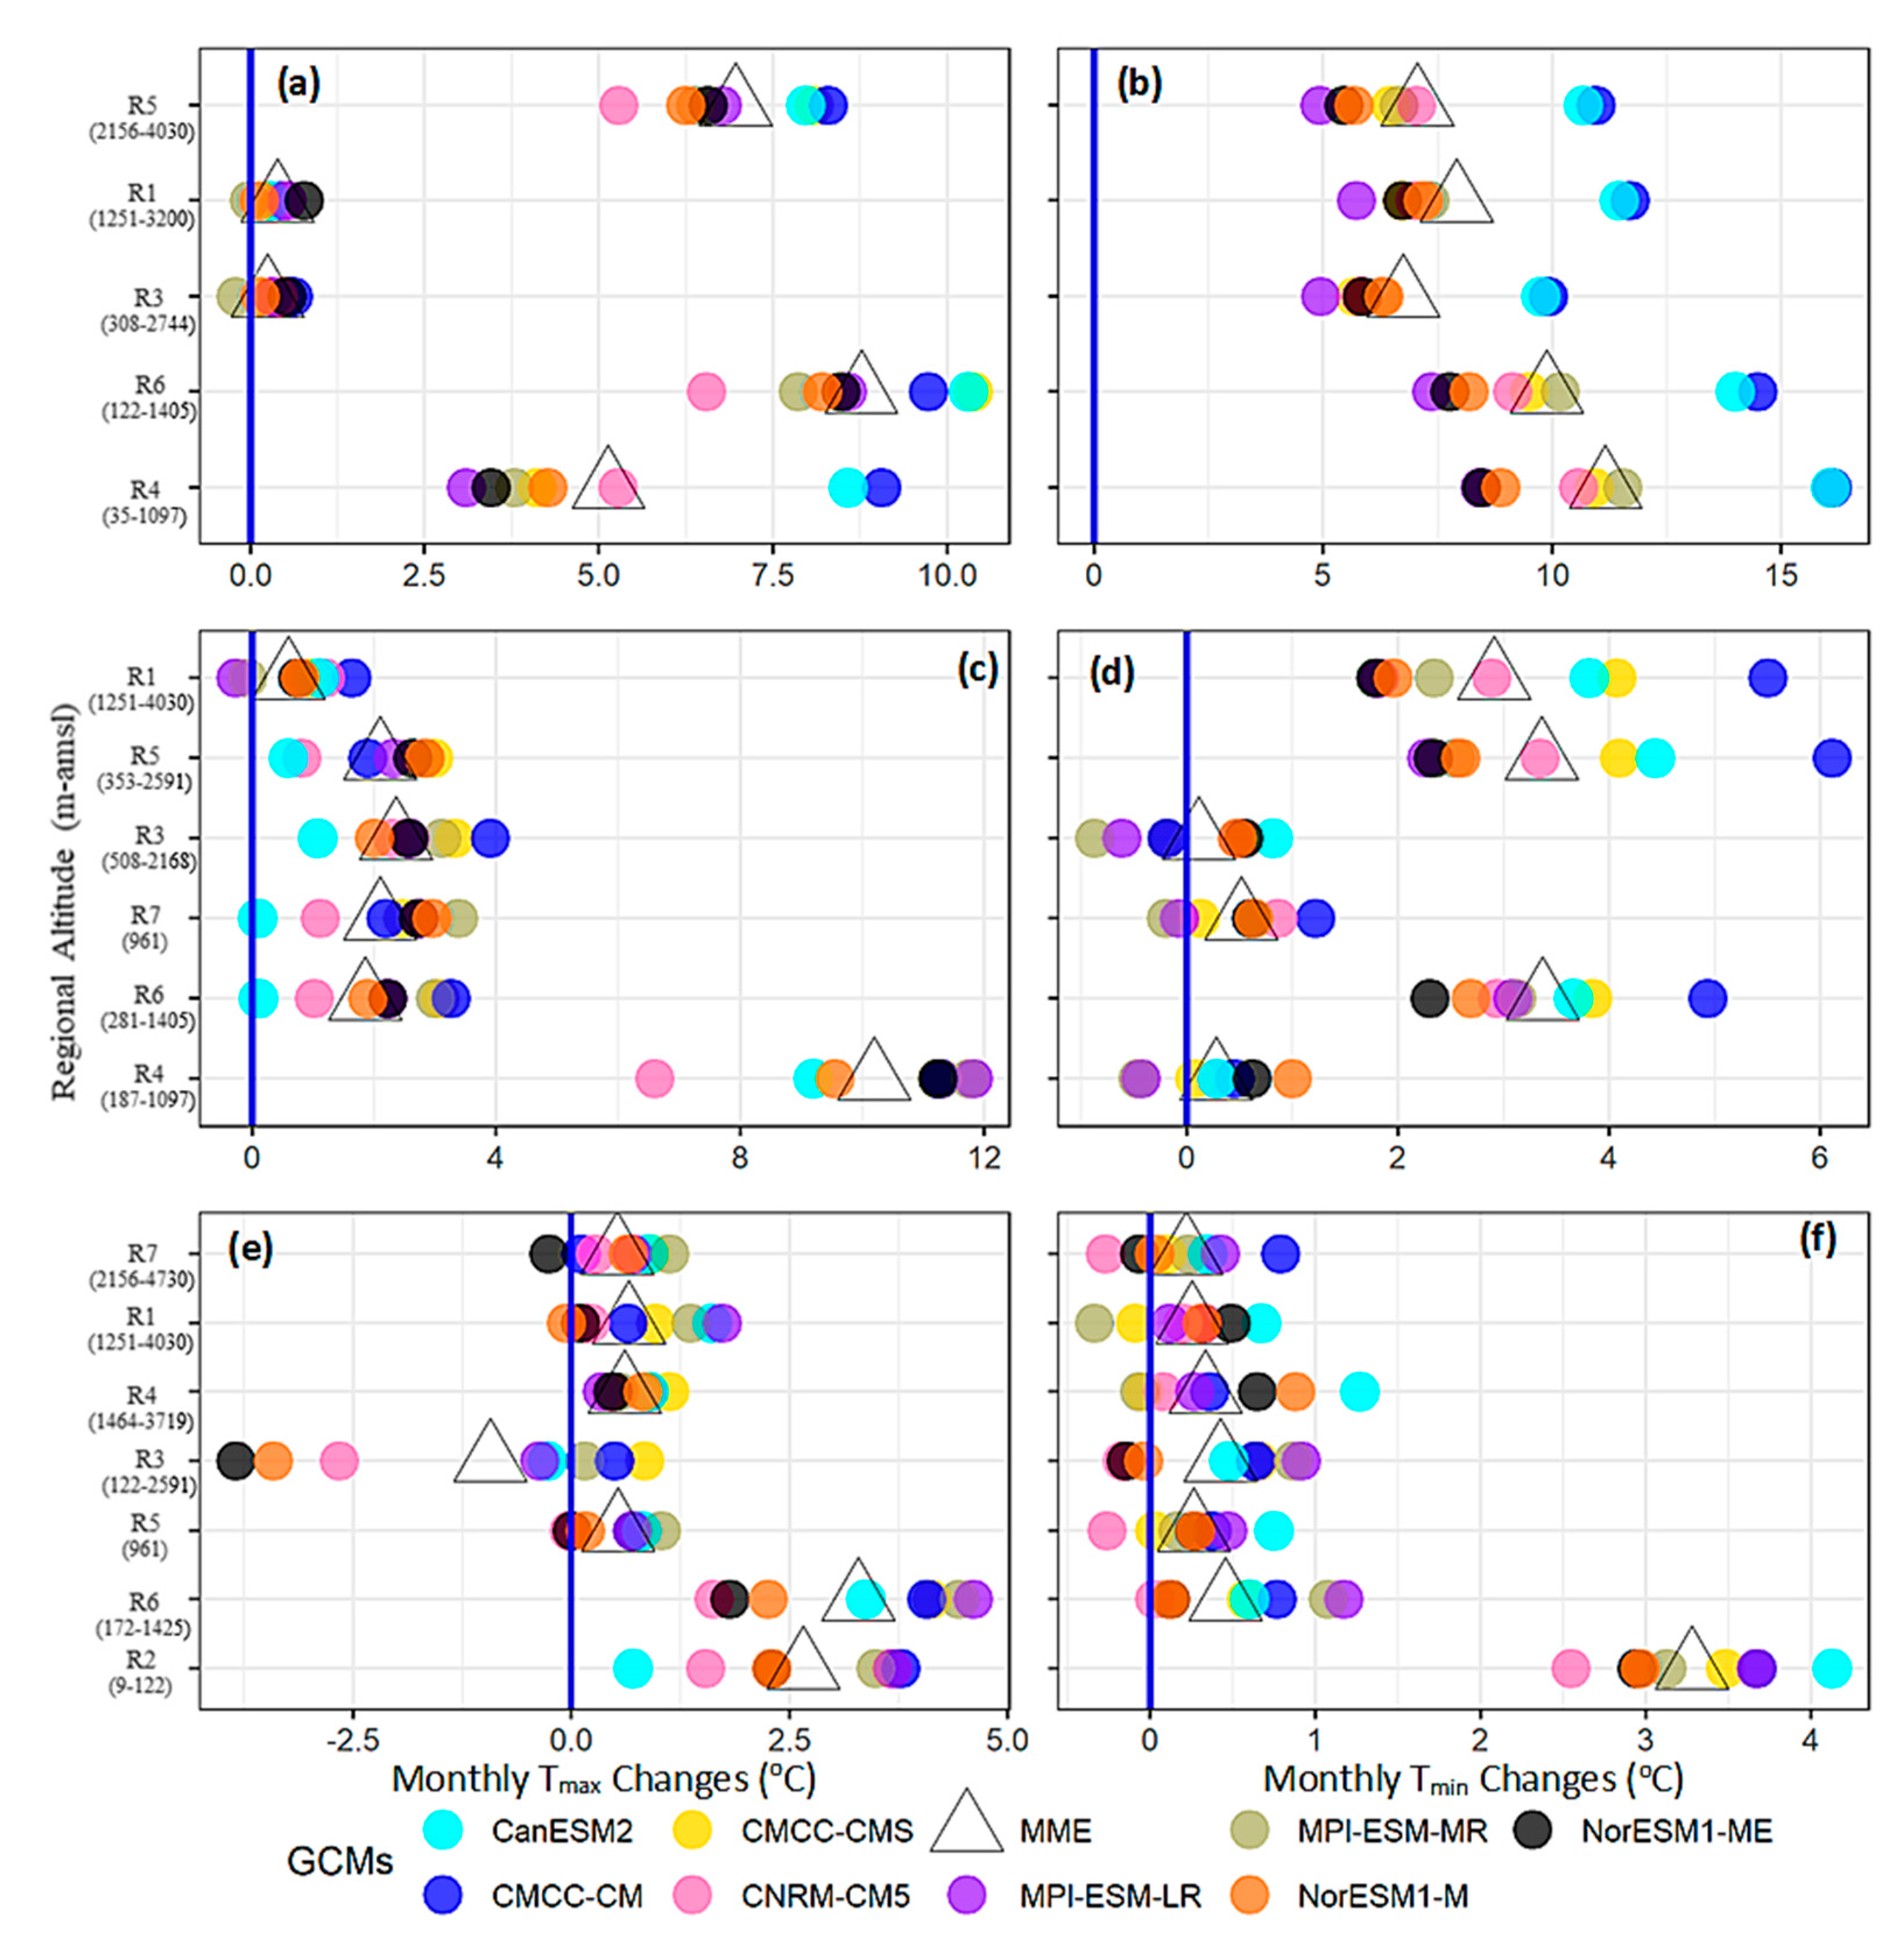
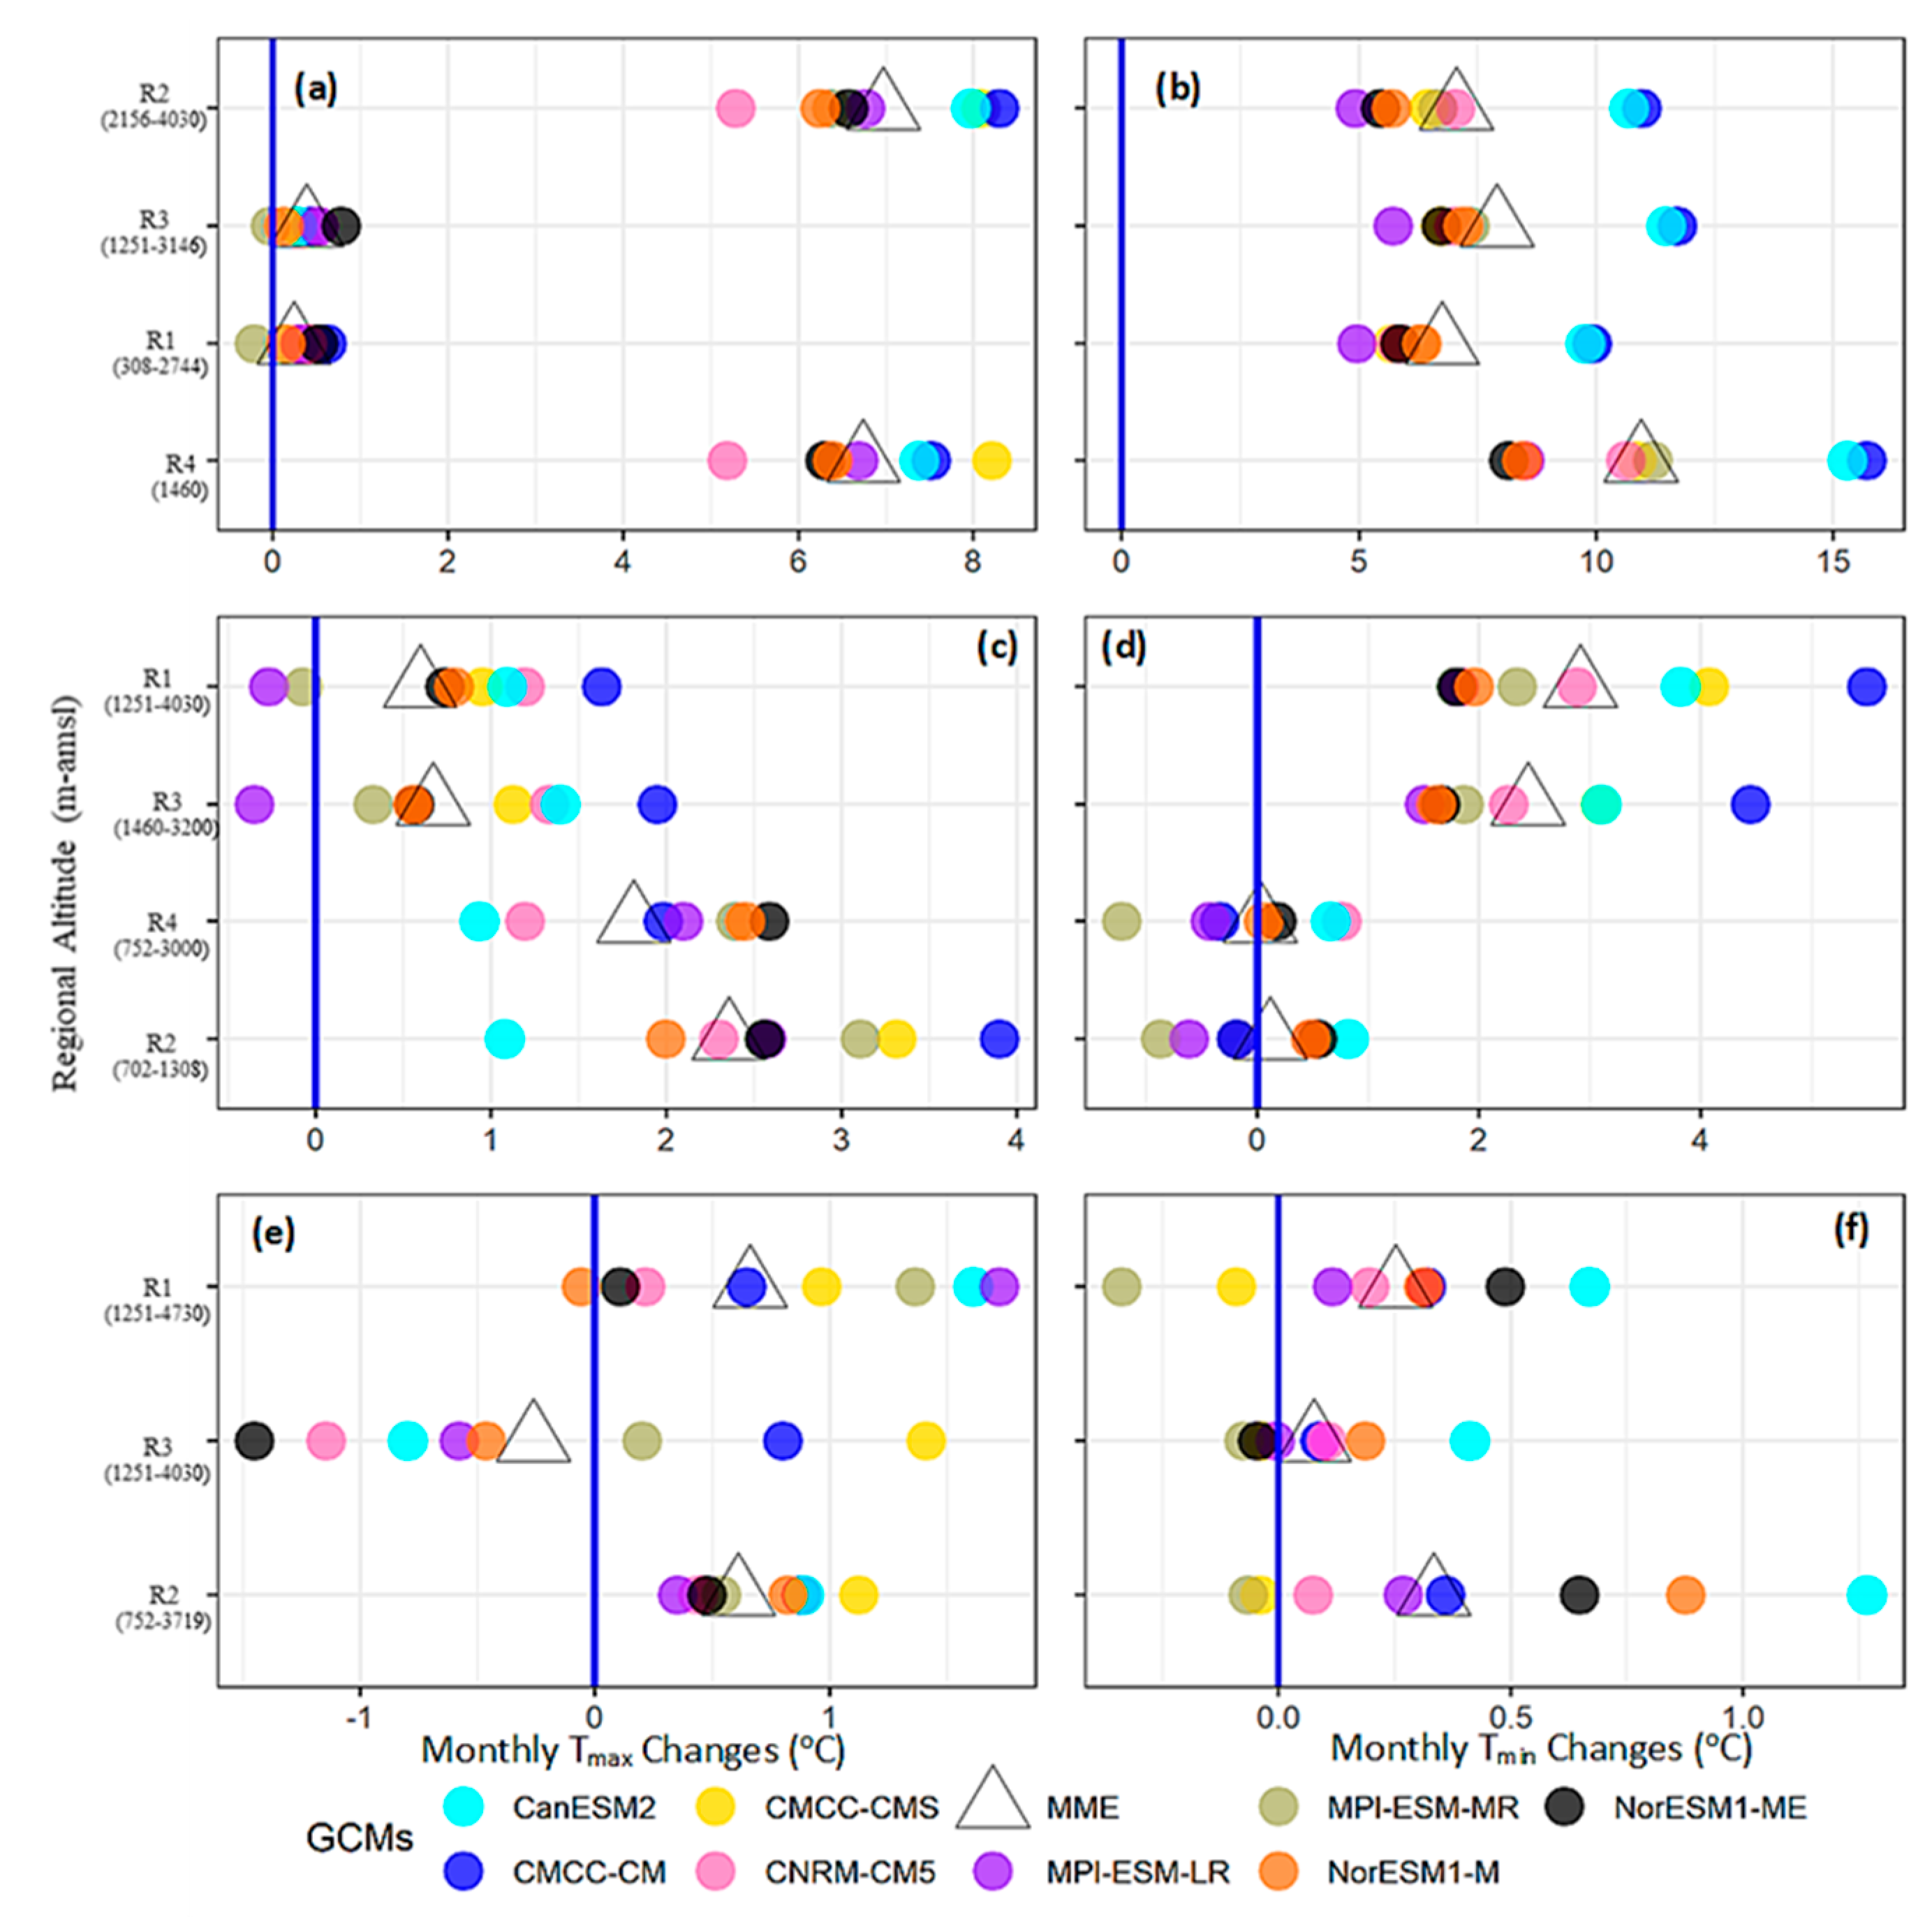
We used the GCM-simulated predictors under RCP4.5 and RCP8.5 scenarios to assess seasonal Tmax and Tmin median changes during the two future periods (2041–2071, 2071–2100) relative to the historical period (1976–2005). Figure 5 presents the temperature changes during 2071–2100 under the RCP8.5 scenario. The multi-model ensembles -MMEs (triangles) and the individual GCM results (colored circles) show the average magnitude of change signals and the associated uncertainty.
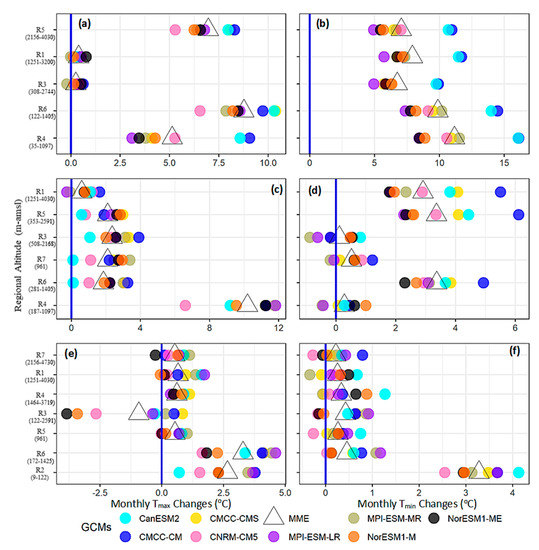
Figure 5.
Downscaled (unweighted) seasonal temperature changes (°C/month) during 2071–2100 compared to 1976–2005 under the RCP8.5 scenario during the basin-wide regionalization experiment. (a,b) show the WS changes for Tmax and Tmin, respectively. The PMS Tmax and Tmin changes are represented by (c,d), and corresponding MS changes are shown by panels (e,f), respectively. The Y-axis shows the different sub-regions arranged in decreasing altitudinal order from top to bottom and the range of regional altitudes given in parenthesis. The colored circles (triangles) show the individual GCM (MME) median temperature changes. The solid blue line indicates no change.
Results are ordered across the y-axis as a function of regional altitudes to analyze EDW over the basin. The corresponding changes under RCP4.5 and change signals during 2041–2071 under both RCPs showed less warming but similar spatial patterns in most cases (not shown). Note that the x-axis range (i.e., monthly temperature changes) varies in these panels.
4.4.1. WS Projections
The entire basin will experience warming through both temperature variables during the WS (Figure 5a,b). However, the magnitude and reliability of the MMEs differed significantly between the Tmax and Tmin and along regional altitudes. For instance, the Tmin projections always showed more substantial warming (MME ranged from 6.74 °C to > 11 °C) than corresponding Tmax changes (MME range of 0.24 °C to ~7 °C). However, the larger inter-model spread in Tmin projections also highlights the higher uncertainty about warming magnitudes. Another striking feature was related to high warming (in both temperatures), though with more uncertainty (large inter-model spread) over the lower-elevation regions than the HA. Therefore, the model ensemble did not show EDW over the whole basin. However, the EDW became prominent when changes only over the UIB were analyzed. Within the UIB, the highest Tmax warming (MME ~7 °C) was projected over the highest (represented) altitudes of the northwestern and northeastern regions (R5). However, the future Tmax warming reduced significantly over the lower-elevations of the northern (R1, MME 0.38 °C) and southern Himalayans (R3, MME 0.24 °C) regions. Generally, the Tmin changes showed mixed patterns with regional altitudes in the UIB. The EDW became distinct when considering average temperature (mean of Tmax and Tmin) within the UIB. We also compared MME signals with projections of the best-performing individual GCMs. For example, the best Tmax model (CMCC-CM) and Tmin model (CNRM-CM5) always (mostly) showed greater (lesser) Tmax (Tmin) warming over the basin (mainly in lower elevations). Thus, the best seasonal models projected enhanced warming over the UIB compared to MME signals.
A combination of increased surface albedo [7], cloud radiative forcing, e.g., [75], and soil moisture feedbacks can (at least partly) explain a more significant Tmin warming within the UIB. A projected increase in WS precipitation, which is robust across many studies, e.g., [40,63,76], further supports such feedbacks. Since the WS precipitation mostly falls as snow, increased albedo from the fresh snow surface (and associated cloud covers) may largely explain a smaller increase in Tmax. Similarly, enhanced convection that starts during March, e.g., [74] may also reduce insolation over the UIB. Under cloudy conditions, increased soil moisture (due to increased precipitation and melting in the UIB) may also exert positive feedback to increase Tmin.
A high WS warming over the UIB is in line with earlier studies, e.g., [39,77]. While downscaling studies projected positive Tmin changes, e.g., [39,59], most trend analysis studies instead concluded seasonal warming through Tmax changes, e.g., [35,37]. Considering increased future precipitation and associated positive feedbacks, we argue that WS warming through Tmin changes over the UIB seems more logical.
However, our results (and almost all earlier studies) are in stark contrast with the finding of [32], where a WS cooling was reported. Using a smaller number of stations with short time series compared to our study, and methodological differences (particularly homogeneity treatment) might be responsible for the seasonal discrepancies. In addition, claiming future UIB cooling based on stations depicting a cooling tendency in observations may also be misleading. Therefore, analysis using climate variability and atmospheric dynamics might provide more realistic temperature variations in this topographically challenging region, as shown in our study.
A combination of decreased precipitation [66,77], an increase in dry periods [78], and enhanced evapotranspiration over the irrigated plains due to rising Tmax may largely explain the patterns of Lower Indus warming (R4 and R6).
4.4.2. PMS Projections
Warming of the basin was also assessed during the PMS (Figure 5c,d). Contrary to the WS, the Tmax changes were more positive (MMEs range from ~0.60 °C to >10 °C) compared to Tmin warming (MMEs range of 0.11 °C to 3.7 °C). The projected uncertainty (about the magnitude and signal direction) mostly remained high for Tmin projections. Although the Tmax and Tmin changes showed significant spatial variability, it did not follow EDW at the basin or over UIB scales. Instead, our analysis suggested a sort of west-east warming pattern that intensifies over the lower elevations.
The regional PMS warming and drying, particularly over the UIB, is a robust feature, e.g., [36,44] and may be linked to clear sky conditions under the influence of West Tibetan high. The strengthening of Tibetan high may explain a more increase in regional Tmax. A greater increase in Tmax, particularly over the northwestern regions (R5 and R7) and along the foothills of the southern Himalayans (R3) compared to changes over a larger trans-Himalayan region (R1), may be linked with the weakening and further northward penetration of the westerlies under RCP8.5 [63].
However, decreasing precipitation may not adequately explain Tmin warming over the UIB. We argue that increased precipitation and consistent warming during the WS may enhance melting and soil moisture. Increased soil moisture may be evaporated by daytime heating during the PMS to promote afternoon cloudiness, which can justify the rising Tmin through radiative feedback. Ref. [37] used five decades of synoptic observations to show an increasing trend in the afternoon cloudiness over the UIB. We believe that such a pattern will intensify under the RCP8.5 scenario during the PMS. Note that the humidity predictors dominate the PMS regression models (Table 4), and, therefore, future changes in atmospheric humidity will strongly influence the regional temperatures. Previous studies, e.g., [33,36,39], also projected PMS warming over the UIB through Tmax changes.
The northwestern warming of the UIB will further continue in the lower-elevations (R6) with a similar magnitude. However, the upper irrigated plains in the northeastern sides (R4) showed a maximum (smaller) increase of Tmax (Tmin) though with higher uncertainty. A combination of increased heat advection and reduced convection may regulate such Tmax changes. The nature of Tmax predictors ta850 (all PCs are located well outside the region) and va850 indicate the role of heat advection into the region. In contrast, the PMS drying, e.g., [79], may reduce regional convection (and cloud cover) to justify smaller Tmin changes.
4.4.3. MS Projections
The projected warming significantly reduced in the MS (Figure 5e,f). In addition, there was a remarkable inter-model consensus about a low-warming future within the mountainous UIB (R7, R1, R4, R3, and R5). Like in other seasons, the basin will experience more (less) warming over Lower Indus (UIB) regions with higher uncertainty. However, a general pattern of EDW for projected Tmax changes was realized only at the UIB scale. The Tmax changes mostly dominated the basin-wide seasonal warming (Figure 5f).
Within the UIB, the most striking feature relates to a significant Tmax cooling (MME = −0.93 °C) over a relatively low-altitude region along the foothills of southern Himalayans (R3). However, the reliability of regional cooling was relatively weak. For instance, both Norwegian models (Nor-ESM-ME and Nor-ESM-M), which projected maximum cooling (>−2.5 °C), showed the lowest historical (predictor) correspondence (Table 4). In addition, many GCMs, including the best model (MPI-ESM-LR), instead showed warming (up to ~1 °C) over this region. All other UIB regions covering HA of the northwestern and trans-Himalayans showed Tmax warming that was maximum (MME ~0.70 °C) over a trans-Himalayans region also covering central Karakoram (R1). Again, the best seasonal GCM (Table 4) mostly projected enhanced warming (Tmax ~1 °C) compared to MMEs over the UIB. The Tmin ensemble changes also showed consistent warming (of low-magnitude) over the entire UIB with maximum warming (MME = 0.43 °C) over the lower-elevations (R3). However, the likelihood of Tmin cooling cannot be ruled out in the UIB.
Some earlier studies [58,80] also projected low-warming MS conditions during the 2080s over a region that largely overlaps with our R3 and covers the adjacent Indian part (with a possibility of Tmin cooling) by using a single GCM. Our model ensemble also covers a similar magnitude of regional warming. Therefore, a low-warming MS in the UIB at the end of the 21st century is possible and may further extend into the high-altitude regions under the same MS forcing. Many earlier studies, e.g., [32,33,35,37] have shown MS cooling tendencies. Although our model-ensemble did not show MS cooling except over one region, some of the individual models projected some cooling. Overall a low-warming future (under RCP8.5 forcing) may also resemble the findings of those studies.
Increasing MS precipitation, e.g., [36,81], reduced insolation, e.g., [37,50], the influence of large-scale circulations [23], internal climatic variability, e.g., [82], and regional snow dynamics [8] may govern such MS cooling.
Pomee at al. [43] showed the role of dynamic and thermodynamic forcing on the MS precipitation over the UIB and their strengthening under RCP8.5 to transport additional moisture [65]. For instance, they projected a quantitatively large precipitation increase over R3 (MME >7 mm/month) under RCP8.5, which may cause a low-warming or even regional cooling. A close similarity of the precipitation [43] and temperature predictors (Table 4) further supports these dynamic interactions. The projected intensification of irrigation practices under future warming over the Indian landmass may promote convection to increase daytime cloudiness, e.g., [37]. The buildup of such atmospheric moisture may move into the UIB under stronger MS currents to reduce insolation. de Kok et al. [16] (simulated such negative feedback of the regional irrigation to explain glacial expansions in the adjacent high mountains. Some studies, e.g., [83,84], also highlighted the role of irrigation practices in shaping regional temperatures.
In contrast, some studies, e.g., [40,77] assessed an extensive MS warming over the UIB. Perhaps analysis without high-altitude stations, disregarding regional heterogeneity (treating UIB as a single unit), the variable definition of the MS season, and ignoring homogeneity considerations may induce artificial trends in some of those studies, e.g., [39,40].
However, we believe that interpolation issues of the near-surface variables in high mountains and adapting uniform lapse rates may also exert a strong influence in regional studies, e.g., [38]. The lapse rate variation becomes prominent in the warmer seasons, where a sharper vertical temperature gradient may lead to such MS discrepancies. The usefulness of time-varying lapse rates in the central Himalayans region has already been demonstrated by [85]. We suggest that lapse rates using regionalization schemes may provide a more realistic basis for assessing vertical temperature distributions in the complex UIB terrains. The recent high-altitude observations can help in this regard.
However, the average warming over different Lower Indus regions (R6 and R2) is similar to the findings of previous studies, e.g., [4,40], and attributed to a general decrease in seasonal precipitation, e.g., [77]. Ease of topography (lesser interpolation challenges) and the absence of lapse rate requirements may also explain the MS warming similarities among studies.
4.5. Model Weighting Influence on Ensemble Signals
We identified the best performing GCMs at sub-regional scales by comparing observation-based reanalysis predictors with historical simulations of the available GCMs. However, the application of different models for different regions would have introduced inconsistencies. Conversely, using a single GCM for the whole basin would require significant simulation compromises and might not suffice for such a complex region. Using a weighted ensemble can offer one alternative to this issue, whereby GCM performance during the observations is used as specific weights for projections. Thus better-performing models get higher weights in the resulting (weighted) ensemble based on justifiable reasons.
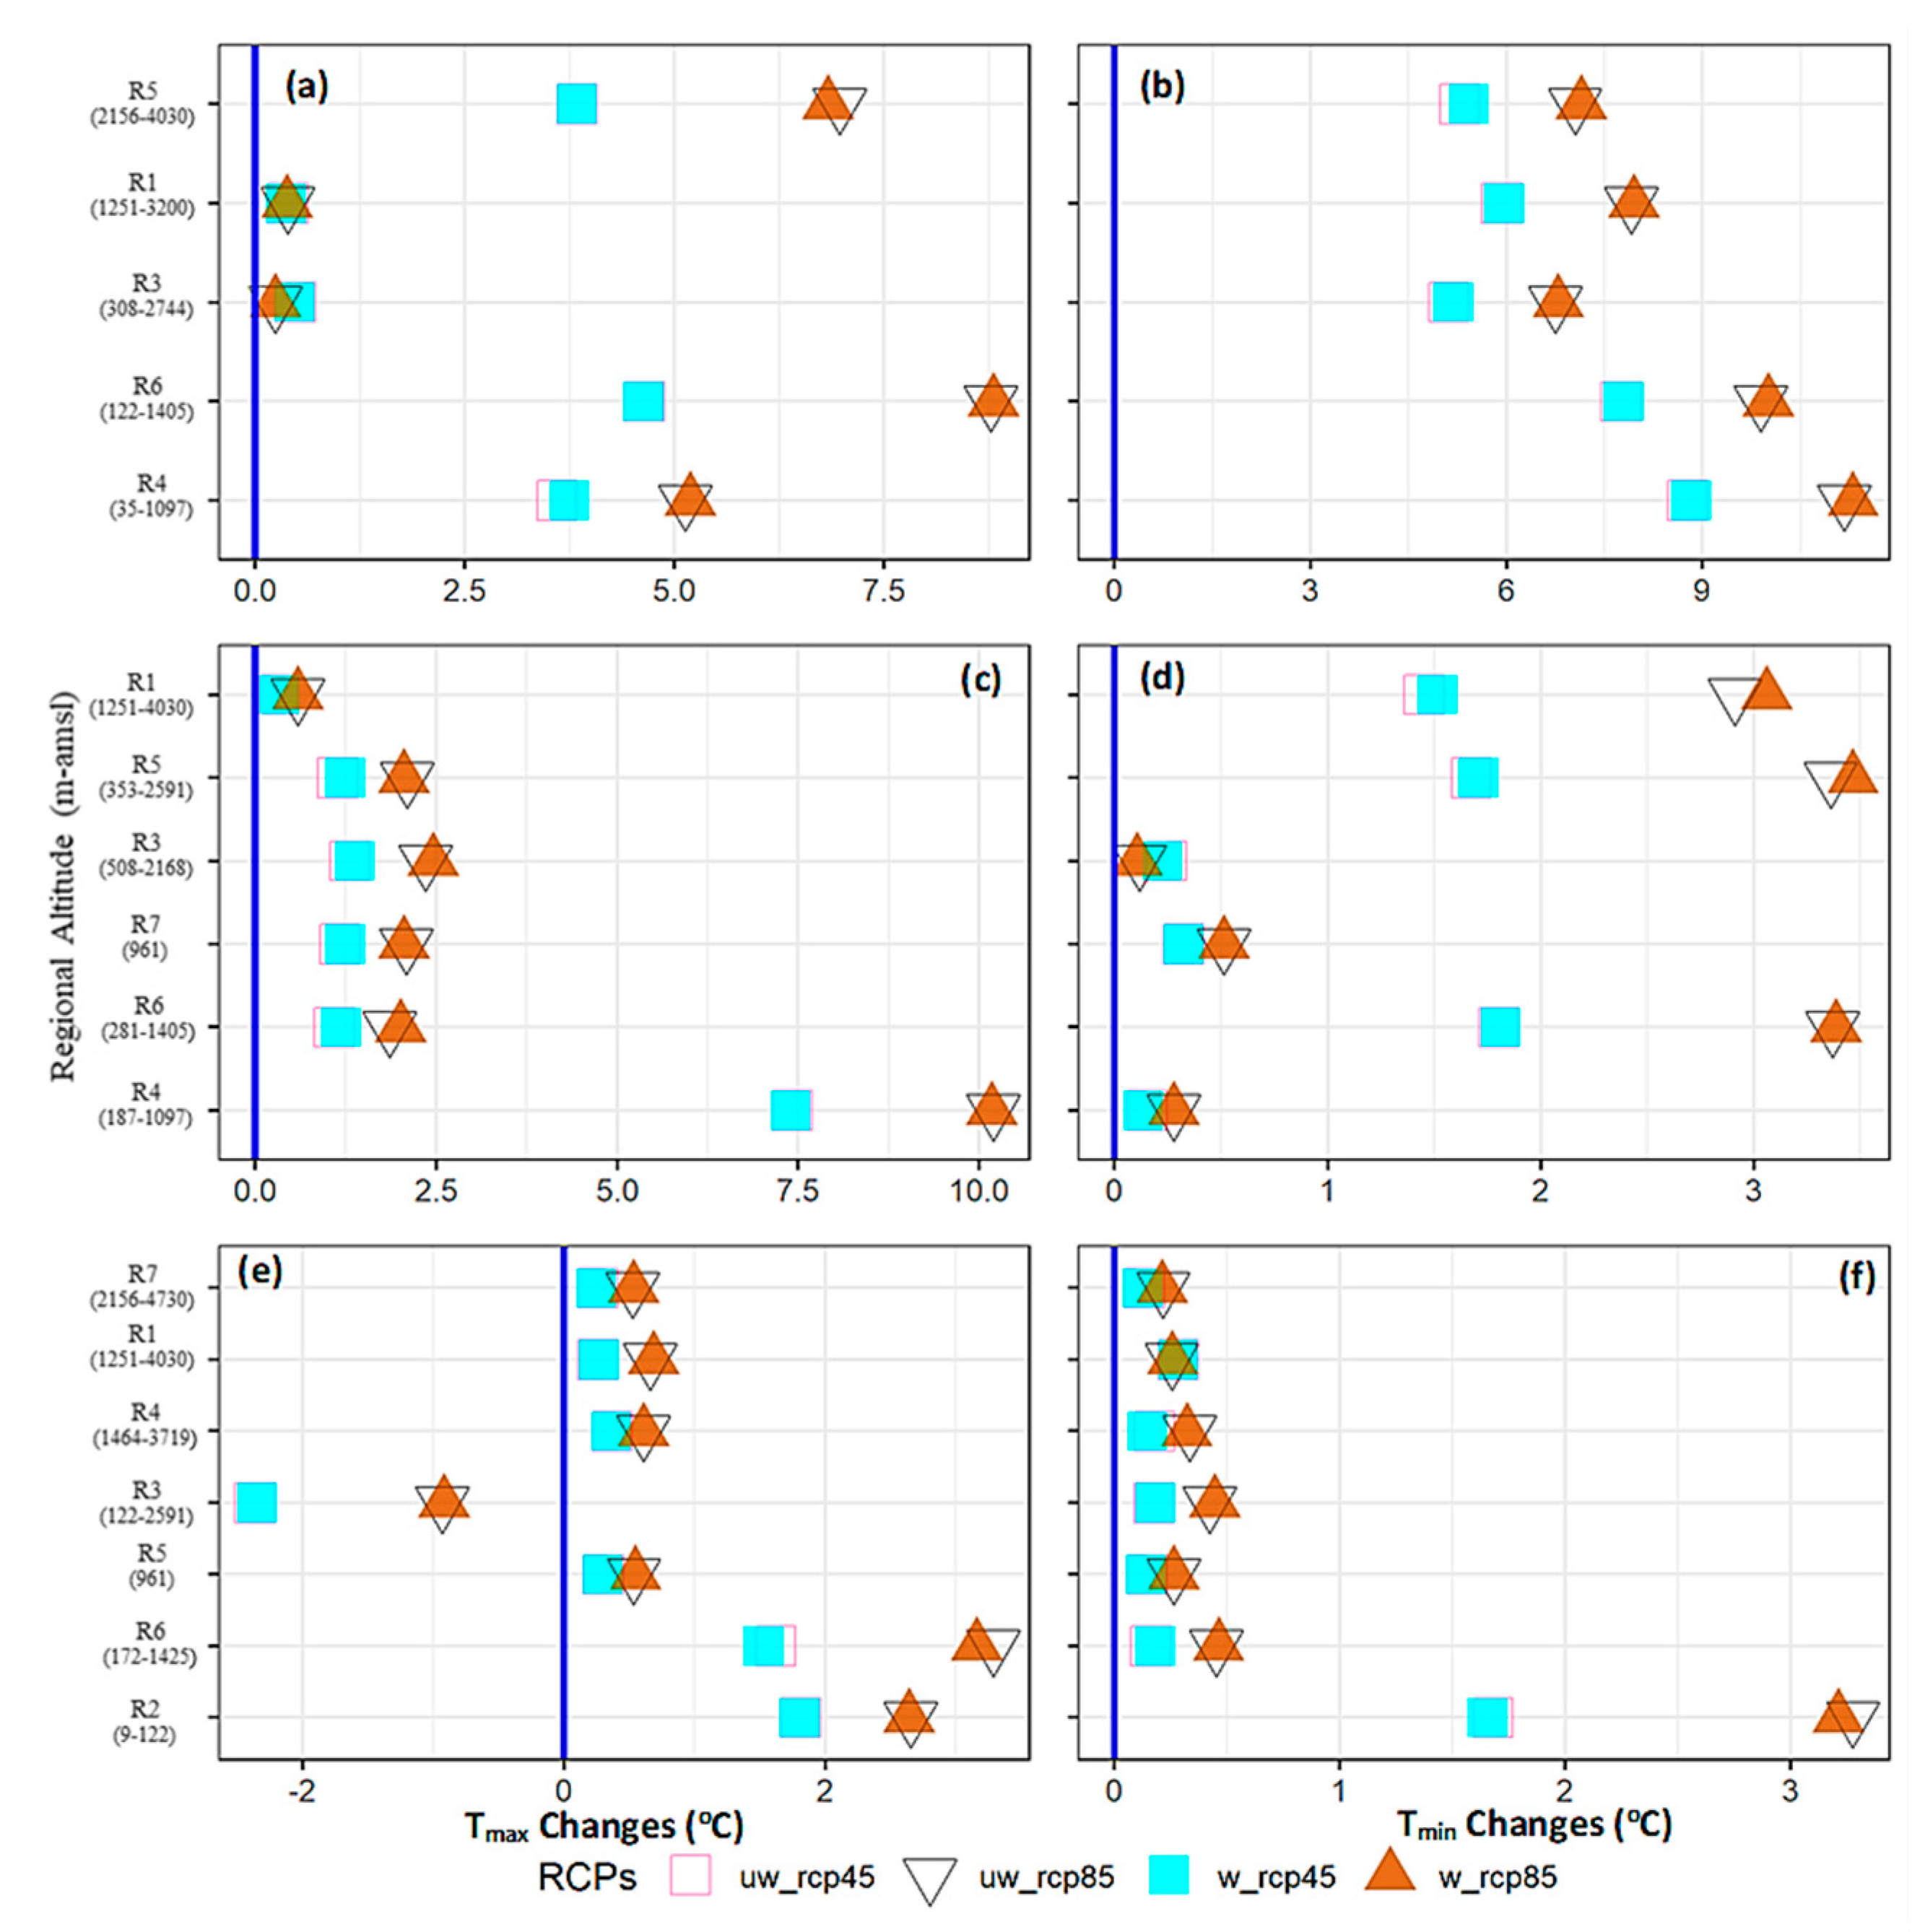
We evaluated the impact of such model weighting (Table 4 and Table S5) on ensemble signals by comparing unweighted and weighted temperature changes during 2071–2100 under both RCPs (Figure 6). Overall, the model weighting did not significantly modify the ensemble signals, partly due to a small magnitude of the weights, intermodel similarities, and because most GCMs demonstrated similar temperature-simulation skills. Still, the model weighting showed more influence over different Lower Indus regions and for Tmin changes. During the westerly-dominated seasons, the better performing models projected slightly more warming over the UIB (up to 10%), dominated by the Tmin changes, particularly under RCP8.5. On the contrary, most models showed similar skills for representing MS dynamics over the UIB, so the seasonal weighting was less effective. However, the GCMs differed more over topographically simpler Lower Indus regions during all three seasons, and hence the weighting was more prominent.
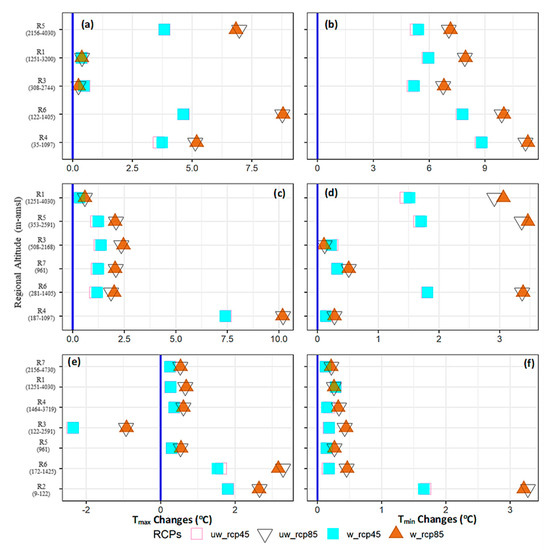
Figure 6.
Impact of the model weighting on ensemble changes (MMEs) during 2071–2100 under both RCPs. (a,b) show weighting impact during the WS for Tmax and Tmin, respectively. Similarly, the PMS (c,d) and the MS (e,f) weighting impacts are also shown. In the legend, “unw_” stands for the unweighted and, “w_” shows weighted changes for both RCP scenarios.
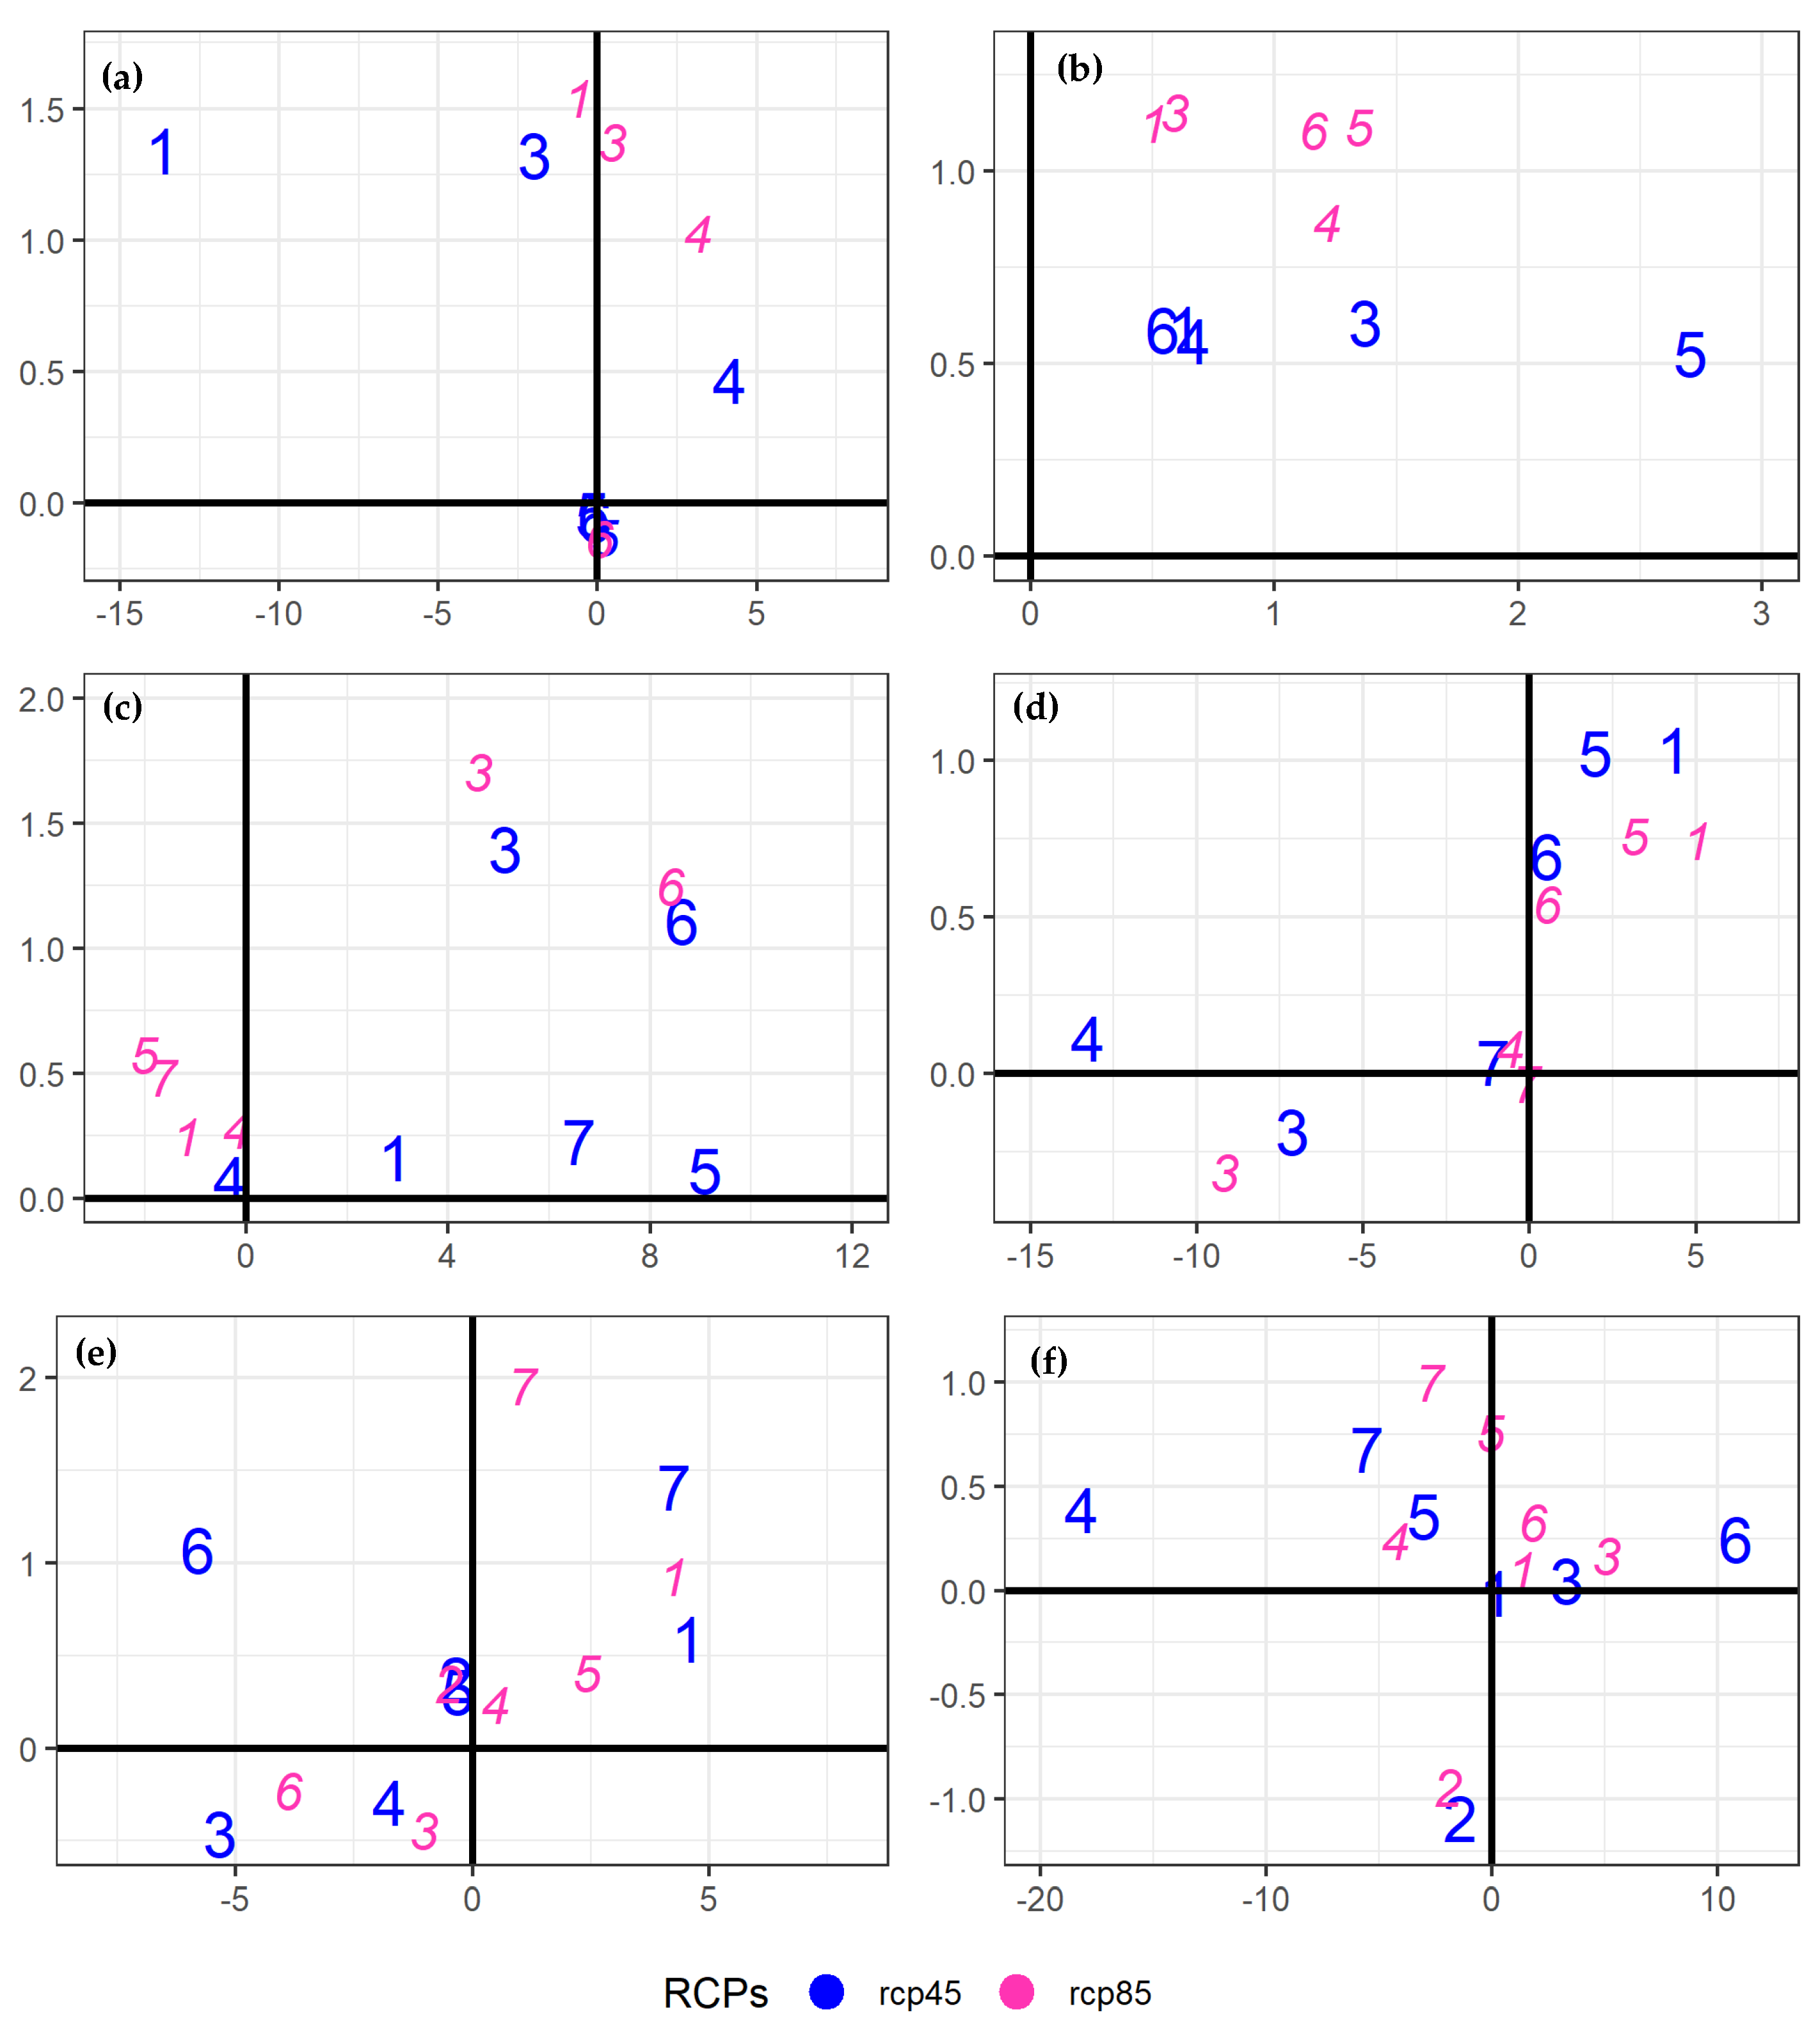
We also analyzed the relative impact of model weighting on the median signals and standard deviations under both RCPs (Figure 7). The weighting has a smaller but intricate pattern of impact. Generally, the spread (magnitude) of change signal increases under the RCP8.5 (RCP4.5) scenario and highlights a more uncertain future under intense warming conditions. While the WS weighting mostly increased the basin warming under both RCPs, the MS response was cumbersome. Mostly high-altitude regions during the main seasons (MS and WS) showed more warming than Lower Indus regions. Thus it appears that better-performing models project a warmer UIB but with increased uncertainty, and the opposite is true for most Lower Indus cases.
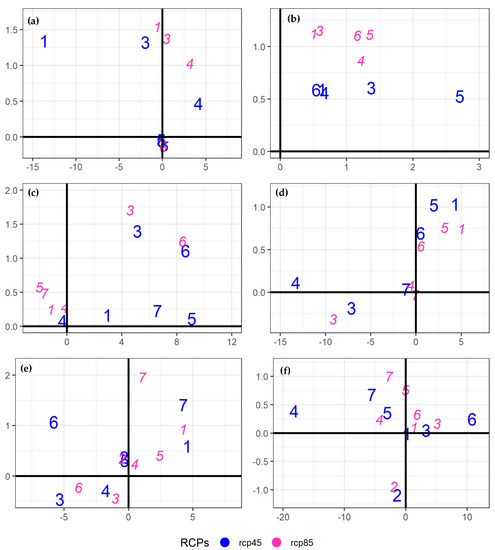
Figure 7.
Impact of model weighting on ensemble medians (along the x-axis) and standard deviations (along the y-axis) during 2071–2100 under RCP4.5 and RCP8.5 scenarios. The horizontal (verticle) blue line reflects no weighting influence on the median (standard deviation) signals. Tmax weighting impacts during the WS, PMS, and MS are shown by (a,c,e). While the corresponding Tmin changes are shown by (b,d,f), respectively. The numbers in these panels represent the identification of seasonal sub-regions through K-means clustering (see Figure 2 for a description of these regions).
4.6. Projected Change Signals: Robustness
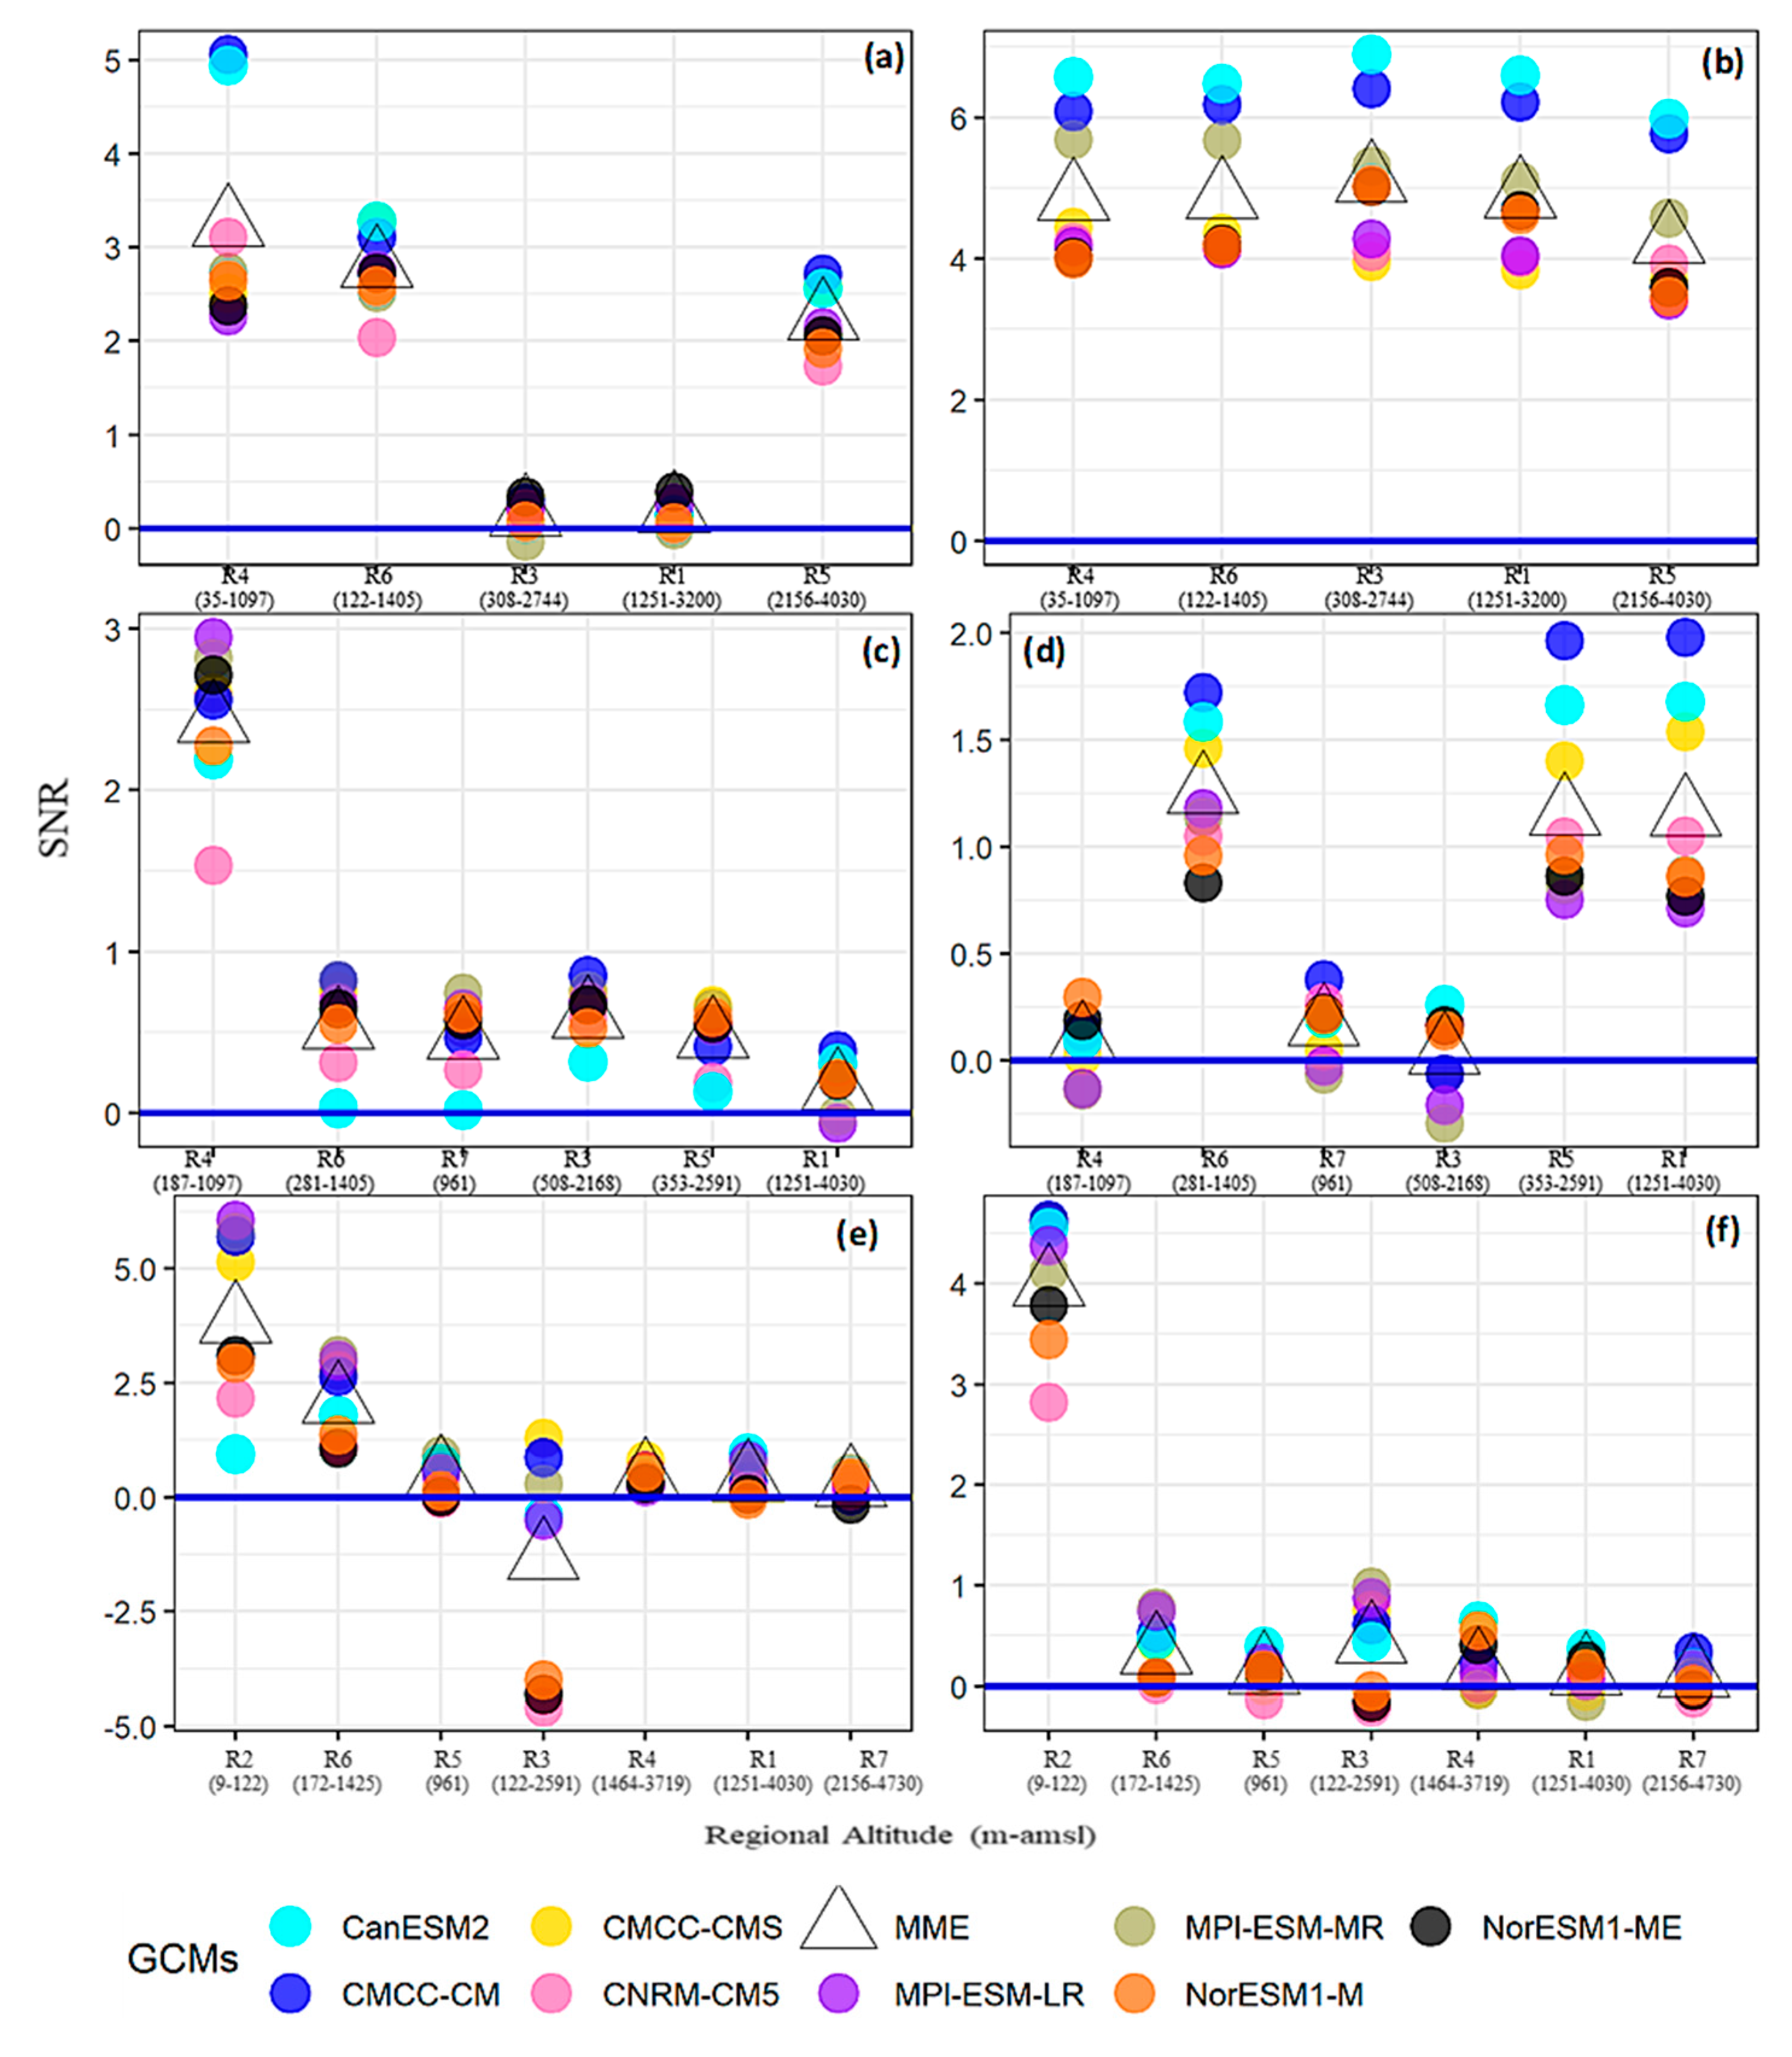
We further computed SNRs to evaluate the robustness of projected temperature changes against the observational uncertainty under both RCPs. Figure 8 shows the results under the RCP8.5 scenario during 2071–2100. Almost all MMEs showed positive ratios, suggesting distinctness of the projected warming over the entire basin. However, there were certain patterns in the distribution of these SNRs. For instance, the Lower Indus regions mostly showed higher (positive) ratios for both temperatures. Reduced observational variability over the Lower Indus (prolonged dry conditions) compared to heterogeneous UIB can partly explain such altitudinal variations of these ratios.
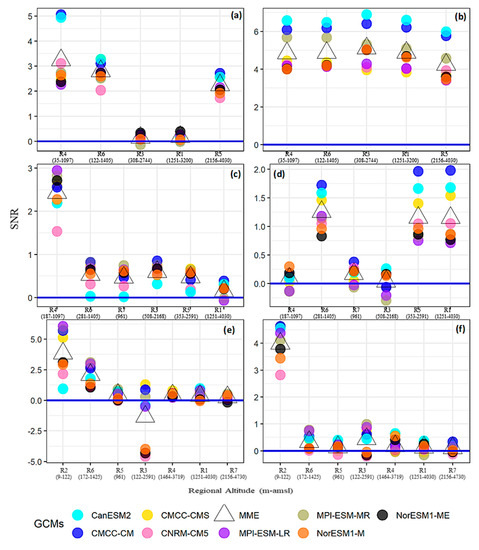
Figure 8.
Same as Figure 5, showing the basin-wide distribution of the signal to noise ratios (SNRs) for both temperatures during 2071–2100 under RCP8.5. The blue horizontal solid line here depicts no strength of the change signal (i.e., median) compared to the historical standard deviation (i.e., noise). Sub-regions with their altitudinal bands are shown along the x-axis, where the elevation increases from left to right. Note that WS Tmax and Tmin changes are shown as (a,b). Corresponding PMS and MS temperature changes are shown by (c,d) and (e,f), respectively.
Similarly, the Tmin warming was more robust during the westerly-dominated seasons (WS and PMS), particularly at high-altitudes, and the opposite was true for the MS. Thus, the future water availability and liquid proportion of the precipitation may increase in the UIB to support rising water demand in the Lower Indus regions. Based upon SNR analysis, the EDW notion at the UIB scale could only be stated for the WS (Tmax) and PMS (Tmin). A combination of weaker signals and high observational uncertainty hampered such an assessment during the MS.
We also used a non-parametric Wilcoxon signed-rank test [86] to evaluate the statistical significance of ensemble temperature (medians) changes during 2071–2100 compared to 1976–2005 under both RCP scenarios (Table S6). The p-values suggest that the statistical significance of future changes increases with RCP8.5 forcing during all three seasons. In particular, the Tmax changes over all spatial scales were significant. Interestingly most of the MS signals over the UIB were statistically significant despite smaller magnitudes. However, some Tmin changes over the basin were also non-significant under RCP8.5 during the PMS and MS.
4.7. Downscaling over the HA-UIB
We similarly analyzed the seasonal temperature changes, model weighting, and SNRs using the high-altitude UIB regionalization experiment (Section 3.3). Figure 9 depicts Tmax and Tmin changes during 2071–2100 under the RCP8.5 scenario. The previously identified seasonal warming patterns (higher warming during the WS and PMS compared to MS) further persisted over large parts of the high-altitude regions. For instance, a northwestern region during the WS (R4) further verified increased warming over these regions. Similarly, the Tmax cooling over the southern Himalayans (R3) was also visible during the MS, though its magnitude decreased. In addition, R3 projections also validated weaker Tmin warming during the MS. Meanwhile, projections over the two new high-altitude regions (R4 and R3) in the northwestern UIB also confirmed PMS warming with elevation inversion. Increased northward deflection of the future westerlies and associated moisture fluxes may support such typical PMS warming patterns over the UIB.
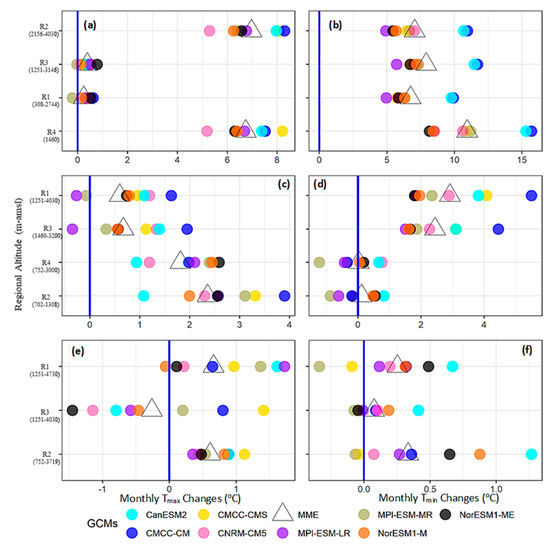
Figure 9.
Same as Figure 5 but defining seasonal temperature changes during 2071–2100 under RCP8.5 using the high-altitude UIB regionalization experiment (a–f).
5. Further Discussion and Conclusions
Temperatures within the UIB are connected with the hydrological regime of the Indus River system through their dynamic influence on the regional cryosphere. In addition, the Lower Indus water demand also depends on temperature. We considered spatiotemporal heterogeneity, reference and GCM level uncertainties, and station-based regression models’ skills to statistically project temperature (Tmax and Tmin) seasonal patterns over the entire basin. We also used recent high-altitude observations within the UIB to infer EDW characteristics over the basin.
First, the basin was clustered into homogeneous regions of similar climate variability using K-means clustering. Atmospheric predictors from ERA-Interim reanalysis were then used in a cross-validation framework to model observed temperatures skillfully. We compared ERA-Interim temperature-governing predictors with two other reanalysis datasets (ERA5 and NCEP-NCAR-II) and the GCM-simulated variables during the historical period to quantify reference and model level uncertainties, respectively. Inter-reference predictor correspondence was maximum during the accumulation (WS) and melting seasons (MS) at high-altitude regions, particularly for the Tmax. Thermodynamic (dynamic) predictors mainly determined the reference (GCM) level uncertainties. The available GCMs consistently showed high predictor correspondence during the westerly-dominated seasons (WS and PMS). However, consistent with other studies e.g., [44], all GCMs struggled to represent MS patterns over the basin.
The GCM predictors under RCP4.5 and RCP8.5 scenarios were used in the regression models to assess median temperature changes during the mid and end of the 21st century. Seasonal projections are summarized as follows;
- The entire basin will non-uniformly (space-time scales) warm during the 21st century under both RCPs. The projected warming is strong under RCP8.5 forcing and during 2071–2100 but follows complex patterns.
- The WS showed maximum warming dominated by Tmin changes. The changes suggested an EDW (only for Tmax) and a significant reduction in DTR over the UIB. However, high-altitude regions showed a stable DTR.
- PMS warming was spatially more uniform and instead dominated by Tmax changes. Projected patterns within the UIB suggested a decreasing (increasing) DTR over high-altitudes (low-altitudes) through Tmin (Tmax) changes.
- A remarkable low-warming (inter-model) consensus, particularly over the UIB, appeared during the MS. The projected changes suggested a small increase in seasonal TDR over the UIB, driven mainly by the Tmax changes.
- Over the seasons, a strong (weak) warming appeared over the northwestern high-altitude (lower- elevations of the southern Himalayans) regions. In addition, the increased warming during the westerly-dominated seasons seems to mask low-warming MS patterns over the UIB. Thus, the UIB will experience substantial warming for mean temperature that follows EDW- a pattern consistent with earlier studies e.g., [38]. High warming during the post-monsoon period, e.g., [40], may further increase year-round heating (MS masking) over the UIB.
- Increased inter-model spread within the UIB indicated more uncertainty about ensemble warming and the possibility of even greater PMS (up to 4 °C) and MS (up to 1 °C) warming for both temperatures. Better performing GCMs further confirmed higher warming compared to MMEs signals. Such uncertainties highlight the terrain complexities and observational lackings.
- Contrary to the UIB, the projected warming over different Lower Indus regions (with more uncertainty) was in line with those studies that implemented basin-wide analysis, e.g., [4,77]. A combination of simplified topography (lesser interpolation errors) and reduced need for lapse rates may govern such warming similarities. These regions have a stronger mesoscale land-atmosphere coupling, e.g., [83], which CMIP5 models may not adequately represent due to coarser resolution. Hence more uncertainty prevails over the Lower Indus. The projected precipitation decrease, e.g., [63,77], strengthening of future land-atmosphere coupling, and more decisive influence of the warming oceans in the southwestern and southern regions may largely explain the warming patterns and uncertainty in Lower Indus regions.
Future warming will substantially increase water demand in the Lower Indus. A combination of increased melting, favorable precipitation projections over the UIB, e.g., [40,43], and efficient regulations, e.g., [41], may support such rising water demands in the future. Increased liquid precipitation during the WS and PMS will significantly increase the river flows [33] before the primary rainy season. When combined with projected MS extremes, e.g., [78], such high river flows may also increase flooding risk in the region.
The prevailing temperature over the cryosphere-dominated HA regions remains well below the freezing point, e.g., [20]. Therefore, smaller Tmax warming during the primary melt season (MS) may not drastically influence glacial stability even under RCP8.5. Projected precipitation increase over high-altitude regions, e.g., [8,36], may further support glaciers through cloud and albedo feedbacks along with moisture nourishment. In addition, higher warming during the WS and PMS may promote the downslide of debris [87], which, together with favorable energy-moisture input during the MS, e.g., [36], may also support regional glaciers. Thus unlike other studies, e.g., [11], increased future water availability in the basin remains possible without rapid glacial retreats.
The aerosol forcing also reduces MS warming [82]. We argue that future aerosol loadings may increase, e.g., [88,89], particularly over the high-mountains. Increased Arabian Sea contributions during the projected MS precipitation over these mountains [43] and increased aridity over the Indian plains under drying PMS may increase salt, e.g., [90] dust loads over the UIB, respectively. Increased evapotranspiration during the PMS and WS may also enhance atmospheric moistures to create cooling tendencies over the UIB through direct (cloud shading) and indirect aerosol influences (cloud albedo), e.g., [91]. Landuse changes in favor of infrastructure developments may also enhance future inorganic aerosols. Both Norwegian models that better represent aerosol dynamics, e.g., [92], mostly projected the least MS warming to support our argument. The WS smog over the plains in recent observations may move into the UIB to increase shading and partly justify the rising Tmin. Therefore, analyzing future aerosol contributions may reveal crucial insights for explaining the actual climate response of the UIB under future scenarios. However, understanding the complex glacial dynamics, where heat advection, black carbon depositions, and rapid land-use changes also exert influences, a rapid retreat may also possible. Further high-altitude observations would be required to precisely model the cryosphere response.
Our analysis has some limitations. For example, a relatively small GCM-ensemble, inter-model similarities, e.g., [93], stationarity assumption for future projections, e.g., [94], and using precipitation regions for temperature downscaling may influence the validity of our analysis. Pomee and Hertig [64] discussed the regional relevance of our GCM-ensemble despite its smaller size. We checked the RR’s effectiveness for temperature analysis and found a very high correlation (>0.75) with regional centroids in almost all cases. Therefore, using precipitation regions was justified and rather advantageous to have a consistent moisture-energy perspective on the same fine scales to simultaneously assessing their influence on regional hydrology. Pomee et al. [43] discussed the possibility of extending projections beyond the observations and over the transboundary regions. The average statistical downscaling error of about 1 °C (Table 2) may further reduce the projection reliability in different seasons. We aimed to minimize these errors through multiple considerations in our cross-validation framework taking into account the high climate variability in the basin and the observational constraints to train the models. However, these errors have to be kept in mind when evaluating the magnitude of the climate change signals derived from the models.
Still, further research efforts are needed to analyze this highly complex region, e.g., by advancing the high-altitude observation network for model development and validation and using the latest CMIP6 dataset that may offer more (independent) models with complete predictor data. Ideally, an ensemble of good and bad models may provide interesting insights, e.g., [93,95], about future climate changes. We also suggest lapse rates derived through regionalization schemes may provide more realistic inferences of glacial stability as the glacial response depends on climatic and geographical factors (e.g., relief, orientation, and debris cover) that vary widely in the region, e.g., [96].
Such space-time differentiated lapse rates will provide a more realistic and differentiated climate perspective in the region for supporting regional adaptations.
Supplementary Materials
The following are available online at https://www.mdpi.com/2073-4433/12/2/195/s1, Please note that six tables and one appendix is given as supplemental information. Currently only one Appendix is reflected below. Please take care of other information too. I have attached all supplemental information as a single file again. Table S1: Overview of the meteorological stations used in this study. The Lon (Lat) refers to the longitude (latitude) of the stations, expressed in decimal degrees (dd). Altitudes represent the average station elevation above mean sea level in meters. Source: PMD= Pakistan Meteorological Department, WAPDA= Water and Power Development Authority of Pakistan, CAK= University of Bonn under Cultural Areas Karakoram Program.Table S2: The seasonal outcome of S-Mode PCA over different predictor fields. PCs are the number of retained principal components and Exp. Var denotes the percentage of total predictor variance, as explained by the retained PCs. Table S3: The CMIP5-GCMs offering complete spatial coverage of the temperature (Tmax and Tmin) governing predictors and are used for temperature modeling in our study. Table S4: Same as Table 2 but for Tmin models under the basin-wide regionalization experiment. Table S5: Same as Table 4, but shows the GCM and ERA-Interim reanalysis predictor correspondence for the Tmin. Table S6: P-values of the Wilcoxon signed-rank test [86] to estimate the statistical significance of seasonal Tmax and Tmin changes during 2071–2100 relative to 1976–2005 under both RCP scenarios. Results are statistically significant, where the p-value is less than 0.05.
Author Contributions
Conceptualization, M.S.P. and E.H. data curation, M.S.P. formal analysis, M.S.P. and E.H. funding acquisition, M.S.P. and E.H. methodology, M.S.P. and E.H. project administration, E.H. and M.S.P. software and visualization, M.S.P. and E.H. writing, original draft, M.S.P. writing, review and editing, E.H. and M.S.P. All authors read and agreed to published version of the manuscript.
Funding
PARC-Pakistan and the German Research Foundation mainly supported our research through the Himalayan Adaptation, Water and Resilience (HI-AWARE), and project number 408057478, respectively. In addition, DAAD funding for foreign PhD students through the University of Augsburg to support MSP, is highly appreciated. The contents are the sole responsibility of the authors and do not necessarily reflect the views of PARC, University of Augsburg, German Research Foundation, and DAAD- Germany, nor the Government of Pakistan.
Institutional Review Board Statement
No human or animal was used in our study. Therefore, this statement should be excluded.
Data Availability Statement
The station observational data can be requested directly from WAPDA, PMD and CAK, University of Bonn. The reanalysis (ERA-Interim, ERA5 and NCEP-NCAR-II) and CMIP5 model data can be accessed from respective websites (https://www.ecmwf.int/en/forecasts/datasets/reanalysis-datasets/era-interim, https://psl.noaa.gov/data/gridded/data.ncep.reanalysis2.html, and https://esgf-node.llnl.gov/projects/cmip5/).
Acknowledgments
Authors are indebted to Pakistan Meteorological Department (PMD), Water and Power Development Authority (WAPDA), and University of Bonn for sharing the station data, without which this research was not possible. We also acknowledge the World Climate Research Programmer’s Working group on the Coupled Modeling, ECMWF, and NOAA-ESRL Physical Sciences Division for publically providing the model and reanalysis dataset.
Conflicts of Interest
The authors declare no conflict of interest. The funders had no role in the design of the study; in the collection, analyses, or interpretation of data; in the writing of the manuscript; nor in the decision to publish the results.
Appendix A. GCM Ranking and Model Uncertainty
Following stepwise procedure is adapted to rank the GCMs in terms of their ability to simulate temperature governing circulations (of the ERA-Interim reanalysis) during the overlapping historical period (1979–2005):
- (I)
- Initially, S-mode PCA is performed (Section 3.2) on every governing predictor (Table 1) of the individual GCMs to extract the same number of PCs as from ERA-Interim.
- (II)
- Subsequently, the model PC loadings are compared with corresponding ERA-Interim loadings (separately for each GCM) using Taylor diagrams (Taylor, 2001). A simple performance score (PS) derived by using two of the three summary statistics of the Taylor diagrams is developed to quantify the correspondence. Mathematically, the PS iswherePS = performance score. For a perfect predictor agreement, PS = 1CR = pattern correlation between the reference (ERA-Interim) and model (GCM) loadings. For a perfect phase match, CR = 1.NSD = normalized ratio of variance (standard deviation of the reference and model loadings). Ideally, the NSD should also take the value 1.Under ideal conditions, the PS will attain its maximum value due to the maximization of phase correspondence (i.e., CR = 1) and the same magnitude of predictor spread (i.e., the term NSD—1 becomes zero) between the reference and model simulations. Similarly, a smaller PS value will show a weaker predictor correspondence. The magnitude of the PS will also intuitively influence the third summary statistics (i.e., standardized RMSE), where its maximum value (PS = 1) will ensure zero error. Conversely, the smaller values (PS < 1) will reflect higher errors, though not following a clear linear trend due to the typical relationships among these three summary statistics, see [72]. Thus, the PS contains useful information about the strength of correspondence between the reference and model-simulated fields and can be used to identify the best-matching pairs for every governing predictor.
- (III)
- We draw two separate sets of Taylor diagrams for each precipitation region and season. The first set of diagrams uses PS to identify the best PC match between reference and modeled PCs of a given predictor (separately for each GCM). In this context, we evaluate all modeled loadings of a predictor against a reference loading. The reference-model pair, which shows the highest PS, is selected as the best GCM-PC for that particular reference.This process is repeated for all other PCs and predictors that appear in the final regression models used for downscaling. Subsequently, all best-matching (individual) PCs of different predictors are grouped into the second set of Taylor diagrams (separately for each GCM) to assess the ability of the GCMs in representing ERA-Interim precipitation predictors over a region. The summary statistics of the second Taylor diagram is used to compute the average PS for each GCM and is termed as unweighted PS due to equal weighting of each PC in its computation.
- (IV)
- Given that each PC has a different influence in a regression model, we adapted (absolute) regression coefficients of the PCs as weights and computed the weighted PS. Thus, a model with the highest (lowest) weighted PS score can be identified as the best (worst) GCM due to its improved (poor) simulations for more important predictors.
- (V)
- This process (step I to IV) is repeated for all sub-regions to identify the best regional GCM in different seasons.Finally, we consider GCM performance over multiple regions to identify models that show superior simulations over the whole spatial scales of the UIB and LI, respectively. We prefer a GCM that performs well in multiple regions. This spatial consideration is important since an outlier may strongly influence the PS of a model (e.g., very high PS just over one sub-region). Source: [43].
References
- IPCC. Summary for Policymakers. In Global Warming of 1.5°C. An IPCC Special Report on the Impacts of Global Warming of 1.5 °C above Pre-industrial Levels and Related Global Greenhouse Gas Emission Pathways, in the Context of Strengthening the Global Response to the Threat of Climate Change, Sustainable Development, and Efforts to Eradicate Poverty; World Meteorological Organization: Geneva, Switzerland, 2018; p. 32. [Google Scholar]
- IPCC. Climate Change 2013: The Physical Science Basis. In Contribution of Working Group I to the Fifth Assessment Report of the Intergovernmental Panel on Climate Change; Stocker, T.F., Qin, D., Plattner, G.-K., Tignor, M., Allen, S.K., Boschung, J., Nauels, A., Xia, Y., Bex, V., Midgley, P.M., Eds.; Cambridge University Press: Cambridge, UK; New York, NY, USA, 2013; p. 1535. [Google Scholar]
- Giorgi, F.; Raffaele, F.; Coppola, E. The response of precipitation characteristics to global warming from climate projections. Earth Syst. Dyn. 2019, 10, 73–89. [Google Scholar] [CrossRef]
- Su, B.; Huang, J.; Gmmer, M.; Jian, D.; Tao, H.; Jiang, T.; Zhao, C. Statistical downscaling of CMIP5 muli-model en-semble for projected changes of climate in the Indus River Basin. Atmos. Res. 2016, 178, 138–149. [Google Scholar] [CrossRef]
- Karmalkar, A.V.; Bradley, R.S. Consequences of Global Warming of 1.5 °C and 2 °C for Regional Temperature and Precipitation Changes in the Contiguous United States. PLoS ONE 2017, 12, e0168697. [Google Scholar] [CrossRef]
- Sutton, R.T.; Dong, B.; Gregory, J.M. Land/sea warming ratio in response to climate change: IPCC AR4 model results and comparison with observations. Geophys. Res. Lett. 2007, 34, 02701. [Google Scholar] [CrossRef]
- Mountain Research Initiative EDW Working Group; Pepin, N.; Bradley, R.S.; Diaz, H.F.; Baraer, M.; Caceres, E.B.; Forsythe, N.; Fowler, H.J.; Greenwood, G.; Hashmi, M.Z.; et al. Elevation-dependent warming in mountain regions of the world. Nat. Clim. Chang. 2015, 5, 424–430. [Google Scholar] [CrossRef]
- Kumar, P.; Saharwardi, S.; Banerjee, A.; Azam, M.F.; Dubey, A.K.; Murtugudde, R. Snowfall Variability Dictates Glacier Mass Balance Variability in Himalaya-Karakoram. Sci. Rep. 2019, 9, 18192. [Google Scholar] [CrossRef]
- Bolch, T.; Kulkarni, A.; Kääb, A.; Huggel, C.; Paul, F.; Cogley, J.G.; Frey, H.; Kargel, J.S.; Fujita, K.; Scheel, M.; et al. The State and Fate of Himalayan Glaciers. Science 2012, 336, 310–314. [Google Scholar] [CrossRef]
- Azam, M.F.; Ramanathan, A.; Wagnon, P.; Vincent, C.; Linda, A.; Berthier, E.; Sharma, P.; Mandal, A.; Angchuk, T.; Singh, V.; et al. Meteorological conditions, seasonal and annual mass balances of Chhota Shigri Glacier, western Himalaya, India. Ann. Glaciol. 2016, 57, 328–338. [Google Scholar] [CrossRef]
- Immerzeel, W.W.; Pellicciotti, F.; Bierkens, M.F.P. Rising river flows throughout the twenty-first century in two Himalayan glacierized watersheds. Nat. Geosci. 2013, 6, 742–745. [Google Scholar] [CrossRef]
- Pritchard, H.D. Asia’s glaciers are a regionally important buffer against drought. Nat. Cell Biol. 2017, 545, 169–174. [Google Scholar] [CrossRef]
- Bolch, T.; Pieczonka, T.; Mukherjee, K.; Shea, J.M. Brief communication: Glaciers in the Hunza catchment (Karakoram) have been nearly in balance since the 1970s. Cryosphere 2017, 11, 531–539. [Google Scholar] [CrossRef]
- Lutz, A.F.; Immerzeel, W.W.; Shrestha, A.B.; Bierkens, M.F.P. Consistent increase in high Asia’s runoff due to increasing glacier melt and precipitation. Nat. Clim. Chang. 2014, 4, 587–592. [Google Scholar] [CrossRef]
- De Souza, K.; Kituyi, E.; Harvey, B.; Leone, M.; Murali, K.S.; Ford, J. Vulnerability to climate change in three hot spots in Africa and Asia: Key issues for policy-relevant adaptation and resilience-building research. Reg. Environ. Chang. 2015, 15, 747–753. [Google Scholar] [CrossRef]
- De Kok, R.J.; Tuinenburg, O.A.; Bonekamp, P.N.J.; Immerzeel, W.W. Irrigation as a Potential Driver for Anomalous Glacier Behavior in High Mountain Asia. Geophys. Res. Lett. 2018, 45, 2047–2054. [Google Scholar] [CrossRef]
- WGMS. Global Glacier Change Bulletin No. 3 (2016–2017); Publication Based on Database Version; World Glacier Monitoring Service: Zurich, Switzerland, 2020; p. 274. [Google Scholar] [CrossRef]
- Zemp, M.; Huss, M.; Thibert, E.; Eckert, N.; McNabb, R.W.; Huber, J.; Barandun, M.; Machguth, H.; Nussbaumer, S.U.; Gärtner-Roer, I.; et al. Global glacier mass changes and their contributions to sea-level rise from 1961 to 2016. Nature 2019, 568, 382–386. [Google Scholar] [CrossRef]
- Brun, F.; Berthier, E.; Wagnon, P.; Kääb, A.; Treichler, D. A spatially resolved estimate of High Mountain Asia glacier mass balances from 2000 to 2016. Nat. Geosci. 2017, 10, 668–673. [Google Scholar] [CrossRef]
- Hewitt, K. The Karakoram anomaly? Glacier expansion and the ‘elevation effect,’ Karakoram Himalaya. Mt. Res. Dev. 2005, 25, 332–340. [Google Scholar] [CrossRef]
- Sakai, A.; Fujita, K. Contrasting glacier responses to recent climate change in high-mountain Asia. Sci. Rep. 2017, 7, 13717. [Google Scholar] [CrossRef]
- Azam, M.F.; Wagnon, P.; Berthier, E.; Vincent, C.; Fujita, K.; Kargel, J.S. Review of the status and mass changes of Himalayan-Karakoram glaciers. J. Glaciol. 2018, 64, 61–74. [Google Scholar] [CrossRef]
- Fowler, H.J.; Archer, D.R. Conflicting signals of climate change in the Upper Indus basin. J. Clim. 2006, 19, 4276–4293. [Google Scholar] [CrossRef]
- Shrestha, A.B.; Wake, C.; Mayewski, P.A.; Dibb, J.E. Maximum temperature trends in the Himalaya and its vi-cinity: Analysis based on temperature records from Nepal for the period 1971–1994. J. Clim. 1999, 12, 2276–2286. [Google Scholar] [CrossRef]
- Kattel, D.B.; Yao, T.; Yang, K.; Tian, L.; Yang, G.; Joswiak, D. Temperature lapse rate in complex mountain terrain on the southern slope of the Central Himalayas. Theor. Appl. Climatol. 2013, 113, 671–682. [Google Scholar] [CrossRef]
- Nayava, J.L.; Adhikary, S.; Bajracharya, O.R. Spatial and temporal variation of surface air temperature at different altitude zone in recent 30 years over Nepal. Mausam 2017, 683, 417–428. [Google Scholar]
- Karl, T.R.; Jones, P.D.; Knight, R.W.; Kukla, G.; Plummer, N.; Razuvayev, V.; Gallo, K.P.; Lindseay, J.; Charlson, R.J.; Peterson, T.C. A new perspective on recent global warming—Asymmetric trends of daily maximum and minimum temperature. Bull. Am. Meteorol. Soc. 1993, 74, 1007–1023. [Google Scholar] [CrossRef]
- Jones, P.D.; New, M.; Parker, D.E.; Martin, S.; Rigor, I.G. Surface air temperature and its changes over the past 150 years. Rev. Geophys. 1999, 37, 173–199. [Google Scholar] [CrossRef]
- Tong, S.; Li, X.; Zhang, J.; Bao, Y.; Bao, Y.; Na, L.; Si, A. Spatial and temporal variability in extreme temperature and precipitation events in Inner Mongolia (China) during 1960–2017. Sci. Total Environ. 2019, 649, 75–89. [Google Scholar] [CrossRef]
- Panda, D.K.; Mishra, A.; Kumar, A.; Mandal, K.; Thakur, A.K.; Srivastava, R.C. Spatiotemporal patterns in the mean and extreme temperature indices of India, 1971-2005. Int. J. Clim. 2014, 34, 3585–3603. [Google Scholar] [CrossRef]
- Miller, J.D.; Immerzeel, W.W.; Rees, G. Climate change impacts on glacier hydrology and river discharge in the Hindukush-Himalayas. Mt. Res. Dev. 2012, 32, 461–467. [Google Scholar] [CrossRef]
- Latif, Y.; Yao, M.; Yaseen, M.; Muhammad, S.; Wazir, M.A. Spatial analysis of temperature time series over the Upper Indus Basin (UIB) Pakistan. Theor. Appl. Clim. 2019, 139, 741–758. [Google Scholar] [CrossRef]
- Yaseen, M.; Ahmad, I.; Guo, J.; Azam, M.I.; Latif, Y. Spatiotemporal Variability in the Hydrometeorological Time-Series over Upper Indus River Basin of Pakistan. Adv. Meteorol. 2020, 2020, 5852760. [Google Scholar] [CrossRef]
- Rajbhandari, R.; Shrestha, A.B.; Kulkarni, A.; Patwardhan, S.K.; Bajracharya, S.R. Projected changes in climate over the Indus river basin using a high resolution regional climate model (PRECIS). Clim. Dyn. 2014, 44, 339–357. [Google Scholar] [CrossRef]
- Khattak, M.; Babel, M.; Sharif, M. Hydro-meteorological trends in the upper Indus River basin in Pakistan. Clim. Res. 2011, 46, 103–119. [Google Scholar] [CrossRef]
- Hasson, S.U.; Böhner, J.; Lucarini, V. Prevailing climatic trends and runoff response from Hindukush–Karakoram–Himalaya, upper Indus Basin. Earth Syst. Dyn. 2017, 8, 337–355. [Google Scholar] [CrossRef]
- Bashir, F.; Zeng, X.; Gupta, H.; Hazenberg, P. A Hydrometeorological Perspective on the Karakoram Anomaly Using Unique Valley-Based Synoptic Weather Observations. Geophys. Res. Lett. 2017, 44, 10470–10478. [Google Scholar] [CrossRef]
- Lutz, A.; Immerzeel, W.W.; Kraaijenbrink, P.D.A.; Shrestha, A.B.; Bierkens, M.F.P. Climate Change Impacts on the Upper Indus Hydrology: Sources, Shifts and Extremes. PLoS ONE 2016, 11, e0165630. [Google Scholar] [CrossRef]
- Ali, S.; Li, D.; Congbin, F.; Khan, F. Twenty first century climatic and hydrological changes over Upper Indus Basin of Himalayan region of Pakistan. Environ. Res. Lett. 2015, 10, 014007. [Google Scholar] [CrossRef]
- Ali, S.; Kiani, R.S.; Reboita, M.S.; Dan, L.; Eum, H.; Cho, J.; Dairaku, K.; Khan, F.; Shreshta, M.L. Identifying hotspots cities vulnerable to climate change in Pakistan under CMIP5 climate projections. Int. J. Clim. 2021, 41, 559–581. [Google Scholar] [CrossRef]
- Khan, F.; Pilz, J.; Ali, S. Improved hydrological projections and reservoir management in the Upper Indus Basin under the changing climate. Water Environ. J. 2017, 31, 235–244. [Google Scholar] [CrossRef]
- Archer, D. Contrasting hydrological regimes in the upper Indus Basin. J. Hydrol. 2003, 274, 198–210. [Google Scholar] [CrossRef]
- Pomee, M.S.; Ashfaq, M.; Ahmad, B.; Hertig, E. Modeling regional precipitation over the Indus River basin of Pakistan using statistical downscaling. Theor. Appl. Clim. 2020, 142, 29–57. [Google Scholar] [CrossRef]
- Ashfaq, M.; Rastogi, D.; Mei, R.; Touma, D.; Leung, L.R. Sources of errors in the simulation of south Asian summer monsoon in the CMIP5 GCMs. Clim. Dyn. 2016, 49, 193–223. [Google Scholar] [CrossRef]
- Sperber, K.R.; Annamalai, H.; Kang, I.-S.; Kitoh, A.; Moise, A.; Turner, A.; Wang, B.; Zhou, T. The Asian summer monsoon: An intercomparison of CMIP5 vs. CMIP3 simulations of the late 20th century. Clim. Dyn. 2013, 41, 2711–2744. [Google Scholar] [CrossRef]
- Cherchi, A.; Annamalai, H.; Masina, S.; Navarra, A. South Asian Summer Monsoon and the Eastern Mediterranean Climate: The Monsoon–Desert Mechanism in CMIP5 Simulations. J. Clim. 2014, 27, 6877–6903. [Google Scholar] [CrossRef]
- Hasson, S.U.; Böhner, J.; Chishtie, F. Low fidelity of CORDEX and their driving experiments indicates future climatic uncertainty over Himalayan watersheds of Indus basin. Clim. Dyn. 2018, 52, 777–798. [Google Scholar] [CrossRef]
- Mishra, V. Climatic uncertainty in Himalayan water towers. J. Geophys. Res. Atmos. 2015, 120, 2689–2705. [Google Scholar] [CrossRef]
- Dars, G.H.; Strong, C.; Kochanski, A.K.; Ansari, K.; Ali, S.H. The Spatiotemporal Variability of Temperature and Precipitation Over the Upper Indus Basin: An Evaluation of 15 Year WRF Simulations. Appl. Sci. 2020, 10, 1765. [Google Scholar] [CrossRef]
- Pritchard, D.M.W.; Forsythe, N.; Fowler, H.J.; O’Donnell, G.M.; Li, X.-F. Evaluation of Upper Indus Near-Surface Climate Representation by WRF in the High Asia Refined Analysis. J. Hydrometeorol. 2019, 20, 467–487. [Google Scholar] [CrossRef]
- Khan, A.J.; Koch, M. Selecting and Downscaling a Set of Climate Models for Projecting Climatic Change for Impact Assessment in the Upper Indus Basin (UIB). Climate 2018, 6, 89. [Google Scholar] [CrossRef]
- Hasson, S.U. Future Water Availability from Hindukush-Karakoram-Himalaya upper Indus Basin under Conflicting Climate Change Scenarios. Climate 2016, 4, 40. [Google Scholar] [CrossRef]
- Akhtar, M.; Ahmad, N.; Booij, M.J. The impact of climate change on the water resources of Hindukush–Karakorum–Himalaya region under different glacier coverage scenarios. J. Hydrol. 2008, 355, 148–163. [Google Scholar] [CrossRef]
- Palazzi, E.; Von Hardenberg, J.; Provenzale, A. Precipitation in the Hindu-Kush Karakoram Himalaya: Observations and future scenarios. J. Geophys. Res. Atmos. 2013, 118, 85–100. [Google Scholar] [CrossRef]
- Immerzeel, W.W.; Wanders, N.; Lutz, A.; Shea, J.M.; Bierkens, M. Reconciling high-altitude precipitation in the upper Indus basin with glacier mass balances and runoff. Hydrol. Earth Syst. Sci. 2015, 19, 4673–4687. [Google Scholar] [CrossRef]
- Trigo, R.M.; Palutikof, J.P. Precipitation Scenarios over Iberia: A Comparison between Direct GCM Output and Different Downscaling Techniques. J. Clim. 2001, 14, 4422–4446. [Google Scholar] [CrossRef]
- Kaspar-Ott, I.; Hertig, E.; Kaspar, S.; Pollinger, F.; Ring, C.; Paeth, H.; Jacobeit, J. Weights for general circulation models from CMIP3/CMIP5 in a statistical downscaling framework and the impact on future Mediterranean precipitation. Int. J. Clim. 2019, 39, 3639–3654. [Google Scholar] [CrossRef]
- Mahmood, R.; Babel, M.S. Evaluation of SDSM developed by annual and monthly sub-models for downscaling temperature and precipitation in the Jhelum basin, Pakistan and India. Theor. Appl. Clim. 2013, 113, 27–44. [Google Scholar] [CrossRef]
- Taylor, K.E.; Stouffer, R.J.; Meehl, G.A. An Overview of CMIP5 and the Experiment Design. Bull. Am. Meteorol. Soc. 2012, 93, 485–498. [Google Scholar] [CrossRef]
- Dahri, Z.H.; Moors, E.; Ludwig, F.; Ahmad, S.; Khan, A.; Ali, I.; Kabat, P. Adjustment of measurement errors to reconcile precipitation distribution in the high-altitude Indus basin. Int. J. Clim. 2018, 38, 3842–3860. [Google Scholar] [CrossRef]
- Hewitt, K. The Snow and Ice Hydrology Project: Research and training for water resource development in the Upper Indus Basin. J. Can. Pak. Coop. 1988, 2, 63–72. [Google Scholar]
- Khan, A.; Naz, B.S.; Bowling, L.C. Separating snow, clean and debris covered ice in the Upper Indus Basin, Hindukush-Karakoram-Himalayas, using Landsat images between 1998 and 2002. J. Hydrol. 2015, 521, 46–64. [Google Scholar] [CrossRef]
- Wilks, S. Statistical Methods in the Atmospheric Sciences; Academic press: Cambridge, MA, USA, 2006; p. 91. [Google Scholar]
- Pomee, M.S.; Hertig, E. Precipitation Projections over the Indus River Basin of Pakistan for the 21st century using a statistical downscaling framework. Int. J. Climatol. 2020. [Google Scholar]
- Wijngaard, J.B.; Tank, A.M.G.K.; Können, G.P. Homogeneity of 20th century European daily temperature and precipitation series. Int. J. Clim. 2003, 23, 679–692. [Google Scholar] [CrossRef]
- Dee, D.P.; Uppala, S.M.; Simmons, A.J.; Berrisford, P.; Poli, P.; Kobayashi, S.; Andrae, U.; Balmaseda, M.A.; Balsamo, G.; Bauer, P.; et al. The ERA-Interim reanalysis: Configuration and performance of the data assimilation system. Q. J. R. Meteorol. Soc. 2012, 137, 553–597. [Google Scholar] [CrossRef]
- Hersbach, H.; de Rosnay, P.; Bell, B.; Schepers, D.; Simmons, A.; Soci, C.; Abdalla, S.; Alonso-Balmaseda, M.; Balsamo, G.; Bechtold, P.; et al. Operational Global Reanalysis: Progress, Future Directions and Synergies with NWP, ERA-Report, 2018, Serie 27. Available online: https://www.ecmwf.int/node/18765 (accessed on 13 November 2019).
- Preisendorfer, R. Principal Component Analysis in Meteorology and Oceanography; Elsevier: Amsterdam, The Netherlands, 1988; p. 42. [Google Scholar]
- Philipp, A. Zirkulationsdynamische Telekonnektivität des Sommerniederschlags im Südhemisphärischen Afrika. Ph.D. Thesis, Bayerische Julius-Maximilians-Universität Würzburg, Würzburg, Germany, 2003. [Google Scholar]
- Sanford, T.J.; Frumhoff, P.C.; Luers, A.; Gulledge, J. The climate policy narrative for a dangerously warming world. Nat. Clim. Chang. 2014, 4, 164–166. [Google Scholar] [CrossRef]
- Von Storch, H.; Zwiers, F.W. Statistical Analysis in Climate Research; Amsterdam University Press: Amsterdam, The Netherlands, 1984; Volume 484. [Google Scholar]
- Taylor, K.E. Summarizing multiple aspects of model performance in a single diagram. J. Geophys. Res. Atmos. 2001, 106, 7183–7192. [Google Scholar] [CrossRef]
- Kalnay, E.; Kanamitsu, M.; Kistler, R.; Collins, W.; Deaven, D.; Gandin, L.; Iredell, M.; Saha, S.; White, G.; Woollen, J.; et al. The NCEP/NCAR 40-year reanalysis project. Bull. Am. Meteorol. Soc. 1996, 77, 437–471. [Google Scholar] [CrossRef]
- Cannon, F.; Carvalho, L.M.; Jones, C.; Norris, J. Winter westerly disturbance dynamics and precipitation in the western Himalaya and Karakoram: A wave-tracking approach. Theor. Appl. Clim. 2015, 125, 27–44. [Google Scholar] [CrossRef]
- Forsythe, N.; Hardy, A.J.; Fowler, H.J.; Blenkinsop, S.; Kilsby, C.G.; Archer, D.R.; Hashmi, M.Z. A detailed cloud fraction climatology of the upper indus basin and its impli-cations for near-surface air temperature. J. Clim. 2015, 28, 3537–3556. [Google Scholar] [CrossRef]
- Wu, J.; Zha, J.; Zhao, D. Evaluating the effects of land use and cover change on the decrease of surface wind speed over China in recent 30 years using a statistical downscaling method. Clim. Dyn. 2016, 48, 131–149. [Google Scholar] [CrossRef]
- Almazroui, M.; Saeed, S.; Saeed, F.; Islam, M.N.; Ismail, M. Projections of Precipitation and Temperature over the South Asian Countries in CMIP6. Earth Syst. Environ. 2020, 4, 297–320. [Google Scholar] [CrossRef]
- Ali, S.; Eum, H.-I.; Cho, J.; Dan, L.; Khan, F.; Dairaku, K.; Shrestha, M.L.; Hwang, S.; Nasim, W.; Khan, I.A.; et al. Assessment of climate extremes in future projections downscaled by multiple statistical downscaling methods over Pakistan. Atmos. Res. 2019, 222, 114–133. [Google Scholar] [CrossRef]
- Ashfaq, M.; Cavazos, T.; Reboita, M.S.; Torres-Alavez, J.A.; Im, E.-S.; Olusegun, C.F.; Alves, L.; Key, K.; Adeniyi, M.O.; Tall, M.; et al. Robust late twenty-first century shift in the regional monsoons in RegCM-CORDEX simulations. Clim. Dyn. 2020, 1–26. [Google Scholar] [CrossRef]
- Mahmood, R.; Mukand, S.B.; Shaofeng, J.I.A. Assessment of temporal and spatial changes of future climate in the Jhelum river basin, Pakistan and India. Weather Clim. Extrem. 2015, 10, 40–55. [Google Scholar] [CrossRef]
- Cook, E.R.; Krusic, P.J.; Jones, P.D. Dendroclimatic signals in long tree-ring chronologies from the Himalayas of Nepal. Int. J. Clim. 2003, 23, 707–732. [Google Scholar] [CrossRef]
- Nath, R.; Luo, Y.; Chen, W.; Cui, X. On the contribution of internal variability and external forcing factors to the Cooling trend over the Humid Subtropical Indo-Gangetic Plain in India. Sci. Rep. 2018, 8, 18047. [Google Scholar] [CrossRef] [PubMed]
- Saeed, F.; Hagemann, S.; Jacob, D.J. Impact of irrigation on the South Asian summer monsoon. Geophys. Res. Lett. 2009, 36, 040625. [Google Scholar] [CrossRef]
- Han, S.; Yang, Z. Cooling effect of agricultural irrigation over Xinjiang, Northwest China from 1959 to 2006. Environ. Res. Lett. 2013, 8, 024039. [Google Scholar] [CrossRef]
- Karki, R.; Hasson, S.U.; Gerlitz, L.; Talchabhadel, R.; Schickhoff, U.; Scholten, T.; Böhner, J. Rising mean and extreme near-surface air temperature across Nepal. Int. J. Clim. 2020, 40, 2445–2463. [Google Scholar] [CrossRef]
- Wilcoxon, F. Individual Comparisons by Ranking Methods. In Breakthroughs in Statistics; Springer: New York, NY, USA, 1945; Volume 1, p. 80. [Google Scholar] [CrossRef]
- Herreid, S.; Pellicciotti, F. The state of rock debris covering Earth’s glaciers. Nat. Geosci. 2020, 13, 1–7. [Google Scholar] [CrossRef]
- Coen, M.C.; Andrews, E.; Aliaga, D.; Andrade, M.; Angelov, H.; Bukowiecki, N.; Ealo, M.; Fialho, P.; Flentje, H.; Hallar, A.G.; et al. Identification of topographic features influencing aerosol observations at high altitude stations. Atmos. Chem. Phys. 2018, 18, 12289–12313. [Google Scholar] [CrossRef]
- Zhao, A.; Bollasina, M.A.; Stevenson, D.S. Strong Influence of Aerosol Reductions on Future Heatwaves. Geophys. Res. Lett. 2019, 46, 4913–4923. [Google Scholar] [CrossRef]
- Wake, C.P. Glaciochemical investigations as a tool for determining the spatial and seasonal variation of snow accumula-tion in the Central Karakoram, northern Pakistan. Ann. Glaciol. 1989, 13, 279–284. [Google Scholar] [CrossRef]
- Myhre, G.; Myhre, C.E.L.; Samset, B.H.; Storelvmo, T. Aerosols and their Relation to Global Climate and Climate Sen-sitivity. Nat. Educ. Knowl. 2013, 4, 7. [Google Scholar]
- Bentsen, M.; Bethke, I.; Debernard, J.B.; Iversen, T.; Kirkevåg, A.; Seland, Ø.; Drange, H.; Roelandt, C.; Seierstad, I.A.; Hoose, C.; et al. The Norwegian Earth System Model, NorESM1-M—Part 1: Description and basic evaluation of the physical climate. Geosci. Model. Dev. 2013, 6, 687–720. [Google Scholar] [CrossRef]
- Knutti, R.; Sedláček, J.; Sanderson, B.M.; Lorenz, R.; Fischer, E.M.; Eyring, V. A climate model projection weighting scheme accounting for performance and interdependence. Geophys. Res. Lett. 2017, 44, 1909–1918. [Google Scholar] [CrossRef]
- Lanzante, J.R.; Dixon, K.W.; Nath, M.J.; Whitlock, C.E.; Adams-Smith, D. Some Pitfalls in Statistical Downscaling of Future Climate. Bull. Am. Meteorol. Soc. 2018, 99, 791–803. [Google Scholar] [CrossRef]
- Palazzi, E.; Von Hardenberg, J.; Terzago, S.; Provenzale, A. Precipitation in the Karakoram-Himalaya: A CMIP5 view. Clim. Dyn. 2014, 45, 21–45. [Google Scholar] [CrossRef]
- Muhammad, S.; Tian, L.; Ali, S.; Latif, Y.; Wazir, M.A.; Goheer, M.A.; Saifullah, M.; Hussain, I.; Shiyin, L. Thin debris layers do not enhance melting of the Karakoram glaciers. Sci. Total. Environ. 2020, 746, 141119. [Google Scholar] [CrossRef]
Publisher’s Note: MDPI stays neutral with regard to jurisdictional claims in published maps and institutional affiliations. |
© 2021 by the authors. Licensee MDPI, Basel, Switzerland. This article is an open access article distributed under the terms and conditions of the Creative Commons Attribution (CC BY) license (http://creativecommons.org/licenses/by/4.0/).

