Article

Analyzing the Probability of Acquiring Cloud-Free Imagery in China with AVHRR Cloud Mask Data

1
State Key Laboratory of Sever Weather, Chinese Academy of Meteorological Sciences, Beijing 100081, China
2
Collaborative Innovation Center on Forecast and Evaluation of Meteorological Disasters, Nanjing University of Information Science & Technology, Nanjing 210044, China
3
Key Laboratory for Geo-Environmental Monitoring of Coastal Zone of the Ministry of Natural Resources & Guangdong Key Laboratory of Urban Informatics, Shenzhen University, Shenzhen 518060, China
*
Author to whom correspondence should be addressed.
Atmosphere 2021, 12(2), 214; https://doi.org/10.3390/atmos12020214
Submission received: 25 January 2021 / Accepted: 2 February 2021 / Published: 4 February 2021
(This article belongs to the Section Atmospheric Techniques, Instruments, and Modeling)

Abstract

:
Optical remote sensing data are used widely in many fields (such as agriculture, resource management and the environment), especially for the vast territory of China; however, the application of these data is usually limited by clouds. Although it is valuable to analyze the probability of acquiring cloud-free imagery (PACI), PACI using different sensors at the pixel level across China has not been reported. In this study, the PACI of China was calculated with daily Advanced Very High Resolution Radiometer (AVHRR) cloud mask data from 1990 to 2019. The results showed that (1) PACI varies dramatically in different regions and months in China. The value was larger in autumn and winter, and the largest figure reached 49.55% in October in Inner Mongolia (NM). In contrast, relatively small values occurred in summer, and the minimum value (5.26%) occurred in June in South China (SC). (2) As the climate changes, the PACI has increased significantly throughout the country and most regions, especially in North China (NC), with a growth rate of 1.9% per decade. The results can be used as a reference for selecting appropriate optical sensors and observation times in areas of interest.

1. Introduction

Remote sensing technology with a wide monitoring range and strong timeliness has been widely used for investigations, monitoring, analyses and predictions in many fields (such as agriculture, resource management and the environment), especially for China’s large landmass [1,2,3]. Among these technologies, the most commonly used data are optical remote sensing imagery [4]. Cloud cover is one of the most serious problems encountered worldwide when using optical remote sensing [5,6], as cloud cover impedes optical instruments from obtaining clear views of the planetary surface [7,8]. Under global climate change, cloud cover changes with changes in other climate parameters (i.e., temperature, precipitation) [9,10]. Besides, fused images from different satellite systems are needed to enable a high spatiotemporal resolution for China, considering its vast territory and complex climate [11]. Therefore, it is necessary to determine the frequencies and spatiotemporal characteristics of cloud cover and their impacts on the acquisition of cloud-free imagery from different Earth observation systems in China. These factors are crucial for choosing the appropriate remote sensing imagery in many studies (i.e., research on the crop growing season in agriculture, the monitoring of resources and the environment) because we need to select optical remote sensing imagery with as little cloud cover as possible in a period of interest for a given study area [12].
The frequencies and variations in cloud-free imagery have been studied around the world [13,14,15]. Two types of methods have been used in these studies: (1) Cloud cover information from scene-based metadata of imagery has been used to calculate spatiotemporal patterns of the probability of acquiring cloud-free imagery (PACI). This method can calculate the PACI under different amounts of cloud cover, but the results are too vague to analyze due to the spatial patterns of clouds within a scene [16,17,18]. (2) The PACI has been calculated using cloud mask data at the pixel level [11,15]. It is possible to clarify the location of the cloud in the scene. Most studies used specific sensors, and these results lack universality and cannot be applied to optical sensors with different revisit intervals (for example, Landsat or MODIS) [19,20]. When the data come from satellite sensors with a low revisit frequency, the cloud cover data lack temporal coverage (such as Landsat) [6,13]. Furthermore, the length of time for the studies was limited by the remote sensing data, leading to a degree of failure in analyzing the changes in cloud cover at the climate scale (such as MODIS) [15,21]. Therefore, we selected the Advanced Very High Resolution Radiometer (AVHRR) with a high revisit frequency and long-term observation.
AVHRR is a sensor carried on the National Oceanic and Atmospheric Administration’s (NOAA’s) Polar Orbiting Environmental Satellites (POES), beginning with Television and Infra-Red Observation Satellite-N (TIROS-N) in 1978 [22]. AVHRR provides global imagery every day, permitting cloud cover monitoring around the globe on a daily basis [23]. Therefore, it provides an opportunity to explore the spatiotemporal characteristics of cloud cover and estimate the possibility of obtaining cloud-free images from sensors with different revisit frequencies.
In China, the spatial patterns in the PACI have been analyzed at the scene level using Landsat Operational Land Imager (OLI) images acquired from April 2013 to October 2016 [19]. However, what is the PACI with different revisit frequencies at the pixel level? How does the PACI in China change over time under global climate change? This study attempts to answer these questions. Based on AVHRR daily cloud mask data, the spatio-temporal characteristics of PACI are analyzed, including annual and monthly variations characteristics on national and regional scales, and the number of days required to acquire cloud-free imagery monthly with different revisit frequencies is calculated. The results can be used to estimate the applicability and limitations of applying optical remote sensing images in China.

2. Data and Methods

2.1. Study Area

China has a vast territory with a unique geographical location and complex landforms. Because of its geography and topography, China’s climate is complicated and diversified from region to region [24] (Figure 1). China has four distinct seasons, namely spring (March–May), summer (June–August), autumn (September–November), and winter (December–February of the following year) [19]. In the winter, the climate is mainly cold and dry, while during the summer, precipitation generally increases from northwest to southeast [25]. Eastern China has a hot and humid climate [26]. Cloud cover is related to climate; the rainy season has high cloud cover. Cloud-free imagery is easily obtained in the cold–dry season.

2.2. AVHRR Cloud Mask

The daily cloud mask data used in this study were acquired from NOAA’s National Climatic Data Center (http://www.ncdc.noaa.gov) and were generated using the cloud flag in the Quality Assessment (QA) layer of AVH09C1. The QA layer has a 15-bit binary value. The second bit provides information of whether the data represent either cloudy (1) or clear (0) conditions. The data are gridded at a resolution of 5 km. The analysis period spans 30 years from January 1990 to December 2019. The sensor constantly collected data during this period.

2.3. Data Processing

To calculate the PACI in China, the daily cloud mask data from AVHRR were statistically analyzed. The monthly PACI from 1990–2019 at the pixel level was calculated as shown below. In total, 360 images were collected for the monthly PACI.
M o n t h l y     P A C I   %   = T o t a l   d a y s   o f   c l e a r   s k y T o t a l   o b s e r v a t i o n   d a y s × 100 %
where the monthly PACI is the percentage of clear sky occurring each month. The total days of clear sky are the number of “clear (0)” days each month. The total observation days are summarized by accumulating the observed days within a month. The abnormal images in the 360 images for the monthly PACI were then eliminated based on the Pauta criterion using their national average. The basic concept of the Pauta criterion is to set a confidence interval to detect the outliers [27], which can be described as follows:
p x = 0.68               i f   x μ σ , μ + σ 0.95       i f   x μ 2 σ , μ + 2 σ 0.99       i f   x μ 3 σ , μ + 3 σ
where μ and σ are the mean and standard deviation of the sample data, respectively. When the measured data are within the range of μ 3 σ , μ + 3 σ , 1% of the data are outliers and are therefore not desirable, so these data should be removed. In this study, we set confidence intervals within μ 3 σ , μ + 3 σ to filter out the errors caused by the sensor measurement.
According to the Pauta criterion, we successfully eliminated 11 abnormal images out of 360 monthly PACI images, including September to December 1994, May to July 1996, January 2014 and October to December 2019. Based on the eligible data, the PACI was analyzed in China.

2.4. Methods

2.4.1. Statistics for the PACI in China

The PACI and monthly PACI were calculated in China using the eligible data by applying the method of the total average and monthly average, respectively. Based on the monthly PACI, the regional average was calculated to analyze the characteristics of the monthly PACI. China was separated by the Meteorological Geographical Division in China acquired from the China Meteorological Administration (CMA). The Meteorological Geographical Division in China was established based on climate indicators, including 11 regions (Figure 1).
To show the annual variation characteristics of PACI, the annual PACI and monthly interannual standard deviation were calculated by the annual average and monthly standard deviation of the eligible monthly PACI from 1990–2019, respectively. Subsequently, using the national and regional average of the annual PACI, the annual time series of the PACI was calculated. Furthermore, the tendency rates of the annual PACI were computed using a linear trend by least squares for the study period [26]. The linear correlation coefficient (R) was tested for significance to characterize the significance of the trend for the time series due to its extensive application [28].

2.4.2. Calculating the Availability of Acquiring Cloud-Free Imagery by Sensors with Various Revisit Intervals

For n-day revisit sensors, the days on which cloud-free imagery could be acquired per month are the sum of cloud-free imagery in a month between n days. As the sensor’s first visit can be any one of the first n days per month (for a sensor with an n-day revisit cycle), there are n possible cases. As all n cases are possible, the days of cloud-free images are estimated as the average of the n cases in a month. Theoretically, n can be the longest revisit frequency among all optical sensors; in practice, we investigated an n value of up to 16, according to optical Earth observation systems [15]. Therefore, the number of days on which it is possible to acquire cloud-free imagery monthly with various revisit intervals is a simple function related to the revisit interval and the monthly PACI for a 1-day revisiting sensor as the basis. This function can be calculated as follows:
M o n t h l y     d a y s   o f   a c q u i s i t i o n   = M o n t h l y     P A C I     × D n
where D is the number of days in the month corresponding to the monthly PACI. In this study, February was set to 28.25 days. According to the algorithm, we calculated the curve of the number of days to acquire cloud-free imagery monthly with different revisit frequencies in the months with the highest and lowest PACI throughout the country and regions.

2.4.3. Validation of the Results

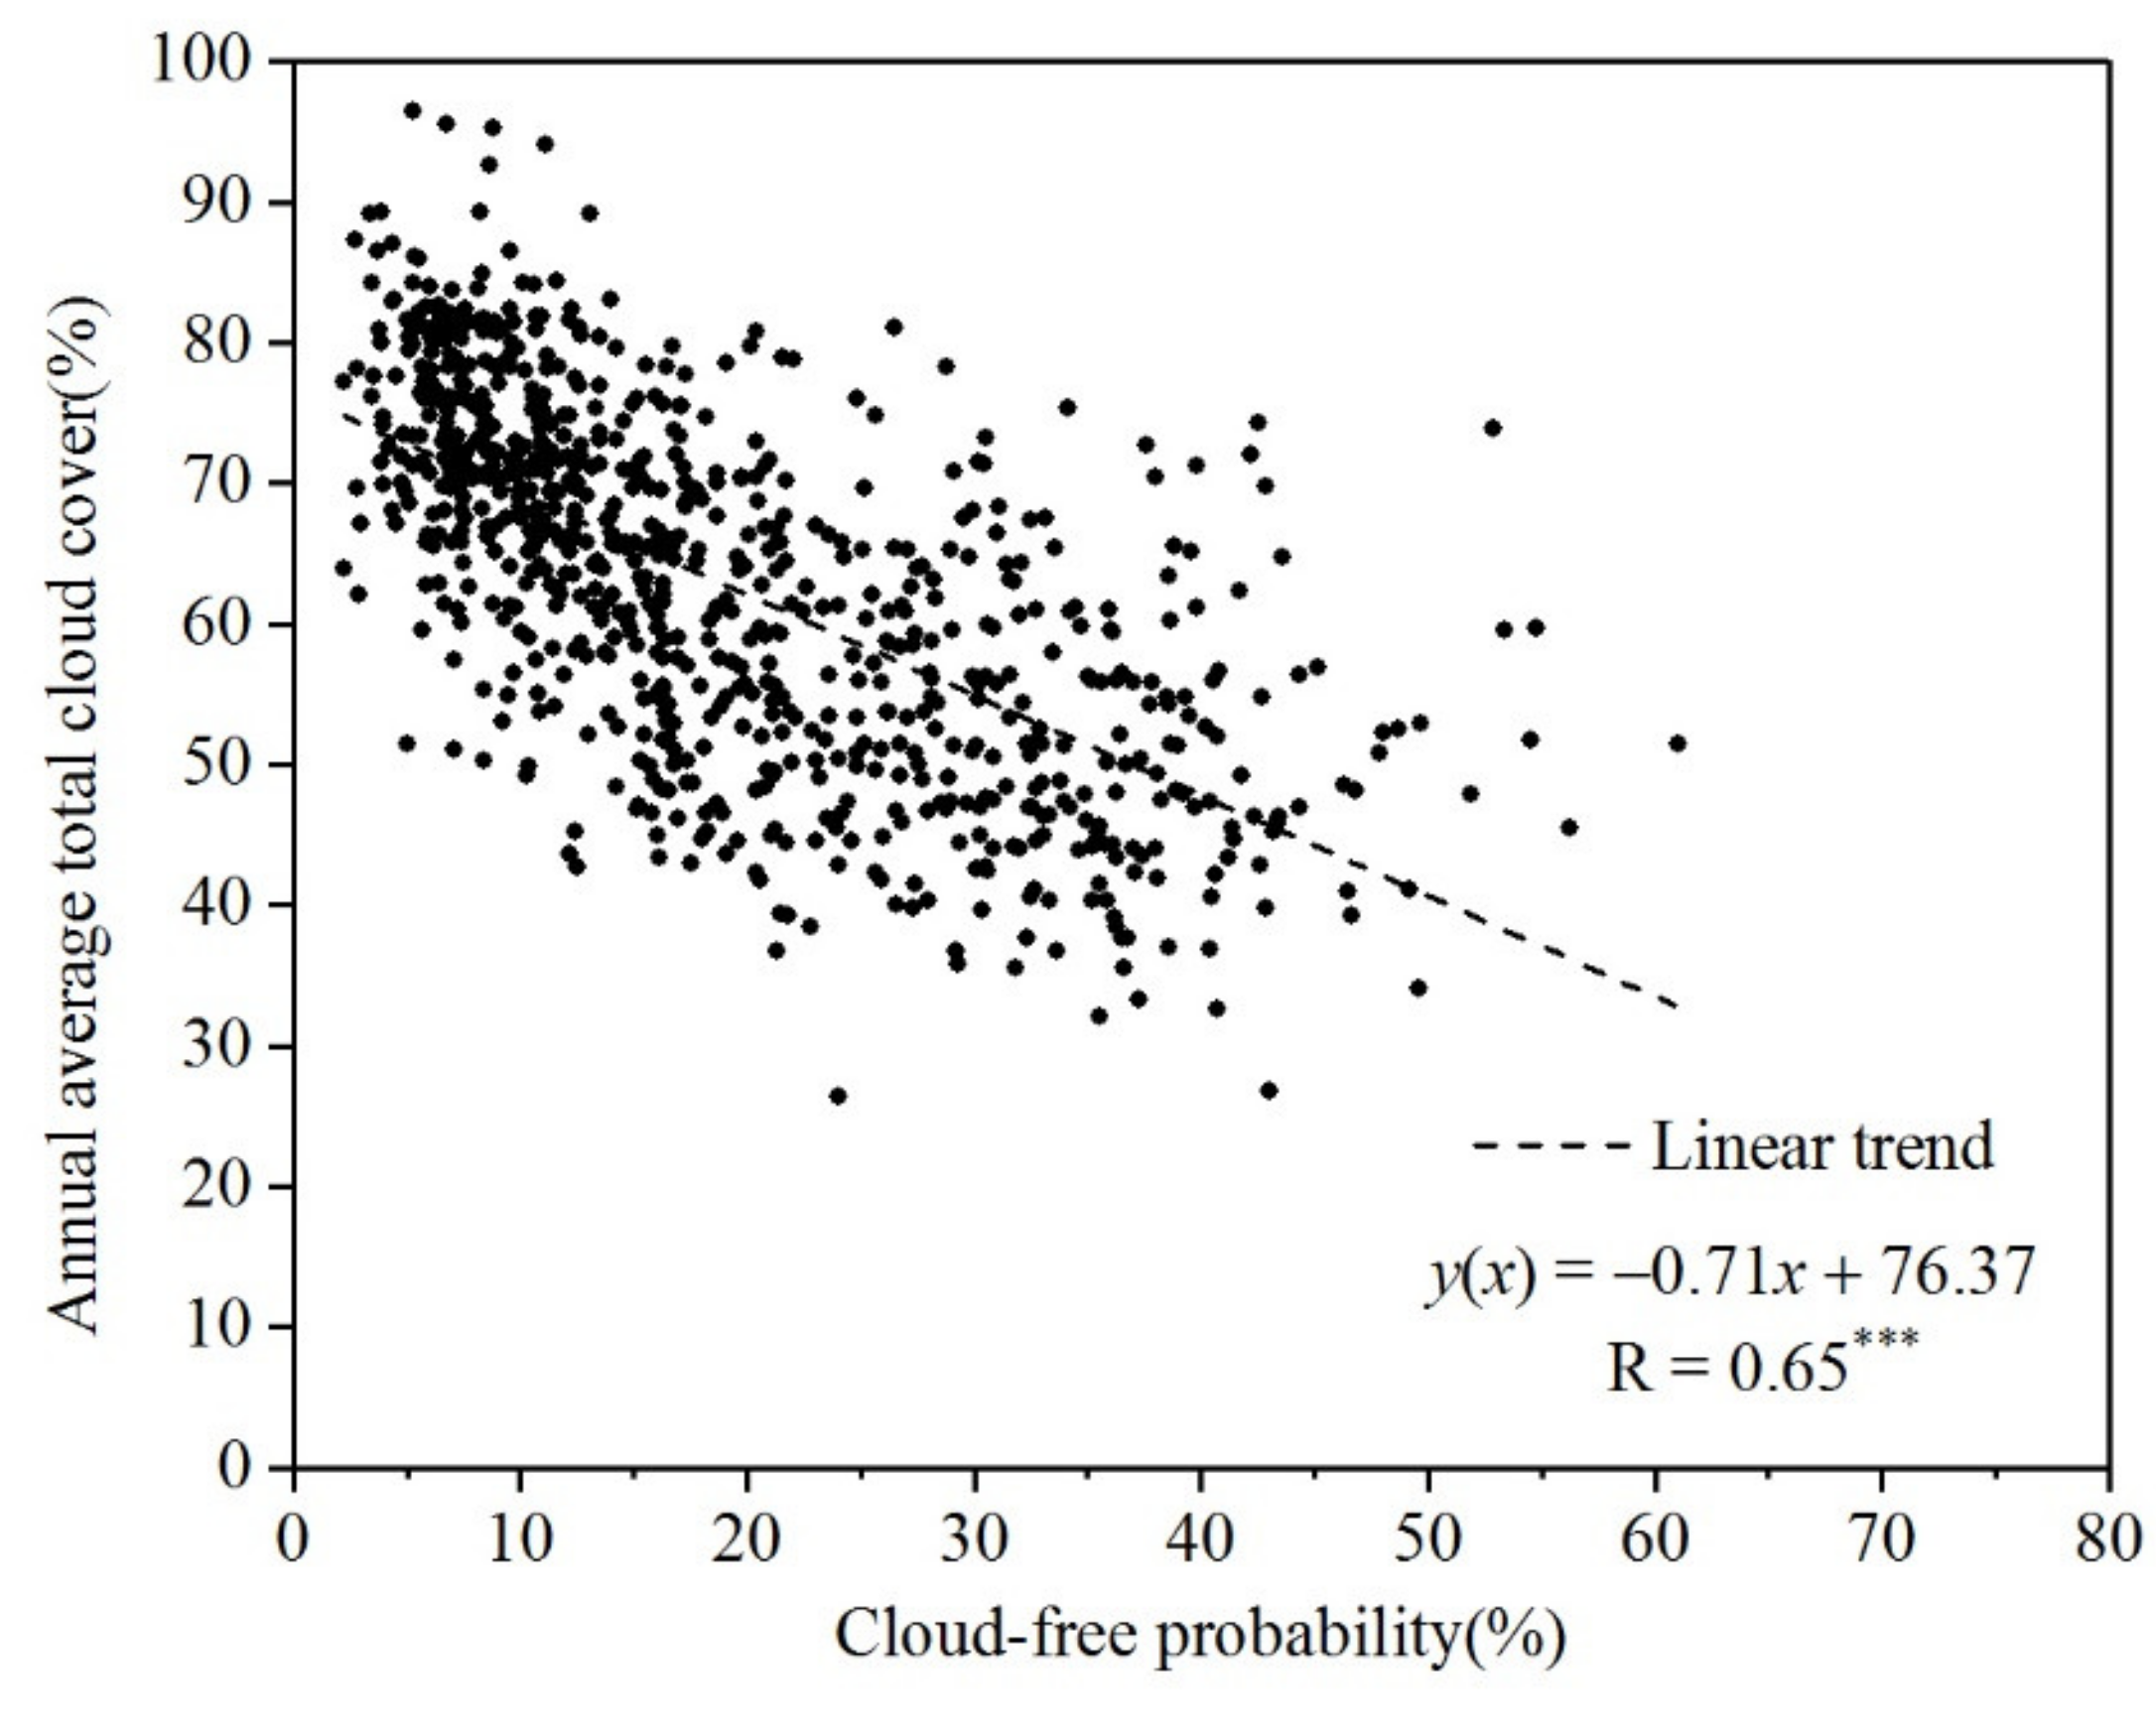
Because it is not possible to obtain cloud cover with the same spatial resolution, validating the results is difficult. Therefore, we validated the effectiveness of the results by comparing the PACI with the meteorological data sets. We obtained the monthly average total cloud cover of 848 weather stations in China of 2019 from the monthly meteorological dataset of basic meteorological elements of China National Surface Weather Stations. The annual average total cloud cover in China was calculated by averaging the monthly average total cloud cover of 2019. The Kriging interpolation method was used to interpolate point values onto a raster with the same spatial resolution as the PACI. Kriging is a powerful type of spatial interpolation that uses the spatial correlation between sampled points to interpolate the values in the spatial field. Then, we obtained the PACI of the weather station’s location and created a linear regression model for the PACI and the annual average total cloud cover.

3. Results

3.1. The PACI in China

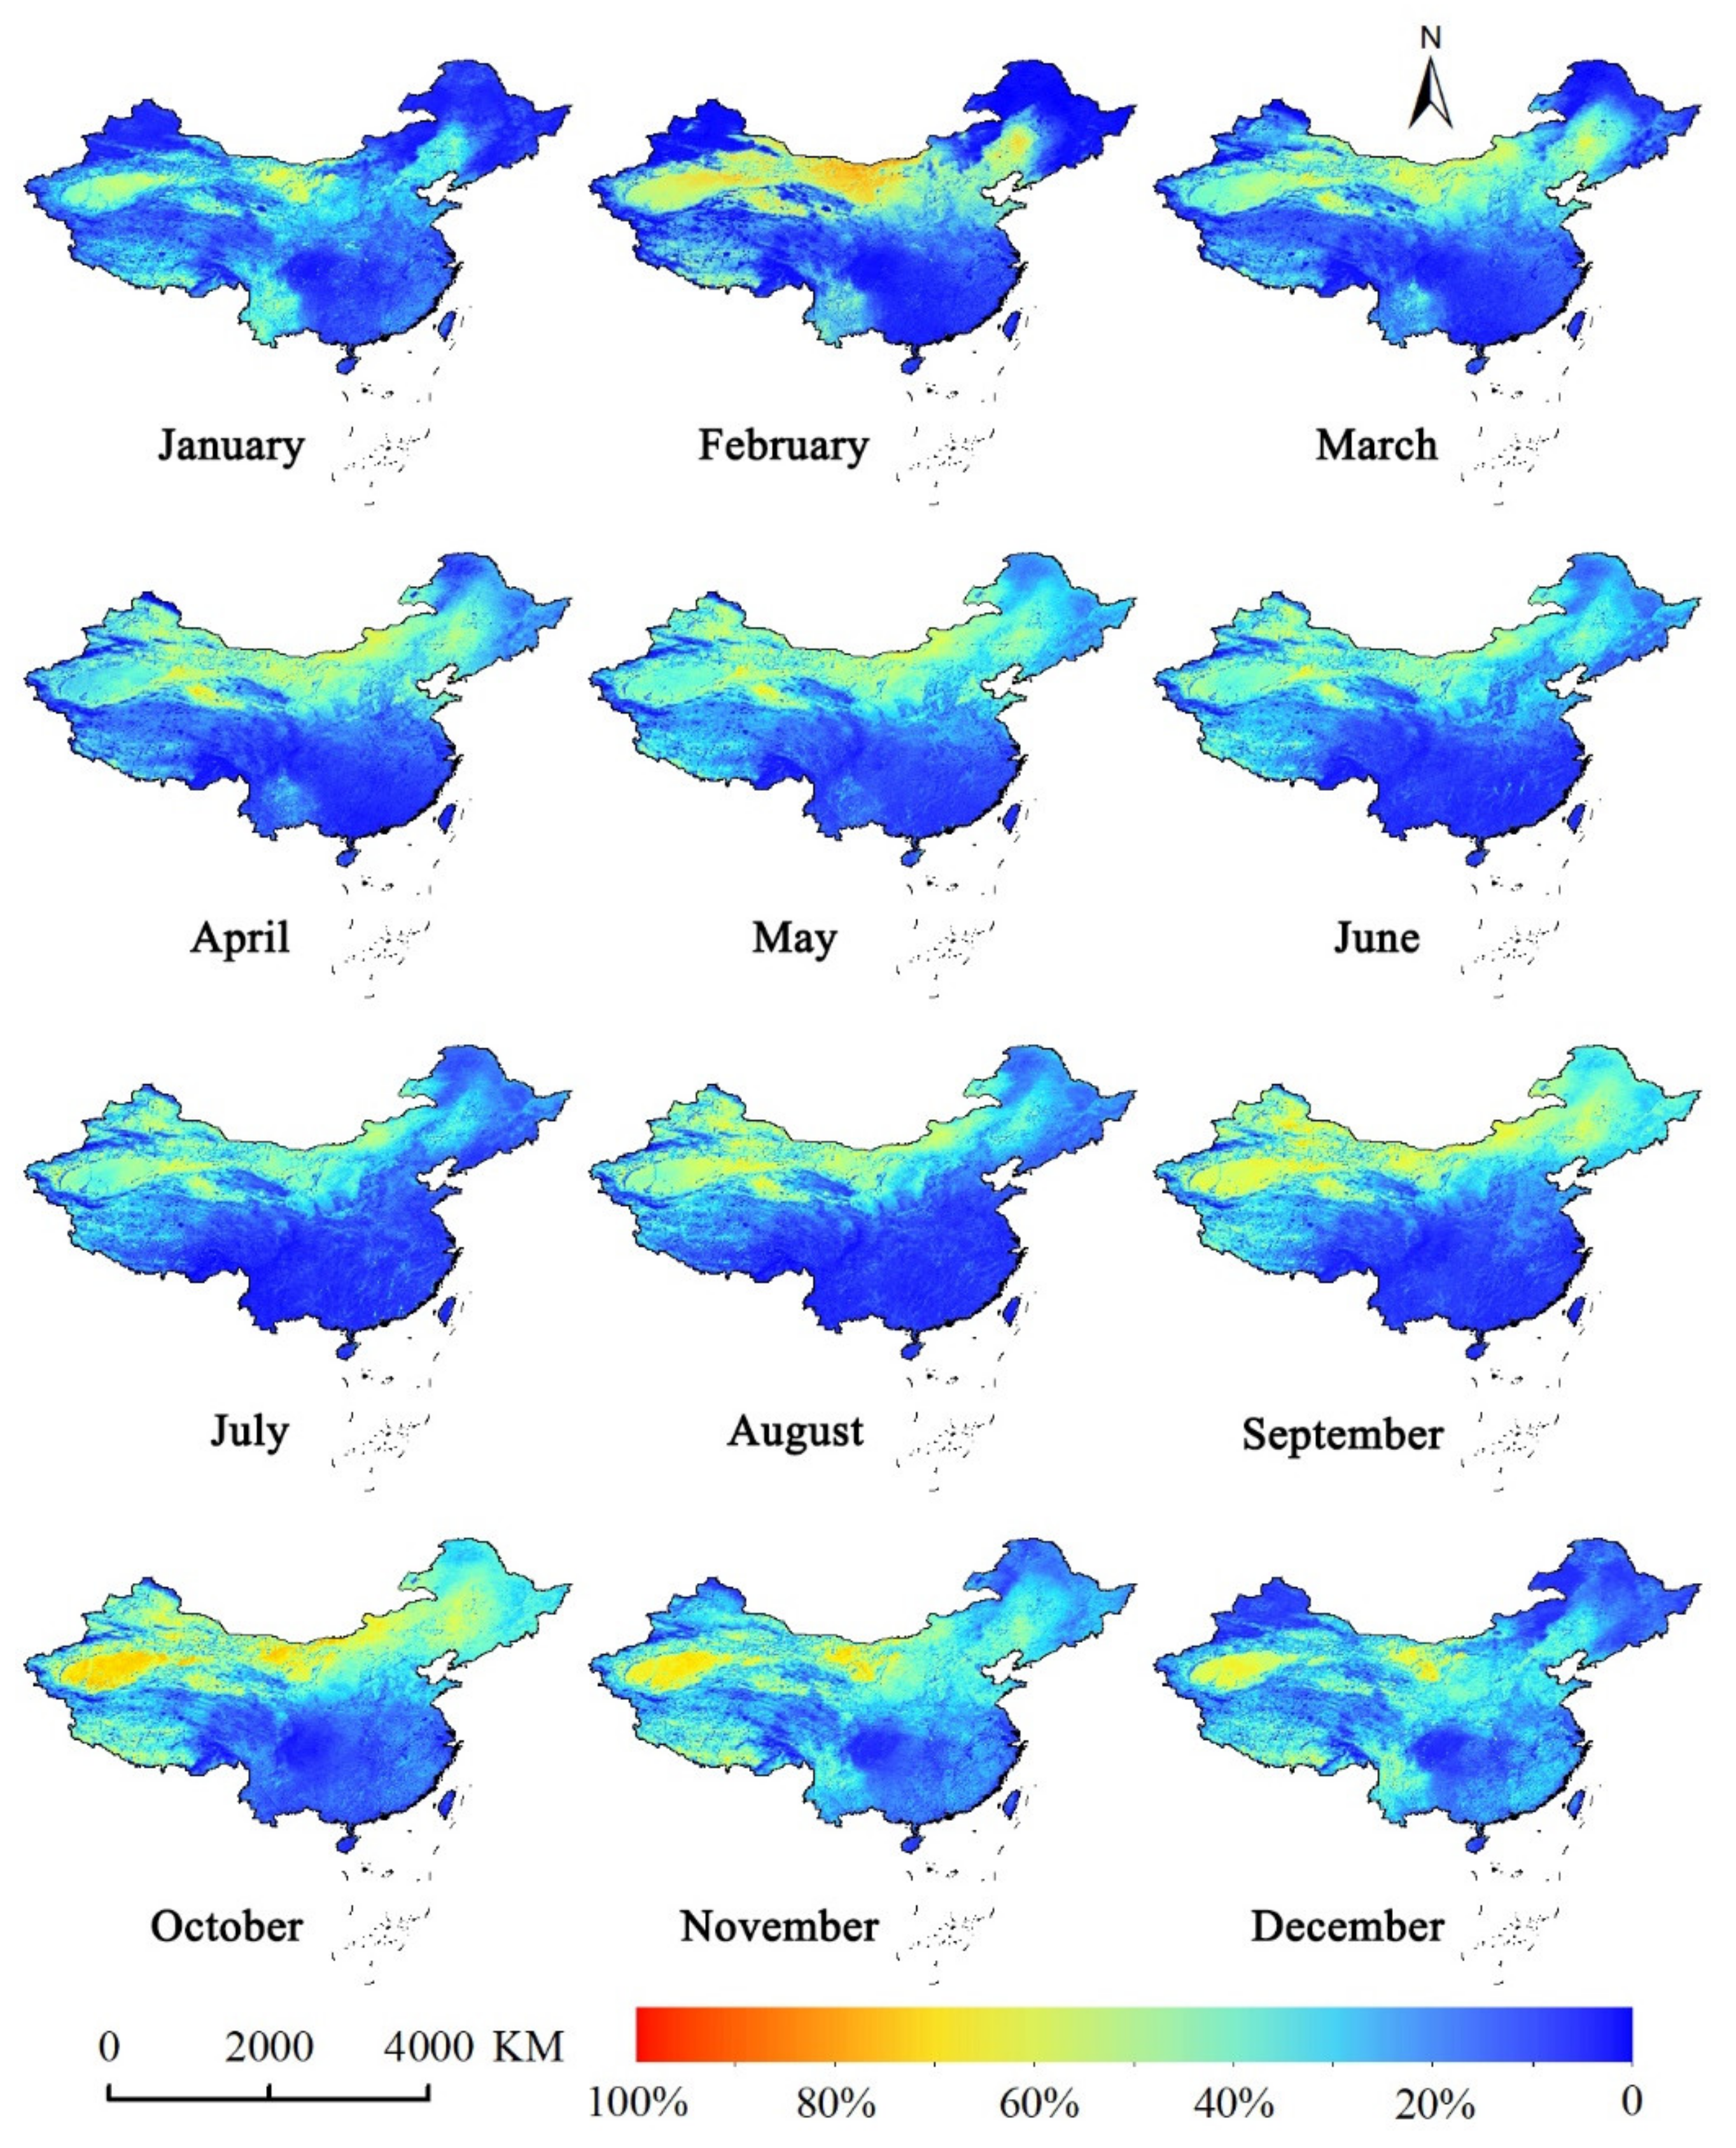
The monthly PACI images showed that the PACI gradually increased from southeast to northwest in China (Figure 2). The lowest PACI was in the Sichuan Basin, and the value was extremely low throughout the year. In contrast, the highest PACI occurred in the Taklimakan Desert. The PACI in most of China was below 80%. The lowest PACI (15.61%) was in summer in China, while the highest PACI (22.19%) occurred in autumn. The overall national performance was best in November. Therefore, if remote sensing optical images are used to obtain information at the national scale, the best results will be achieved in November. The difference in the PACI was the most obvious in February, which is the best time to use the optical remote sensing image for the east of Inner Mongolia (NM) and southeast of northeastern China (NEC).
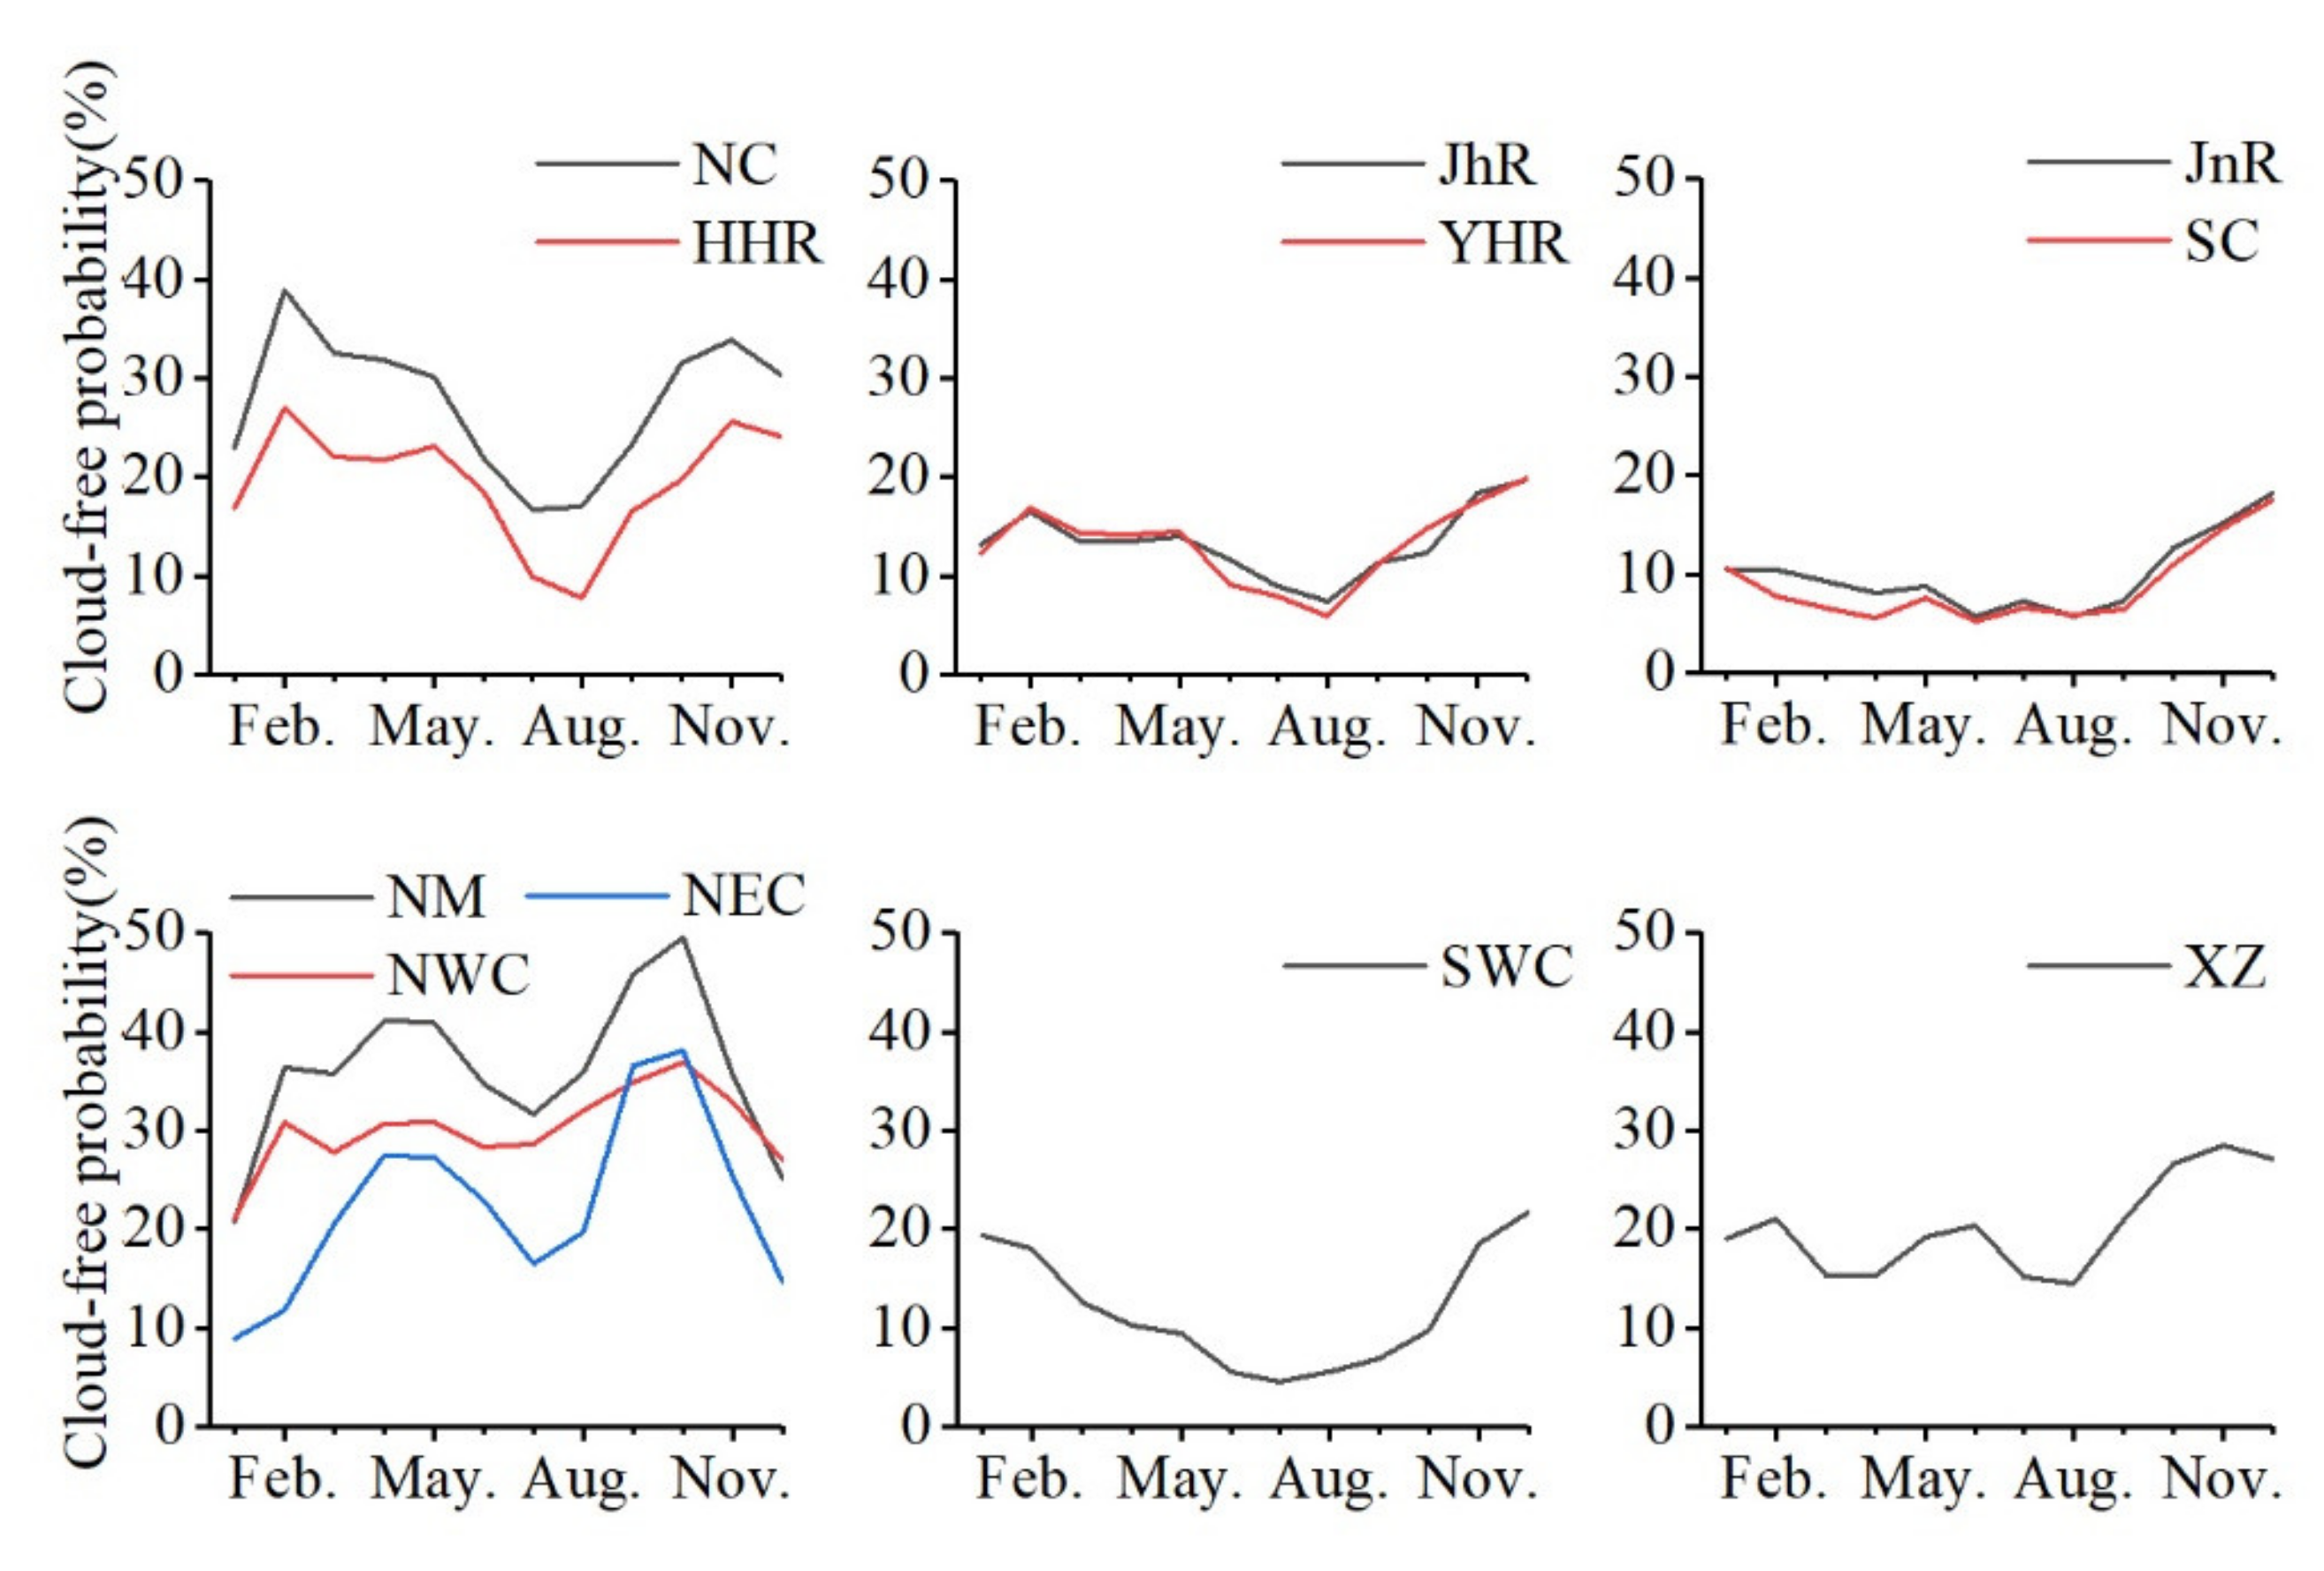
There were noticeable regional differences in the monthly variations in the PACI (Figure 3). North China (NC), the Huang-Huai region (HHR), the Jianghan region (JhR), the Yangtze-Huaihe region (YHR), the Jiangnan region (JnR) and south China (SC) are located on the eastern coast of China (Figure 1). Their monthly variations of the PACI were similar. The PACI gradually decreased from winter to summer and gradually increased after autumn. From north to south, the PACI and the variation of the PACI gradually reduced. The highest PACI was 38.85% in February for NC, and the lowest was 16.71% in July, with a difference of roughly 20%. The highest PACI was 17.54% in SC, and the lowest was 5.26%, with a difference of approximately 12%. The monthly variation in southwest China (SWC) was smoother than that for the eastern coast. The monthly variations of the PACI in northwest China (NWC), NM and northeast China (NEC) were similar. The higher PACIs were in April, May and October, and the lower PACIs occurred in January, July and December. The variation in Tibet (XZ) differed from that in other areas. The highest PACI for XZ was 28.57% in November. In China, the highest PACI was 49.55% in October for NM, while the lowest was 4.65% in July for SWC.

3.2. Interannual Variation of PACI

In this study, the interannual variability was represented by the standard deviation. As evident from the standard deviations of the PACI, the uncertainty varied among months and regions (Figure 4). A lower standard deviation for the PACI occurred in spring and summer, while a higher standard deviation occurred in autumn and winter. In general, the standard deviation was the largest in December. The national average was 13.93%.
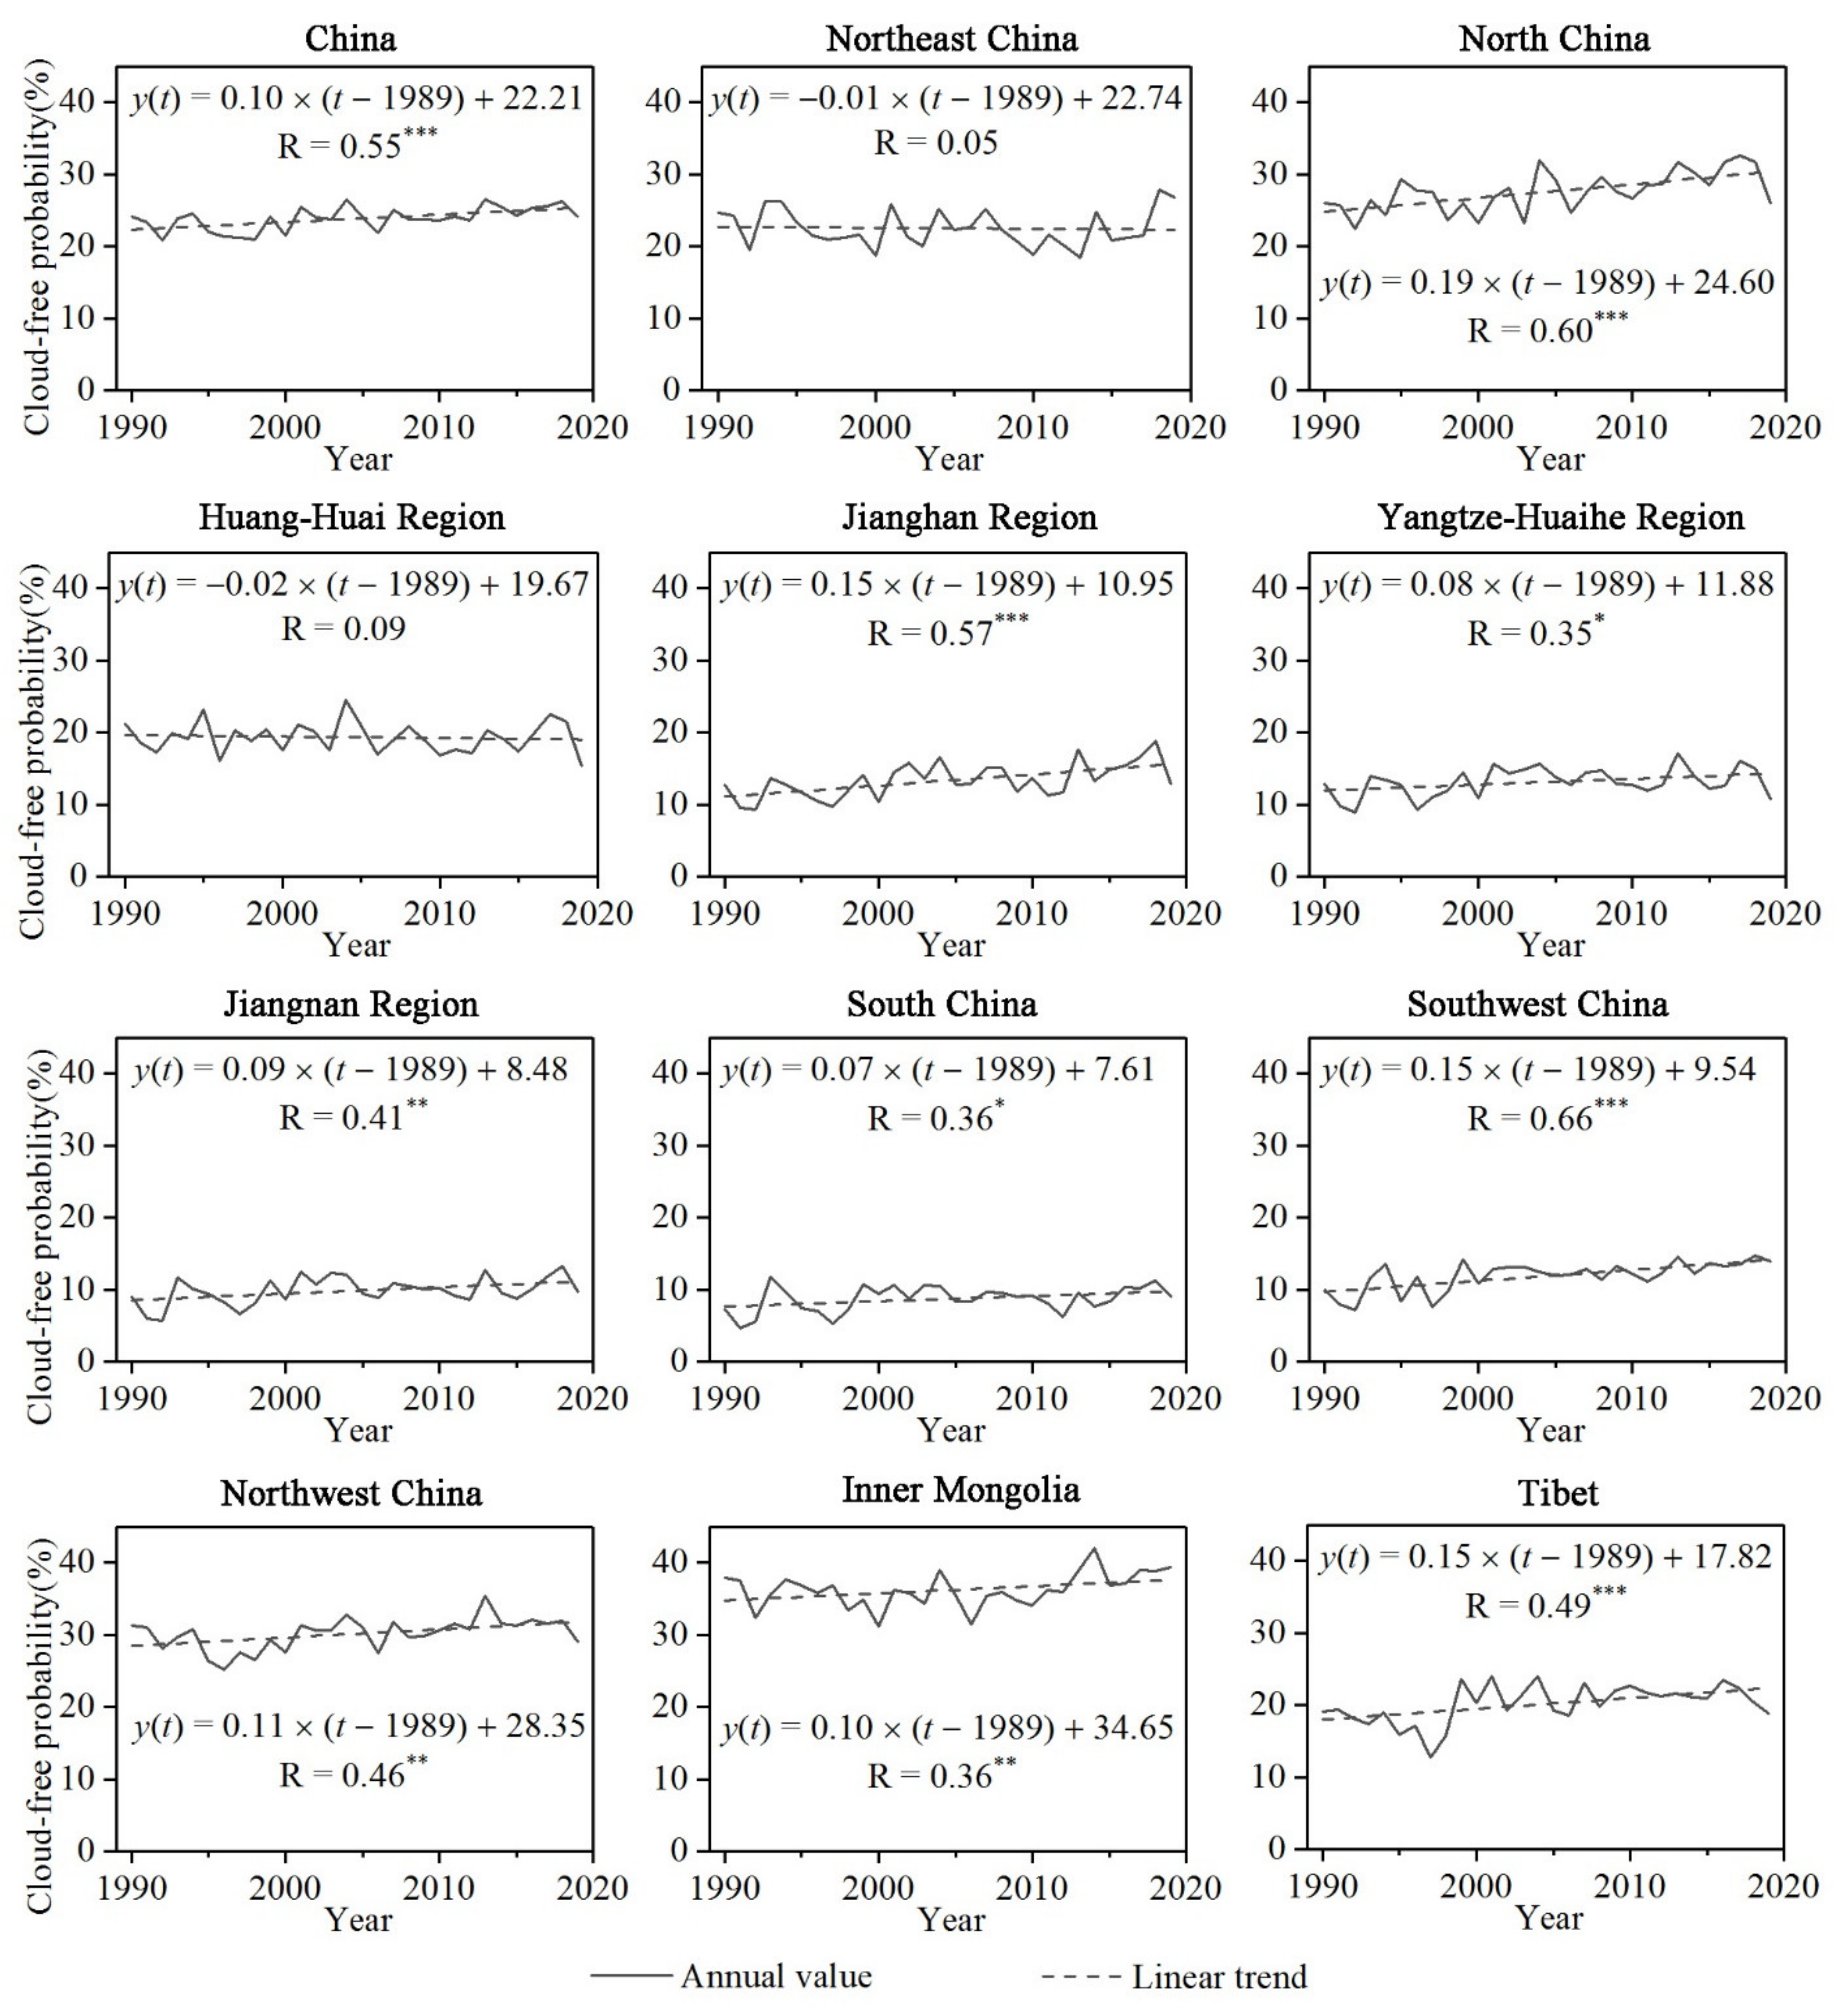
The linear relationship between the year and the PACI confirmed the general growing trends for the PACI in China (Figure 5). The national average annual PACI increased by 1% per decade, and the increase was significant. In regions other than HHR and NEC, a significant increase was recorded. The maximum growth rate was 1.9% per decade in NC, which was approximately twice the national rate. In NEC and HHR, slight downward trends were found, but the trends were not statistically significant. Notably, the PACI for XZ was extremely low in 1997. Furthermore, the increasing trend was positively correlated with the correlation coefficient (R) at the regional scale.

3.3. The Number of Days to Acquire Cloud-Free Imagery Monthly with Different Revisit Frequencies

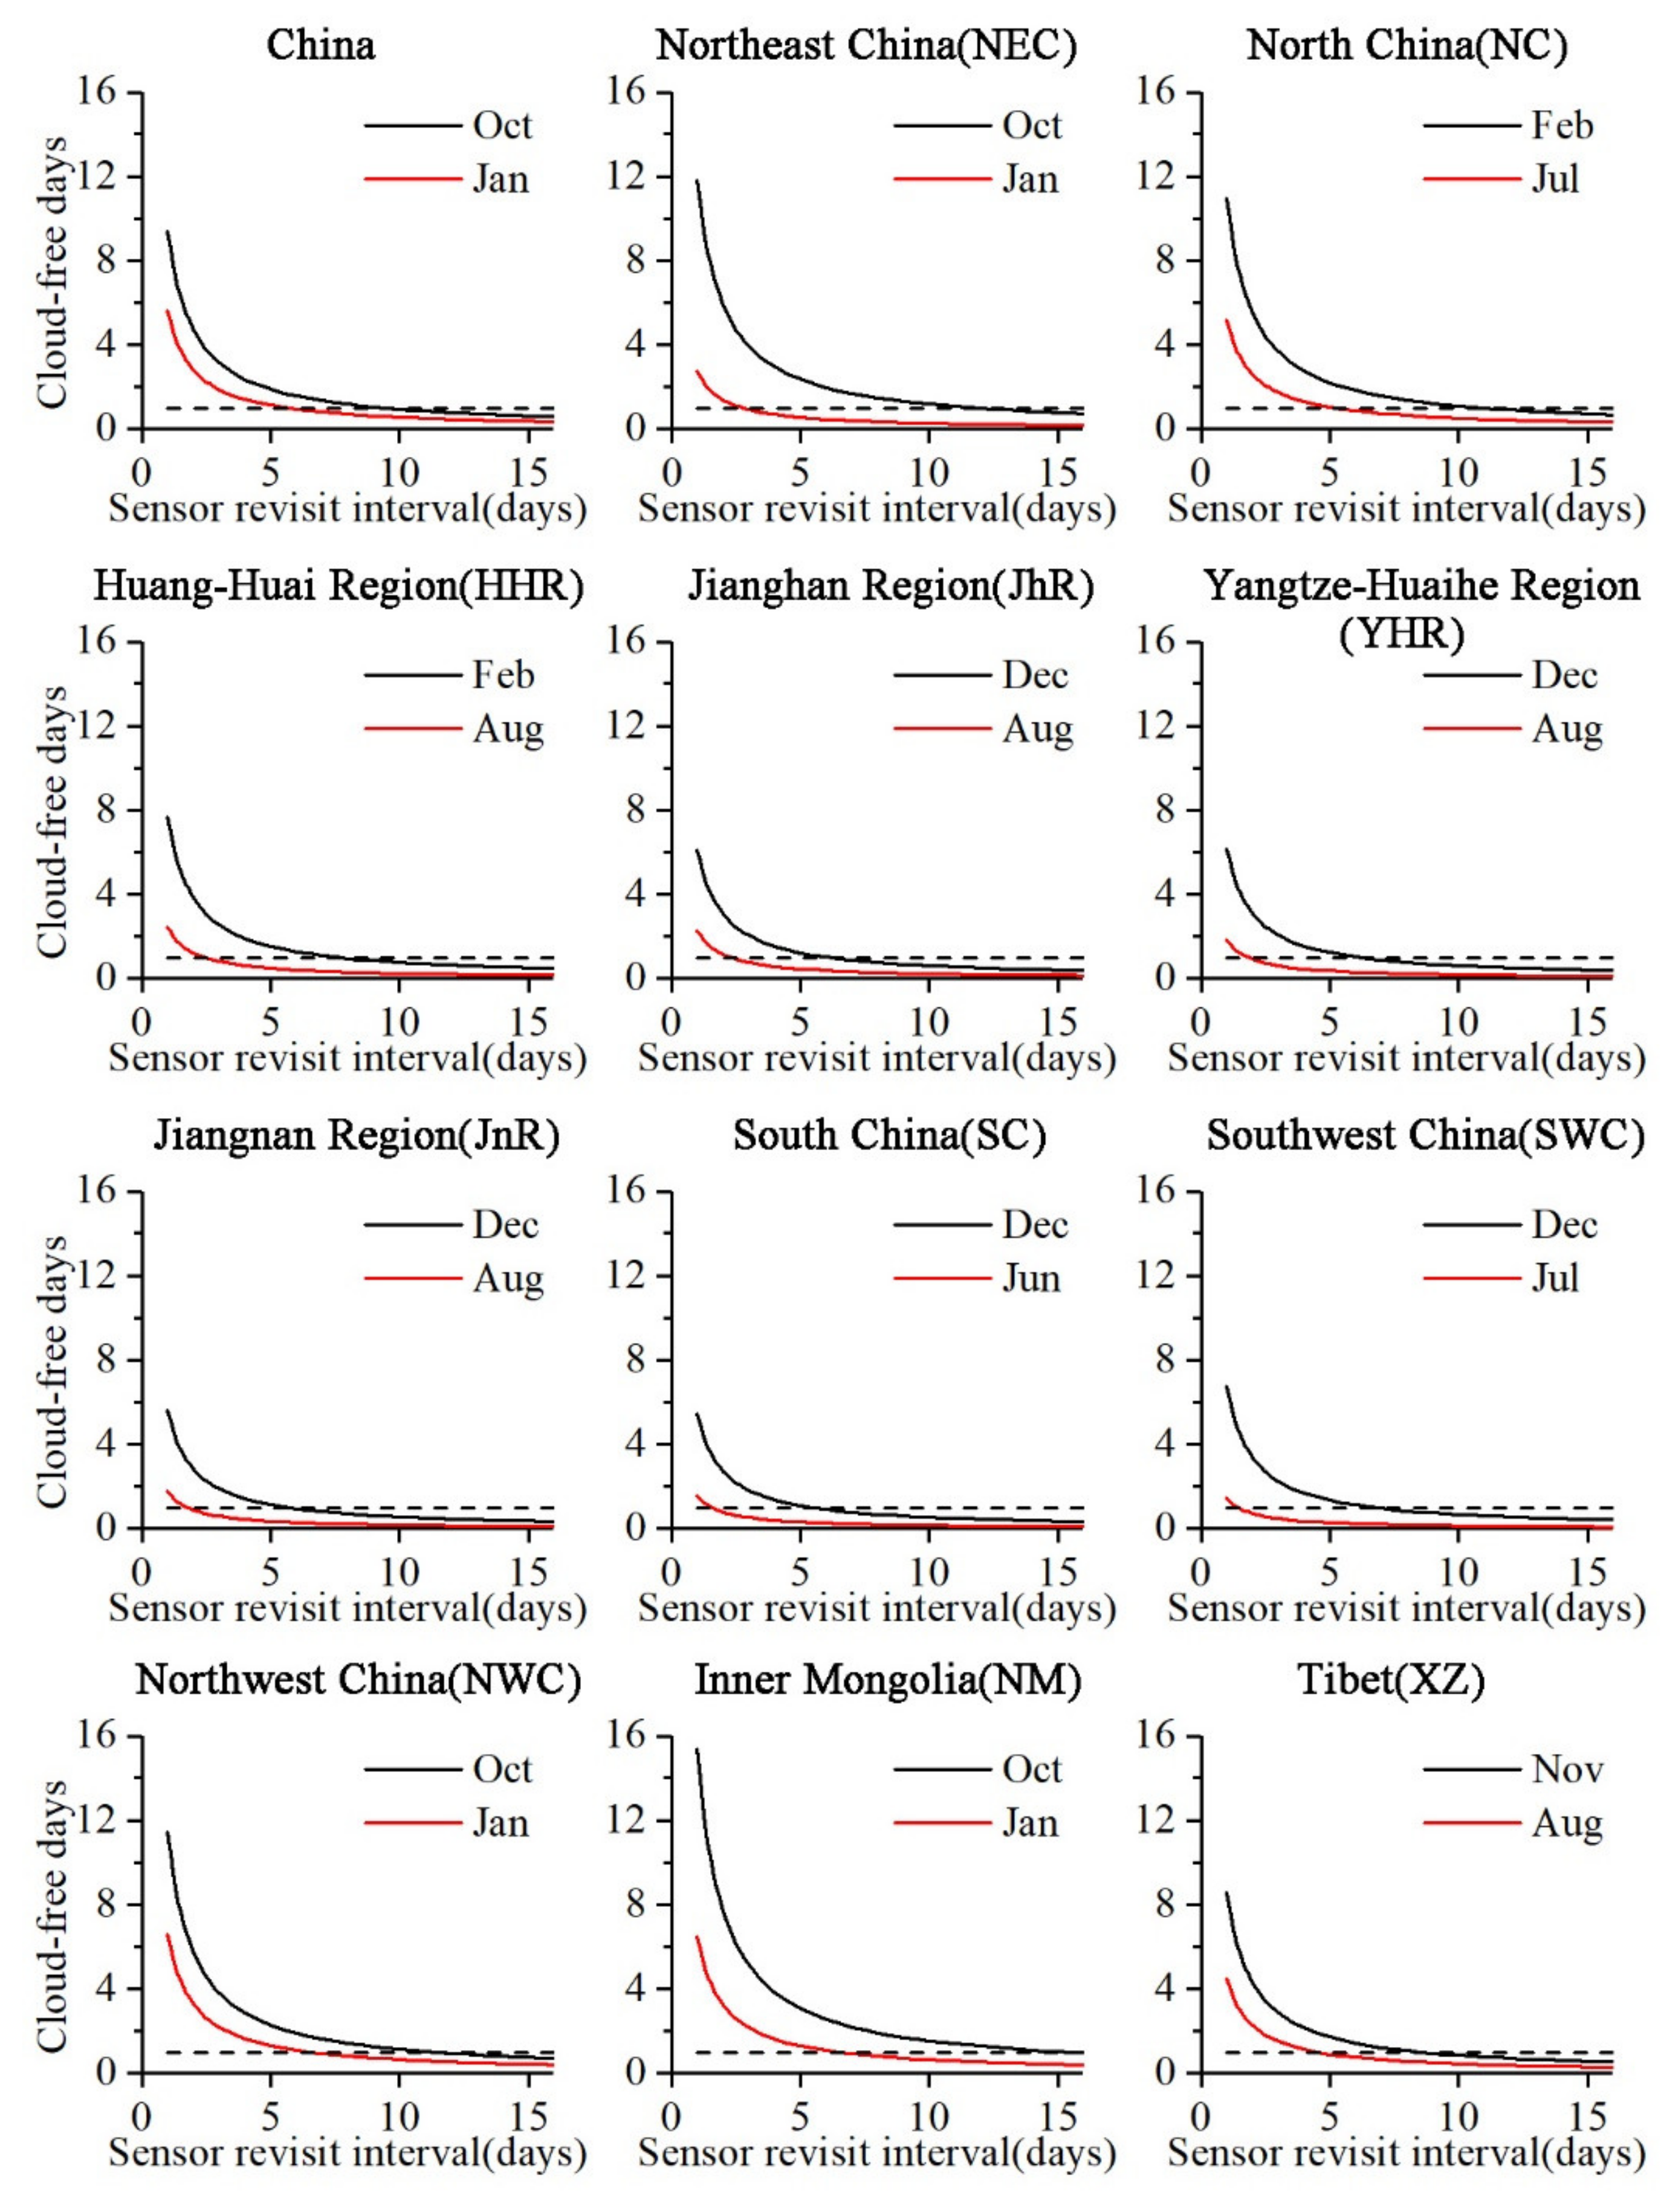
Using the algorithm described in Section 2.4.2, the number of days to acquire cloud-free imagery monthly was simulated at national and regional scales with a revisit interval ranging from 1 to 16 days, which represents the revisit capability of the most popular optical observation sensors currently available (Figure 6). The simulation revealed some general patterns in the availability of acquiring cloud-free imagery with different revisit intervals in regions: the number of cloud-free images decreased and the rate of decline decreased as the revisit interval increased.
For the entire country, in the month with the most availability (October), the 1-day revisit resulted in approximately nine cloud-free images each month, and when the revisit interval increased to 9 days, the number of cloud-free images dropped to about one. However, the best performance was about five or six cloud-free images per month in January (the least availability), and the number gradually approached one as the revisit interval increased to 5 days or more. These results also demonstrated that it was possible to acquire cloud-free imagery as the revisit interval increased to 10 days or even 15 days per month, with the largest opportunities in NEC, NC, NWC, NM and XZ. However, when the revisit interval increased to 3 days, there was no way to obtain cloud-free imagery in a month for the cloudy regions with the least availability (HHR, JhR, YHR, JnR, SC and SWC).

3.4. Validation

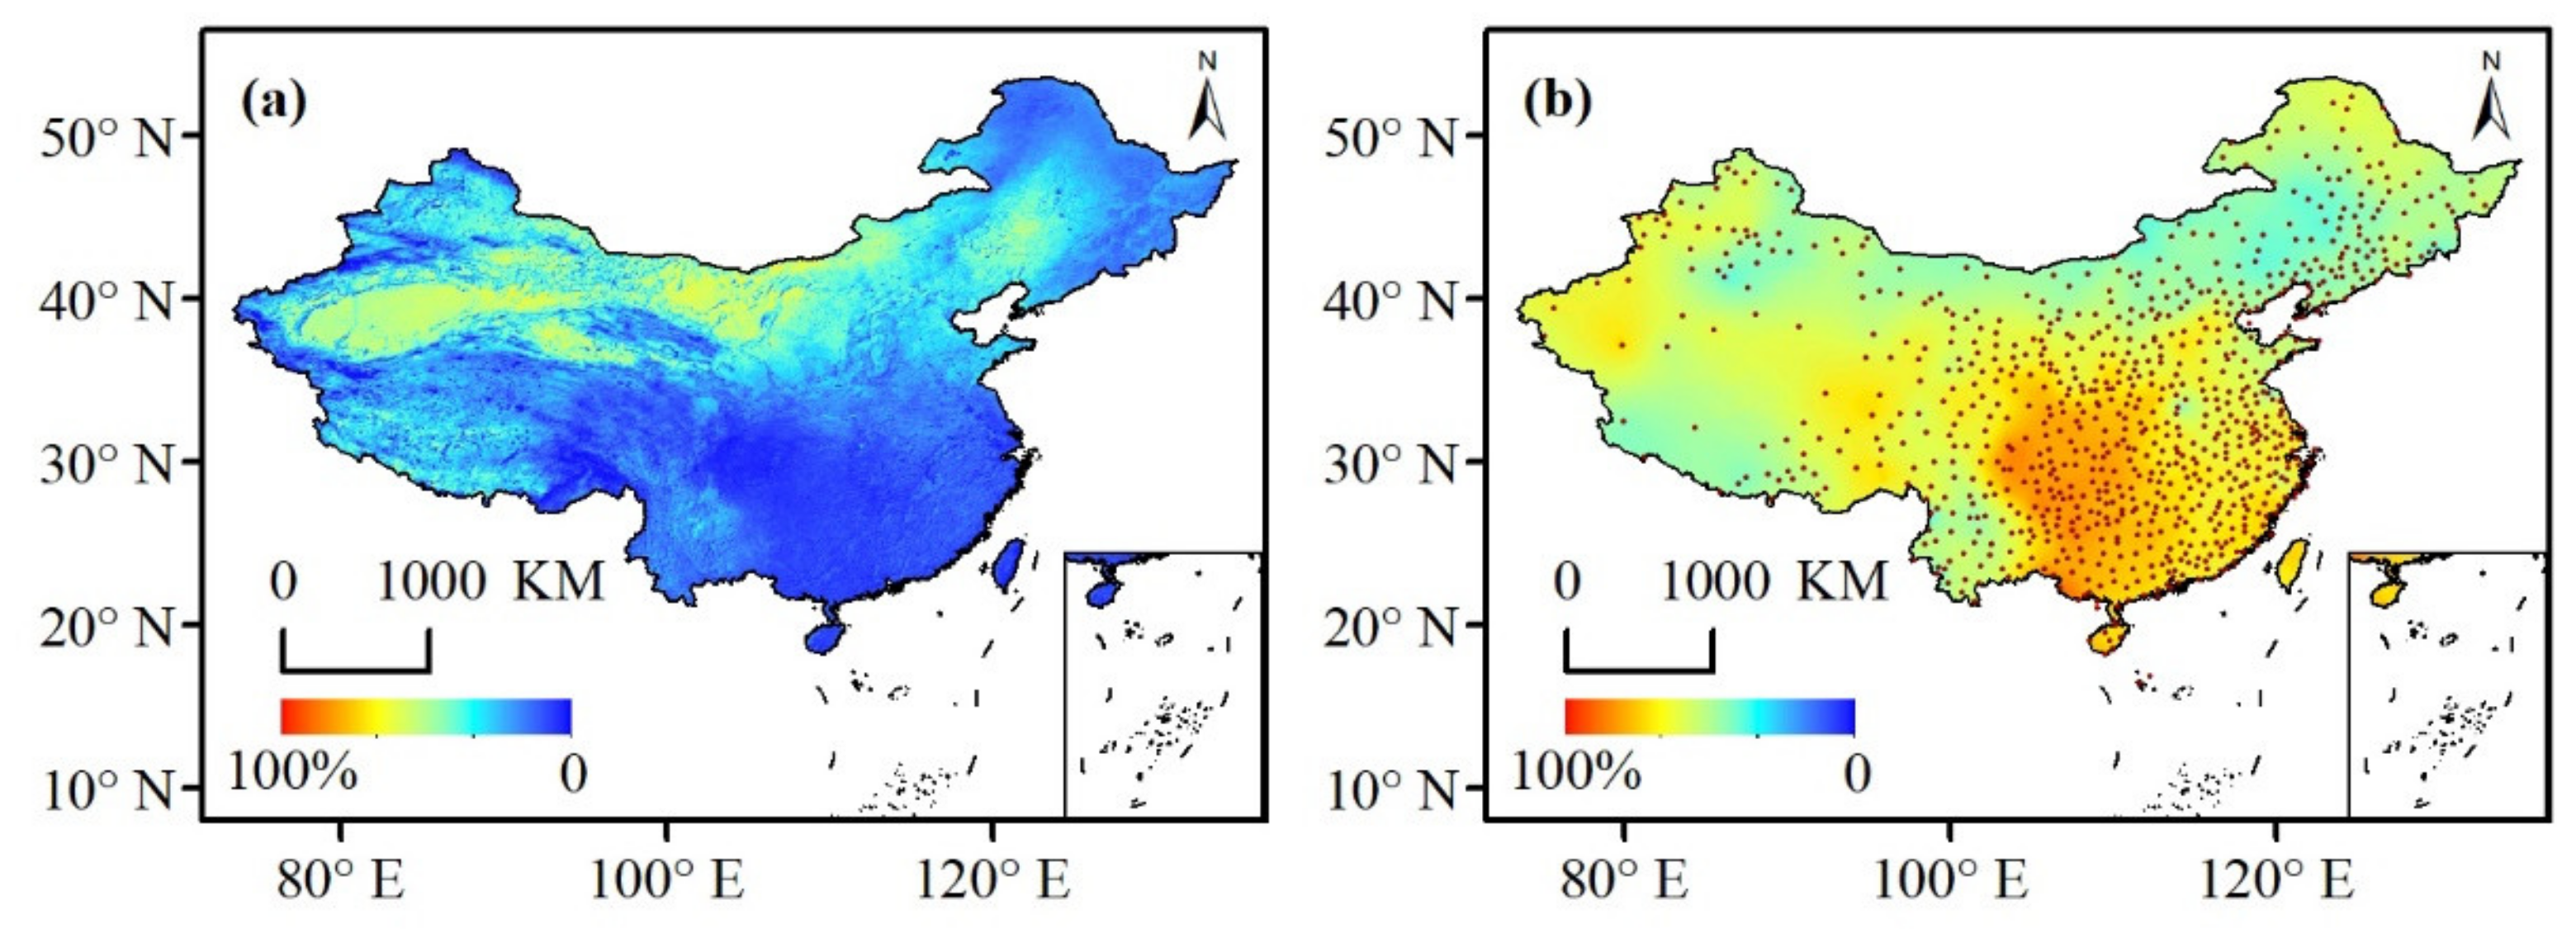
The spatial patterns of the annual average total cloud cover were opposite to those of the PACI (Figure 7). The northwest had a lower annual average total cloud cover and higher PACI than those of the southeast. The higher annual average total cloud cover rates were in JnR, SC and SWC, which is consistent with the distribution of the lower PACIs. The highest PACI and the lowest annual average total cloud cover occurred in NM.
The relationship between the PACI and the annual average total cloud cover was very close (Figure 8). Obviously, there was a good correlation between the two data sets, with a strong and significant negative correlation (R = 0.65, α < 0.01). The greater the PACI, the smaller the annual average total cloud cover became. Therefore, the results we calculated were reasonable.

4. Discussion

4.1. The PACI in China

The PACI is closely related to cloud cover. As an essential meteorological factor, cloud cover, in a similar manner to temperature and precipitation, is closely correlated to the regional climate. Therefore, the spatiotemporal characteristics of the PACI vary with the regional climate in China. Due to the monsoon’s influence, the cloud cover increased gradually from the eastern coast to the northwestern inland area. The results are similar to those discussed in previous studies [29,30]. There is a high degree of rainfall and low PACI in summer, while there is little rainfall and high PACI in autumn and winter [31].
Cloud formation always requires adequate water vapor in the atmosphere. The eastern coast of China is impacted by monsoons [32]. Because of the significant difference in temperature between the ocean and land, summer monsoons that blow from the ocean toward the land bring moist air inland, which is beneficial for cloud formation [32]. In contrast, winter monsoons blow from the land toward the sea, bringing drought. Therefore, for the eastern coast of China (NC, HHR, JhR, YHR, JnR and SC), the PACI was larger in winter and smaller in summer. Because the monsoon’s influence decreases from south to north, the PACI gradually increased [32]. Notably, the monthly variability of the PACI is not significant in JnR or SC, which may be affected by large-scale circulation [33].
The Sichuan Basin is the intersection of the southwesterly airflow and the northwesterly airflow. A southwest vortex is prone to form here, making it easier for clouds to develop [34]. Moreover, because of the many rivers in the Sichuan Basin, water vapor is sufficient. The topography of the basin is closed, and water vapor is not easily diffused. Therefore, the PACI was very low throughout the year, and the monthly variance in SWC reflected the variance in the Yunnan Province. Because of the Asian monsoon [35], most of the cloud cover for Yunnan occurs in summer.
The high mountains block atmospheric circulation, and the long distance to the surrounding oceans causes a dry climate in inland China [36], so insufficient water vapor is the crucial factor leading to the lowest cloud cover in NWC and NM [37]. Part of NM is influenced by summer monsoons, resulting in a smaller PACI in summer. NEC is located in the monsoon area, where the PACI is smaller in summer. In theory, due to climate change, there should be fewer clouds in winter in NWC and NM. However, our results showed the opposite to be the case, which may be due to the area’s topography [38]. This difference may also be caused by the recognition algorithm [39]. Because snow and clouds are difficult to separate, the recognition algorithm may present certain errors in winter.
When the Indian monsoon impacts the Tibetan Plateau, the relative humidity increases rapidly, as does the cloud coverage [33]. However, when the westerlies impact the plateau, the air is dry and the cloud coverage is low [33]. Therefore, the highest PACI of XZ occurred in winter.

4.2. Annual Variation of PACI

The standard deviation is a measure of the amount of variation or dispersion for a set of values. Therefore, the monthly interannual standard deviation can represent the interannual variability of the PACI. Based on the results, the PACI was more stable in summer and it was more likely to change in winter between different years.
Many studies have shown that the climate of China has changed significantly [40,41]. A negative trend for the time series of the total annual average cloud cover was derived from the station dataset [30,42], especially in north China [24]. In this context, a significant increase of the PACI throughout the country and most regions was found, and the largest increase occurred in NC (Figure 5).
The increase of the PACI in the NEC is related to global warming [43]. Over the last few decades, the land and ocean have experienced continuous and extensive warming. North America, Europe and the middle and high latitudes of Asia had the most significant temperature increases [43]. The temperature increase in the middle and high latitudes was greater than the equator and low latitudes. Therefore, the meridional temperature gradient was reduced, which weakened the strength of the meridional circulation. As a result, the cloud cover in the updraft area decreased, and the cloud cover in the sinking area increased [43].
Under the influence of El Niño, a strong warm event occurred over the South China Sea in 1997, which led to a stronger summer monsoon and weaker winter monsoon [44]. The Qinghai-Tibet Plateau is one of the most sensitive regions to global climate change [45], and so the lowest PACI was found in XZ in 1997.

4.3. The Number of Days to Acquire Cloud-Free Imagery Per Month with Different Revisit Frequencies

When determining the PACI for specific months, monthly days of acquisition are an inverse function of the sensor’s revisit interval. Therefore, as the sensor revisit interval increased, the number of days to acquire cloud-free imagery per month decreased and the decline rate decreased. Currently, many sensors observe land cover from space, which has advantages and disadvantages [21]. The number of days to acquire cloud-free imagery per month with different revisit frequencies is valuable for choosing the appropriate optical remote sensor in the study area and estimating the availability of composite images [15].
At the national level, to ensure that there is at least one cloud-free situation for each pixel within a month, the revisit frequency of the selected sensor must be less than 9 or even less than 5 days. The lowest opportunity to acquire cloud-free imagery occurs in January, when five or six daily images can be composited to one cloud-free image. The revisit frequency of Landsat is 16 days, which is suitable for regions with the highest PACI (NEC, NC, NWC, NM and XZ) for acquiring cloud-free imagery. It is difficult to obtain cloud-free images in cloudy regions (HHR, JhR, YHR, JnR, SC and SWC). In the month with the lowest PACI, it is possible to acquire no more than two cloud-free images in a month. Therefore, the availability of 16-day composite imagery is limited. If remote sensing is used for research, it is necessary to increase the time of acquisition or combine data from multiple sensors, or even replace the optical remote sensor with a synthetic aperture radar (SAR).

5. Conclusions

In this study, the PACI in China was calculated based on the daily AVHRR mask data. The results are crucial for choosing the appropriate study area, observation time and optical sensor. The analysis suggests the following main conclusions.
(1)
The PACI varied among months and regions in China, which was consistent with the spatiotemporal characteristics of the regional climate. The overall national performance of the PACI was best in November. For all of China, the PACI gradually increased from southeast to northwest.
(2)
As the climate changes, the PACI in China changes. The PACI increased significantly throughout the nation and in most regions. The highest increase in all regions throughout the entire multiannual period occurred in NC.
(3)
As the sensor revisit interval increased, the number of days to acquire cloud-free imagery monthly decreased and the decline rate decreased. The results are valuable for choosing the appropriate revisit frequency of optical remote sensors and estimating the availability of composite images.
Notably, the rules we set were strict regarding the calculation of the PACI. If the threshold of cloud coverage is changed, the PACI will increase. Therefore, when using the results of this study, it is necessary to pay attention to the threshold of cloud coverage. However, irrespective of the cloud coverage threshold, the patterns of the PACI in China are consistent with the results of this study. In the future, the PACI based on different cloud fractions can be calculated to obtain more detailed results.

Author Contributions

Conceptualization, Y.W. and S.F.; Data curation, Y.W.; Formal analysis, Y.W. and Y.X.; Funding acquisition, S.F.; Methodology, Y.W. and S.F.; Visualization, Y.W., Y.X., L.W. and Z.P.; Writing—original draft, Y.W.; Writing—review & editing, Y.W., S.F., Y.X., L.W., X.L., Z.P. and D.W. All authors have read and agreed to the published version of the manuscript.

Funding

This work was supported by the National Key Research and Development Program of China (Grant Number: 2019YFC1510205) and the Fundamental Research Fund (Grant Number: 2019Z010).

Institutional Review Board Statement

Not applicable.

Informed Consent Statement

Informed consent was obtained from all subjects involved in the study.

Conflicts of Interest

The authors declare no conflict of interest.

References

  1. Zhang, B. Current status and future prospects of remote sensing. Bull. Chin. Acad. Sci. 2017, 32, 774–784. [Google Scholar] [CrossRef]
  2. Deng, W.; Zhang, X.; Luo, J.; Peng, Y. South China Sea Environment Monitoring Using Remote Sensing Techniques. J. Coast. Res. 2020, 95, 29–33. [Google Scholar] [CrossRef]
  3. Wang, J.; Xiao, X.; Qin, Y.; Dong, J.; Zhang, G.; Kou, W.; Jin, C.; Zhou, Y.; Zhang, Y. Mapping paddy rice planting area in wheat-rice double-cropped areas through integration of Landsat-8 OLI, MODIS, and PALSAR images. Sci. Rep. 2015, 5, 10088. [Google Scholar] [CrossRef] [PubMed] [Green Version]
  4. Liu, P. A Survey of Remote-Sensing Big Data. Available online: https://www.frontiersin.org/articles/10.3389/fenvs.2015.00045/full (accessed on 3 February 2021).
  5. Marshall, G.J.; Dowdeswell, J.A.; Rees, W.G. The spatial and temporal effect of cloud cover on the acquisition of high quality Landsat imagery in the European Arctic sector. Remote Sens. Environ. 1994, 50, 149–160. [Google Scholar] [CrossRef]
  6. Sano, E.E.; Ferreira, L.G.; Asner, G.P.; Steinke, E.T. Spatial and temporal probabilities of obtaining cloud-free Landsat images over the Brazilian tropical savanna. Int. J. Remote Sens. 2007, 28, 2739–2752. [Google Scholar] [CrossRef]
  7. Zhu, Z.; Woodcock, C.E. Automated cloud, cloud shadow, and snow detection in multitemporal Landsat data: An algorithm designed specifically for monitoring land cover change. Remote Sens. Environ. 2014, 152, 217–234. [Google Scholar] [CrossRef]
  8. Whitcraft, A.K.; Vermote, E.F.; Becker-Reshef, I.; Justice, C.O. Cloud cover throughout the agricultural growing season: Impacts on passive optical earth observations. Remote Sens. Environ. 2015, 156, 438–447. [Google Scholar] [CrossRef]
  9. Norris, J.R.; Allen, R.J.; Evan, A.T.; Zelinka, M.D.; O’Dell, C.W.; Klein, S.A. Evidence for climate change in the satellite cloud record. Nature 2016, 536, 72–75. [Google Scholar] [CrossRef] [Green Version]
  10. Sanchez-Lorenzo, A.; Enriquez-Alonso, A.; Calbo, J.; Gonzalez, J.A.; Wild, M.; Folini, D.; Norris, J.R.; Vicente-Serrano, S.M. Fewer clouds in the Mediterranean: Consistency of observations and climate simulations. Sci. Rep. 2017, 7, 41475. [Google Scholar] [CrossRef]
  11. Armitage, R.P.; Alberto Ramirez, F.; Mark Danson, F.; Ogunbadewa, E.Y. Probability of cloud-free observation conditions across Great Britain estimated using MODIS cloud mask. Remote Sens. Lett. 2013, 4, 427–435. [Google Scholar] [CrossRef]
  12. Liu, L.; Xiang, D.; Dong, X.; Zhou, Z. Improvement of the Drought Monitoring Model Based on the Cloud Parameters Method and Remote Sensing Data. In Proceedings of the First International Workshop on Knowledge Discovery and Data Mining (WKDD 2008), Adelaide, Australia, 23–24 January 2008; pp. 293–296. [Google Scholar]
  13. Ju, J.; Roy, D.P. The availability of cloud-free Landsat ETM+ data over the conterminous United States and globally. Remote Sens. Environ. 2008, 112, 1196–1211. [Google Scholar] [CrossRef]
  14. Mao, K.; Yuan, Z.; Zuo, Z.; Xu, T.; Shen, X.; Gao, C. Changes in Global Cloud Cover Based on Remote Sensing Data from 2003 to 2012. Chin. Geogr. Sci. 2019, 29, 306–315. [Google Scholar] [CrossRef] [Green Version]
  15. Zhou, F.; Zhang, A. Methodology for estimating availability of cloud-free image composites: A case study for southern Canada. Int. J. Appl. Earth Obs. Geoinf. 2013, 21, 17–31. [Google Scholar] [CrossRef]
  16. Roy, D.P.; Lewis, P.; Schaaf, C.; Devadiga, S.; Boschetti, L. The Global Impact of Clouds on the Production of MODIS Bidirectional Reflectance Model-Based Composites for Terrestrial Monitoring. IEEE Geosci. Remote Sens. Lett. 2006, 3, 452–456. [Google Scholar] [CrossRef] [Green Version]
  17. Asner, G.P. Cloud cover in Landsat observations of the Brazilian Amazon. Int. J. Remote Sens. 2010, 22, 3855–3862. [Google Scholar] [CrossRef]
  18. Laborde, H.; Douzal, V.; Ruiz Piña, H.A.; Morand, S.; Cornu, J.-F. Landsat-8 cloud-free observations in wet tropical areas: A case study in South East Asia. Remote Sens. Lett. 2017, 8, 537–546. [Google Scholar] [CrossRef]
  19. Xiao, C.; Li, P.; Feng, Z.; Wu, X. Spatio-temporal differences in cloud cover of Landsat-8 OLI observations across China during 2013–2016. J. Geogr. Sci. 2018, 28, 429–444. [Google Scholar] [CrossRef] [Green Version]
  20. Li, P.; Feng, Z.; Xiao, C. Acquisition probability differences in cloud coverage of the available Landsat observations over mainland Southeast Asia from 1986 to 2015. Int. J. Digit. Earth 2017, 11, 437–450. [Google Scholar] [CrossRef]
  21. Naoyuki, F.; Yasumasa, H.; Yoshio, A.; Eriko, I.; Yoshiyuki, K.; Hideki, S.; Izumi, N. Spatial and Temporal Analysis of Probabilities for Acquiring Cloud-free Optical Sensor Images Using MODIS Cloud Mask Products 2000–2008 in Southeast Asia. J. For. Plan. 2014, 19, 43–51. [Google Scholar] [CrossRef]
  22. Wu, X.; Sullivan, J.T.; Heidinger, A.K. Operational calibration of the Advanced Very High Resolution Radiometer (AVHRR) visible and near-infrared channels. Can. J. Remote Sens. 2014, 36, 602–616. [Google Scholar] [CrossRef]
  23. Thomas, S.M.; Heidinger, A.K.; Pavolonis, M.J. Comparison of NOAA’s operational AVHRR-derived cloud amount to other satellite-derived cloud climatologies. J. Clim. 2004, 17, 4805–4822. [Google Scholar] [CrossRef]
  24. Qin, D.; Ding, Y.; Mu, M. Climate and Environmental Change in China: 1951–2012; Springer: Berlin, Germany, 2015. [Google Scholar]
  25. Guo, B.; Zhang, J.; Meng, X.; Xu, T.; Song, Y. Long-term spatio-temporal precipitation variations in China with precipitation surface interpolated by ANUSPLIN. Sci. Rep. 2020, 10, 81. [Google Scholar] [CrossRef] [PubMed]
  26. Zhai, P.; Sun, A.; Ren, F.; Liu, X.; Gao, B.; Zhang, Q. Changes of Climate Extremes in China. In Weather and Climate Extremes; Springer: Dordrecht, The Netherlands, 1999; pp. 203–218. [Google Scholar]
  27. Zhang, M.; An, J.; Zhang, J.; Yu, D.; Wang, J.; Lv, X. Enhanced Delaunay Triangulation Sea Ice Tracking Algorithm with Combining Feature Tracking and Pattern Matching. Remote Sens. 2020, 12, 581. [Google Scholar] [CrossRef] [Green Version]
  28. Shriner, J.F., Jr.; Mitchell, G.E.; Bilpuch, E.G. Significance levels of linear correlation coefficients. Nucl. Instrum. Methods Phys. Res. 1987, 254, 139–145. [Google Scholar] [CrossRef]
  29. Liu, H.; Zhu, W.; Yi, S.; Li, W.; Chen, L. Climate analysis of the cloud over China. Acta Meteorol. Sin. 2003, 61, 466–473. [Google Scholar] [CrossRef]
  30. Xia, X. Variability and trend of diurnal temperature range in China and their relationship to total cloud cover and sunshine duration. Ann. Geophys. 2013, 31, 795–804. [Google Scholar] [CrossRef] [Green Version]
  31. Frenken, K. Irrigation in Southern and Eastern Asia in Figures: AQUASTAT Survey-2011. Available online: http://www.fao.org/3/i2809e/i2809e.pdf (accessed on 3 February 2021).
  32. Fu, C.; He, J.; Jiang, Z.; Xu, Z.; Guan, Z. Regional Climate Studies of China; Springer Science & Business Media: Berlin, Germany, 2008. [Google Scholar]
  33. Li, Y.; Yu, R.; Xu, Y.; Zhang, X. Spatial distribution and seasonal variation of cloud over China based on ISCCP data and surface observations. J. Meteorol. Soc. Jpn. 2004, 82, 761–773. [Google Scholar] [CrossRef] [Green Version]
  34. Feng, X.; Liu, C.; Fan, G.; Liu, X.; Feng, C. Climatology and Structures of Southwest Vortices in the NCEP Climate Forecast System Reanalysis. J. Clim. 2016, 29, 7675–7701. [Google Scholar] [CrossRef]
  35. Gu, Z.; Duan, X.; Liu, B.; Hu, J.; He, J. The spatial distribution and temporal variation of rainfall erosivity in the Yunnan Plateau, Southwest China: 1960–2012. Catena 2016, 145, 291–300. [Google Scholar] [CrossRef]
  36. Shi, Y.; Shen, Y.; Kang, E.; Li, D.; Ding, Y.; Zhang, G.; Hu, R. Recent and Future Climate Change in Northwest China. Clim. Chang. 2006, 80, 379–393. [Google Scholar] [CrossRef]
  37. Yang, Y.; Zhao, C.; Fan, H. Spatiotemporal distributions of cloud properties over China based on Himawari-8 advanced Himawari imager data. Atmos. Res. 2020, 240, 104927. [Google Scholar] [CrossRef]
  38. Wu, W.; Wang, S. Tendency Change of Cloud Cover over Northern China and Its Relation with Regional Climate. Plateau Meteorol. 2011, 30, 651–658. [Google Scholar]
  39. Stowe, L.L.; Davis, P.A.; McClain, E.P. Scientific basis and initial evaluation of the CLAVR-1 global clear/cloud classification algorithm for the Advanced Very High Resolution Radiometer. J. Atmos. Ocean. Technol. 1999, 16, 656–681. [Google Scholar] [CrossRef]
  40. Ren, G.; Ding, Y.; Zhao, Z.; Zheng, J.; Wu, T.; Tang, G.; Xu, Y. Recent progress in studies of climate change in China. Adv. Atmos. Sci. 2012, 29, 958–977. [Google Scholar] [CrossRef]
  41. Xu, Z.; Tang, Y.; Connor, T.; Li, D.; Li, Y.; Liu, J. Climate variability and trends at a national scale. Sci. Rep. 2017, 7, 3258. [Google Scholar] [CrossRef] [PubMed]
  42. Zong, X.-M.; Pu-Ca, W.; Xiang-Ao, X. Variability and long-term trend of total cloud cover in China derived from ISCCP, ERA-40, CRU3, and ground station datasets. Atmos. Ocean. Sci. Lett. 2013, 6, 133–137. [Google Scholar] [CrossRef]
  43. Ding, S.; Zhao, C.; Shi, G.; Wu, C. Analysis of global total cloud amount variation over the past 20 years. Q. J. Appl. Meteorol. 2005, 16, 670–677. [Google Scholar]
  44. Wang, D.; Xie, Q.; Du, Y.; Wang, W.; Chen, J. The 1997–1998 warm event in the South China Sea. Chin. Sci. Bull. 2002, 47, 1221–1227. [Google Scholar] [CrossRef]
  45. Wang, S.; Guo, L.; He, B.; lyu, Y.; Li, T. The stability of Qinghai-Tibet Plateau ecosystem to climate change. Phys. Chem. Earth 2020, 115, 102827. [Google Scholar] [CrossRef]
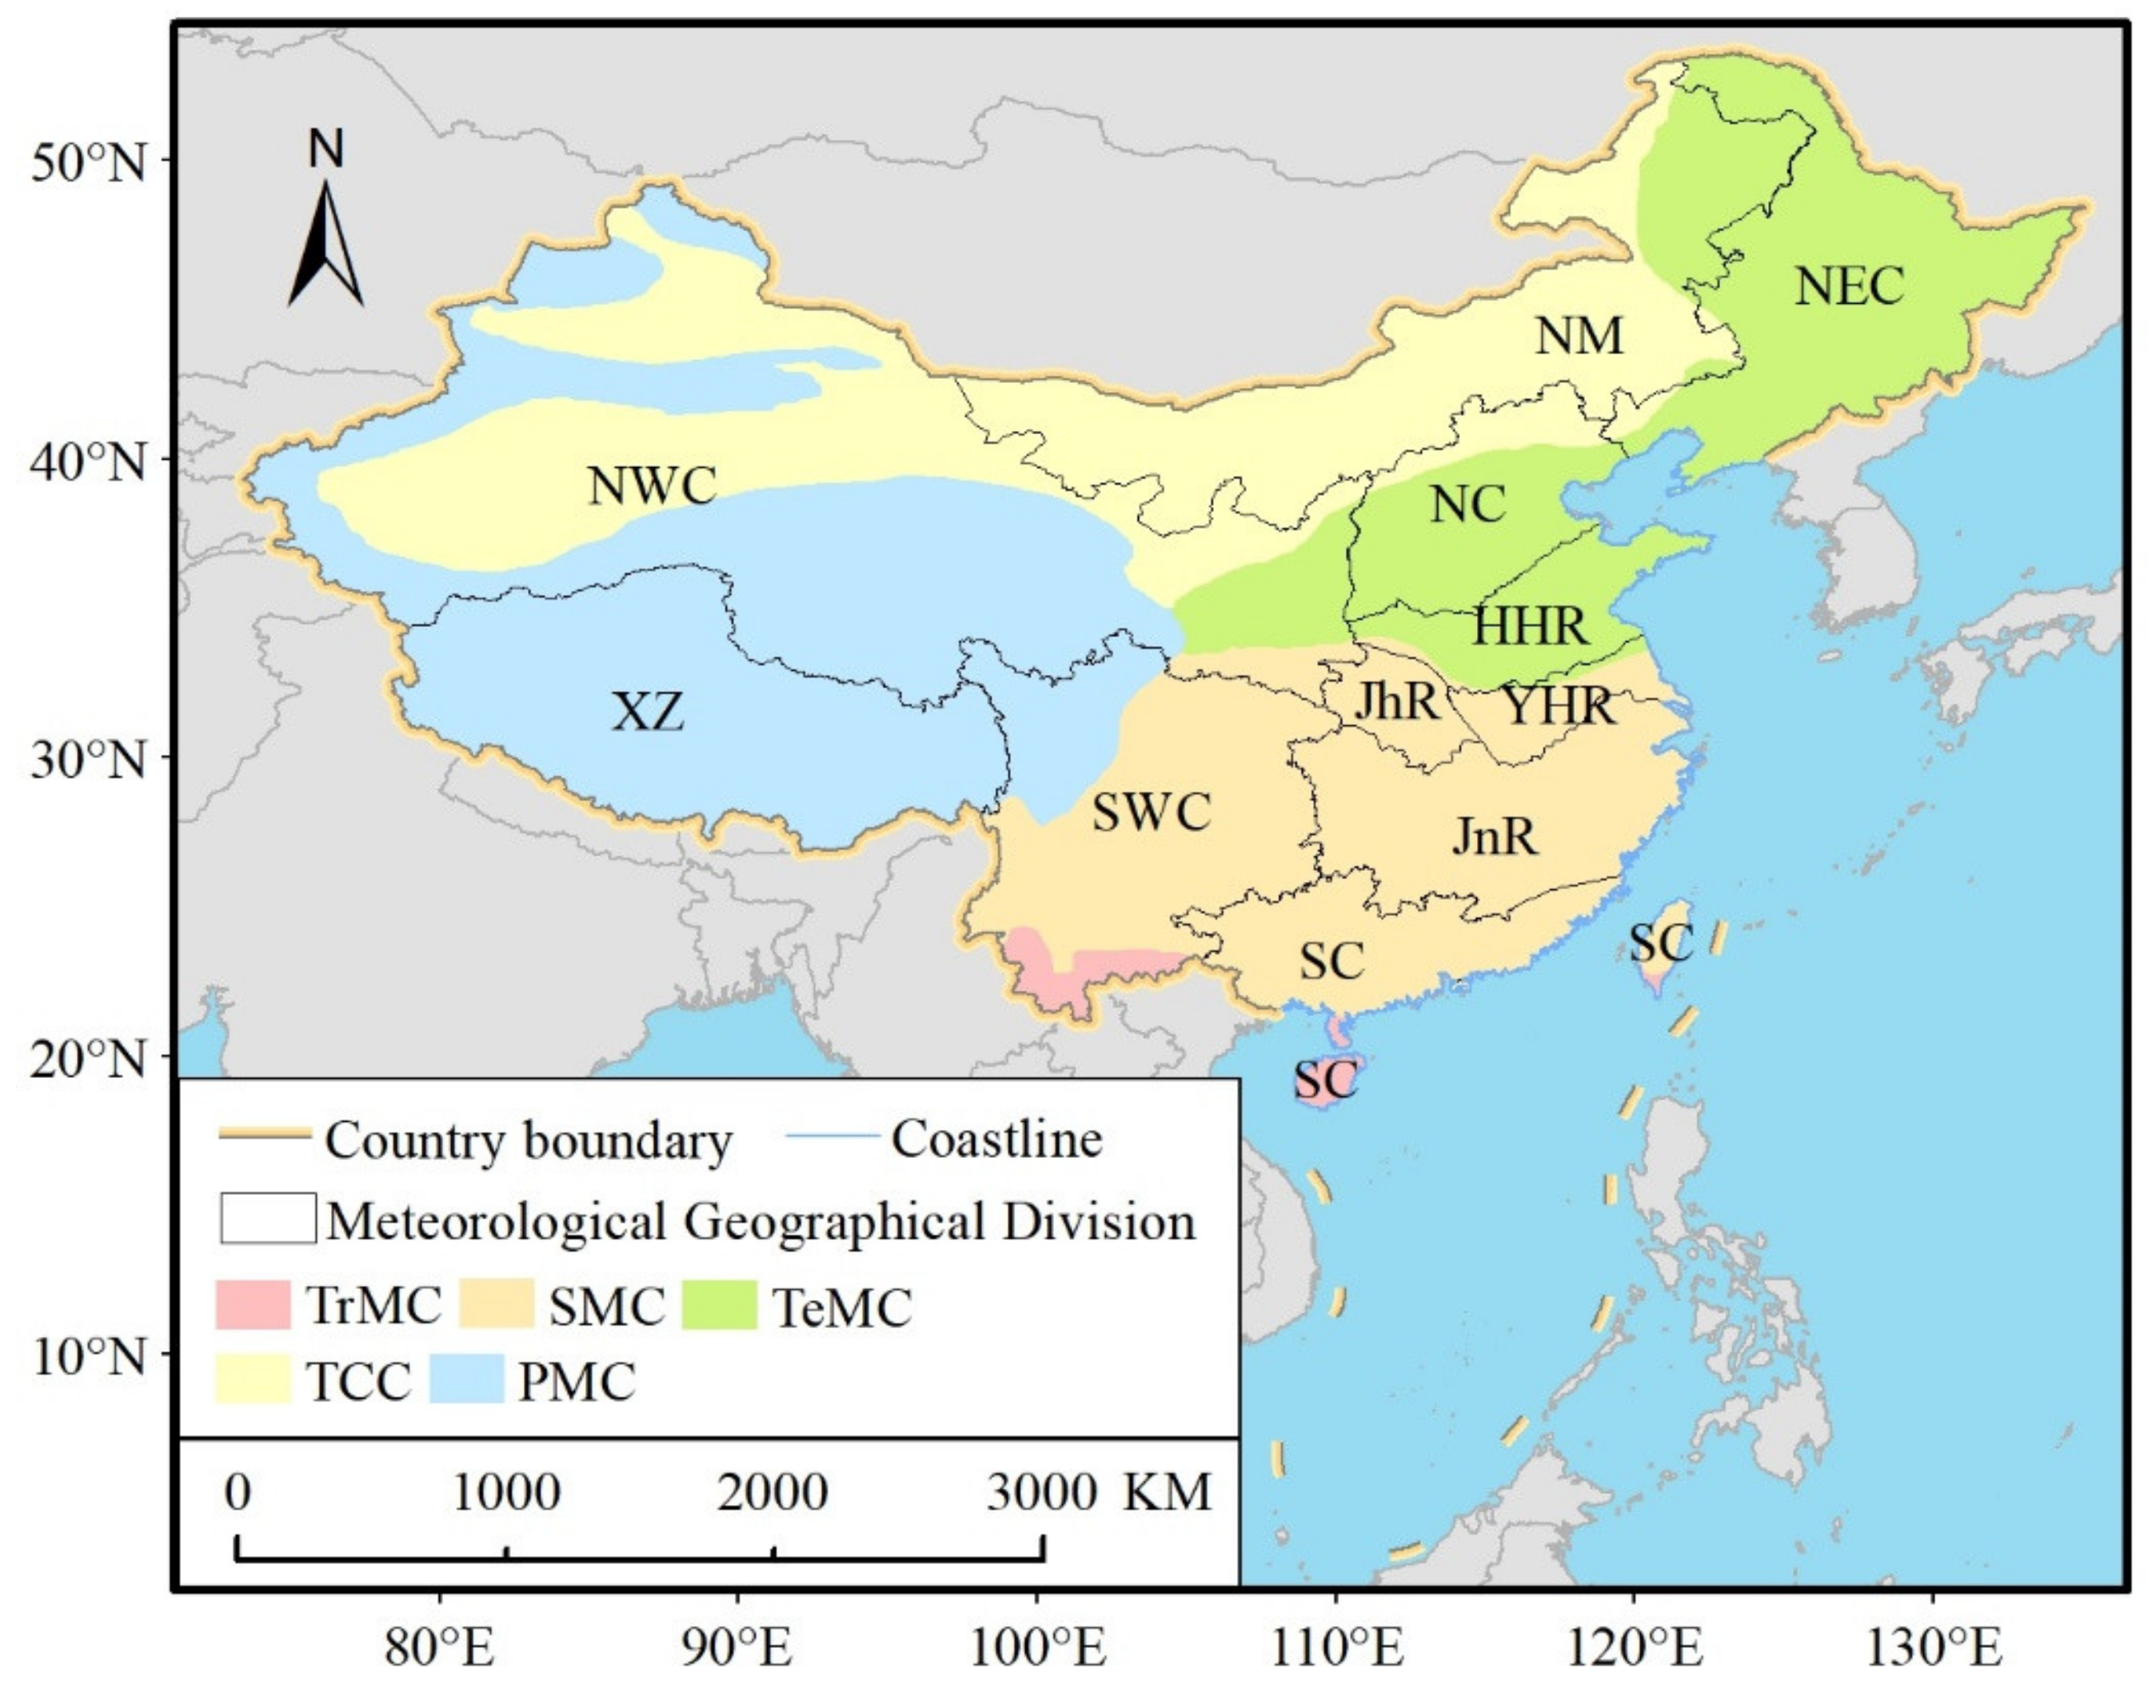
Figure 1. Map showing the location of China, climate types in China (TrMC: Tropical Monsoon Climate; SMC: Subtropical Monsoon Climate; TeMC: Temperate Monsoon Climate; TCC: Temperate Continental Climate; PMC: Plateau Mountain Climate), and Meteorological Geographical Division in China (NEC: Northeast China; NC: North China; HHR: Huang-Huai Region; JhR: Jianghan Region; YHR: Yangtze-Huaihe Region; JnR: Jiangnan Region; SC: South China; SWC: Southwest China; NWC: Northwest China; NM: Inner Mongolia; XZ: Tibet).
Atmosphere 12 00214 g001
Figure 2. The monthly probability of acquiring cloud-free imagery in China (statistics based on the data from 1990 to 2019).
Atmosphere 12 00214 g002
Figure 3. The monthly variations in the probability of acquiring cloud-free imagery throughout the regions.
Atmosphere 12 00214 g003
Figure 4. Standard deviations for the monthly probability of acquiring cloud-free imagery from 1990 to 2019.
Atmosphere 12 00214 g004
Figure 5. Annual time series for the probability of acquiring cloud-free imagery throughout the country and regions from 1990 to 2019. *** means that R is significant when the significance level α is set to 0.01; ** means that R is significant when the significance level α is set to 0.05; * means that R is significant when the significance level α is set to 0.1.
Atmosphere 12 00214 g005
Figure 6. The number of days to acquire cloud-free imagery per month with different revisit frequencies throughout the country and regions. The dashed line indicates that the number of cloud-free days is 1.
Atmosphere 12 00214 g006
Figure 7. (a) The probability of acquiring cloud-free imagery in China. (b) The annual average total cloud cover with weather stations in China.
Atmosphere 12 00214 g007
Figure 8. The relationship between the probability of acquiring cloud-free imagery with the annual average total cloud cover. *** means that R is significant when the significance level α was set to 0.01.
Atmosphere 12 00214 g008
Publisher’s Note: MDPI stays neutral with regard to jurisdictional claims in published maps and institutional affiliations.